 Narges Aghaallaei
 Baubak Bajoghli
- Department of Hematology, Oncology, Immunology, Rheumatology and Pulmonology, University Hospital, University of Tübingen, Tübingen, Germany
T-cell development is coupled with a highly ordered migratory pattern. Lymphoid progenitors must follow a precise journey; starting from the hematopoietic tissue, they move toward the thymus and then migrate into and out of distinct thymic microenvironments, where they receive signals and cues required for their differentiation into naïve T-cells. Knowing where, when, and how these cells make directional “decisions” is key to understanding T-cell development. Such insights can be gained by directly observing developing T-cells within their environment under various conditions and following specific experimental manipulations. In the last decade, several model systems have been developed to address temporal and spatial aspects of T-cell development using imaging approaches. In this perspective article, we discuss the advantages and limitations of these systems and highlight a particularly powerful in vivo model that has been recently established. This model system enables the migratory behavior of all thymocytes to be studied simultaneously in a noninvasive and quantitative manner, making it possible to perform systems-level studies that reveal fundamental principles governing T-cell dynamics during development and in disease.
Introduction
T-cell development encompasses two major migratory phases. First, in a process called thymus homing, lymphoid progenitors originating from hematopoietic sites migrate toward the thymus. Upon entry, progenitors, termed thymocytes, then migrate into distinct microenvironments and interact with thymic epithelial cells (TECs) and other non-lymphoid cells to differentiate into distinct T-cell subsets. The thymus also provides a specialized microenvironment for the selection of functional and self-tolerant T-cells. Several studies have revealed that thymic T-cell development is coupled with a highly ordered migratory pattern, called intrathymic cell migration (1–4). Both homing to the thymus and migration into distinct thymic microenvironments are tightly regulated by members of the chemokine superfamily (5–12). Chemokines are the primary proteins involved in environmental sensing and guided cell migration in many biological processes (13–16). In the thymus, TECs and other thymic resident cells, including dendritic cells (DCs), produce multiple chemokines (17). In turn, thymocytes at different developmental stages respond to these chemokines through expression of chemokine receptors. It has been shown that localization of thymocytes to a given thymic microenvironment is impeded if these cells lack a specific chemokine receptor (6, 10, 18–22). Although, these studies have greatly enhanced our current knowledge of molecular mechanisms underlying intrathymic thymocyte positioning, they have yielded only limited information regarding how cell-intrinsic mechanisms and extrinsic cues regulate thymocyte migratory behavior. The high degree of redundancy in the chemokine superfamily (i.e., several chemokine receptors can bind different chemokines and vice versa) and the complex chemotactic milieu of the murine thymus (4, 23) make studying thymocyte intrathymic cell trafficking challenging. It is, therefore, still not fully understood how thymocytes make directional “decisions” within distinct thymic environments and how thymocyte migratory behavior is linked to the T-cell differentiation program. Answers to these and many other fundamental questions will aid in our understanding of how T-cell development is regulated.
In this perspective article, we discuss advantages and limitations of model systems that have been established to study spatial and temporal aspects of T-cell development using imaging techniques. We then highlight a recently established transgenic fish model that allows the study of T-cell dynamics at organ, cellular, and subcellular levels.
Visualizing Thymocyte Dynamics in Mouse Models
Imaging technology has undergone dramatic advances. It is now possible to visualize T-cell migratory behavior within secondary lymphoid tissues in live mouse models (24–28). In this setting, two-photon laser-scanning microscopy (2P microscopy) is the method of choice, because it provides large depth penetration—up to hundreds of micrometers (25). However, the murine thymus is inaccessible to 2P microscopy. This limitation can be circumvented by transplanting the thymus under the kidney capsule (29). Although, the transplanted thymus provides better access for imaging, an important consideration is that this approach requires complicated surgical procedures. Changes in parameters such as body temperature or oxygenation during the imaging procedure could also strongly influence motility parameters. Moreover, imaging of deep areas inside the thymus such as the thymic medullary region, where thymocytes undergo thymic selection, is still very technically demanding.
A widely used strategy to capture thymocyte dynamics is ex vivo imaging of thymic slices (30–32). In this method, fluorescently labeled thymocytes are overlaid atop vibratome-cut thymic slices several hours prior to imaging to allow these cells to migrate into their final locations (33). Thymocytes can then be monitored for a short period of time using 2P microscopy (32–34). The operating assumption providing the supporting rationale for this approach is that the structural integrity of thymic explants is maintained. One caveat is that the cytokine and chemokine milieu in thymic slices may not reflect the tissue environment that exists in live animals. Thus, the cellular behavior observed in tissue explants may not closely mimic the behavior of cells in a living organism.
Long-Term In Vivo Imaging in Fish Permits the Study of Homing to the Thymus
The teleost fishes, zebrafish (Danio rerio) and medaka (Oryzias latipes), offer a number of attractive features for studying T-cell development (9, 35–38). Forward and reverse genetic approaches have been applied to characterize mechanisms underlying T-cell development in these model organisms (38–40). Apart from their strength as genetic model systems, the most important advantage of these fish is the optical access they provide. Both zebrafish and medaka embryos are transparent, offering an opportunity to directly monitor T-cell development. A range of transgenic fluorescence-based reporter lines have been developed to visualize lymphoid progenitors (41, 42), thymocyte subsets (41–45), naïve T-cells (42, 46), DCs (47), and TECs (43) in both model systems. Most of these transgenic lines carry a construct in which the expression of a fluorescent protein is under the control of cis-regulatory elements of a cell-specific gene. Alternatively, a fluorescent protein can be integrated into a gene locus using the CRISPR/Cas9 technique. We recently used this method to introduce green fluorescent protein (GFP) directly into the autoimmune regulatory (aire) gene locus to visualize the thymic medullary region in juvenile medaka (42). In fish models, fluorescent-based reporter lines have two advantages. First, they allow cells that express the gene of interest to be visualized by in vivo imaging. Second, they allow cells that express the fluorescent protein to be isolated using fluorescence-activated cell sorting for further characterization. This latter capability has the benefit of circumventing the lack of antibodies for T-cell surface markers in fish.
The small body size of fish larvae offers the opportunity to monitor cell trafficking at the whole-organism level using laser-scanning confocal (48) or light-sheet fluorescence microscopy (42). In vivo imaging of zebrafish and medaka larvae is generally noninvasive and can be continued for more than 10 h (41, 43, 49). Hence, in vivo imaging of transgenic zebrafish is a powerful model system for directly studying the mechanisms underlying thymus colonization by lymphoid progenitors. These studies have provided the first evidence that chemokines cooperatively regulate the migration of lymphoid progenitors toward the thymus (41). Long-term in vivo imaging studies have revealed that lymphoid progenitors migrate through the mesenchyme in a straight path toward the thymus (42, 43, 49). The average cell speed of thymic immigrants is ~4-fold higher than that of thymocytes located in the thymic cortical region; however, their speed drops considerably once they enter the thymic area (42). This migratory behavior is characteristic of chemotaxis, which triggers directed cell migration (13). Evidence that emerged from our study showed that simultaneous downregulation of two chemokines, Ccl25a and Cxcl12a, impedes homing to the embryonic thymus (41). Ccl25a is the only chemokine expressed in the epithelial compartment of the embryonic thymus, and Cxcl12a is expressed in cells located in the thymic periphery (41, 43). These non-overlapping expression patterns suggest that these two chemokines have non-redundant functions in guiding progenitors to the thymus. Cxcl12a is involved in transiently orienting cells toward the vicinity of the thymus, whereas Ccl25a provides the final attractive cue (43). Lymphoid precursors respond to Ccl25a and Cxcl12a through the chemokine receptors Ccr9a and Cxcr4a, respectively. Similarly, in mice, the receptor Ccr9 and its sole ligand Ccl25 are the most important factors for homing to the thymus (50–52). But this process fails in mice only when lymphoid progenitors simultaneously lack three chemokine receptors: Ccr9, Cxcr4, and Ccr7 (50). Interestingly, Ccr7 is not expressed in the medaka embryonic thymus (41, 47), while later it is expressed in the adult thymus (4 weeks post-fertilization) as revealed by RNA in situ hybridization (unpublished data). To what extent Ccr7 might play a role in homing to the adult thymus remains to be elusive. Overall, these studies have revealed an evolutionary functional conservation of chemokines and chemokine receptors in guiding lymphoid progenitors to settle in the thymus (9).
In Toto Imaging of the Thymus in Fish Models Allows Systems-Level Studies
Our current view of thymocyte population dynamics has been assembled from results obtained using several experimental systems. However, the fact that gathered data originate through various methods makes it difficult to combine them into a single model that accounts for quantitative aspects of cellular behavior. Noninvasive live imaging of the entire organ would certainly contribute to a better understanding of the relationship between cell-intrinsic mechanisms and extrinsic forces that influence thymocyte trafficking. Fish models provide such a possibility. We have recently shown that the thymus in transgenic medaka juveniles (10–12 days post-fertilization) possesses the best properties for studying thymocyte population dynamics. At this age, the thymus contains up to 103 thymocytes and is composed of an outer region known as the cortex, which contains cells undergoing somatic recombination, and an inner region known as the medulla, which contains mature thymocytes undergoing negative selection (42). Time-lapse in vivo imaging of the entire thymus area—the so-called “in toto imaging”—makes it possible to determine the migratory behavior of all cells that traffic into and out of the thymus, as well as all cells that move within distinct thymic microenvironments. Therefore, in toto imaging of the thymus enables comparisons of cellular behaviors in different T-cell developmental contexts in a single time-lapse recording (42). The next step is the implementation of fluorescent-based reporters in this model system to elucidate core subcellular processes, such as signal transduction, transcription, protein activity, protein–protein interactions, and cytoskeletal machinery dynamics. This strategy may offer a way to transition from profiling cellular behavior to a systems-level view of the molecular principles that govern cell migration and interaction during T-cell development. Some examples of this are shown in Figure 1. Furthermore, high-content, multicolor imaging, with its high spatiotemporal resolution, has the power to support development of computational models that are close to biological reality. This opens up the possibility of predicting how changes in molecular parameters influence the migratory patterns of thymocytes. In the next two sections, we highlight how two specific topics in T-cell development—thymocyte population trafficking and thymic selection—can be addressed using in toto imaging of medaka transgenic models.
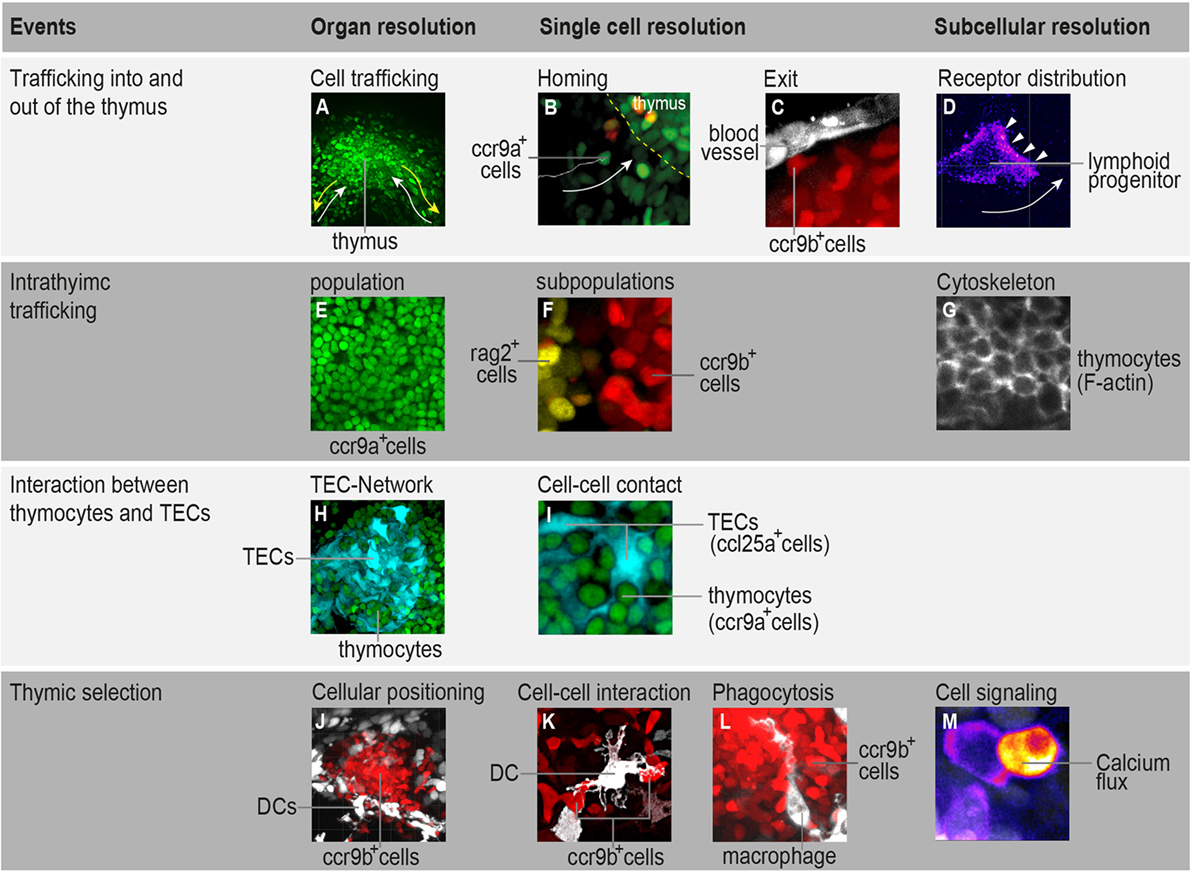
Figure 1. Highlighting the possibilities that in toto imaging of transgenic medaka fish can provide in studying spatial and temporal aspects of T-cell development. (A) Three-dimensional rendering of a thymus illustrating the trafficking of ccr9a-expressing cells (green) in the extrathymic region. White arrows indicate migration paths of thymus colonization. Yellow arrows indicate emigration paths of cells into the periphery. (B) Still photograph from a time-lapse recording illustrating the migration of ccr9a-expressing cells (green) into the thymus. Yellow dashed lines demarcate the ventral side of the thymus (z = 1 µm). (C) Still photograph from a time-lapse recording illustrating the migration of ccr9b-expressing mature thymocytes (red) toward a blood vessel (white). (D) Still photograph from a time-lapse recording illustrating the migration of a lymphoid progenitor toward the thymus. Note that thymocytes carry a green fluorescent protein (GFP) reporter fused to the Ccr9a chemokine receptor. Arrowheads indicate the accumulation of Ccr9a-GFP protein at the leading edge of the cell. Fluorescence signals are shown as a heat map. (E) One frame (z = 1 µm) from a Z-stack spanning the entire thymus (A) showing that the resolution of in toto imaging permits single thymocytes within the thymus to be distinguished. (F) One frame (z = 1 µm) from a Z-stack spanning the entire thymus illustrating the positioning of rag2-expressing thymocytes (yellow) in the cortex and ccr9b-expressing mature thymocytes (red) in the thymic medullary region. (G) One frame (z = 1 µm) from a Z-stack spanning the entire thymus of transgenic fish carrying a Lifeact reporter, a marker used to visualize F-actin (53). (H,I) Overview and higher magnification of a thymus in a double-transgenic [ccl25a:tagRFP (cyan); ccr9a:h2b-gfp (green)] fish. (H) Three-dimensional rendering of the entire thymus, illustrating the thymic epithelial cell (TEC)-network. (I) One frame (z = 1 µm) from a Z-stack spanning the entire thymus (H) showing that several thymocytes are in close contact with thymic epithelial cells (TECs). Note that ccl25a is expressed in TECs. (J–L) Overview and higher magnification of thymus in a double-transgenic [cxcr3a:gfp (white); ccr9b:tagRFP (red)] fish. (J) Three-dimensional rendering of the thymic medullary region showing that resident dendritic cells (DCs) are predominantly located in the interface between the thymic cortex and medullary region. (K) One example of the interaction of a DC (white) with a ccr9b-expressing mature thymocyte (red). (L) One example of a DC (white) engulfing a ccr9b-expressing thymocyte (red). (M) Still photograph from a time-lapse recording illustrating the rise of intracellular calcium in a thymocyte after interaction with an antigen-presenting cell. Thymocytes carry a GCaMP6s reporter for monitoring calcium level. Fluorescence signals are shown as a heat map. Information regarding transgenic reporters and imaging technique have been described previously (42).
Visualizing Thymocyte Population Trafficking
One important feature of the juvenile thymus is its considerably simpler chemotactic milieu (41, 42). TECs, which form a three-dimensional network, uniformly express a single chemokine, Ccl25a (41–43). On the other hand, thymocytes are spatially organized into thymic cortical and medullary regions based on the expression of two chemokine receptor paralogs, ccr9a and ccr9b (42). Time-lapse in toto imaging of transgenic fish carrying reporters for these two chemokine receptors has provided evidence that the migratory behavior of thymocytes is heterogeneous, lacking any discernible global pattern (42). At first glance, it seems surprising that cells with similar transcriptional levels of chemokine receptors exhibit substantially distinct migratory behaviors. However, a recently developed reporter in our laboratory revealed a different picture. In this reporter, the chemokine receptor is tagged with a fluorescent protein, a method that is routinely used to monitor receptor subcellular localization in real time. In a preliminary investigation, we observed a correlation between the abundance of chemokine receptor and the spatial position of thymocytes. Intriguingly, chemokine receptor distribution on cell membrane is highly dynamic, changing from one migration mode to another within a short period of time. The distribution of chemokine receptor on the cell surface was correlated with cell polarity and directional sensing. Bearing in mind that distinct thymic microenvironments within the medaka juvenile thymus produce the same chemokine, it is likely that cell-intrinsic mechanisms determine when a thymocyte becomes responsive to its environment. This observation strongly supports the hypothesis that the ability of cells to switch from one migration mode to another is regulated by crosstalk between chemokine receptor signaling and the cytoskeletal machinery (54).
Visualizing Thymic Selection In Vivo
The formation of functional, self-tolerant T-cells in the peri-phery is mainly determined by cellular selection of thymocytes. In this process, thymocytes bearing the T-cell antigen receptor (TCR) interact with self-peptide-presenting DCs and TECs (55–57). This interaction is highly dynamic, and parameters such as the strength of TCR signaling in response to self-peptides and patterns of thymocyte motility determine the fate of thymocytes (57, 58). The ability to directly visualize this event would, therefore, provide valuable information on when, where, and how thymic selection occurs. In fish, following TCR rearrangement, the expression of the chemokine receptor ccr9b is induced in thymocytes, which then accumulate in the thymic medullary region (42). However, resident DCs, which play a critical role in mediating negative selection (56, 57), are predominantly localized to the interface between thymic cortical and medullary regions (42). This cellular localization remarkably resembles that of the murine thymus, in which the corticomedullary junction also contains a dense network of resident DCs (56, 57). Time-lapse in toto imaging in transgenic fish has revealed that thymocytes follow a novel “in-out-in” migratory pattern during negative selection. Thymocytes bearing TCRs temporarily leave the medullary region and interact with resident DCs. They remain in contact with DCs for a short period (<1 min) and then return. This migratory pattern repeats frequently within 30 min. As a consequence of this interaction, DCs can engulf and phagocytize thymocytes (42). The duration of cell–cell contact observed in vivo is significantly shorter than that observed ex vivo (58–60). To what extent these short-term and frequent contacts influence the fate of thymocytes is not yet clear. But the significance of these contacts can be evaluated by measuring TCR-induced calcium flux in thymocytes. A classical way to determine intracellular calcium levels in thymocytes is the use of specific calcium-binding fluorescent dyes (33, 58). However, genetically encoded calcium indicators (e.g., GCaMP6s) provide much better spatiotemporal resolution than chemical dyes and also enable calcium signals to be measured in specific cell types without interference from calcium signals in other cells (61). Introduction of this reporter into a transgenic model enables us to measure changes in calcium level upon cell–cell contact with high spatiotemporal resolution; an example is illustrated in Figure 1. Insight into the subcellular organization of calcium signals additionally provides essential information on cellular polarization during migration (62). The use of this reporter not only offers the benefit of determining the strength of TCR signaling in response to self-peptides, it also allows an assessment of the cellular polarity of all thymocytes prior to, during, and after negative selection.
Selection of Model Systems and Imaging Tools
The ability to visualize thymocytes in their physiological environment represents a distinct improvement over classical methods. To date, several model systems have been established for studying dynamic aspects of T-cell development (Table 1). As we discuss here, these systems have distinct benefits, but come with certain caveats. Which model is chosen should, therefore, be based on the subject of study and optical accessibility. For example, ex vivo imaging of murine thymic slices is a versatile method for studying thymic selection or determining thymocyte motility in thymic cortical and medullary regions (33, 58–60, 63, 64), but it is not applicable to studying cellular trafficking into and out of the thymus. By contrast, in vivo imaging of transgenic zebrafish embryos enables the direct study of thymus colonization by lymphoid progenitors (41–43) as well as early events of thymopoiesis (43). On the other hand, the embryonic thymus in fish (both in zebrafish and medaka at 3–4 days post-fertilization) is not suitable for studying intrathymic cell migration, because it is not compartmentalized and is poorly populated (43). This limitation can be circumvented by imaging the thymus in juvenile medaka fish. Irrespective of the model system, selecting an appropriate microscopy system and analytical tools is equally important in assessing molecular and cellular dynamics in real time. A range of advanced light microscopy technologies are currently available with the ability to image fluorescently labeled objects at different depths and acquisition speeds (24, 27, 28). For example, 2P microscopy permits imaging cells deep inside the tissue and is currently widely used for intravital imaging in mouse models (25, 65). However, imaging of deep regions requires a longer acquisition time and, thus, decreases temporal resolution. This latter parameter is critical in precisely tracking motile cells in a densely populated tissue. Accordingly, light microscopy techniques that allow acquisition of images at very high frame rates with minimal illumination (e.g., spinning-disk confocal microscopy) are the methods of choice for simultaneously tracking the migratory behavior of all thymocytes in the medaka transgenic model system (42). High-speed imaging also has the benefit of allowing intracellular events to be monitored in real time with minimal photobleaching. These features are prerequisites for generating high-content imaging data, which provide a direct link between molecular and cellular dynamics during the recording period. One caveat is that spinning-disk confocal microscopy has a more limited tissue penetration than 2P microscopy. However, this limitation is less of an issue for in vivo imaging, because the thymus in fish models is located superficially, close to the skin.
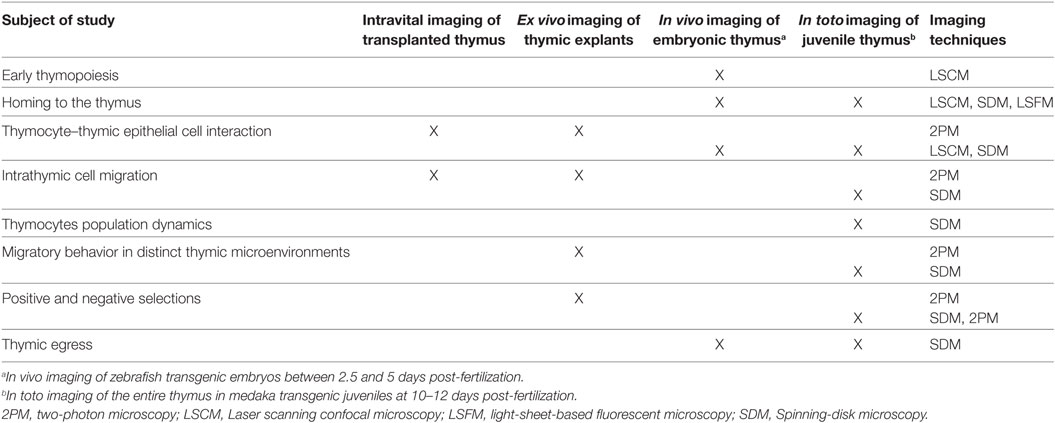
Table 1. Utility of model systems to study different aspects of T-cell development using imaging approaches.
It is worth mentioning that apart from the fact that thymic T-cell development is remarkably evolutionary conserved in all jawed vertebrates (35, 41), there might be species-specific differences in molecular and cellular aspects that need to be considered. For example, lack of pre-TCRα gene would argue that pre-TCR signaling might not occur in teleost fishes (66). Therefore, future studies should be aimed at addressing the degree of functional conservation for molecules involved in cellular processes underlying T-cell development.
Conclusion and Future Directions
With the ability to monitor molecular activity simultaneously in all thymocytes at high temporal resolution and compare cellular and subcellular dynamics in different T-cell development contexts comes the potential to generate surprising findings and formulate novel hypothesis. The simple architecture and chemokine milieu of the thymus of juvenile fish offer a novel in vivo platform for addressing issues that have previously been inaccessible, for example, how changes in individual molecular compounds affect organ-wide population dynamics. In addition, understanding mechanisms that underlie cellular trafficking is of clinical significance. In this latter context, fish are an ideal animal model for studying human diseases, such as T-cell acute lymphoblastic leukemia (T-ALL), which develops from the clonal expansion of malignant thymocytes. Long-term imaging of fluorescent-based reporters can be integrated into the T-ALL model to more precisely define the importance of specific parameters in the trafficking of malignant T-cells throughout the body. Moreover, these genetic tools can be used for high-throughput drug screening to precisely evaluate new drugs against specific target proteins.
Author Contributions
NA and BB conceived and co-wrote this article.
Conflict of Interest Statement
The authors declare that the research was conducted in the absence of any commercial or financial relationships that could be construed as a potential conflict of interest.
Acknowledgments
The authors thank Julia Skokowa and Karl Welte for their great support and comments on the manuscript. We also acknowledge support by DFG and Open Access Publishing Fund of University of Tübingen.
Funding
The laboratory of BB is funded by Deutsche Forschungsgemein-schaft (DFG) [grant number: BA 5766/3-1].
References
1. Dzhagalov I, Phee H. How to find your way through the thymus: a practical guide for aspiring T cells. Cell Mol Life Sci (2012) 69(5):663–82. doi:10.1007/s00018-011-0791-6
2. Petrie HT, Zuniga-Pflucker JC. Zoned out: functional mapping of stromal signaling microenvironments in the thymus. Annu Rev Immunol (2007) 25:649–79. doi:10.1146/annurev.immunol.23.021704.115715
3. Takahama Y. Journey through the thymus: stromal guides for T-cell development and selection. Nat Rev Immunol (2006) 6(2):127–35. doi:10.1038/nri1781
4. Misslitz A, Bernhardt G, Forster R. Trafficking on serpentines: molecular insight on how maturating T cells find their winding paths in the thymus. Immunol Rev (2006) 209:115–28. doi:10.1111/j.0105-2896.2006.00351.x
5. Liu C, Saito F, Liu Z, Lei Y, Uehara S, Love P, et al. Coordination between CCR7- and CCR9-mediated chemokine signals in prevascular fetal thymus colonization. Blood (2006) 108(8):2531–9. doi:10.1182/blood-2006-05-024190
6. Nitta T, Nitta S, Lei Y, Lipp M, Takahama Y. CCR7-mediated migration of developing thymocytes to the medulla is essential for negative selection to tissue-restricted antigens. Proc Natl Acad Sci U S A (2009) 106(40):17129–33. doi:10.1073/pnas.0906956106
7. Reinhardt A, Ravens S, Fleige H, Haas JD, Oberdorfer L, Lyszkiewicz M, et al. CCR7-mediated migration in the thymus controls gammadelta T-cell development. Eur J Immunol (2014) 44(5):1320–9. doi:10.1002/eji.201344330
8. Zlotoff DA, Sambandam A, Logan TD, Bell JJ, Schwarz BA, Bhandoola A. CCR7 and CCR9 together recruit hematopoietic progenitors to the adult thymus. Blood (2010) 115(10):1897–905. doi:10.1182/blood-2009-08-237784
9. Bajoghli B. Evolution and function of chemokine receptors in the immune system of lower vertebrates. Eur J Immunol (2013) 43(7):1686–92. doi:10.1002/eji.201343557
10. Benz C, Heinzel K, Bleul CC. Homing of immature thymocytes to the subcapsular microenvironment within the thymus is not an absolute requirement for T cell development. Eur J Immunol (2004) 34(12):3652–63. doi:10.1002/eji.200425248
11. Bunting MD, Comerford I, McColl SR. Finding their niche: chemokines directing cell migration in the thymus. Immunol Cell Biol (2011) 89(2):185–96. doi:10.1038/icb.2010.142
12. Wurbel MA, Malissen B, Campbell JJ. Complex regulation of CCR9 at multiple discrete stages of T cell development. Eur J Immunol (2006) 36(1):73–81. doi:10.1002/eji.200535203
13. Jin T. Gradient sensing during chemotaxis. Curr Opin Cell Biol (2013) 25(5):532–7. doi:10.1016/j.ceb.2013.06.007
14. Schulz O, Hammerschmidt SI, Moschovakis GL, Forster R. Chemokines and chemokine receptors in lymphoid tissue dynamics. Annu Rev Immunol (2016) 34:203–42. doi:10.1146/annurev-immunol-041015-055649
15. Wang J, Knaut H. Chemokine signaling in development and disease. Development (2014) 141(22):4199–205. doi:10.1242/dev.101071
16. Griffith JW, Sokol CL, Luster AD. Chemokines and chemokine receptors: positioning cells for host defense and immunity. Annu Rev Immunol (2014) 32:659–702. doi:10.1146/annurev-immunol-032713-120145
17. Bleul CC, Boehm T. Chemokines define distinct microenvironments in the developing thymus. Eur J Immunol (2000) 30(12):3371–9. doi:10.1002/1521-4141(2000012)30:12<3371::AID-IMMU3371>3.0.CO;2-L
18. Hu Z, Lancaster JN, Sasiponganan C, Ehrlich LI. CCR4 promotes medullary entry and thymocyte-dendritic cell interactions required for central tolerance. J Exp Med (2015) 212(11):1947–65. doi:10.1084/jem.20150178
19. Trampont PC, Tosello-Trampont AC, Shen Y, Duley AK, Sutherland AE, Bender TP, et al. CXCR4 acts as a costimulator during thymic beta-selection. Nat Immunol (2010) 11(2):162–70. doi:10.1038/ni.1830
20. Kurobe H, Liu C, Ueno T, Saito F, Ohigashi I, Seach N, et al. CCR7-dependent cortex-to-medulla migration of positively selected thymocytes is essential for establishing central tolerance. Immunity (2006) 24(2):165–77. doi:10.1016/j.immuni.2005.12.011
21. Ueno T, Saito F, Gray DH, Kuse S, Hieshima K, Nakano H, et al. CCR7 signals are essential for cortex-medulla migration of developing thymocytes. J Exp Med (2004) 200(4):493–505. doi:10.1084/jem.20040643
22. Plotkin J, Prockop SE, Lepique A, Petrie HT. Critical role for CXCR4 signaling in progenitor localization and T cell differentiation in the postnatal thymus. J Immunol (2003) 171(9):4521–7. doi:10.4049/jimmunol.171.9.4521
23. Lancaster JN, Li Y, Ehrlich LIR. Chemokine-mediated choreography of thymocyte development and selection. Trends Immunol (2018) 39(2):86–98. doi:10.1016/j.it.2017.10.007
24. Beerling E, Ritsma L, Vrisekoop N, Derksen PW, van Rheenen J. Intravital microscopy: new insights into metastasis of tumors. J Cell Sci (2011) 124(Pt 3):299–310. doi:10.1242/jcs.072728
25. Benechet AP, Menon M, Khanna KM. Visualizing T cell migration in situ. Front Immunol (2014) 5:363. doi:10.3389/fimmu.2014.00363
26. Germain RN, Robey EA, Cahalan MD. A decade of imaging cellular motility and interaction dynamics in the immune system. Science (2012) 336(6089):1676–81. doi:10.1126/science.1221063
27. Masedunskas A, Milberg O, Porat-Shliom N, Sramkova M, Wigand T, Amornphimoltham P, et al. Intravital microscopy: a practical guide on imaging intracellular structures in live animals. Bioarchitecture (2012) 2(5):143–57. doi:10.4161/bioa.21758
28. Timpson P, McGhee EJ, Anderson KI. Imaging molecular dynamics in vivo – from cell biology to animal models. J Cell Sci (2011) 124(Pt 17):2877–90. doi:10.1242/jcs.085191
29. Caetano SS, Teixeira T, Tadokoro CE. Intravital imaging of the mouse thymus using 2-photon microscopy. J Vis Exp (2012) 59:e3504. doi:10.3791/3504
30. Bousso P. Real-time imaging of T-cell development. Curr Opin Immunol (2004) 16(4):400–5. doi:10.1016/j.coi.2004.05.015
31. Bousso P, Bhakta NR, Lewis RS, Robey E. Dynamics of thymocyte-stromal cell interactions visualized by two-photon microscopy. Science (2002) 296(5574):1876–80. doi:10.1126/science.1070945
32. Ehrlich LI, Oh DY, Weissman IL, Lewis RS. Differential contribution of chemotaxis and substrate restriction to segregation of immature and mature thymocytes. Immunity (2009) 31(6):986–98. doi:10.1016/j.immuni.2009.09.020
33. Ross JO, Melichar HJ, Halkias J, Robey EA. Studying T cell development in thymic slices. Methods Mol Biol (2016) 1323:131–40. doi:10.1007/978-1-4939-2809-5_11
34. Lancaster JN, Ehrlich LI. Analysis of thymocyte migration, cellular interactions, and activation by multiphoton fluorescence microscopy of live thymic slices. Methods Mol Biol (2017) 1591:9–25. doi:10.1007/978-1-4939-6931-9_2
35. Boehm T, Iwanami N, Hess I. Evolution of the immune system in the lower vertebrates. Annu Rev Genomics Hum Genet (2012) 13:127–49. doi:10.1146/annurev-genom-090711-163747
36. Boehm T, Swann JB. Origin and evolution of adaptive immunity. Annu Rev Anim Biosci (2014) 2:259–83. doi:10.1146/annurev-animal-022513-114201
37. Zhang Y, Wiest DL. Using the zebrafish model to study T cell development. Methods Mol Biol (2016) 1323:273–92. doi:10.1007/978-1-4939-2809-5_22
38. Langenau DM, Zon LI. The zebrafish: a new model of T-cell and thymic development. Nat Rev Immunol (2005) 5(4):307–17. doi:10.1038/nri1590
39. Iwanami N, Takahama Y, Kunimatsu S, Li J, Takei R, Ishikura Y, et al. Mutations affecting thymus organogenesis in Medaka, Oryzias latipes. Mech Dev (2004) 121(7–8):779–89. doi:10.1016/j.mod.2004.03.020
40. Iwanami N, Sikora K, Richter AS, Monnich M, Guerri L, Soza-Ried C, et al. Forward genetic screens in zebrafish identify pre-mRNA-processing pathways regulating early T cell development. Cell Rep (2016) 17(9):2259–70. doi:10.1016/j.celrep.2016.11.003
41. Bajoghli B, Aghaallaei N, Hess I, Rode I, Netuschil N, Tay BH, et al. Evolution of genetic networks underlying the emergence of thymopoiesis in vertebrates. Cell (2009) 138(1):186–97. doi:10.1016/j.cell.2009.04.017
42. Bajoghli B, Kuri P, Inoue D, Aghaallaei N, Hanelt M, Thumberger T, et al. Noninvasive in toto imaging of the thymus reveals heterogeneous migratory behavior of developing T cells. J Immunol (2015) 195(5):2177–86. doi:10.4049/jimmunol.1500361
43. Hess I, Boehm T. Intravital imaging of thymopoiesis reveals dynamic lympho-epithelial interactions. Immunity (2012) 36(2):298–309. doi:10.1016/j.immuni.2011.12.016
44. Li J, Iwanami N, Hoa VQ, Furutani-Seiki M, Takahama Y. Noninvasive intravital imaging of thymocyte dynamics in medaka. J Immunol (2007) 179(3):1605–15. doi:10.4049/jimmunol.179.3.1605
45. Langenau DM, Feng H, Berghmans S, Kanki JP, Kutok JL, Look AT. Cre/lox-regulated transgenic zebrafish model with conditional myc-induced T cell acute lymphoblastic leukemia. Proc Natl Acad Sci U S A (2005) 102(17):6068–73. doi:10.1073/pnas.0408708102
46. Langenau DM, Ferrando AA, Traver D, Kutok JL, Hezel JP, Kanki JP, et al. In vivo tracking of T cell development, ablation, and engraftment in transgenic zebrafish. Proc Natl Acad Sci U S A (2004) 101(19):7369–74. doi:10.1073/pnas.0402248101
47. Aghaallaei N, Bajoghli B, Schwarz H, Schorpp M, Boehm T. Characterization of mononuclear phagocytic cells in medaka fish transgenic for a cxcr3a:gfp reporter. Proc Natl Acad Sci U S A (2010) 107(42):18079–84. doi:10.1073/pnas.1000467107
48. Renaud O, Herbomel P, Kissa K. Studying cell behavior in whole zebrafish embryos by confocal live imaging: application to hematopoietic stem cells. Nat Protoc (2011) 6(12):1897–904. doi:10.1038/nprot.2011.408
49. Kissa K, Murayama E, Zapata A, Cortes A, Perret E, Machu C, et al. Live imaging of emerging hematopoietic stem cells and early thymus colonization. Blood (2008) 111(3):1147–56. doi:10.1182/blood-2007-07-099499
50. Calderon L, Boehm T. Three chemokine receptors cooperatively regulate homing of hematopoietic progenitors to the embryonic mouse thymus. Proc Natl Acad Sci U S A (2011) 108(18):7517–22. doi:10.1073/pnas.1016428108
51. Calderon L, Boehm T. Synergistic, context-dependent, and hierarchical functions of epithelial components in thymic microenvironments. Cell (2012) 149(1):159–72. doi:10.1016/j.cell.2012.01.049
52. Svensson M, Marsal J, Uronen-Hansson H, Cheng M, Jenkinson W, Cilio C, et al. Involvement of CCR9 at multiple stages of adult T lymphopoiesis. J Leukoc Biol (2008) 83(1):156–64. doi:10.1189/jlb.0607423
53. Riedl J, Crevenna AH, Kessenbrock K, Yu JH, Neukirchen D, Bista M, et al. Lifeact: a versatile marker to visualize F-actin. Nat Methods (2008) 5(7):605–7. doi:10.1038/nmeth.1220
54. Munoz MA, Biro M, Weninger W. T cell migration in intact lymph nodes in vivo. Curr Opin Cell Biol (2014) 30:17–24. doi:10.1016/j.ceb.2014.05.002
55. Anderson G, Lane PJ, Jenkinson EJ. Generating intrathymic microenvironments to establish T-cell tolerance. Nat Rev Immunol (2007) 7(12):954–63. doi:10.1038/nri2187
56. Klein L, Kyewski B, Allen PM, Hogquist KA. Positive and negative selection of the T cell repertoire: what thymocytes see (and don’t see). Nat Rev Immunol (2014) 14(6):377–91. doi:10.1038/nri3667
57. Kurd N, Robey EA. T-cell selection in the thymus: a spatial and temporal perspective. Immunol Rev (2016) 271(1):114–26. doi:10.1111/imr.12398
58. Melichar HJ, Ross JO, Herzmark P, Hogquist KA, Robey EA. Distinct temporal patterns of T cell receptor signaling during positive versus negative selection in situ. Sci Signal (2013) 6(297):ra92. doi:10.1126/scisignal.2004400
59. Le Borgne M, Ladi E, Dzhagalov I, Herzmark P, Liao YF, Chakraborty AK, et al. The impact of negative selection on thymocyte migration in the medulla. Nat Immunol (2009) 10(8):823–30. doi:10.1038/ni.1761
60. Bhakta NR, Oh DY, Lewis RS. Calcium oscillations regulate thymocyte motility during positive selection in the three-dimensional thymic environment. Nat Immunol (2005) 6(2):143–51. doi:10.1038/ni1161
61. Chen TW, Wardill TJ, Sun Y, Pulver SR, Renninger SL, Baohan A, et al. Ultrasensitive fluorescent proteins for imaging neuronal activity. Nature (2013) 499(7458):295–300. doi:10.1038/nature12354
62. Tsai FC, Seki A, Yang HW, Hayer A, Carrasco S, Malmersjo S, et al. A polarized Ca2+, diacylglycerol and STIM1 signalling system regulates directed cell migration. Nat Cell Biol (2014) 16(2):133–44. doi:10.1038/ncb2906
63. Bhakta NR, Lewis RS. Real-time measurement of signaling and motility during T cell development in the thymus. Semin Immunol (2005) 17(6):411–20. doi:10.1016/j.smim.2005.09.004
64. Witt CM, Raychaudhuri S, Schaefer B, Chakraborty AK, Robey EA. Directed migration of positively selected thymocytes visualized in real time. PLoS Biol (2005) 3(6):e160. doi:10.1371/journal.pbio.0030160
65. Bousso P, Moreau HD. Functional immunoimaging: the revolution continues. Nat Rev Immunol (2012) 12(12):858–64. doi:10.1038/nri3342
Keywords: chemokines, thymus, imaging, medaka, zebrafish
Citation: Aghaallaei N and Bajoghli B (2018) Making Thymus Visible: Understanding T-Cell Development from a New Perspective. Front. Immunol. 9:375. doi: 10.3389/fimmu.2018.00375
Received: 16 December 2017; Accepted: 09 February 2018;
Published: 02 March 2018
Edited by:
Remy Bosselut, National Cancer Institute (NIH), United StatesReviewed by:
David L. Wiest, Fox Chase Cancer Center, United StatesAvinash Bhandoola, National Institutes of Health (NIH), United States
Copyright: © 2018 Aghaallaei and Bajoghli. This is an open-access article distributed under the terms of the Creative Commons Attribution License (CC BY). The use, distribution or reproduction in other forums is permitted, provided the original author(s) and the copyright owner are credited and that the original publication in this journal is cited, in accordance with accepted academic practice. No use, distribution or reproduction is permitted which does not comply with these terms.
*Correspondence: Baubak Bajoghli, baubak.bajoghli@med.uni-tuebingen.de