 Friederike Ebner1*
 Mathias Kuhring2,3,4,5
 Aleksandar Radonić6Ankur Midha1Bernhard Y. Renard2
 Susanne Hartmann1
- 1Department of Veterinary Medicine, Institute of Immunology, Freie Universität Berlin, Berlin, Germany
- 2Bioinformatics Unit (MF1), Department for Methods Development and Research Infrastructure, Robert Koch Institute, Berlin, Germany
- 3Core Unit Bioinformatics, Berlin Institute of Health (BIH), Berlin, Germany
- 4Berlin Institute of Health Metabolomics Platform, Berlin Institute of Health (BIH), Berlin, Germany
- 5Max Delbrück Center (MDC) for Molecular Medicine, Berlin, Germany
- 6Center for Biological Threats and Special Pathogens: Highly Pathogenic Viruses (ZBS 1), Robert Koch Institute, Berlin, Germany
Gastrointestinal nematodes are among the most prevalent parasites infecting humans and livestock worldwide. Infective larvae of the soil-transmitted nematode Ascaris spp. enter the host and start tissue migration by crossing the intestinal epithelial barrier. The initial interaction of the intestinal epithelium with the parasite, however, has received little attention. In a time-resolved interaction model of porcine intestinal epithelial cells (IPEC-J2) and infective Ascaris suum larvae, we addressed the early transcriptional changes occurring simultaneously in both organisms using dual-species RNA-Seq. Functional analysis of the host response revealed an overall induction of metabolic activity, without induction of immune responsive genes or immune signaling pathways and showing suppression of chemotactic genes like CXCL8/IL-8 or CHI3L1. Ascaris larvae, when getting in contact with the epithelium, showed induction of genes that orchestrate motor activity and larval development, such as myosin, troponin, myoglobin, and protein disulfide isomerase 2 (PDI-2). In addition, excretory-secretory products that likely facilitate parasite invasion were increased, among them, aspartic protease 6 or hyaluronidase. Integration of host and pathogen data in an interspecies gene co-expression network indicated links between nematode fatty acid biosynthesis and host ribosome assembly/protein synthesis. In summary, our study provides new molecular insights into the early factors of parasite invasion, while at the same time revealing host immunological unresponsiveness. Reproducible software for dual RNA-Seq analysis of non-model organisms is available at https://gitlab.com/mkuhring/project_asuum and can be applied to similar studies.
Introduction
The large roundworms Ascaris (A.) lumbricoides and Ascaris suum are the most prevalent soil-transmitted helminths worldwide and parasitize the gastrointestinal tract of humans and pigs, respectively. With an estimated 800 million people currently infected, typically in the most impoverished populations, Ascariasis belongs to the group of neglected tropical diseases (1–3). Among pigs, the prevalence of A. suum in high intensity production farms remains high all over the world and A. suum infections are known to cause major economic losses in the pig industry due to reduced growth performance, liver condemnation, and reduced vaccination responses (4, 5). Due to the genetic closeness of A. lumbricoides and A. suum (6, 7), studying host–parasite interactions in pigs is not only of veterinary importance but also represents an ideal research model for the human condition (8).
Ascariasis is caused by ingesting infective eggs containing L3 larvae from contaminated food and water, or with regard to pigs, coprophagy (9). The eggs hatch in the intestine and parasites undergo larval migration through the body before developing into adult worms that inhabit the small intestine. The early, intestinal migratory path involves newly hatched L3 larvae penetrating the walls of the distal small intestine, cecum, and proximal colon (10, 11) and migrating toward the liver.
Given the initial invasion and chronic infestation at gastrointestinal barriers, the mucosal immune response is of fundamental importance for defending against the parasite. The first cells to encounter invading Ascaris larvae are epithelial cells. The intestinal epithelium represents a tight barrier that prevents pathogen invasion. However, rather than being just a physical barrier, epithelial cells are equipped with microbial-detection mechanisms, signaling circuits, and both homeostatic and inflammatory mediators (12, 13). At the interface between host and environment, the epithelium defends the host against infection to the one side while fostering innate immune recognition and transmission of danger signals to the other side (12). While many types of pattern recognition receptors (PRRs) facilitate sensing of microbes, it is less clear how enteric parasites like Ascaris spp., which do not express known PAMPs, are sensed and detected by the epithelium. Conversely, whether a targeted host–pathogen interaction at the epithelial barrier drives larval tissue migration is not yet known.
The site-specific mucosal penetration of invading Ascaris L3 occurs within 3–6 h after oral infection (11) and restricts the window for an early intervention. Infection and challenge studies have greatly contributed to our understanding of hepatic- and pulmonary immune responses against A. suum (11, 14, 15); however, not much is known concerning the initial steps of immune recognition and modulation during early larval migration. Understanding to what extend host and parasite might sense, interact, regulate, or harm each other at the epithelial interface might clarify how mucosal immunity is initiated and reveal possible intervention strategies.
Therefore, we performed a time-resolved transcriptional analysis of infective A. suum third-stage larvae (AscL3) co-incubated with porcine intestinal-epithelial cells (IPEC-J2), an in vitro model widely used to study microbial pathogen–host interaction (16, 17). In that context, RNA-Seq is extremely useful for addressing non-model organisms such as a parasitic nematode (A. suum) and the pig. Addressing the limitations of most current dual RNA-Seq pathogen–host studies, pointed out by Westerman and colleagues (18) in a recent review, we do not restrict our analysis to pairwise differential comparisons of sets of time points, but account for the complete temporal behavior. By contrasting splines fitted across the time lines to baseline models rather than individual time point comparisons, statistical power can be increased (19) and the statistical model can capture trends that otherwise may be missed due to the restricted temporal granularity of individual time points (18).
In contrast to intracellular microbial pathogens, the possibility of separating larvae and host tissue after incubation enables purer sequencing and thus transcriptome analysis is unaffected by asymmetric read coverage as well as cross read mappings. In addition, we complement annotation of the non-model A. suum transcriptome for functional analysis by implementing a unique iterative annotation strategy favoring transfer from closely related species. This workflow builds upon continuously increasing the search space of species, thereby favoring results from closely related species were available, but still annotating sequences were no hits on closely related species can be found.
While many software solutions for individual steps are available, we are not aware of any interconnected analysis pipeline for dual RNA-Seq studies of non-model organisms. Here, we rely on Snakemake (20) as a current bioinformatics community standard to provide workflows at https://gitlab.com/mkuhring/project_asuum/. These workflows not only allow full reproduction of our analyses but are provided for reusage in related experiments and capture all relevant steps. Particularly, we integrated and primarily automated the annotation steps for both non-model organisms with the differential expression and functional analysis.
Our time-resolved, dual-species whole-transcriptome approach provides molecular insights into host–parasite interactions during direct physical interaction and in the absence of surrounding microbes, their metabolites and second line immune cells, enabling us to focus exclusively on parasite-epithelial cross-talk. Our results demonstrate that Ascaris larvae invade the host soft-footed without initiating immune alarming responses while expressing genes ensuring invasion and their further development.
Materials and Methods
Generation of Infective A. suum L3 Stage Larvae and Hatching
Infective third-stage larvae of A. suum were generated as previously described (21). In brief, secreted A. suum eggs were collected from the culture fluid of female worms obtained from a local slaughter house. Eggs were decoated in 0.5 M sodium hydroxide, washed, and embryonated in 0.1 N H2SO4 for 6–8 weeks under weekly aeration. For hatching, embryonated eggs were treated with 5.25% sodium hypochlorite to remove the chitinous layer from the eggs. Hypochlorite-treated eggs were further layered below slowly moving sterile glass beads (4 mm) to facilitate hatching. Subsequently, intact and motile A. suum larvae were collected, washed, counted, and adapted to mammalian cell culture media (IMDM, 5% FCS, 1% P/S) over night.
Parasite and Epithelial Cell Co-Incubation
Porcine intestinal epithelial cells (IPEC-J2 cell line) were cultured as monolayers for complete confluence in 35 mm Petri dishes [IMDM, 5% FCS, 1% P/S (all from PAN-Biotech, Aidenbach, Germany)]. L3 stage A. suum worms (50,000/dish, resulting in a larva to cell ratio of 1:10) were layered on top of epithelial cells and co-incubated for the indicated time points at 37°C, 5% CO2. Three biological replicates of a time-resolved co-incubation series of pathogen and epithelial cells were performed, with five time points (0, 1, 2, 3, and 9 h) being interrogated with regard to the early migratory pathway of A. suum (10, 11). Monocultures of either worms or epithelial cells served as controls (referred to as time point 0 h). Following co-incubation, A. suum larvae were removed from the epithelial layer and worms and epithelial cells were processed separately for RNA isolation. Viability of IPEC-J2 cells following larval coculture was verified in separate experiments by vital cell counting, measuring ATP as indicator for metabolically active cells and by documenting the monolayer appearance using Giemsa staining (Figures S6A–C in Supplementary Material). Asc L3 were visually inspected for larval motility throughout the entire coculture period and assayed for migration capacity and viability [excretory-secretory (ES) production] after 9 h of coculture (Figures S6E,F in Supplementary Material).
RNA Isolation and Quality Check
Worm samples were homogenized using shredder columns filled with 200 mg sterile sea sand and the FastPrep®-24 instrument (MP Biomedicals) at 5 m/s for 35 s. Supernatants of homogenized worms and epithelial cell lysates were further processed for RNA isolation (InnuPREP RNA isolation, Analytik Jena AG, Germany), DNase treatment (Analytik Jena AG, Germany), and RNA quality control (Agilent 2100 Bioanalyzer, RNA 6000 Nano Kit, Agilent Technologies, Waldbronn, Germany). RNA sample RIN values ranged between 7.9 and 10 for porcine epithelial cells and 7.3 and 9.5 for AscL3, respectively.
Sequencing and Mapping
For transcriptome sequencing on an Illumina platform a TruSeq RNA library generation was utilized. The library was generated by using the TruSeq RNA Sample Prep Kit v2 (Illumina, San Diego, CA, USA) following the manufacturer’s instructions. The library was quantified by using the KAPA Library Quantification Kit for Illumina (Kapa Biosystems, Wilmington, MA, USA). The library size was determined by using the High Sensitivity DNA Analysis Kit for the 2100 Bioanalyzer Instrument (Agilent Technologies, Waldbronn, Germany). Libraries were adjusted to a concentration of 12 pM and sequenced on a HiSeq 1500 instrument (Illumina, San Diego, CA, USA) in high-output mode. For cluster generation, the TruSeq PE Cluster Kit v3 was used. Cluster generation was performed on a cBot instrument. For sequencing, the TruSeq SBS Kit v3 was used to sequence 100 + 100 bases.
Sequence data processing and analysis were conducted as illustrated in Figure 1B. We sequenced 15 (resulting in three replicates for each of the five time points) AscL3 and IPEC-J2 samples each, with a mean library size of 45.5 million paired-end reads and a SD of 25.4. Raw reads were subjected to quality control and trimming via the QCumber pipeline (version 1.0.0)1 utilizing FastQC (v0.11.5)2, Trimmomatic (0.33) (22), and Kraken (0.10.5-beta) (23). On average, 88.21% of reads remained after trimming.
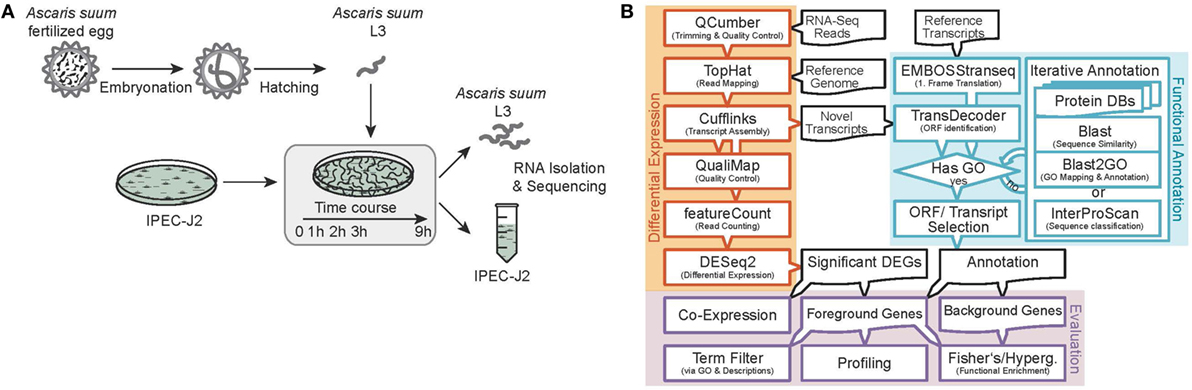
Figure 1. Experimental design and RNA-Seq data processing. (A) Analysis of the early host–parasite interaction of Ascaris suum L3 and porcine epithelial cells (IPEC-J2) by studying dual-species gene expression dynamics over a time course (0–9 h). (B) Paired RNA samples were Illumina sequenced, preprocessed, mapped to reference genomes, annotated, and differential gene expression and functional analysis was performed using the illustrated bioinformatics pipeline.
Preprocessed reads were mapped to reference genomes as specified below and corresponding sequence features using the TopHat split-read mapper (v2.1.1) (24) and reference as well as novel features were extracted and merged with the aid of Cufflinks (25) and Cuffmerge (25) (v2.2.1) to obtain one integrated and unified transcriptome for AscL3 and IPEC-J2 samples, respectively. Reference genomes used included the original A. suum draft genome from Jex et al. (26) as available from the WormBase ParaSite (27) FTP server (ftp.wormbase.org/pub/wormbase/species/a_suum/assemblies/v1/) and the Sus scrofa genome assembly from Ensembl (28) (Sscrofa10.2, release 85).
Differential Expression
For each sample, raw expression values were created by counting uniquely mapped reads on gene level using featureCounts (v1.5.0-p3) (29). To identify differentially expressed genes (DEGs) within AscL3 and IPEC-J2 samples, respectively, DESeq2 (1.12.4) (19) was adjusted for a time series design model based on natural splines to account for the time points in the experiment. A likelihood-ratio test against fits of a reduced null model including only intercept and the batch variable was applied to infer significant DEGs. However, pairwise fold-changes for each time point greater than 0 h were extracted via a classic DESeq2 model and pairwise contrasts with the base time point 0 h (indicating expression changes in comparison to 0 h). In addition, normalized and transformed expression values were extracted from DESeq2 (regularized log transformation) and corrected for batch effects via Limma (3.28.21, removeBatchEffect) (30) to allow for sample quality control with clustered heatmaps and principal component analysis (PCA).
Functional Annotation
Reference as well as novel transcripts were functionally annotated with focus on Gene Ontology (GO) terms (31, 32) using a novel iterative annotation strategy. First, transcripts were either first-frame translated (reference) or examined for ORFs (novels, Cuffcompare class code “u”) using EMBOSS transeq (6.6.0.0) (33) and TransDecoder (v2.1)3, respectively. Next, resulting protein sequences were passed through a series of database searches until successfully annotated with GO, either via blastp (2.6.0+) (34) and Blast2GO (4.0.7) (35) or by a final InterProScan classification (5.23–62.0 for A. suum, 5.22–61.0 for S. scrofa) (36). Databases used for A. suum sequences annotation included (in this order) the UniProt (37) A. suum proteome (UP000017900), UniProt Swiss-Prot Nematoda proteins, UniProt TrEMBL Nematoda proteins as well as the complete Swiss-Prot database and the complete TrEMBL database (all downloaded at 16.02.2017). For S. scrofa sequences, Ensembl reference annotations were obtained via the Ensembl BioMart server (38, 39) (with date of 30.10.2016). In addition, remaining non-annotated transcripts were searched against the UniProt S. scrofa proteome (UP000008227), Swiss-Prot Mammalia proteins, TrEMBL Mammalia proteins (all downloaded at 27.02.2017) as well as the complete Swiss-Prot database and the complete TrEMBL database (both downloaded at 16.02.2017).
In addition to GO terms, protein sequences were annotated with KEGG Orthology terms (KO) (40) via the BlastKOALA web interface (2.1) (41) using the “family_eukaryotes” and “genus_prokaryotes” databases for A. suum sequences and the “genus_eukaryotes” database for S. scrofa sequences, respectively (database builds 02.05.2017). However, for S. scrofa, reference annotations obtained via biomaRt (2.28.0) (42) and KEGGREST (1.12.3)4 were preferred if available. KO terms were then mapped to KEGG pathways via KEGGREST. Furthermore, A. suum sequences were examined for potential excretory and secretory proteins as previously described by others (43). In brief, ES proteins were annotated as classical or non-classical secretory proteins by combining SignalP (4.1 Server, organism group “Eukaryotes”) (44) and SecretomeP (2.0 Server, organism groups “Gram-negative bacteria,” “Gram-positive bacteria,” and “Mammalian”) (45, 46). Mitochondrial proteins were excluded from that list using TargetP (1.1 Server, organism group “Non-plant”) (47) as well as proteins predicted for transmembrane regions by TMHMM (Server v. 2.0) (48). The remaining predicted ES proteins were further categorized by KEGG ENZYME enzyme codes derived from KO-terms with the use of KEGGREST.
Functional Analysis
Functional profiles and enrichment analysis of significant DEGs were calculated based on GO term annotations (projected onto level 2) of the three classes of molecular function (MF), cellular component (CC), and biological process (BP) as well as on KEGG Pathways. For enrichment analysis, significant DEGs were tested against background gene sets representing the expression potential in the experiment, i.e., all expressed and sufficiently annotated genes in the AscL3 and IPEC-J2 samples, respectively. Significantly over- and underrepresented GO terms were determined by the two-sided Fisher’s Exact test in Blast2GO (adjusted p < 0.05) while enriched KEGG pathways were determined with a hypergeometric test in clusterProfiler (3.0.5) (49) (adjusted p < 0.05). In addition to global analysis, significant DEGs were mined for specific functions of particular interest via filters based on specifically selected GO terms, free-text searched GO term collections, as well as gene description analysis. Thereby, GO term filters were recursively extended with corresponding child terms to account for descending functionality using GO.db (3.3.0)5. Target functions as well as corresponding GO-terms and description filter are found in Table S3 in Supplementary Material.
Co-Expression Analysis
The normalized, transformed, and batch-corrected expression values were used to infer an interspecies gene co-expression network (GEN) between A. suum and S. scrofa. The AscL3 and IPEC-J2 expression matrices were combined (excluding replicate C of time point 2 h due to quality issues) and subjected to pairwise Spearman rank correlation tests using the psych R package (1.7.5) (50) with FDR p-value adjustment for multiple testing. Resulting gene pairs (edges in the GEN) were filtered by significance (adjusted p < 0.05) and correlation strength (rho > 0.95) before further analysis and visualization within Cytoscape (3.2.1) (51). In Cytoscape, duplicated edges and self-loops were removed and the network was reduced to nodes participating in interspecies interactions (GEN1). Node degrees were calculated based once on all edges and once on interspecies edges alone (GEN2) to identify highly interacting genes between species. In addition, node (resp. gene) clusters were calculated on GEN1 with the MCODE plugin (v1.4.1) (52).
Results and Discussion
Transcriptional Response Reveals Temporal Dynamics of Early Host–Pathogen Interaction
A critical event during initial invasion of Ascaris parasites is crossing the intestinal epithelial barrier of their mammalian hosts. The initial dialog of host epithelium and parasite before the parasite starts tissue migration has, however, received little attention. We thus performed a time-resolved RNA-Seq transcriptional profiling of both, A. suum L3 larvae and porcine epithelial cells (IPEC-J2) to examine the early and comprehensive transcription of genes potentially involved in sensing, attachment, barrier disruption, and immune response early after initial parasite–host contact.
We sequenced A. suum larvae (AscL3) and IPEC-J2 at five different time points during co-incubation (0, 1, 2, 3, and 9 h) with n = 3 biological replicates each (Figure 1A). Mapping quality control of raw reads using QualiMap (v.2.2.1, Figure 1B) (53) indicated one sample (IPEC-J2, 2 h, replicate C) being inconsistent in comparison to all the other samples in the experiment, which consequently was excluded from further analysis.
In total, our exploratory study identified 146 A. suum genes and 1,423 S. scrofa genes with significant differential expression over time (Table 1, with adjusted p-value < 0.05 for A. suum and 0.01 for S. scrofa, respectively). Normalized expression values of both IPEC-J2 and A. suum L3 genes demonstrated successful clustering of replicates by time with minor exceptions of earlier time points for IPEC-J2 (Figure 2A) and median time points for AscL3 (Figure 2B). Clustering analysis indicates that most distinct changes in expression occur in later time points, additionally confirmed by the pairwise fold-changes (Table S1 in Supplementary Material). PCA of IPEC-J2 (Figure 2C) and A. suum L3 (Figure 2D) expression data indicate a relation of the first principal component with time direction and thus confirms that most of the variance and, therefore, change in expression is occurring over time.
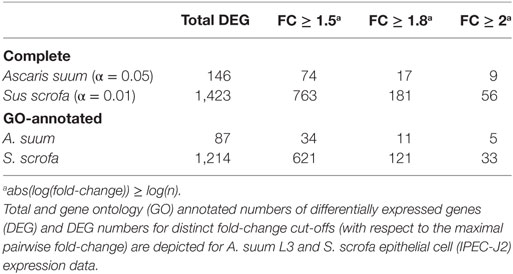
Table 1. Numbers of differentially expressed and annotated genes.
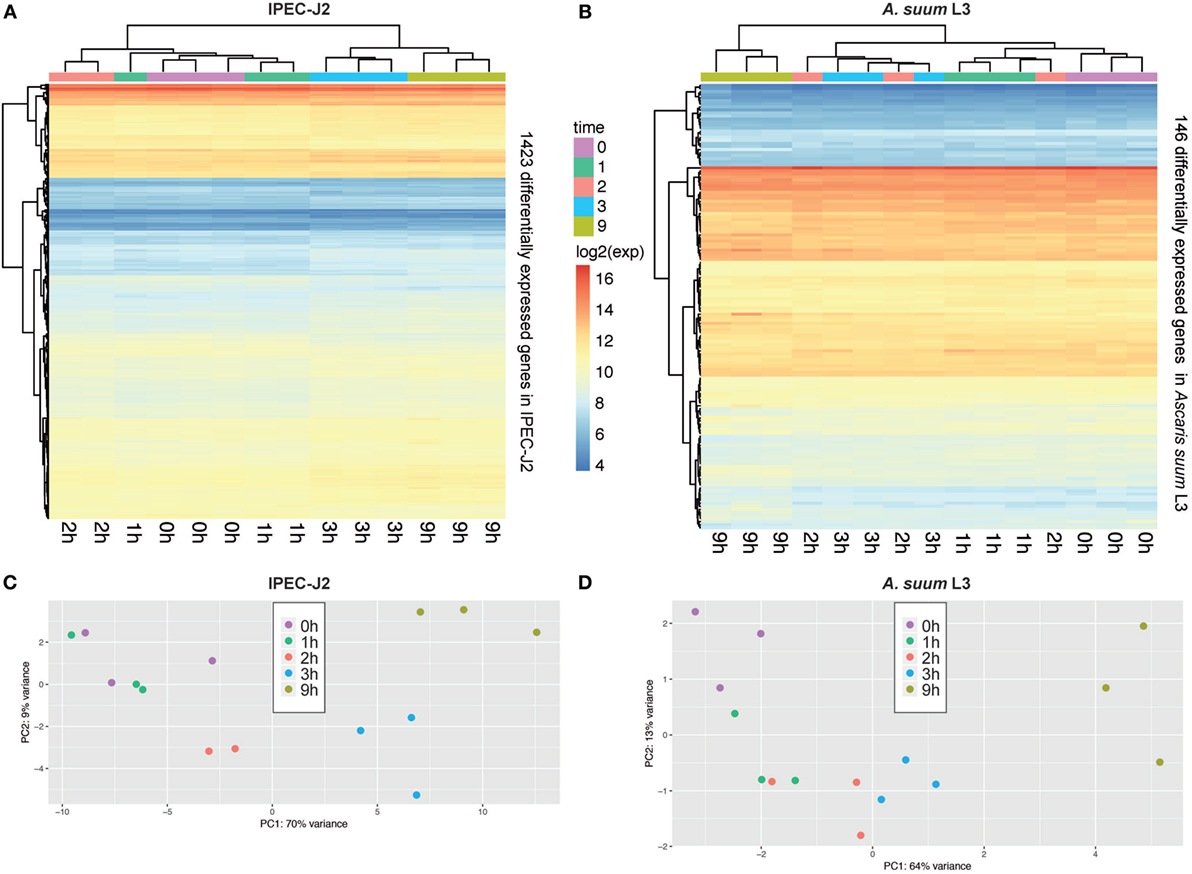
Figure 2. Principal component analysis (PCA) of porcine epithelial cells (IPEC-J2) and Ascaris suum L3 expression data and clustering of differentially expressed genes (DEGs). (A) Unsupervised clustering heatmap of DEG in porcine epithelial cells (n = 1,423, IPEC-J2) and (B) A. suum L3 (n = 146). Red intensity indicates high gene expression during the time-course of host–parasite co-incubation, whereas blue intensity indicates low gene expression. PCA of RNA-Seq samples of (C) porcine epithelial cells and (D) A. suum L3 reveals that 79% (IPEC-J2) and 77% (A. suum) of the data variation is explained by the first two PCs, respectively. The five time points are color-coded ( 0,
0,  1,
1,  2,
2,  3, and
  9 h) and comprise n = 3 biological replicates (exception: n = 2 for IPEC-J2;
  2 h, due to RNA-Seq quality control exclusion).
Particularly for genes of the non-model nematode A. suum, available GO annotation was limited. We, therefore, implemented an iterative annotation strategy, depicted in Figure 1B and Figure S1 in Supplementary Material, which enabled us to assign GO terms to 13,683 reference and 410 novel A. suum genes as well as to 21,265 reference and 890 novel S. scrofa genes (including Ensembl reference GO-annotations). Regarding our co-incubation experiment, 59.6% of the A. suum DEGs (87 of the 146) and 85.3% of the S. scrofa DEGs (1,214 of the 1,423) were adequately annotated and thereby eligible for further functional analysis (Table 1). In parallel, a total of 8,034 A. suum genes could be annotated with KEGG Orthology (KO) identifiers including 7,306 reference and 728 novel genes. Furthermore, 9,711 S. scrofa genes could be annotated with KOs comprising 8,954 reference and 757 novel genes. KEGG pathways were assigned to 59 A. suum and 471 S. scrofa DEGs, respectively. These data highlight the GO annotation gap for A. suum genes and point out a need for improving methods to functional annotate nematode genes in general. A complete list of all A. suum L3 and IPEC-J2 genes (annotated and not annotated) is provided as Table S4 in Supplementary Material.
The Epithelial Cell Response to Worm Invasion
Epithelial Cells Are Not Intensely “Alarmed”
The IPEC-J2 cell line is a non-transformed, porcine epithelial cell line derived from the small intestine and currently the most convincing model for porcine infection studies (16, 54). The initial contact of A. suum larvae with the intestinal epithelial cells over 9 h results in a transcriptomic response of 1,423 S. scrofa genes (982 upregulated/441 downregulated, with respect to the maximal pairwise fold-change). To functionally describe the regulated S. scrofa genes, level 2 GO term profiles are illustrated (Figure 3A), categorizing MF, CC, and BP. To gain insight into the biological significance of alterations in gene expression levels, GO enrichment analysis was used to determine whether certain GO terms are over- or underrepresented within the gene set of interest. GO terms significantly overrepresented (adjusted p < 0.05) among S. scrofa DEGs were binding (as part of MF), CC organization or biogenesis and cellular process (BP) as well as several CC including cell, cell part, macromolecular complex, membrane-enclosed lumen, organelle, organelle part, and supramolecular fiber (Figure 3A). Surprisingly, the few underrepresented terms are almost exclusively attributed to extracellular matrix (ECM), membrane, and membrane part (CC), a group of terms that we expected to be specifically addressed while being co-incubated with a comparably large and motile extracellular parasite. Further global analysis as subcellular location of S. scrofa DEGs and KEGG pathway annotation are depicted in Figures 3B,C. S. scrofa KEGG profiling features several significantly enriched pathways (hypergeometric test, adjusted p < 0.05) including induced cell cycle activity, FoxO signaling, homologous recombination and RNA degradation as well as a suppressed ribosome pathway. In addition, though not significant, oxidative phosphorylation and purine metabolism show distinct repression (Figure 3C). Genes of the FoxO family that are central for the here enriched FoxO signaling pathway regulate transcriptional responses including apoptosis, cell-cycle control, glucose metabolism, oxidative stress resistance, and longevity. A recent study revealed that intestinal FoxO-mediated signaling is required for epithelial antimicrobial response and AMP synthesis by enterocytes (55). Factors inducing FoxO signaling include oxidative and nutrient stress stimuli, such as insulin or several growth factors. The induced oxidative stress response is in line with the repression of the oxidative phosphorylation pathway, and together imply increased nutrient consumption or even nutritional competition between IPEC-J2 and A. suum larvae.
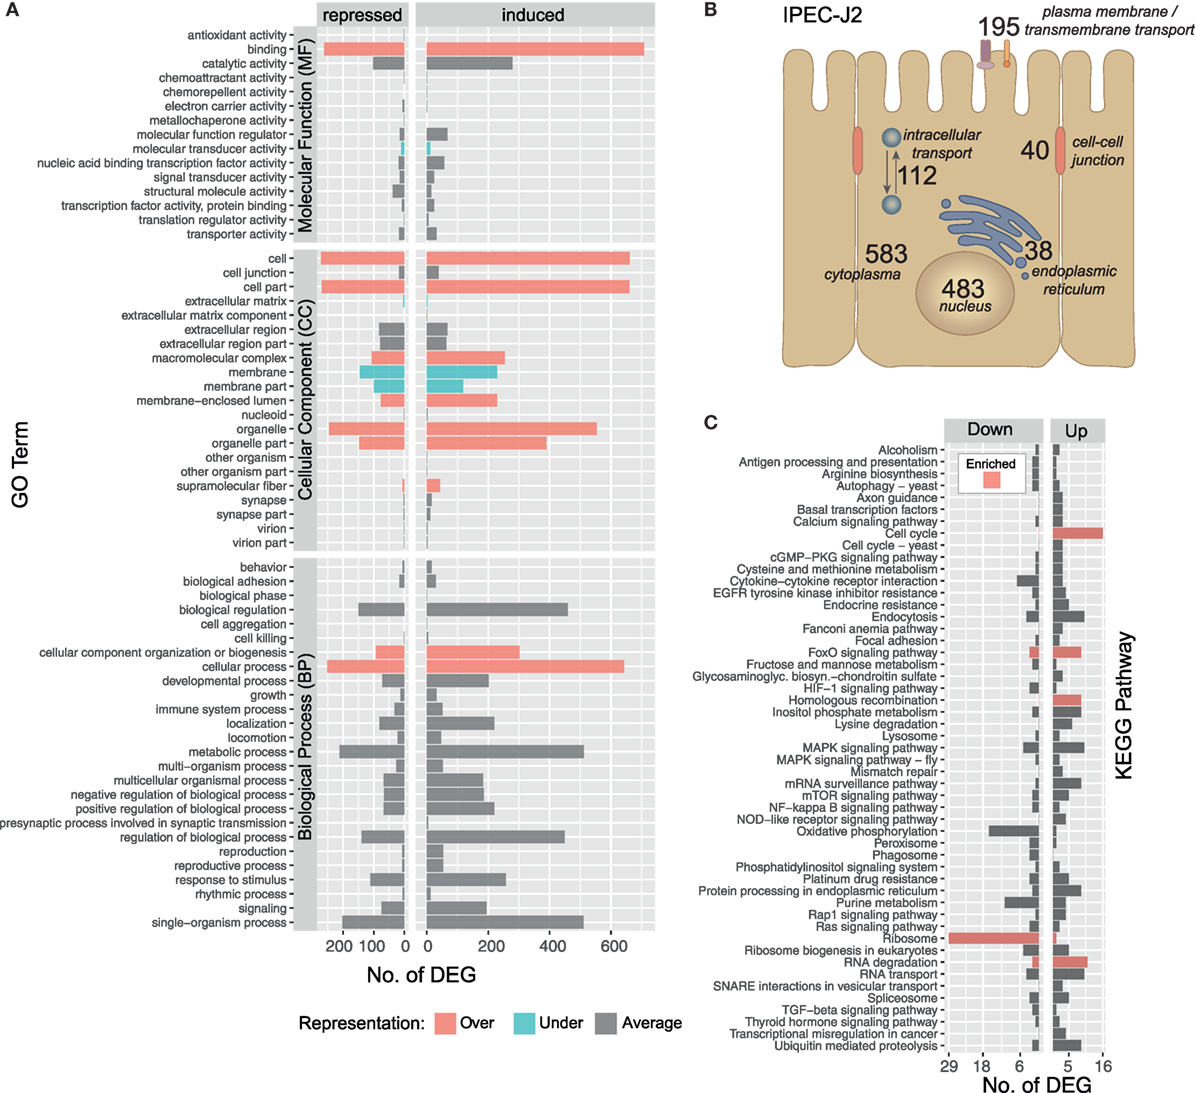
Figure 3. Gene ontology (GO) and pathway profiling of porcine intestinal epithelial cell differentially expressed genes (DEGs). An iterative annotation strategy was used to assign GO terms to reference and novel porcine transcripts. (A) For 1,214 GO-annotated porcine DEGs, the level 2 of GO hierarchy is illustrated and classified into Molecular Function (MF), Cellular Component (CC) and Biological Process (BP). GO terms significantly enriched among differentially expressed S. scrofa genes (Fischer’s Exact Test, two-sided, p < 0.05) are highlighted as over-( ) and under-(
 ) represented terms alongside with averagely represented terms (
 ) with regard to the reference genome. (B) Subcellular localization of DEG encoding proteins deduced from binning relevant GO terms (Table S3 in Supplementary Material) and offsprings [nucleus (CC, 483), endoplasmic reticulum (CC, 38), cytoplasm (CC, 583), intracellular transport (BP, 112), plasma membrane (CC, 128), transmembrane transport (BP, 34), transmembrane transporter activity (MF, 33), cell–cell-junction (CC, 31), and cell–cell junction organization (BP, 9)]. (C) Sequences were annotated with KEGG pathways and pathways with three or more assigned DEGs are visualized including color-coded () enrichment analysis (hypergeometric test, p < 0.05).
KEGG pathway analysis further highlights that pathways linked to extracellular recognition such as TLR signaling are not regulated (Figure 3C). This is supported by several other studies showing that host PRRs such as TLR are modulated by nematode species to limit inflammation (56–58) but TLR signaling in generating an anti-helminth immune response remains controversial (59). Since epithelial cells are known to express all kinds of PRRs, we more specifically considered the role of C-type lectin receptors such as mannose receptor, DC-sign, ICAM-3, collectins, or selectins (59, 60) to be addressed, but found no transcriptional evidence that these receptors or corresponding receptor signaling pathways are affected by the presence of A. suum larvae. Interestingly, we observe a generally low presence of S. scrofa DEGs in several other signal transduction pathways, such as HIF-1, MAPK, mTOR, NF-kappa B, Rap1, TGF-ß, or RAS indicating that IPEC-J2 cells overall were not in an “alarmed state” as expected.
Although we hypothesized that epithelial cells somehow sense incoming Ascaris larvae and might orchestrate an appropriate response, we were surprised to find such a low magnitude of response (indicated by fold-change values) and the lack of conclusive activation signatures. We then specifically looked for genes involved in inflammatory responses (Figure 4A, GO declination in Table S3 in Supplementary Material) and chemotactic responses (Figure 4B, GO declination in Table S3 in Supplementary Material) and found chemokine transcripts (CCL5, IL8, and CXCL18), the chitinase 3 like 1 protein, and the cytokines genes for IL17D to be suppressed. Interleukin-8, one of the repressed immunity genes, is a potent chemoattractant for primary neutrophils but also other granulocytes, and is secreted by epithelial cells in response to bacterial stimuli (61). Upon LPS stimulation, also porcine IPEC-J2 cells rapidly upregulate IL-8 transcripts (Figure S6D in Supplementary Material). Intriguingly, Aprianto and colleagues (62) showed that a highly adherent, unencapsulated form of S. pneumoniae suppressed IL-8 production from epithelial cells compared to a free-floating, non-adherent form of the same strain early during infection. Their RNA-Seq study thereby links repression of epithelial innate immune response with the adherence mechanisms of the invading pathogen and provides evidence for targeted immune evasion. Hence, active suppression of the innate chemokine response combined with restricted epithelial recognition of AscL3 larvae, weak induction and even suppression of NIK/NF kappaB signaling (Figure 4C), could explain the poor response of immune-related genes that we observed. Following this line, mice lacking NF kappaB signaling specifically in epithelial cells are incapable of mounting protective type 2 cell-mediated immunity to the nematode Trichuris muris in its rodent host (63). The initiation of protective type 2 responses against helminth typically begins with production of epithelial cell-derived cytokines (IL-25, IL-33, and thymic stromal lymphopoietin), but none of them was found to be regulated in porcine IPEC-J2 cells early after A. suum co-incubation. However, it has to be taken into account that it was recently found that rather than every epithelial cell, a very rare epithelial cell type, intestinal tuft cells, initiated mucosal type 2 responses to helminth parasites through IL-25 secretion after TRMP5 taste chemoreception (64, 65).
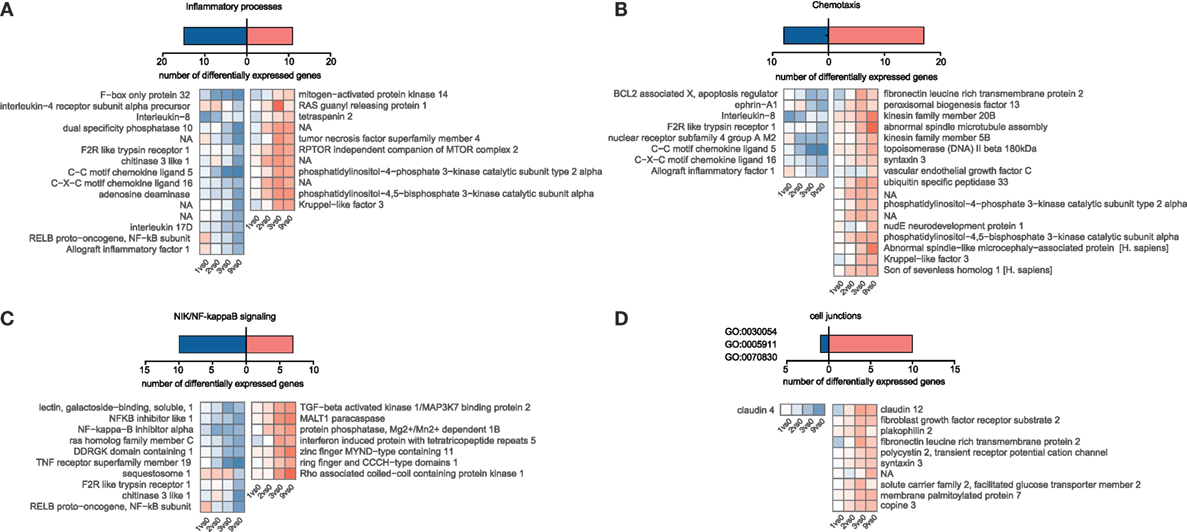
Figure 4. Temporal gene expression changes in porcine intestinal epithelial cells in response to A. suum larvae. Blastp, Blast2GO, and InterProScan were used to identify S. scrofa differentially expressed genes associated with distinct immune responses or cell junction for (A) “Inflammatory processes,” (B) “Chemotaxis,” and (C) “NIK/NF-kappaB signaling.” For (D) “Cell junctions,” the cell–cell junction localization filter was manually selected for GO:0030054, GO:0005911, and GO:0070830.
Studies in the mouse model parasitic nematode Heligmosomoides polygyrus showed that factors secreted by the nematodes directly suppressed IL-33 release (66), but the upstream mechanisms of IL-33 release are somewhat controversial and suggest that IL-33 might also be released from intracellular stores when cells undergo necrosis or even after mechanical stress (67). However, from our data, we cannot conclude that IL-33 is not released. We, therefore, speculated that during co-incubation, worms cause epithelial barrier damage and induce mechanical stress responses or cell death, but the latter was only poorly reflected in the epithelial transcriptome response [no wound healing, apoptosis, or necroptosis pathways (Figure 3C)]. From 247 DEGs associated with stress response in general (GO declination Table S3 and Figure S4 in Supplementary Material), only 10 are connected to mechanically induced stress responses/mechanical stimulus (Figure S5 in Supplementary Material). However, when genes associated to cell junction or bicellular junction formation (GO:0030054, GO:0070830, and GO:0005911) were considered, we noticed a clear trend toward an induced gene response, including claudin-12, plakophilin 2, and FLRT3 (Figure 4D). This highlights an active response to promote barrier integrity of IPEC-J2 and raises the question whether A. suum larvae and/or their secreted products specifically target tight junction formation. Moreover, the only downregulated gene in this functional group was claudin-4 (Figure 4D). This is particularly interesting, because researchers suggest that claudin-4 acts to tighten the paracellular pathway (68) and downregulation of claudin-4 is observed under conditions leading to increased permeability (69). The differential regulation of claudin-12 and claudin-4 and the downregulation of IL-8 was additionally validated by quantitative PCR (Figure S7A in Supplementary Material).
Together, our results indicate that small intestinal epithelial cells show poor innate immune responses to co-incubated A. suum L3, reduced ribosome function and oxidative phosphorylation pathways, but specifically induce tight junction formation. Whether IPEC-J2 cells do not possess an adequate detection system or whether the parasite is inactivating the host detection systems that would otherwise raise the alarm remains unknown.
The Worm Response to the Epithelial Barrier
Ascaris suum Larvae Drive Invasion and Migration
The initial contact of Ascaris suum L3 with intestinal epithelial cells resulted in a transcriptomic response of 146 A. suum genes (68 upregulated/78 downregulated, with respect to the maximal pairwise fold-change). A total of 87 genes mapped to GO terms showed regulated functions such as binding and catalytic activity (MF), membrane and membrane part (CC) as well as cellular, metabolic, and single-organism processes (BP) (Figure 5A GO level 2). However, no significant enrichments (two-sided Fisher’s Exact test in Blast2GO; adjusted p < 0.05) could be observed with respect to the background genome. Due to the small number of A. suum DEGs in general, only a few KEGG pathways could be assigned more than once, namely ABC transporters (2), cAMP signaling pathway (2, repressed), cysteine and methionine metabolism (2, repressed), glycosaminoglycan degradation (2, activated), protein digestion and absorption (3), pyrimidine metabolism (2), RNA degradation (2), and spliceosome (2) (Figure S2 in Supplementary Material). GO term filtering and gene description analysis were used to classify A. suum L3 DEGs into enzymes (36), receptors (15), and channels/transporters (19) (Figure 5B). Surprisingly, most receptor associated genes were indeed downregulated (10 out of 15, Figure 5C). We specifically looked for Ascaris C-type lectins (C-TL), a superfamily potentially involved in either site-specific tissue recognition or interference with mammalian C-TL-mediated inflammation (70), but found no C-TL within the A. suum DEGs of our early response experiment.
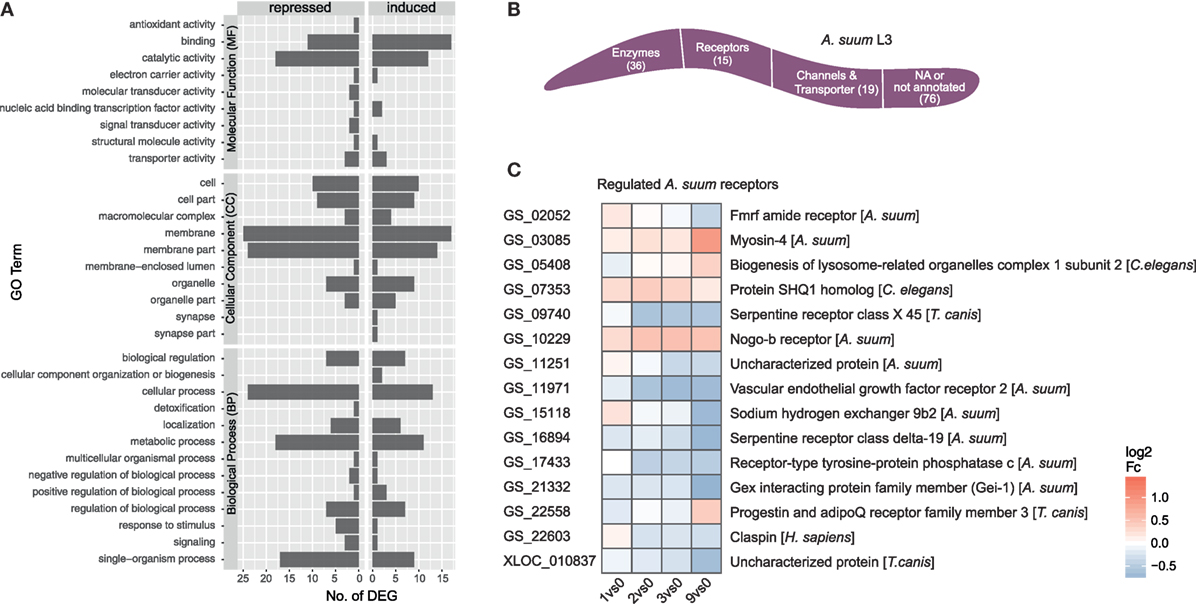
Figure 5. Gene ontology (GO) profiling of Ascaris suum differentially expressed genes (DEGs). (A) Distribution of level 2 GO terms for A. suum L3 DEGs, categorized into molecular function, cellular component (CC), and biological process (BP). (B) Global classification of A. suum L3 DEGs into enzymes, receptors, and channels/transporter based on GO-term filter and gene description analysis (Table S3 in Supplementary Material). (C) Time-resolved expression of A. suum DEGs with GO assigned receptor function.
In contrast, the 20 most upregulated A suum L3 genes (Table S1 in Supplementary Material) included genes associated with motor activity (GS_03085 Myosin-4, GS_04138 Troponin T, GS_00138 Myoglobin) and structure (GS_04352 Cuticle collagen domain-containing protein, GS_11610 Cuticle collagen 6, GS_09547 Cuticle collagen 34, GS_00653 Protein disulfide-isomerase 2). The upregulation of genes associated with motor activity/motility driven by epithelial-contact is particularly interesting in the absence of host peristalsis, the luminal content/microbes, or mucus production and could be indicative of increased locomotion either in order to penetrate host tissue or to counteract passive movement after site-specific recognition. Increased muscular locomotor activity together with proteolytic enzymes secreted by glandular structures are thought to be essential for host tissue penetration.
The subset of upregulated genes involved in cuticle formation such as protein disulfide-isomerase 2 (PDI-2) (Table S1 in Supplementary Material and qPCR-validated in Figure S7B in Supplementary Material) suggests an epithelial trigger for driving further larval development. Nematode cuticles are formed by multiple collagenous layers that contain extensive disulfide linkages (71) and new cuticles are synthesized sequentially for each developmental stage. Cuticle biogenesis in the endoplasmic reticulum involves proline hydoxylation and disulfide bond formation by PDI (72). Mutations in the Protein disulfide-isomerase 2 (PDI-2) gene of Caenorhabditis elegans resulted in severe body morphology defects, uncoordinated movement, adult sterility, abnormal molting, and aberrant collagen deposition (73). The importance of PDI-2 activity for ECM formation demonstrated for C. elegans and more recently also for Brugia malayi (74) highlights its relevance as a potential anthelmintic drug target (72), including for Ascaris species.
At the host–parasite interface, ES proteins released by helminths play an important role in mediating host–parasite interaction, regulation, and control (75–78). To assess the transcriptional regulation of proteins potentially secreted by larval Ascaris parasites, we merged predicted DEGs for classical (SignalP) and non-classical (SecretomeP) secretory proteins and removed mitochondrial (TargetP) and transmembrane (TMHMM) proteins (Figure 6A). From the 55 ES proteins, 20 can be assigned to enzymatic activity with diverse functions including hydrolases (n = 9), transferases (n = 6), isomerases (n = 2), oxidoreductases (n = 2), and lyases (n = 1) as depicted in Figure 6A.
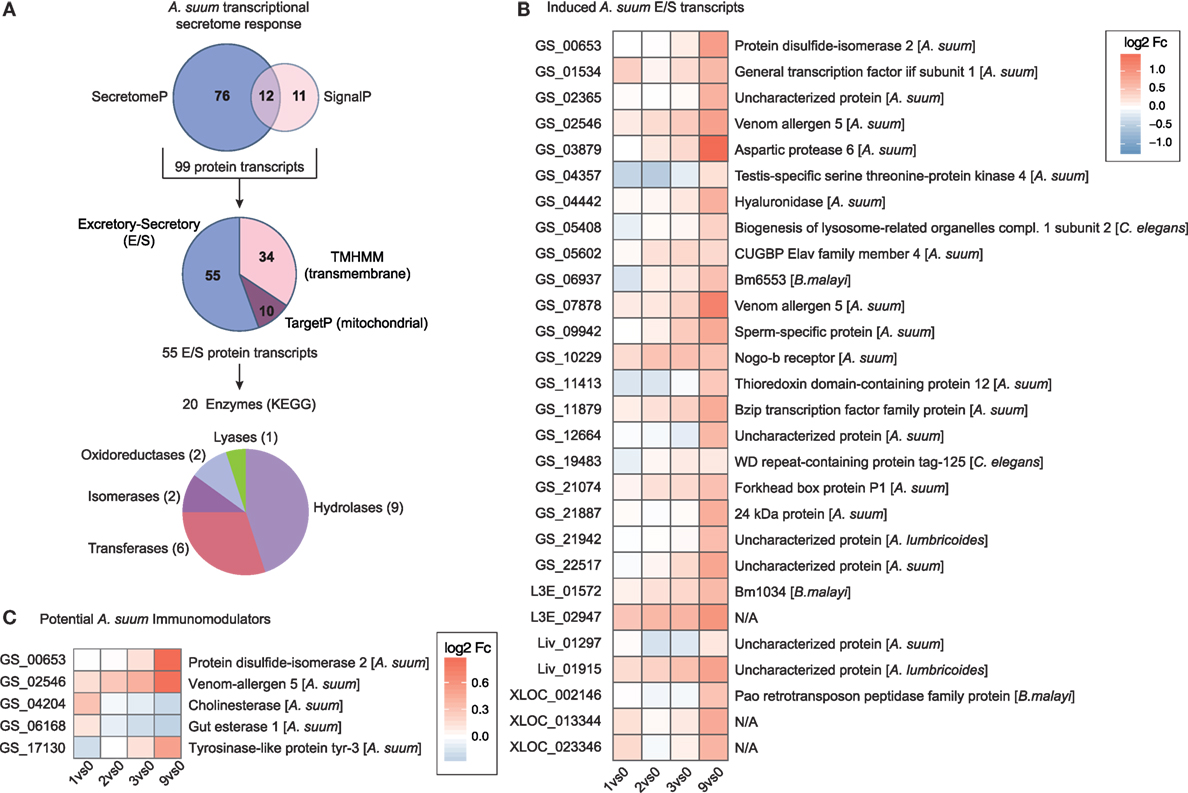
Figure 6. The secretome response of Ascaris suum. (A) The pipeline to identify A. suum excretory-secretory (ES) transcripts used SignalP and SecretomeP to annotate classical (n = 23) and non-classical (n = 88) ES genes and excluded mitochondrial (n = 10; TargetP) and transmembrane (n = 34; TMHMM) protein transcripts. KEGG ENZYME identified enzyme classes of ES transcripts are depicted in the bottom pie chart. (B) Time-resolved expression of n = 28 induced A. suum ES transcripts. (C) Differentially expressed A. suum transcripts that matched to genome prediction of A. suum immunomodulatory ES products based on homology to other nematodes (26).
We hypothesized that proteolytic enzymes would be essential for parasite invasion and, therefore, upregulated by A. suum larvae once the epithelial barrier was detected. Within the class of proteases, nematode serine proteases have received considerable interest as they are widely distributed in parasitic nematodes with a wide variety of functions (79). Indeed, the parasite transcript with the highest maximal fold-change (comparing 0 versus 9 h time point, Table S1 in Supplementary Material) was identified as being A. suum aspartic protease 6 (Figure 6B). Aspartic proteases are a group of endopeptidases characterized by their catalytic aspartic residues that are known to drive host hemoglobin digestion by the blood-feeding nematodes Haemonchus contortus, Ancylostoma caninum, and Necator americanus (80, 81). Moreover, aspartic protease 1 from N. americanus is targeted by the bivalent human hookworm vaccine [Na-APR-1(M74), carrying a site-directed mutation abolishing its catalytic activity, and glutathione S-transferase (Na-GST-1)] currently being tested in clinical phase 1 studies in the US and Brazil (82–84). The Na-APR-1(M74) vaccine strategy is based on the induction of neutralizing antibodies against aspartic protease 1, thereby preventing hemoglobin degradation in the brush border membrane of the parasite’s digestive tract and finally leading to diminished parasite-related blood loss and reduced numbers of hookworms [reviewed in Ref. (83, 85)]. For nematode parasites that do not feed on blood but express aspartic proteases, different functions such as skin macromolecule and epithelial degradation, aiding in tissue penetration, or host-derived nutrient digestion are suggested (86–88). Interestingly, a proteomic study on ES products of different larval stages of A. suum shows the presence of aspartic protease 6 protein in ES collected from L3-lung stage worms, but its absence in the ES of hatched L3 larvae (89), thereby directly supporting our findings on the protein level and highlighting an epithelial trigger and early role for this specific enzyme.
The same study revealed the high abundance of glycosyl hydrolases (family 31, GH31) in A. suum L4 ES (89) suggesting degradation of complex carbohydrates to be essential for its energy metabolism. Among the ES enzymes upregulated directly in response to epithelial cell contact, we indeed identified a hyaluronidase (Figure 6, GS_04442). There is evidence that some bacterial species use hyaluronidases to utilize host hyaluronic acid (HA), an essential part of the ECM of epithelial tissue, as a carbon source for their energy metabolism (90). This might indicate that A. suum L3 not only produce proteolytic enzymes that help in epithelial tissue invasion but that epithelial ECM components can be directly hydrolyzed to feed on. Moreover, the release of hyaluronidase by A. suum has been described earlier for larvae isolated from the lungs of infected pigs (91). Besides its role in facilitating larval migration, the authors added another functional point: the modulation of developmental processes by hydrolyzing HA present in extracellular cuticle during molting. The role of A. suum hyaluronidase in either breaking up the internal cuticle-epidermal connection critical for molting (91), larval migration (92), or larval energy metabolism, therefore, remains speculative.
A comparison of the herein identified A. suum DEGs with a draft genome-based list of potential A. suum immunomodulators (26) revealed three upregulated transcripts (Figure 6C, GS_00653 PDI-2, GS_02546 venom allergen-5 and GS_17130 tyrosinase like protein tyr-3). Genomic and proteomic evidence suggest the abundance of venom allergen-like (VAL) proteins (SCP/TAPs superfamily) also in the ES compartment of A. suum. The early upregulation of VAL genes (venom allergen-5: qPCR validated in Figure S7B in Supplementary Material) is perhaps not surprising and has been associated in previous studies with larval invasion (78, 93, 94), although there is only limited understanding on the detailed function of those proteins in the host–parasite relationship.
In summary, we provide transcriptomic evidence for an early response pattern of genes that A. suum L3 specifically regulate during contact with host epithelial cells. Among those genes are factors that might facilitate parasite invasion through the epithelial barrier (aspartic protease 6), migration (myosin, troponin, and myoglobin), feeding (hyaluronidase), and development (PDI2) of the parasite. However, the parasite–host interaction not only depends on proteins but might also include glycans, lipids, miRNAs, or other small molecules and metabolites that have not been studied here, but can also contribute to parasite-epithelial communication (75). Furthermore, intestinal parasites and microbes have co-evolved together in their respective hosts. For that reason, the complex interaction of parasites with the bacterial community and the microbiota–host interaction likely also contributes to the parasite–host communication.
Interspecies Interaction Is Dominated by Four A. suum Genes
Inference of interspecies gene co-expression networks (GENs) is an important systems biology approach to predict pathogen–host interactions. We applied established and efficient procedures to infer and analyze GENs including pairwise correlation, cluster (module) analysis, and functional enrichment (95, 96). Thereby, genes featuring a similar expression profile over time are associated by direct network links as well as gene clusters and are considered to participate in common functionality or in concurrent and thus interlinked processes. It must be noted that the recommended sample number of 20 is not met; however, our analysis compensates with distinctly higher read coverage than recommended (>10 million), an encompassing context of all samples due to the time series as well as strict GEN creation parameters (p < 0.05, rho > 0.95), resulting in a few but prominent and explicit signals.
Based on node degrees of the co-expression network that was reduced to interspecies nodes and interspecies edges (Figure 7A, GEN2), we identified four highly interacting A. suum genes (Figures 7B,C). Three of the four highly interacting A. suum genes could be annotated by the iterative strategy (Figure 1B); GS_12056 with the “elongation of very long-chain fatty acids” (UniProt:ASU_11627, GO:0016021 integral components of the membrane), GS_09942 as “sperm-specific protein” (UniProt:ASU_04668, PROSITE:PS50202) and GS_11251 as “Uncharacterized protein,” or with the InterProScan classification, “rhodopsin-like G protein-coupled receptors (GPCRs)” (UniProt:ASU_01462, GO:0016021 integral components of membrane) (Figure 7E). The one gene lacking thorough characterization, L3E_01572, is annotated only with the associated GO-term (UniProt:Bm1034, GO:0016021 integral component of membrane). The overall gene regulation, based on maximal fold change values, of S. scrofa genes connected to the four A. suum genes was diverse as illustrated in Figure 7D. In addition to node degrees, the four A. suum genes are further emphasized by the fact that they participate in the four largest clusters of GEN1 identified by MCODE (Cluster 1, 2, 4, and 5, Figure 7B; Table S2 in Supplementary Material). Those four clusters are dominated by S. scrofa genes except for one A. suum gene each. The network data links the parasite’s fatty acid biosynthesis with host cluster 1, which is comprised of mostly repressed genes like Cystatin E/M and macrophage inhibitory factor 1 (MIF), known to be induced by bacterial invaders (97), and ribosomal proteins (RPS21, RPS16, RPL13, RPL18, RPL8) involved in peptide and protein synthesis (Table S2 in Supplementary Material). GO profiling of S. scrofa DEGs per cluster revealed significantly over-represented terms (two-sided Fisher’s Exact test, p < 0.05) in cluster 1 (Figures 7B,C; Figure S3 in Supplementary Material) associated with structural molecule activity (MF), cell, cell part and macromolecular complex (CC). In parallel, the sperm-specific protein of A. suum interacted with cluster 2 that contained mostly repressed genes for cellular and metabolic processes (BP). A dominant activation of genes was found in cluster 5 with the interspecies link to GS_11251 (A. suum) that shares structural similarity to known rhodopsin-like G protein-coupled receptors according to InterPro. GPCRs transduce extracellular signals through interaction with guanine nucleotide-binding (G) proteins, highlighting its potential for interspecies linkage.
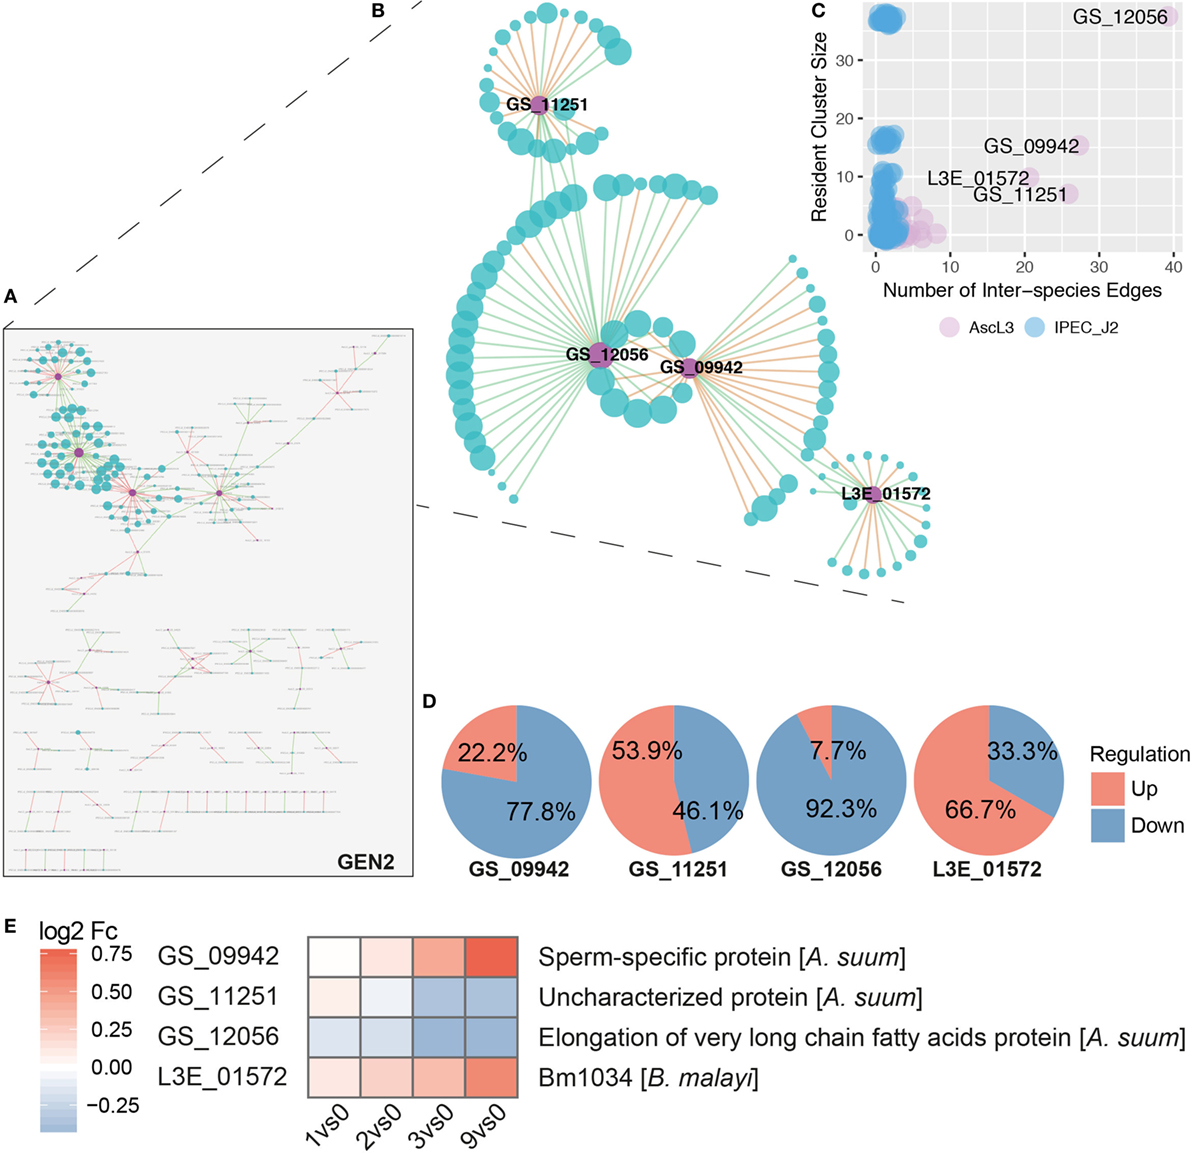
Figure 7. Inferred interspecies gene co-expression network. (A) Gene co-expression network reduced to interspecies nodes and interspecies edges (GEN2). Nodes represent co-expressed genes of S. scrofa (blue) and A. suum (violet) with node sizes corresponding to node degree (number of node interactions in GEN1). Edges between two nodes represent correlations that are either positive (green) or negative (red) with a Spearman correlation > 0.95. (B) The four most prominent interspecies clusters (Cluster 1, 2, 4, and 5, Table S2 in Supplementary Material) of the interspecies network GEN1 projected to GEN2 (i.e., without intra-species edges). (C) Number of interspecies edges versus cluster size for A. suum (AscL3, violet) and S. scrofa (IPEC-J2, blue) nodes [differentially expressed genes (DEGs)]. (D) Averaged gene regulation direction (based on max Fc) for all S. scrofa (IPEC-J2) DEGs connected to the four indicated A. suum (AscL3) genes. (E) Annotation and gene expression of the four interspecies network dominating A. suum genes over time by heatmapping the log2 Fc.
Even though more extensive interpretations are limited for the DEGs that have no functional information assigned, the prominent appearance of the four A. suum genes in the GENs and clusters render them into attractive and suitable candidates for targeted approaches.
Data Deposition
All sequencing data generated in this project are available from the NCBI Sequence Read Archive (SRA) and collectively available via the BioProject: PRJNA450204.
All analysis code is provided at https://gitlab.com/mkuhring/project_asuum.
Author Contributions
Conceptualization: FE, BR, and SH. Investigation: FE, MK, AR, and AM. Formal analysis: MK and BR. Visualization: FE and MK. Writing—original draft: FE and MK. Writing—review and editing: FE, AM, MK, AR, BR, and SH. Funding acquisition: SH and BR. Resources: AM and AR. Supervision: SH and BR.
Conflict of Interest Statement
The authors declare that the research was conducted in the absence of any commercial or financial relationships that could be construed as a potential conflict of interest.
Acknowledgments
The authors thank Christiane Palissa, Bettina Sonnenburg, Marion Müller, Yvonne Weber, Beate Anders, and Julia Hinzmann for excellent technical support and Ulrike Lodemann and Henriette Loß for their help in RNA quality assessment. The study was supported by the Federal Ministry of Education and Research (BMBF) within the consortium “InfectControl 2020,” project Art4Fun to SH and by the German Research Foundation (DFG), national research training group (GRK) 2046 to SH, and a starting grant of Freie Universität Berlin to SH and BR.
Supplementary Material
The Supplementary Material for this article can be found online at https://www.frontiersin.org/articles/10.3389/fimmu.2018.01868/full#supplementary-material.
Table S1. Differentially expressed genes pig and worm total.
Table S2. Co-expression analysis: GEN nodes, GEN edges, GEN cluster.
Table S3. Gene ontology (GO) term declination for GO filters.
Table S4. Genome of Ascaris suum L3 and IPEC-J2.
Footnotes
- ^https://gitlab.com/RKIBioinformaticsPipelines/QCumber (Accessed: March 17, 2018).
- ^https://www.bioinformatics.babraham.ac.uk/projects/fastqc/ (Accessed: March 17, 2018).
- ^https://github.com/TransDecoder/TransDecoder (Accessed: March 17, 2018).
- ^http://bioconductor.org/packages/KEGGREST/ (Accessed: March 17, 2018).
- ^http://bioconductor.org/packages/GO.db/ (Accessed: March 17, 2018).
References
1. Bethony J, Brooker S, Albonico M, Geiger SM, Loukas A, Diemert D, et al. Soil-transmitted helminth infections: ascariasis, trichuriasis, and hookworm. Lancet (2006) 367:1521–32. doi:10.1016/S0140-6736(06)68653-4
2. Hotez PJ, Alvarado M, Basáñez M-G, Bolliger I, Bourne R, Boussinesq M, et al. The global burden of disease study 2010: interpretation and implications for the neglected tropical diseases. PLoS Negl Trop Dis (2014) 8(7):e2865. doi:10.1371/journal.pntd.0002865
3. Utzinger J, Becker SL, Knopp S, Blum J, Neumayr AL, Keiser J, et al. Neglected tropical diseases: diagnosis, clinical management, treatment and control. Swiss Med Wkly (2012) 142:w13727. doi:10.4414/smw.2012.13727
4. Thamsborg SM, Nejsum P, Mejer H. Chapter 14 – Impact of Ascaris suum in livestock. In: Holland C, editor. Ascaris: The Neglected Parasite. Amsterdam: Elsevier (2013). p. 363–81.
5. Vlaminck J, Geldhof P. Chapter 16 – Diagnosis and control of Ascariasis in pigs. In: Holland C, editor. Ascaris: The Neglected Parasite. Amsterdam: Elsevier (2013). p. 395–425.
6. Leles D, Gardner SL, Reinhard K, Iñiguez A, Araujo A. Are Ascaris lumbricoides and Ascaris suum a single species? Parasit Vectors (2012) 5:42. doi:10.1186/1756-3305-5-42
7. Shao C-C, Xu M-J, Alasaad S, Song H-Q, Peng L, Tao J-P, et al. Comparative analysis of microRNA profiles between adult Ascaris lumbricoides and Ascaris suum. BMC Vet Res (2014) 10:99. doi:10.1186/1746-6148-10-99
8. Rosa BA, Jasmer DP, Mitreva M. Genome-wide tissue-specific gene expression, co-expression and regulation of co-expressed genes in adult nematode Ascaris suum. PLoS Negl Trop Dis (2014) 8:e2678. doi:10.1371/journal.pntd.0002678
9. Katakam KK, Thamsborg SM, Dalsgaard A, Kyvsgaard NC, Mejer H. Environmental contamination and transmission of Ascaris suum in Danish organic pig farms. Parasit Vectors (2016) 9:80. doi:10.1186/s13071-016-1349-0
10. Douvres FW, Tromba FG, Malakatis GM. Morphogenesis and migration of Ascaris suum larvae developing to fourth stage in swine. J Parasitol (1969) 55:689–712. doi:10.2307/3277198
11. Murrell KD, Eriksen L, Nansen P, Slotved HC, Rasmussen T. Ascaris suum: a revision of its early migratory path and implications for human ascariasis. J Parasitol (1997) 83:255–60. doi:10.2307/3284450
12. Fritz JH, Le Bourhis L, Magalhaes JG, Philpott DJ. Innate immune recognition at the epithelial barrier drives adaptive immunity: APCs take the back seat. Trends Immunol (2008) 29:41–9. doi:10.1016/j.it.2007.10.002
13. Ganz T. Epithelia: not just physical barriers. Proc Natl Acad Sci U S A (2002) 99:3357–8. doi:10.1073/pnas.072073199
14. Dawson H, Solano-Aguilar G, Beal M, Beshah E, Vangimalla V, Jones E, et al. Localized Th1-, Th2-, T regulatory cell-, and inflammation-associated hepatic and pulmonary immune responses in Ascaris suum-infected swine are increased by retinoic acid. Infect Immun (2009) 77:2576–87. doi:10.1128/IAI.00827-07
15. Masure D, Wang T, Vlaminck J, Claerhoudt S, Chiers K, Van den Broeck W, et al. The intestinal expulsion of the roundworm Ascaris suum is associated with eosinophils, intra-epithelial T cells and decreased intestinal transit time. PLoS Negl Trop Dis (2013) 7:e2588. doi:10.1371/journal.pntd.0002588
16. Nossol C, Barta-Böszörményi A, Kahlert S, Zuschratter W, Faber-Zuschratter H, Reinhardt N, et al. Comparing two intestinal porcine epithelial cell lines (IPECs): morphological differentiation, function and metabolism. PLoS One (2015) 10:e0132323. doi:10.1371/journal.pone.0132323
17. Schierack P, Nordhoff M, Pollmann M, Weyrauch KD, Amasheh S, Lodemann U, et al. Characterization of a porcine intestinal epithelial cell line for in vitro studies of microbial pathogenesis in swine. Histochem Cell Biol (2006) 125:293–305. doi:10.1007/s00418-005-0067-z
18. Westermann AJ, Barquist L, Vogel J. Resolving host–pathogen interactions by dual RNA-seq. PLoS Pathog (2017) 13(2):e1006033. doi:10.1371/journal.ppat.1006033
19. Love MI, Huber W, Anders S. Moderated estimation of fold change and dispersion for RNA-seq data with DESeq2. Genome Biol (2014) 15:550. doi:10.1186/s13059-014-0550-8
20. Köster J, Rahmann S. Snakemake—a scalable bioinformatics workflow engine. Bioinformatics (2012) 28:2520–2. doi:10.1093/bioinformatics/bts480
21. Urban JF Jr, Douvres FW, Tromba FG. A rapid method for hatching Ascaris suum eggs in vitro. Proc Helminthol Soc Wash (1981) 48(2):241–3.
22. Bolger AM, Lohse M, Usadel B. Trimmomatic: a flexible trimmer for Illumina sequence data. Bioinformatics (2014) 30:2114–20. doi:10.1093/bioinformatics/btu170
23. Wood DE, Salzberg SL. Kraken: ultrafast metagenomic sequence classification using exact alignments. Genome Biol (2014) 15:R46. doi:10.1186/gb-2014-15-3-r46
24. Kim D, Pertea G, Trapnell C, Pimentel H, Kelley R, Salzberg SL. TopHat2: accurate alignment of transcriptomes in the presence of insertions, deletions and gene fusions. Genome Biol (2013) 14:R36. doi:10.1186/gb-2013-14-4-r36
25. Trapnell C, Hendrickson DG, Sauvageau M, Goff L, Rinn JL, Pachter L. Differential analysis of gene regulation at transcript resolution with RNA-seq. Nat Biotechnol (2013) 31:46–53. doi:10.1038/nbt.2450
26. Jex AR, Liu S, Li B, Young ND, Hall RS, Li Y, et al. Ascaris suum draft genome. Nature (2011) 479:529–33. doi:10.1038/nature10553
27. Howe KL, Bolt BJ, Shafie M, Kersey P, Berriman M. WormBase ParaSite − a comprehensive resource for helminth genomics. Mol Biochem Parasitol (2017) 215:2–10. doi:10.1016/j.molbiopara.2016.11.005
28. Zerbino DR, Achuthan P, Akanni W, Amode MR, Barrell D, Bhai J, et al. Ensembl 2018. Nucleic Acids Res (2018) 46:D754–61. doi:10.1093/nar/gkx1098
29. Liao Y, Smyth GK, Shi W. featureCounts: an efficient general purpose program for assigning sequence reads to genomic features. Bioinformatics (2014) 30:923–30. doi:10.1093/bioinformatics/btt656
30. Ritchie ME, Phipson B, Wu D, Hu Y, Law CW, Shi W, et al. limma powers differential expression analyses for RNA-sequencing and microarray studies. Nucleic Acids Res (2015) 43:e47. doi:10.1093/nar/gkv007
31. Ashburner M, Ball CA, Blake JA, Botstein D, Butler H, Cherry JM, et al. Gene ontology: tool for the unification of biology. The Gene Ontology Consortium. Nat Genet (2000) 25:25–9. doi:10.1038/75556
32. The Gene Ontology Consortium. Expansion of the gene ontology knowledgebase and resources. Nucleic Acids Res (2017) 45:D331–8. doi:10.1093/nar/gkw1108
33. Rice P, Longden I, Bleasby A. EMBOSS: the European molecular biology open software suite. Trends Genet (2000) 16:276–7. doi:10.1016/S0168-9525(00)02024-2
34. Camacho C, Coulouris G, Avagyan V, Ma N, Papadopoulos J, Bealer K, et al. BLAST+: architecture and applications. BMC Bioinformatics (2009) 10:421. doi:10.1186/1471-2105-10-421
35. Conesa A, Götz S, García-Gómez JM, Terol J, Talón M, Robles M. Blast2GO: a universal tool for annotation, visualization and analysis in functional genomics research. Bioinformatics (2005) 21:3674–6. doi:10.1093/bioinformatics/bti610
36. Jones P, Binns D, Chang H-Y, Fraser M, Li W, McAnulla C, et al. InterProScan 5: genome-scale protein function classification. Bioinformatics (2014) 30:1236–40. doi:10.1093/bioinformatics/btu031
37. The UniProt Consortium. UniProt: the universal protein knowledgebase. Nucleic Acids Res (2017) 45:D158–69. doi:10.1093/nar/gkw1099
38. Kinsella RJ, Kähäri A, Haider S, Zamora J, Proctor G, Spudich G, et al. Ensembl BioMarts: a hub for data retrieval across taxonomic space. Database (Oxford) (2011) 2011:bar030. doi:10.1093/database/bar030
39. Smedley D, Haider S, Durinck S, Pandini L, Provero P, Allen J, et al. The BioMart community portal: an innovative alternative to large, centralized data repositories. Nucleic Acids Res (2015) 43:W589–98. doi:10.1093/nar/gkv350
40. Kanehisa M, Sato Y, Kawashima M, Furumichi M, Tanabe M. KEGG as a reference resource for gene and protein annotation. Nucleic Acids Res (2016) 44:D457–62. doi:10.1093/nar/gkv1070
41. Kanehisa M, Sato Y, Morishima K. BlastKOALA and GhostKOALA: KEGG tools for functional characterization of genome and metagenome sequences. J Mol Biol (2016) 428:726–31. doi:10.1016/j.jmb.2015.11.006
42. Durinck S, Spellman PT, Birney E, Huber W. Mapping identifiers for the integration of genomic datasets with the R/Bioconductor package biomaRt. Nat Protoc (2009) 4:1184–91. doi:10.1038/nprot.2009.97
43. Gomez S, Adalid-Peralta L, Palafox-Fonseca H, Cantu-Robles VA, Soberón X, Sciutto E, et al. Genome analysis of excretory/secretory proteins in Taenia solium reveals their abundance of antigenic regions (AAR). Sci Rep (2015) 5:9683. doi:10.1038/srep09683
44. Petersen TN, Brunak S, von Heijne G, Nielsen H. SignalP 4.0: discriminating signal peptides from transmembrane regions. Nat Methods (2011) 8:785–6. doi:10.1038/nmeth.1701
45. Bendtsen JD, Jensen LJ, Blom N, Von Heijne G, Brunak S. Feature-based prediction of non-classical and leaderless protein secretion. Protein Eng Des Sel (2004) 17:349–56. doi:10.1093/protein/gzh037
46. Bendtsen JD, Kiemer L, Fausbøll A, Brunak S. Non-classical protein secretion in bacteria. BMC Microbiol (2005) 5:58. doi:10.1186/1471-2180-5-58
47. Emanuelsson O, Nielsen H, Brunak S, von Heijne G. Predicting subcellular localization of proteins based on their N-terminal amino acid sequence. J Mol Biol (2000) 300:1005–16. doi:10.1006/jmbi.2000.3903
48. Krogh A, Larsson B, von Heijne G, Sonnhammer EL. Predicting transmembrane protein topology with a hidden Markov model: application to complete genomes. J Mol Biol (2001) 305:567–80. doi:10.1006/jmbi.2000.4315
49. Yu G, Wang L-G, Han Y, He Q-Y. clusterProfiler: an R package for comparing biological themes among gene clusters. OMICS (2012) 16:284–7. doi:10.1089/omi.2011.0118
50. Revelle W. psych: Procedures for Personality and Psychological Research. Evanston: Northwestern University (2018). Available from: https://CRAN.R-project.org/package=psych Version = 1.8.4
51. Shannon P, Markiel A, Ozier O, Baliga NS, Wang JT, Ramage D, et al. Cytoscape: a software environment for integrated models of biomolecular interaction networks. Genome Res (2003) 13:2498–504. doi:10.1101/gr.1239303
52. Bader GD, Hogue CWV. An automated method for finding molecular complexes in large protein interaction networks. BMC Bioinformatics (2003) 4:2. doi:10.1186/1471-2105-4-2
53. Okonechnikov K, Conesa A, García-Alcalde F. Qualimap 2: advanced multi-sample quality control for high-throughput sequencing data. Bioinformatics (2016) 32:292–4. doi:10.1093/bioinformatics/btv566
54. Zakrzewski SS, Richter JF, Krug SM, Jebautzke B, Lee I-FM, Rieger J, et al. Improved cell line IPEC-J2, characterized as a model for porcine jejunal epithelium. PLoS One (2013) 8:e79643. doi:10.1371/journal.pone.0079643
55. Fink C, Hoffmann J, Knop M, Li Y, Isermann K, Roeder T. Intestinal FoxO signaling is required to survive oral infection in Drosophila. Mucosal Immunol (2016) 9:927–36. doi:10.1038/mi.2015.112
56. Goodridge HS, Marshall FA, Else KJ, Houston KM, Egan C, Al-Riyami L, et al. Immunomodulation via novel use of TLR4 by the filarial nematode phosphorylcholine-containing secreted product, ES-62. J Immunol (2005) 174:284–93. doi:10.4049/jimmunol.174.1.284
57. Kane CM, Cervi L, Sun J, McKee AS, Masek KS, Shapira S, et al. Helminth antigens modulate TLR-initiated dendritic cell activation. J Immunol (2004) 173:7454–61. doi:10.4049/jimmunol.173.12.7454
58. MacDonald AS, Maizels RM. Alarming dendritic cells for Th2 induction. J Exp Med (2008) 205:13–7. doi:10.1084/jem.20072665
59. Perrigoue JG, Marshall F, Artis D. On the hunt for helminths: innate immune cells in the recognition and response to helminth parasites. Cell Microbiol (2008) 10:1757–64. doi:10.1111/j.1462-5822.2008.01174.x
60. Cohen-Kedar S, Baram L, Elad H, Brazowski E, Guzner-Gur H, Dotan I. Human intestinal epithelial cells respond to β-glucans via Dectin-1 and Syk. Eur J Immunol (2014) 44:3729–40. doi:10.1002/eji.201444876
61. Patel S, McCormick BA. Mucosal inflammatory response to Salmonella typhimurium infection. Front Immunol (2014) 5:311. doi:10.3389/fimmu.2014.00311
62. Aprianto R, Slager J, Holsappel S, Veening J-W. Time-resolved dual RNA-seq reveals extensive rewiring of lung epithelial and pneumococcal transcriptomes during early infection. Genome Biol (2016) 17:198. doi:10.1186/s13059-016-1054-5
63. Zaph C, Troy AE, Taylor BC, Berman-Booty LD, Guild KJ, Du Y, et al. Epithelial-cell-intrinsic IKK-β expression regulates intestinal immune homeostasis. Nature (2007) 446:552–6. doi:10.1038/nature05590
64. Gerbe F, Sidot E, Smyth DJ, Ohmoto M, Matsumoto I, Dardalhon V, et al. Intestinal epithelial tuft cells initiate type 2 mucosal immunity to helminth parasites. Nature (2016) 529:226–30. doi:10.1038/nature16527
65. Howitt MR, Lavoie S, Michaud M, Blum AM, Tran SV, Weinstock JV, et al. Tuft cells, taste-chemosensory cells, orchestrate parasite type 2 immunity in the gut. Science (2016) 351:1329–33. doi:10.1126/science.aaf1648
66. McSorley HJ, Blair NF, Smith KA, McKenzie ANJ, Maizels RM. Blockade of IL-33 release and suppression of type 2 innate lymphoid cell responses by helminth secreted products in airway allergy. Mucosal Immunol (2014) 7(5):1068–78. doi:10.1038/mi.2013.123
67. Kakkar R, Hei H, Dobner S, Lee RT. Interleukin 33 as a mechanically responsive cytokine secreted by living cells. J Biol Chem (2012) 287:6941–8. doi:10.1074/jbc.M111.298703
68. Günzel D, Yu ASL. Claudins and the modulation of tight junction permeability. Physiol Rev (2013) 93:525–69. doi:10.1152/physrev.00019.2012
69. Günzel D, Fromm M. Claudins and other tight junction proteins. Compr Physiol (2012) 2:1819–52. doi:10.1002/cphy.c110045
70. Loukas A, Maizels RM. Helminth C-type lectins and host–parasite interactions. Parasitol Today (2000) 16:333–9. doi:10.1016/S0169-4758(00)01704-X
71. Cox GN, Staprans S, Edgar RS. The cuticle of Caenorhabditis elegans: II. Stage-specific changes in ultrastructure and protein composition during postembryonic development. Dev Biol (1981) 86:456–70. doi:10.1016/0012-1606(81)90204-9
72. Page AP, Stepek G, Winter AD, Pertab D. Enzymology of the nematode cuticle: a potential drug target? Int J Parasitol Drugs Drug Resist (2014) 4:133–41. doi:10.1016/j.ijpddr.2014.05.003
73. Winter AD, McCormack G, Page AP. Protein disulfide isomerase activity is essential for viability and extracellular matrix formation in the nematode Caenorhabditis elegans. Dev Biol (2007) 308:449–61. doi:10.1016/j.ydbio.2007.05.041
74. Winter AD, McCormack G, Myllyharju J, Page AP. Prolyl 4-hydroxlase activity is essential for development and cuticle formation in the human infective parasitic nematode Brugia malayi. J Biol Chem (2013) 288:1750–61. doi:10.1074/jbc.M112.397604
75. Coakley G, Buck AH, Maizels RM. Host parasite communications – messages from helminths for the immune system. Mol Biochem Parasitol (2016) 208:33–40. doi:10.1016/j.molbiopara.2016.06.003
76. Cooper D, Eleftherianos I. Parasitic nematode immunomodulatory strategies: recent advances and perspectives. Pathogens (2016) 5(3):58. doi:10.3390/pathogens5030058
77. Ebner F, Schwiertz P, Steinfelder S, Pieper R, Zentek J, Schütze N, et al. Pathogen-reactive T helper cell analysis in the pig. Front Immunol (2017) 8:565. doi:10.3389/fimmu.2017.00565
78. Hewitson JP, Grainger JR, Maizels RM. Helminth immunoregulation: the role of parasite secreted proteins in modulating host immunity. Mol Biochem Parasitol (2009) 167:1–11. doi:10.1016/j.molbiopara.2009.04.008
79. Yang Y, Wen YJ, Cai YN, Vallée I, Boireau P, Liu MY, et al. Serine proteases of parasitic helminths. Korean J Parasitol (2015) 53:1–11. doi:10.3347/kjp.2015.53.1.1
80. Williamson AL, Brindley PJ, Abbenante G, Prociv P, Berry C, Girdwood K, et al. Cleavage of hemoglobin by hookworm cathepsin D aspartic proteases and its potential contribution to host specificity. FASEB J (2002) 16:1458–60. doi:10.1096/fj.02-0181fje
81. Yatsuda AP, Bakker N, Krijgsveld J, Knox DP, Heck AJR, de Vries E. Identification of secreted cysteine proteases from the parasitic nematode Haemonchus contortus detected by biotinylated inhibitors. Infect Immun (2006) 74:1989–93. doi:10.1128/IAI.74.3.1989-1993.2006
82. Bottazzi ME. The human hookworm vaccine: recent updates and prospects for success. J Helminthol (2015) 89:540–4. doi:10.1017/S0022149X15000206
83. Hotez PJ, Diemert D, Bacon KM, Beaumier C, Bethony JM, Bottazzi ME, et al. The human hookworm vaccine. Vaccine (2013) 31:B227–32. doi:10.1016/j.vaccine.2012.11.034
84. Seid CA, Curti E, Jones RM, Hudspeth E, Rezende W, Pollet J, et al. Expression, purification, and characterization of the Necator americanus aspartic protease-1 (Na-APR-1 (M74)) antigen, a component of the bivalent human hookworm vaccine. Hum Vaccin Immunother (2015) 11:1474–88. doi:10.1080/21645515.2015.1036207
85. Hotez PJ, Bethony JM, Diemert DJ, Pearson M, Loukas A. Developing vaccines to combat hookworm infection and intestinal schistosomiasis. Nat Rev Microbiol (2010) 8:814. doi:10.1038/nrmicro2438
86. Brown A, Girod N, Billett EE, Pritchard DI. Necator americanus (human hookworm) aspartyl proteinases and digestion of skin macromolecules during skin penetration. Am J Trop Med Hyg (1999) 60:840–7. doi:10.4269/ajtmh.1999.60.840
87. Jolodar A, Fischer P, Büttner DW, Miller DJ, Schmetz C, Brattig NW. Onchocerca volvulus: expression and immunolocalization of a nematode cathepsin D-like lysosomal aspartic protease. Exp Parasitol (2004) 107:145–56. doi:10.1016/j.exppara.2004.06.006
88. Mello LV, O’Meara H, Rigden DJ, Paterson S. Identification of novel aspartic proteases from Strongyloides ratti and characterisation of their evolutionary relationships, stage-specific expression and molecular structure. BMC Genomics (2009) 10:611. doi:10.1186/1471-2164-10-611
89. Wang T, Van Steendam K, Dhaenens M, Vlaminck J, Deforce D, Jex AR, et al. Proteomic analysis of the excretory-secretory products from larval stages of Ascaris suum reveals high abundance of glycosyl hydrolases. PLoS Negl Trop Dis (2013) 7:e2467. doi:10.1371/journal.pntd.0002467
90. Starr CR, Engleberg NC. Role of hyaluronidase in subcutaneous spread and growth of group A Streptococcus. Infect Immun (2006) 74:40–8. doi:10.1128/IAI.74.1.40-48.2006
91. Rhoads ML, Fetterer RH, Urban JF. Release of hyaluronidase during in vitro development of Ascaris suum from the third to fourth larval stage. Parasitol Res (2001) 87:693–7. doi:10.1007/s004360100410
92. Hotez PJ, Narasimhan S, Haggerty J, Milstone L, Bhopale V, Schad GA, et al. Hyaluronidase from infective Ancylostoma hookworm larvae and its possible function as a virulence factor in tissue invasion and in cutaneous larva migrans. Infect Immun (1992) 60:1018–23.
93. Bower MA, Constant SL, Mendez S. Necator americanus: the Na-ASP-2 protein secreted by the infective larvae induces neutrophil recruitment in vivo and in vitro. Exp Parasitol (2008) 118:569–75. doi:10.1016/j.exppara.2007.11.014
94. Murray J, Gregory WF, Gomez-Escobar N, Atmadja AK, Maizels RM. Expression and immune recognition of Brugia malayi VAL-1, a homologue of vespid venom allergens and Ancylostoma secreted proteins. Mol Biochem Parasitol (2001) 118:89–96. doi:10.1016/S0166-6851(01)00374-7
95. Ballouz S, Verleyen W, Gillis J. Guidance for RNA-seq co-expression network construction and analysis: safety in numbers. Bioinformatics (2015) 31:2123–30. doi:10.1093/bioinformatics/btv118
96. van Dam S, Võsa U, van der Graaf A, Franke L, de Magalhães JP. Gene co-expression analysis for functional classification and gene-disease predictions. Brief Bioinform (2017) 19(4):575–92. doi:10.1093/bib/bbw139
Keywords: host–pathogen, parasitic nematode, IPEC-J2, Ascaris suum, dual-species, RNA sequencing, transcriptomics, epithelial communication
Citation: Ebner F, Kuhring M, Radonić A, Midha A, Renard BY and Hartmann S (2018) Silent Witness: Dual-Species Transcriptomics Reveals Epithelial Immunological Quiescence to Helminth Larval Encounter and Fostered Larval Development. Front. Immunol. 9:1868. doi: 10.3389/fimmu.2018.01868
Received: 01 May 2018; Accepted: 30 July 2018;
Published: 15 August 2018
Edited by:
Wenbin Tuo, Beltsville Agricultural Research Center, Agricultural Research Service (USDA), United StatesReviewed by:
Alan L. Scott, Johns Hopkins University, United StatesWilliam Horsnell, University of Cape Town, South Africa
Copyright: © 2018 Ebner, Kuhring, Radonić, Midha, Renard and Hartmann. This is an open-access article distributed under the terms of the Creative Commons Attribution License (CC BY). The use, distribution or reproduction in other forums is permitted, provided the original author(s) and the copyright owner(s) are credited and that the original publication in this journal is cited, in accordance with accepted academic practice. No use, distribution or reproduction is permitted which does not comply with these terms.
*Correspondence: Friederike Ebner, friederike.ebner@fu-berlin.de