 Hyunju In1,2
 Ji Soo Park1,2
 Hyun Soo Shin1,2
 Seul Hye Ryu1,2,3
 Moah Sohn1,2
 Wanho Choi1,2
 Sejung Park1,2
 Soomin Hwang1,2Jeyun Park4
 Lihua Che2,4
 Tae-Gyun Kim4
 Min Kyung Chu5*†
 Hye Young Na1,5*†
 Chae Gyu Park1,3,6*†
- 1Laboratory of Immunology, Severance Biomedical Science Institute, Yonsei University College of Medicine, Seoul, Republic of Korea
- 2Brain Korea 21 PLUS/FOUR Project for Medical Science, Yonsei University College of Medicine, Seoul, Republic of Korea
- 3Heart-Immune-Brain Network Research Center, Department of Life Science, Ewha Womans University, Seoul, Republic of Korea
- 4Department of Dermatology, Severance Hospital, Cutaneous Biology Research Institute, Yonsei University College of Medicine, Seoul, Republic of Korea
- 5Department of Neurology, Severance Hospital, Yonsei University College of Medicine, Seoul, Republic of Korea
- 6Laboratory of Dendritic Cell Immunology, The Good Capital Institute for Immunology, Seoul, Republic of Korea
Dendritic cells (DCs) are readily generated from the culture of mouse bone marrow (BM) treated with either granulocyte macrophage-colony stimulating factor (GM-CSF) or FMS-like tyrosine kinase 3 ligand (FLT3L). CD11c+MHCII+ or CD11c+MHCIIhi cells are routinely isolated from those BM cultures and generally used as in vitro-generated DCs for a variety of experiments and therapies. Here, we examined CD11c+ cells in the BM culture with GM-CSF or FLT3L by staining with a monoclonal antibody 2A1 that is known to recognize mature or activated DCs. Most of the cells within the CD11c+MHCIIhi DC gate were 2A1+ in the BM culture with GM-CSF (GM-BM culture). In the BM culture with FLT3L (FL-BM culture), almost of all the CD11c+MHCIIhi cells were within the classical DC2 (cDC2) gate. The analysis of FL-BM culture revealed that a majority of cDC2-gated CD11c+MHCIIhi cells exhibited a 2A1-CD83-CD115+CX3CR1+ phenotype, and the others consisted of 2A1+CD83+CD115-CX3CR1- and 2A1-CD83-CD115-CX3CR1- cells. According to the antigen uptake and presentation, morphologies, and gene expression profiles, 2A1-CD83-CD115-CX3CR1- cells were immature cDC2s and 2A1+CD83+CD115-CX3CR1- cells were mature cDC2s. Unexpectedly, however, 2A1-CD83-CD115+CX3CR1+ cells, the most abundant cDC2-gated MHCIIhi cell subset in FL-BM culture, were non-DCs. Adoptive cell transfer experiments in the FL-BM culture confirmed that the cDC2-gated MHCIIhi non-DCs were precursors to cDC2s, i.e., MHCIIhi pre-cDC2s. MHCIIhi pre-cDC2s also expressed the higher level of DC-specific transcription factor Zbtb46 as similarly as immature cDC2s. Besides, MHCIIhi pre-cDC2s were generated only from pre-cDCs and common DC progenitor (CDP) cells but not from monocytes and common monocyte progenitor (cMoP) cells, verifying that MHCIIhi pre-cDC2s are close lineage to cDCs. All in all, our study identified and characterized a new cDC precursor, exhibiting a CD11c+MHCIIhiCD115+CX3CR1+ phenotype, in FL-BM culture.
Introduction
Antigen presenting cells (APCs) such as dendritic cells (DCs) and macrophages (Macs) are important players mediating innate3and adaptive immunity. Particularly, DCs are potent professional APCs that can stimulate naive T cells to proliferate and differentiate efficiently (1–3). Classical DCs (cDCs) are derived from common DC progenitor (CDP) cells via pre-cDCs, while plasmacytoid DCs (pDCs) develop from both CDPs and common lymphoid progenitor (CLP) cells (4). CDPs and common monocyte progenitor (cMoP) cells are derived from monocyte and DC progenitor (MDP) cells (5, 6). Monocytes, originating from cMoPs, can also be converted into DCs, i.e., monocyte-derived DCs (Mo-DCs) by in vitro treatment with granulocyte macrophage-colony stimulating factor (GM-CSF) and IL-4 as well as during inflammatory conditions in vivo (7).
CD11c+ DCs efficiently develop after culture of bone marrow (BM) with GM-CSF or FLT3 ligand (FLT3L) for 6 to 10 days (8–10), which has been widely used as in vitro-generated BM-derived DCs (BM-DCs) in various experiments. Apparently, however, not all the CD11c+ cells generated from those BM cultures are a homogeneous population. In the BM culture with GM-CSF (GM-BM culture), DCs and Macs are abundantly found among the CD11c+ cells. While MDPs, cMoPs, and monocytes differentiate into both DCs and Macs, CDPs preferentially generate DCs in GM-BM culture (11). Meanwhile, in the CD11c+ cells generated from the BM culture with FLT3L (FL-BM culture), a variety of DC subsets such as pDCs, classical type 1 DCs (cDC1s) and cDC2s are found (10).
2A1 is one of the monoclonal antibodies (mAbs) generated by early efforts to produce new reagents that specifically detected DCs in GM-BM culture as well as in lymphoid tissues in situ (8, 12–15). The cells detected by mAb 2A1, i.e., 2A1+ cells are abundantly present in the T cell rich regions of lymph nodes, spleen, and Peyer’s patch, suggesting that 2A1 marks a subset of DCs closely located near T cells in lymphoid tissues (16–18). Analysis of GM-BM culture also revealed that only the MHCIIhi cells were detected by mAb 2A1 (8, 14). Based on those observations, 2A1+ DCs have been considered as activated or mature DCs (19). However, unlike other well-characterized surface markers for DCs, publications examining 2A1+ DCs have been rare because mAb 2A1 recognizes an unknown antigen localized intracellularly in DCs. As a result, the function of 2A1 antigen (hereafter 2A1) in DCs is still unknown.
Here, we set out to examine the expression of 2A1 in CD11c+ cells from GM-BM and FL-BM cultures. All the DCs in GM-BM culture (GM-DCs) highly expressed 2A1, whereas only small fractions of cDC-gated cell subsets in FL-BM culture were 2A1+. In FL-BM culture, most of those 2A1+ cells were found within the cells gated for cDC2 subset expressing high levels of MHC class II molecules (MHCIIhi), and more than a half of CD11c+MHCIIhi cDC2-gated cells were 2A1-. Up to now, together with GM-DCs, CD11c+MHCII+ cells in FL-BM culture have been widely used as in vitro-generated DCs (20–22). Surprisingly, however, we found only a half of the CD11c+MHCIIhi cells in FL-BM culture were DCs. The remaining half of the CD11c+MHCIIhi cells in FL-BM culture were not DCs but DC precursor cells which were poor at antigen presentation. In this report, we identified and characterized a novel DC precursor population, which displayed a CD11c+MHCIIhiCD115+CX3CR1+ phenotype, in FL-BM culture.
Materials and methods
Animals
C57BL/6 mice were purchased from the Orient Bio (Seongnam, Korea). C57BL/6-Tg(TcraTcrb)1100Mjb/J (OT-1), B6.Cg-Tg(TcraTcrb)425Cbn/J (OT-2), B6.SJL-PtprcaPepcb/BoyJ (CD45.1), and B6.129S6(C)-Zbtb46tm1.1Kmm/J (Zbtb46-gfp) mice were obtained from the Jackson Laboratory (Bar Harbor, ME). CD45.1+ OT-1 and CD45.1+ OT-2 mice were bred in house. Animal care and experiments were carried out according to the guidelines and protocols set and approved by the Institutional Animal Care and Use Committee of the Yonsei University College of Medicine (approval numbers 2016-0040, 2017-0001, 2019-0024, 2019-0180, 2020-0003, 2021-0010).
Cells, antibodies, and reagents
Chinese hamster ovary (CHO) cells were purchased from GIBCO (CHO-S cells; Thermo Fisher Scientific, Waltham, MA). Cells were cultured in DMC7 medium (23, 24) composed of DMEM containing L-glutamine, high glucose, and pyruvate (HyClone, Logan, UT) supplemented with 7% fetal bovine serum (FBS; HyClone) and 1× solutions of non-essential amino acids (HyClone), antibiotic-antimycotic (HyClone), and primocin (InvivoGen, San Diego, CA). The following fluorochrome-conjugated mAbs were purchased from BioLegend (San Diego, CA): anti-CD3 (17A2), anti-CD4 (GK1.5), anti-CD8a (53-6.7), anti-CD11b (M1/70), anti-CD11c (N418), anti-CD14 (Sa14-2), anti-CD16/32 (93), anti-CD19 (6D5), anti-CD24 (M1/69), anti-CD45.1 (A20), anti-CD45.2 (104), anti-B220/CD45R (RA3-6B2), anti-TCRβ (H57-597), anti-TCR Vα2 (B20.1), anti-CD62L (MEL-14), anti-CD64 (X54-5/7.1), anti-CD80 (16-10A1), anti-CD83 (Michel-19), anti-CD86 (GL-1), anti-CD103 (2E7), anti-CD115 (AFS98), anti-CD117 (2B8), anti-CD135 (A2F10), anti-CD172α (P84), anti-CD205/DEC205 (NLDC145), anti-CD206 (C068C2), anti-CD301a (LOM-8.7), anti-CD301b (URA-1), anti-CCR9 (CW-1.2), anti-PD-1 (2F.1A12), anti-PD-L1 (10F.9G2), anti-PD-L2 (TY25), anti-BTLA (6A6), anti-CCR2 (475301), anti-CCR3 (J073E5), anti-CCR7 (4B12), anti-CXCR5 (L138D7), anti-CX3CR1 (SA011F11), anti-CD370/Clec9a/DNGR1 (7H11), anti-H-2 (anti- MHCI; M1/42), anti-I-A/I-E (anti-MHCII; M5/114.15.2), anti-H2-Kb bound to SIINFEKL (25-D1.16), anti-NK1.1 (PK136), anti-CD49b (DX5), anti-Ly6C (HK1.4), anti-Ly6G (1A8), anti-Gr1 (RB6-8C5), anti-F4/80 (BM8), anti-TER119 (TER-119), and anti-CD209a (MMD3). Anti-CD209b (22D1) was purchased from from Invitrogen (Carlsbad, CA). Anti-Zbtb46 (U4-1374) antibody was purchased from BD Biosciences (San Jose, CA). CellTrace™ CFSE and CellTrace™ violet (CTV) Cell Proliferation Kits and LIVE/DEAD™ Fixable Yellow, Blue, and Far Red Dead Cell Stain Kits were purchased from Thermo Fisher Scientific (Seoul, Korea) and used according to the manufacturer’s instructions. FITC-conjugated ovalbumin (FITC-OVA) was purchased from Invitrogen. Fluoresbrite® yellow green microsphere (YGM) beads (1.00 μm; Polysciences, Warrington, PA) were purchased and sterilized by washing according to the manufacturer’s instruction. Ovalbumin (OVA, grade V) and lipopolysaccharide (LPS) were purchased from Sigma-Aldrich (St. Louis, MO). Mouse GM-CSF and FLT3L were produced and purified in house as described previously (23, 24).
Antibody purification and labeling
Supernatants were collected from the mAb hybridoma cultures of 2A1 and L5 (an isotype control for 2A1) (25) in DMC7 medium and filtrated before purification by affinity chromatography with protein G bead (Pierce, Rockford, IL; GE Healthcare, Piscataway, NJ). For those hybridoma cultures, DMC7 medium was prepared with ultra-low IgG FBS (Thermo Fisher Scientific) to remove bovine IgG and increase the purity of those mAbs (Supplementary Figure 1). Then, mAbs were concentrated using Amicon® Ultra-4 Centrifugal Filter (Millipore, Burlington, MA) before quantification. Purified mAbs were fluorescently labeled using Alexa Fluor™ 488 Antibody Labeling Kit (Invitrogen) or Alexa Fluor™ 647 Antibody Labeling Kit (Invitrogen) according to the manufacturer’s instructions.
Bone marrow culture
Mice were euthanized by asphyxiation in a CO2 chamber. Bone marrow cells were isolated from femurs and tibias of C57BL/6 mice at 8-14 weeks of age under sterile conditions, as described (9, 26–28), with some modifications. Briefly, femurs and tibias were detached from mice and purified from the surrounding muscle tissue by rubbing with sterile gauze followed by disinfecting in 70% ethanol for 3 minutes and washing with fresh DMEM (8). Next, the marrow was isolated from the bones by flushing using a syringe with a 23-gauge needle and disintegrated by vigorous pipetting. After lysing erythrocytes with RBC lysis buffer (BioLegend), single cell suspension of BM cells was generated by sieving through cell strainers (100 μm; SPL Life Sciences, Pocheon, Korea), counted, and cultured at 1×10⁶ cells per well for GM-BM culture or at 2×10⁶ cells per well for FL-BM culture in DMC7 medium containing GM-CSF or FLT3L with 24-well tissue culture plates for 8-10 days, as described previously (26, 27, 29). Specifically, 0.5 μg/ml of GM-CSF and 10 μg/ml of FLT3L were used for GM-BM and FL-BM cultures, respectively. During the culture, half of the medium in each well was carefully removed and replenished with fresh DMC7 medium containing GM-CSF or FLT3L every 2 days until harvest for use in subsequent experiments.
Flow cytometry
Single cell suspension was prepared from mouse tissues or cultures and incubated with Fc receptor blocking mAb 2.4G2 for 20 minutes at 4°C followed by washing with FACS buffer (DPBS containing 2% FBS, 2mM EDTA, and 0.1% sodium azide). Then, cells were incubated with appropriate cocktails of fluorochrome-conjugated mAbs and dead cell staining dye for 30 minutes at 4°C. For intracellular staining, cells were stained for surface markers before fixation and permeabilization followed by staining intracellular molecules according to the manufacturer’s instructions (Fixation Buffer/Intracellular Staining Permeabilization Wash Buffer, BioLegend). Multiparameter analysis of each sample was performed on LSRFortessa™ flow cytometer (BD Biosciences) and flow cytometric isolation of cells was performed on BD FACSAria™ II cell sorter (BD Biosciences) at the Flow Cytometry Core Facility of the Yonsei University College of Medicine. Collected data were analyzed with FlowJo software (BD Biosciences).
Treatment of TLR agonists
Graded doses of LPS (Sigma-Aldrich) were added into BM cultures at culture day 8. After 18 hours of incubation, cells were harvested, washed, and analyzed using flow cytometry. LPS at a final concentration of 1 μg/ml was used for in vitro stimulation of DCs unless otherwise noted. BM cultures at day 8 were also treated with CpG (1 μM of ODN 2216; TLRGRADE®, Enzo Life Science, Farmingdale, NY) or poly I:C HMW (1 μg/ml; InvivoGen) for 18 hours.
Antigen uptake
Cultures of BM were treated with FITC-labeled OVA (100 μg/ml) or YGM beads (0.000675%) for 1 hour at 37°C or at 4°C as control. Then, each sample was washed twice with cold DMEM before being stained with appropriate reagents for flow cytometric analysis as described above.
Generation of CHO cells expressing OVA antigens intracellularly
CHO/OT.EGFP cells, stable CHO cell-lines expressing OVA antigens, were generated as described previously (30–32). In brief, a cDNA construct encoding the open reading frame of OT.EGFP (GenBank accession number OR405547) expressing a fusion protein between enhanced green fluorescent protein (EGFP) and OVA antigen epitope peptides (i.e., OT-1 and OT-2) were cloned by PCR, sequenced, and inserted into the pCMV mammalian expression vector (Clontech, TaKaRa Bio, Shiga, Japan). Then, the stable CHO cells were generated by transfection with pCMV- OT.EGFP by Lipofectamine™ 2000 reagent (Thermo Fisher Scientific) followed by selection of G418 (1.5 mg/ml) in DMC7 medium.
Antigen presentation and T cell proliferation
Assays for antigen presentation and T cell proliferation were performed as described previously (33). In brief, APCs were pulsed with 100 μg/ml of OVA on culture plates at 37°C for 30 minutes before being harvested by gentle pipetting and washing. Then, specific populations of APCs were isolated with flow cytometric sorter as described above. The enrichment of naive CD8+ OT-1 and CD4+ OT-2 T cells from the splenocytes of OT-1 and OT-2 mice respectively were described previously (33, 34). Naive OT-1 and OT-2 T cells were labeled with CFSE or CTV at 37°C for 10 minutes and washed with DPBS. Then, T cells (2.5×10⁴) were cultured with graded doses of APCs in 96-well round-bottom cell culture plates with DMC7 medium containing 57.2 μM β-mercaptoethanol (Sigma-Aldrich) for 3-5 days. The proliferation of T cells was assessed by the dilution of CFSE or CTV. Unpulsed APCs were co-cultured with OT-1 or OT-2 T cells in the presence of OVA (10 μg/ml) with/without LPS (1 μg/ml). For the cross-presentation assays with cell-associated antigens, 2.5×10⁴ CTV-labeled naive CD8+ OT-1 T cells were co-cultured with APCs plus heat-treated control CHO cells or CHO/OT.EGFP cells (1×10⁵ cells/well) for 4 days. Apoptotic CHO cells were prepared by treatment with heat at 45°C for 30 minutes. Then, the heat-treated CHO cells were plated in 24-well plates overnight before being used in the subsequent co-culture experiments. For the maturation of FL-cDC1s, media containing 20 ng/ml of GM-CSF were used for the co-culture of APCs and T cells.
Detection of MHC class I molecules complexed with OVA epitope peptide pOT-1
At culture day 7 or 8, FL-BM culture were incubated in the presence of 100 μg/ml of endotoxin-free OVA (EndoFit Ovalbumin, InvivoGen) or 1 μg/ml of OT-1 peptide (pOT-1, SIINFEKL) for 18 hours at 37°C. For a control, 1 μg/ml of pOT-1 was added on culture for 1 hour on ice. To determine the surface levels of H2-Kb bound to pOT-1, cells were incubated with mAb 25-D1.16 on ice for 30 min, washed, and then analyzed by flow cytometry.
Culture of BM precursor and progenitor cells
CDPs were isolated by gating for MHCII-CD3-CD11b-CD11c-CD19-CD49b-Sca-1-Ly6C-Ly6G-B220-IL-7Rα-CD115+CD117+CD135+ cells (11, 35, 36); pre-cDCs were isolated by gating for MHCII-CD3-CD11b-CD19-CD49b-CD115-CD117-Sca-1-Ly6C-Ly6G-CD11c+CD135+ cells (37, 38); cMoPs were isolated by gating for MHCII-CD3-CD11b-CD11c-CD19-CD49b-CD135-Sca-1-NK1.1-B220-TER119-Ly6G-CD16/32+CD34+CD115+CD117+Ly6C+ cells (5, 11, 39); monocytes were isolated by gating for MHCII-CD3-CD11c-CD19-CD49b-CD135-CD117-Sca-1-NK1.1-Ly6G-CD11b+CD115+Ly6Chi cells (5, 11). Each population of precursor or progenitor cells were isolated from the BM of CD45.2 mice with a flow cytometric cell sorter and cultured at the densities of 5×10³ for CDPs, 2×10⁴ for pre-cDCs, 1×10⁴ for cMoPs, and 1×10⁵ for monocytes, respectively, per well where whole BM cells from CD45.1 mice were co-cultured as filler cells at a density of 2×10⁶ per well in DMC7 medium containing FLT3L for 6 or 8 days. LPS (1 μg/ml) was added into the culture at day 5. After 18 hours of LPS treatment, cells were harvested for flow cytometric analysis.
Microscopic analysis
On the day 8 or 9 of BM culture, cells were harvested by gentle pipetting and stained with appropriate fluorochrome-conjugated antibodies. Each subset of the cells was isolated according to the appropriate gating strategies. Then, the isolated cells were cultured with DMC7 medium containing GM-CSF or FLT3L in 96- or 48-well flat-bottom cell culture plates overnight. Phase-contrast observations of cultures were made by means of eclipse TS100 microscope (Nikon, Tokyo, Japan) at 600× magnification. Before staining, 1×10⁵ cells were prepared on slides by cytocentrifugation (Cytospin 4, Thermo scientific) at 650 rpm for 5 minutes. For Giemsa staining, cells were visualized by Diff-Quik (Sysmex, Kobe, Japan) staining of cytospin preparations. The images were acquired with IX73 fluorescent inverted microscopes (Olympus, Tokyo, Japan). Data analysis was conducted using ImageJ.
Transmission electron microscopy
Cells were fixed with 2% Glutaraldehyde and 2% Paraformaldehyde in 0.1M phosphate buffer (pH 7.4) for 12 hours; washed with 0.1M phosphate buffer; post-fixed with 1% OsO4 in 0.1M phosphate buffer for 2 hours; dehydrated with a series of ascending ethanol (50, 60, 70, 80, 90, 95, 100, and 100%) for 10 minutes each; infiltrated with propylene oxide for 10 minutes. Then, specimens were embedded with a Poly/Bed 812 kit (Polysciences) and polymerized in an electron microscope oven (TD-700, DOSAKA, Japan) at 65°C for 12 hours. The block was cut with a diamond knife in the ultramicrotome into 200 nm semi–thin section and stained toluidine blue for observation of optical microscope. The region of interest was then cut into 80 nm thin sections using the ultramicrotome, placed on copper grids, double stained with 3% uranyl acetate for 30 minutes and 3% lead citrate for 7 minutes, and imaged with a transmission electron microscopy (JEM-1011, JEOL, Tokyo, Japan) at the acceleration voltage of 80 kV equipped with a Megaview III CCD camera (Soft Imaging System, Germany).
RNA sequencing and analysis
Cell subsets in the BM cultures were stained and sorted according to the suitable gating strategies as described above. Total RNA was extracted twice for each cell subset by MiniBEST universal RNA extraction kit (TaKaRa Bio) from at least 1×10⁵ cells. However, while cDC1-gated cells were fewer than 20% of the total cDC-gated cells in FL-BM culture, the number of CD83+ cDC1s were significantly less than 10% of the cDC1-gated cells. As a result, we were able to obtain an enough amount and high quality of RNAs only once after many trials and errors of sorting the live CD83+ cDC1s from FL-BM culture. Subsequent RNA sequencing (RNA-seq) procedure and analysis were performed by Macrogen (Seoul, Korea) as follows. Reverse transcription of mRNA and generation of cDNA library were carried out with SMARTer Ultra low input RNA library kit. Sequencing was performed with Illumina NovaSeq (Illumina, San Diego, CA). The raw reads from the sequencer were preprocessed to remove low quality and adapter sequence before analysis to align the processed reads to the Mus musculus (mm10) using HISAT v2.1.0. After alignment, StringTie v1.3.4d was used to measure the relative abundances of genes in FPKM (Fragments Per Kilobase of exon per Million mapped fragments). Multidimensional scaling method was used to visualize the similarities among samples. The larger the dissimilarity between two samples, the further apart the points representing the experiments in the picture should be. Euclidean distance was applied as the measure of dissimilarity. Hierarchical clustering analysis was also performed using complete linkage and Euclidean distance as a measure of similarity to display the expression patterns of differentially expressed transcripts which were satisfied with |fold change|≥2. Data analysis and visualization of differentially expressed genes was conducted using GraphPad Prism 8 (GraphPad Software, La Jolla, CA) R 3.5.1 (https://www.r-project.org), Multiple Experiment Viewer software (MeV), and Morpheus software (https://software.broadinstitute.org/morpheus). Venn diagram analysis was performed using the InteractiVenn website (http://www.interactivenn.net). Enrichment analyses were performed with GSEA software (Broad Institute) on the gene set curated in the Molecular Signature Database (MSigDb).
Statistical analysis
Experiments with multiplicate samples were analyzed for statistical comparisons between different groups using with ANOVA and unpaired Student’s t-test using GraphPad Prism 5 (GraphPad Software, La Jolla, CA). Statistical significance is denoted by the p values equal or below 0.05 (*), 0.01 (**), and 0.001 (***). Data were plotted for graphs with GraphPad Prism 5 and GraphPad Prism 8.
Results
2A1+ cells are significantly generated in both GM-BM and FL-BM cultures
Highly pure mAb 2A1 was prepared (Supplementary Figure 1) and the detection of 2A1 required the permeabilization of cells to stain with the mAb (Supplementary Figure 2) indicating the intracellular localization of 2A1, as reported previously (8). We examined the expression of 2A1 among the cells in GM-BM and FL-BM cultures at various time points (Figures 1A, B; Supplementary Figure 3). 2A1+ cells were hardly found in the BM, but became readily detectable among the MHCIIhi cells of both GM-BM and FL-BM cultures in 2 to 3 days after the culture. After a week of culture, around 15% of the CD11c+ cells in GM-BM culture and around 10% of CD11c+ cells in FL-BM culture became 2A1+.
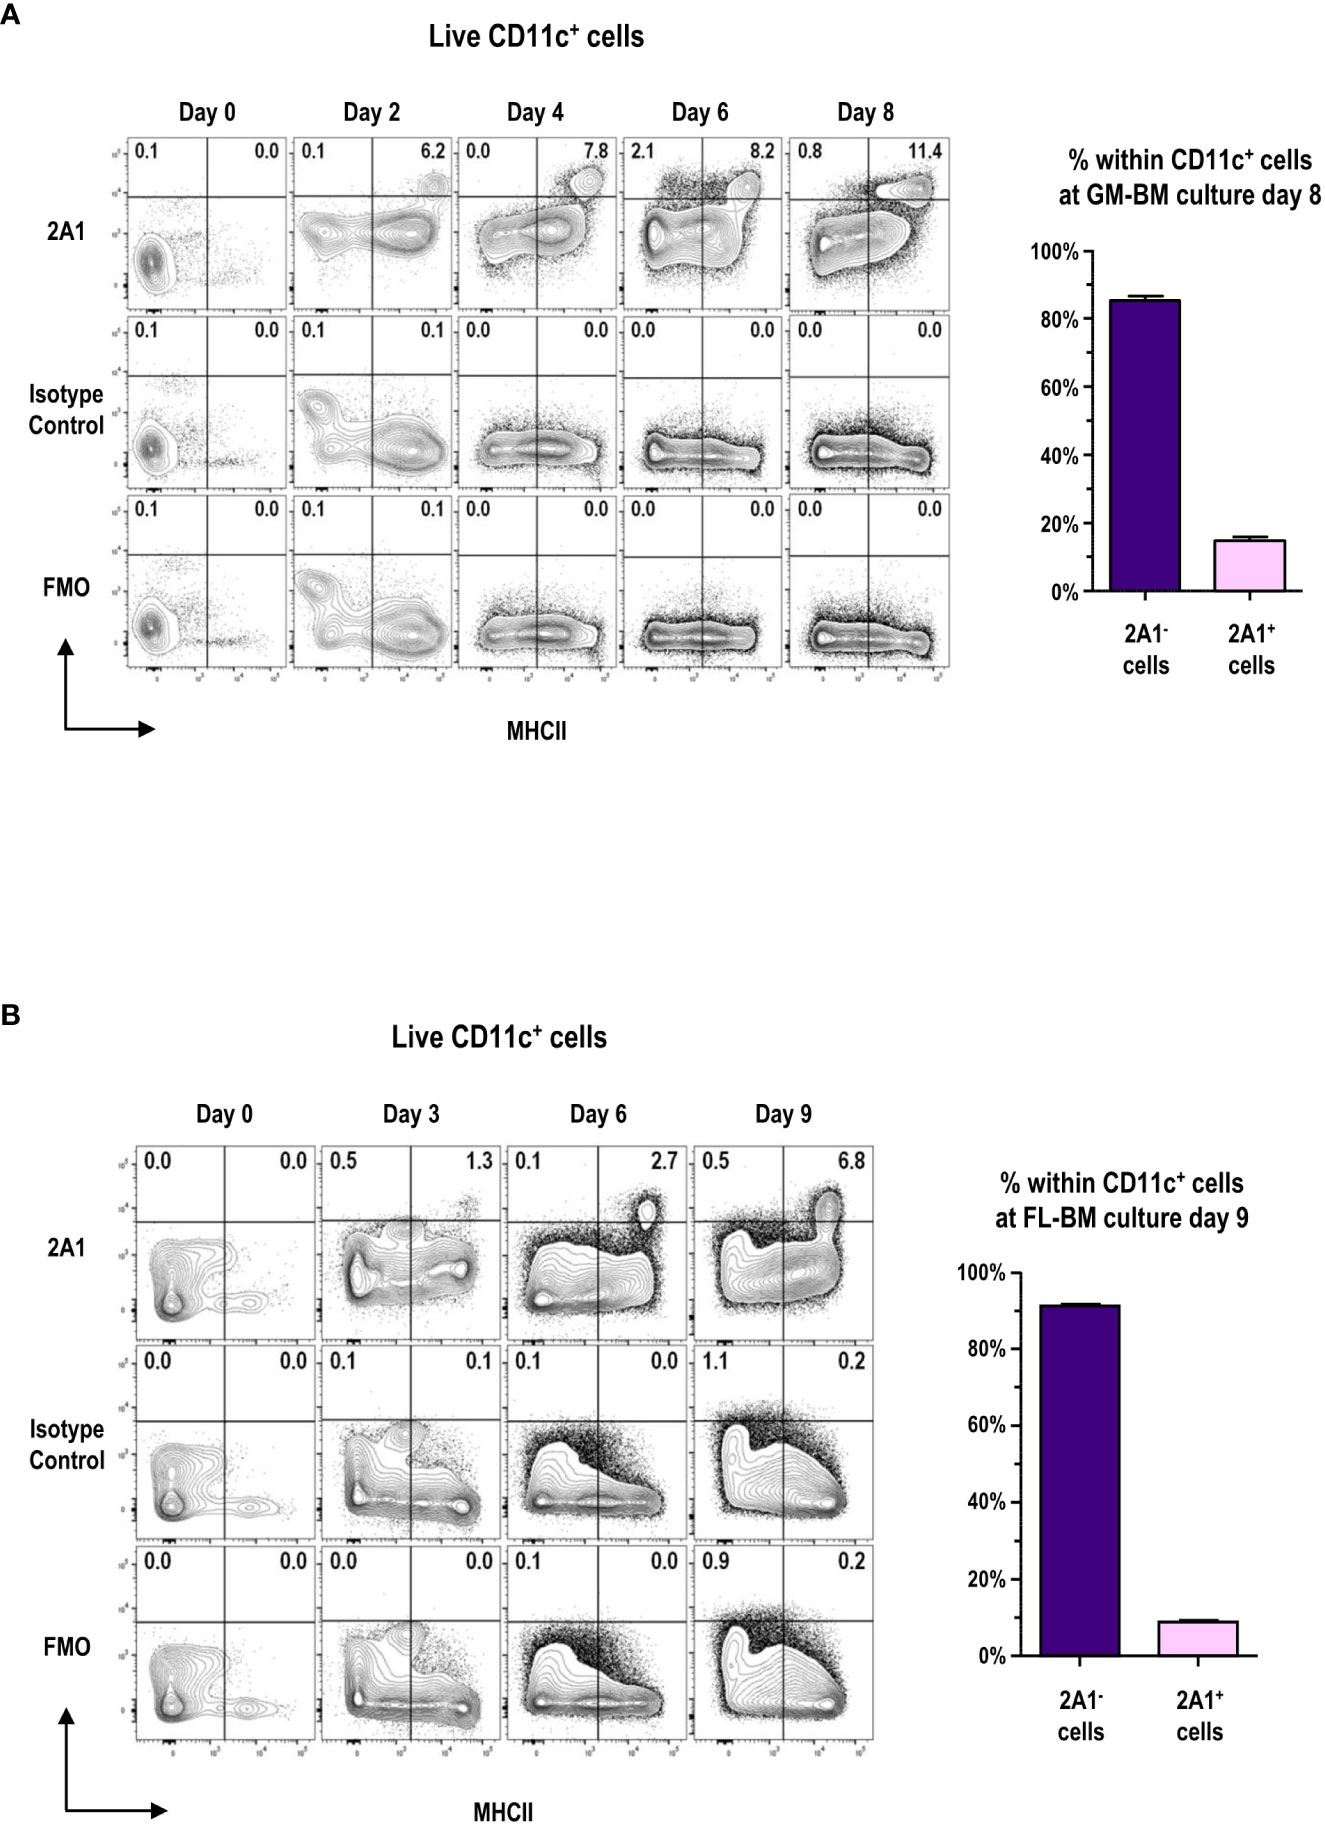
Figure 1 Expression of 2A1 antigen in GM-BM and FL-BM cultures. (A) Representative flow cytograms show kinetic change in the expression of 2A1 from CD11c+ cells in GM-BM culture for 8 days (left panels). Distribution of 2A1- and 2A1+ cells within CD11c+ cells at day 8 of GM-BM culture (right graph). Flow cytograms are representative from 3 independent experiments. Graph is shown in mean ± SEM (n = 10). (B) Representative flow cytograms show kinetic change in the expression of 2A1 from CD11c+ cells in FL-BM culture for 9 days (left panels). Distribution of 2A1- and 2A1+ cells within CD11c+ cells at day 9 of FL-BM culture (right graph). Flow cytograms are representative from 3 independent experiments. Graph is shown in mean ± SEM (n = 10).
2A1+ Cells are within the DC gate and cells within the DC gate are 2A1+ in GM-BM culture
CD11c+ cells in GM-BM culture (Supplementary Figure 4) are grouped into CD11bhiMHCIIint/lo GM-Macs (Macs in GM-BM culture) and CD11bintMHCIIhi GM-DCs (11). When the 2A1+ cells were backgated on those two populations in GM-BM culture, virtually all the 2A1+ cells were within the GM-DC gate (Figure 2A). Conversely, virtually all the cells within the GM-DC gate in GM-BM culture were 2A1+ (Figure 2B; Supplementary Figure 5). In addition to 2A1, GM-DCs expressed higher levels of CD80, CD83, and CD86; GM-Macs exhibited higher levels of CD115, CX3CR1, and CCR9 (Figure 2B; Supplementary Figure 5).
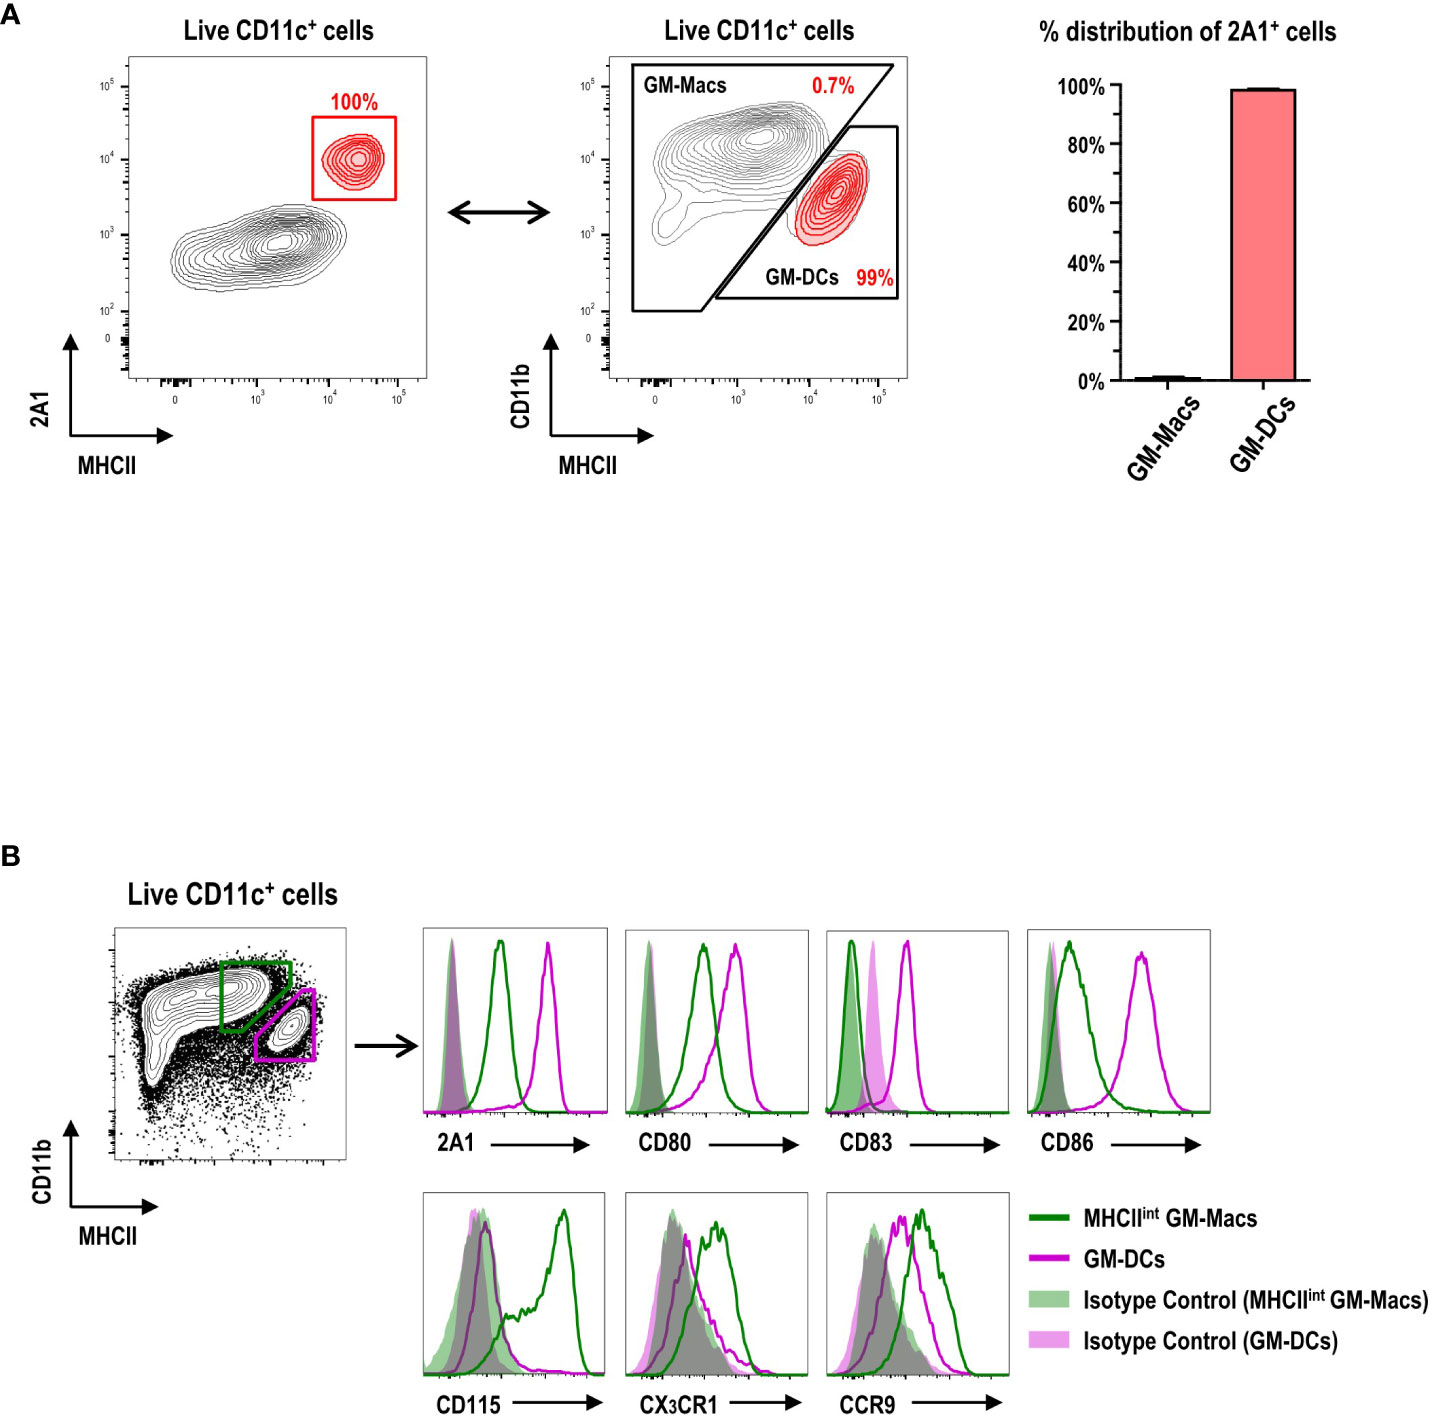
Figure 2 Expression of 2A1 and surface molecules in GM-DCs and GM-Macs. (A) Gating strategy (left panel) identifies 2A1+ cells (red contours) in CD11c+ cells at day 8 of GM-BM culture. 2A1+ cells (red contours in left panel) are backgated in an MHCII versus CD11b contour plot of live-gated CD11c+ cells (black contours in middle panel), indicating 2A1+ cells within the GM-DC gate. Graph (right panel) shows % distribution of 2A1+ cells between GM-Macs and GM-DCs. Representative flow cytograms are from 10 independent experiments. Graph is shown in mean ± SEM (n = 10). (B) Flow cytometric analysis of 2A1 and surface molecules in MHCIIint GM-Macs (green) and GM-DCs (purple) at day 8 of GM-BM culture. Filled histograms for isotype controls of the mAbs against the respective molecules. Representative flow cytograms are from at least 4 independent experiments.
2A1+ cells are mostly present within the cDC gate in FL-BM culture
CD11c+ cells in FL-BM culture (Supplementary Figure 6) are grouped into B220+MHCII- pDCs, B220-MHCII+CD24lo/+CD172α- cDC1s, and B220-MHCII+CD24lo/-CD172α+ cDC2s (10). Virtually all the 2A1+ cells were MHCIIhi cells within the cDC gate in FL-BM culture (Figures 3A, B), and most of those 2A1+ cells were evidently within the cDC2 gate because most of the MHCIIhi cells in FL-BM culture were within the cDC2 gate (Figures 3A, B). We then characterized the surface markers of 2A1+ cells in comparison to 2A1- cells within the cDC gates (Figures 3C–F; Supplementary Figure 7). The 2A1+ cells expressed higher levels of CD80, CD83, and CD86 but lower levels of CD115, CX3CR1, and CCR9 than the 2A1- cells. Especially in MHCIIhi cDCs, the 2A1+ cells could be distinguished from the 2A1- cells by the high expression of CD83 and the low expressions of CD115 and CX3CR1 (Figures 3C, D). All in all, these results indicate that the 2A1+ cells in FL-BM culture possess the mature DC phenotype. Indeed, all the 2A1+ cells within the cDC1 gate exhibited the MHCIIhiCD83+CD115-CX3CR1- phenotype, while all the 2A1- cells within the cDC1 gate showed the MHCIIloCD83-CD115-CX3CR1- phenotype (Figure 3E). However, the 2A1- cells within the cDC2 gate from FL-BM culture displayed either CD83-CD115+CX3CR1+ or CD83-CD115-CX3CR1- phenotypes, although all the 2A1+ cells within the cDC2 gate exhibited the CD83+CD115-CX3CR1- phenotype (Figure 3F). Interestingly, both 2A1-CD83-CD115+CX3CR1+ and 2A1+CD83+CD115-CX3CR1- populations in the cDC2 gate were abundantly present in MHCIIhi cells of the FL-BM culture.
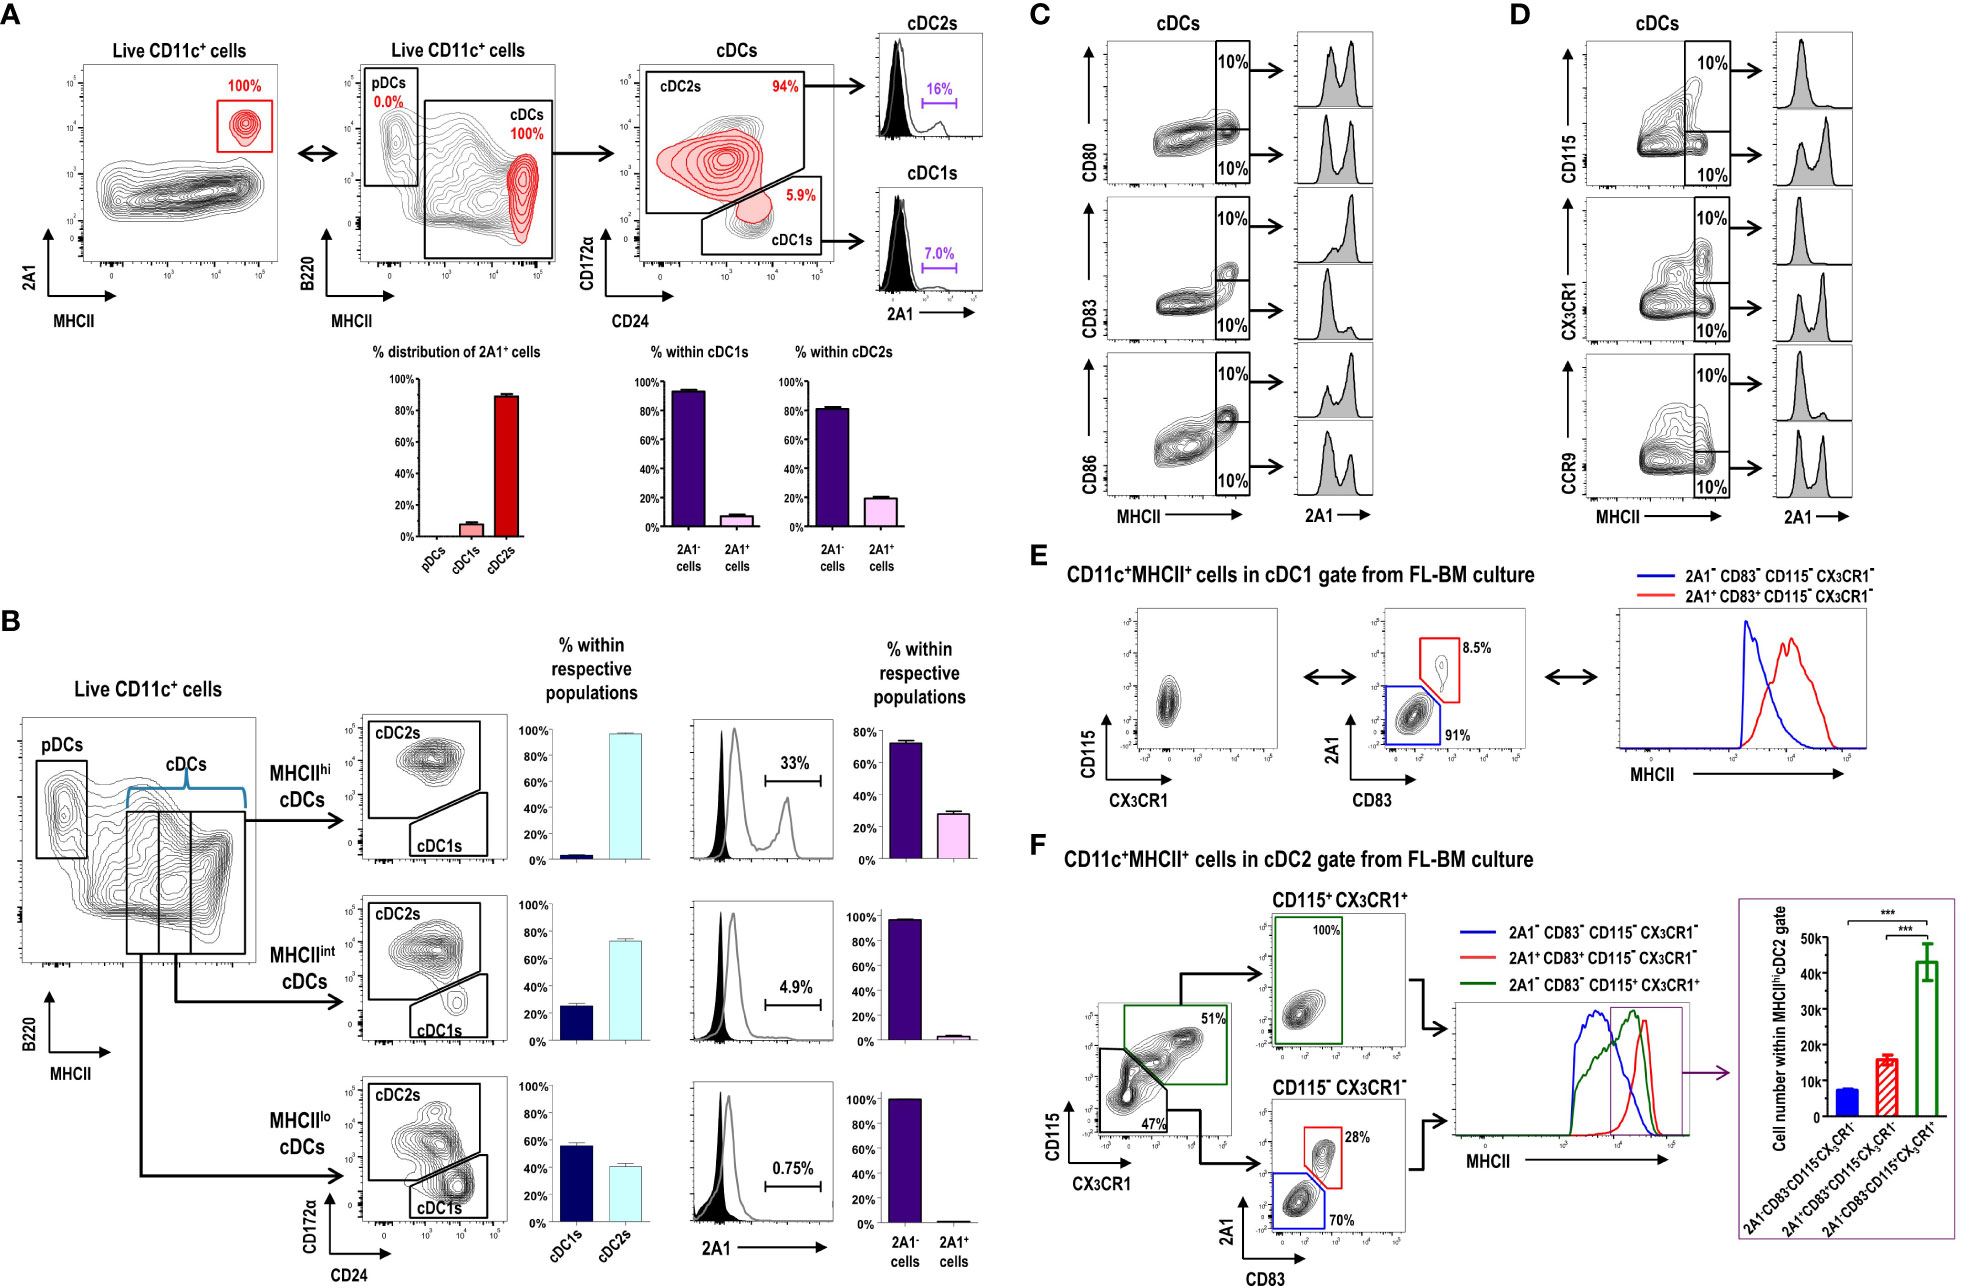
Figure 3 Expression of 2A1 reveals heterogeneous populations of the CD11c+MHCII+ cDC-gated cells in FL-BM culture. (A) Gating strategy identifying 2A1+ cells (red contours) in CD11c+ cells at day 9 of FL-BM culture (upper left panel). 2A1+ cell population (red contours) is backgated in an MHCII versus B220 contour plot of live-gated CD11c+ cells (black contours), indicating 2A1+ cells within the cDC1 and cDC2 gates (upper middle and right panels). Distribution of 2A1+ cells among DC subsets (lower left graph). Distribution of 2A1- and 2A1+ cells within cDC1s or cDC2s (lower right graphs). Graphs are shown in mean ± SEM (n = 11) from 5 independent experiments. (B) Gating strategies and distributions indicating cDC1 and cDC2 populations within MHCIIlo, MHCIIint, or MHCIIhi cDC subsets at day 9 of FL-BM culture (left panels and graphs). Distributions of 2A1- and 2A1+ cells within cDC1s or cDC2s (right panels and graphs). Graphs are shown in mean ± SEM (n = 13) from 6 independent experiments. Flow cytometric analysis of 2A1 according to the expression levels of positively (C) or negatively (D) correlating surface molecules in the MHCIIhi cDC gate. Flow cytometric analysis of MHCII correlating to the expression levels of 2A1, CD83, CD115, and CX3CR1 in the cDC1-gated (E) and cDC2-gated (F) cells from FL-BM culture. Distribution of cells among three subsets in the MHCIIhi cDC2 gate [purple box in right histogram in (F)] are shown [lower graph in purple box in (F)]. Representative flow cytograms are based on 3 independent experiments. Graph is shown in mean ± SEM (n = 8). ***p ≤ 0.001; one-way ANOVA test.
MHCIIhi cDC2-gated cells in FL-BM culture are functionally and morphologically heterogeneous
Currently, CD11c+MHCII+ or CD11c+MHCIIhi cells in FL-BM culture are widely used as in vitro-generated DCs (20–22). Since most of the CD11c+MHCIIhi cells in FL-BM culture were within the cDC2 gate (Figures 3A, B) and those CD11c+MHCIIhi cells consisted of CD83-CD115+CX3CR1+, CD83-CD115-CX3CR1-, and CD83+CD115-CX3CR1- subpopulations (Figure 3F), we set out to characterize the DC features of each subpopulation within the MHCIIhi cDC2 gate. As described above, the expression of 2A1 is faithfully correlated with the expression of CD83 among the cDC2-gated CD11c+MHCIIhi cell subsets in FL-BM culture. Besides, the detection of 2A1 requires the permeabilization of cells and intracellular staining which prevents and complicates the analysis of live cells. Henceforth, we utilized the cell-surface staining markers for the identification of each cell subsets in FL-BM culture. To assess the functional capacity of DCs to prime and expand T cells, naive T cells were isolated from OVA-specific TCR (i.e., CD8+ OT-1 and CD4+ OT-2) transgenic mice and used as responders to each MHCIIhi cDC2-gated subpopulation isolated from the OVA-pulsed FL-BM culture. In the co-cultures of graded doses of each MHCIIhi subpopulation with naive OVA-specific T cells, MHCIIhiCD83+CD115-CX3CR1- cells were far superior APCs for CD8+ OT-1 T cells to MHCIIhiCD83-CD115+CX3CR1+ and MHCIIhiCD83-CD115-CX3CR1- cells (Figure 4A), while both MHCIIhiCD83+CD115-CX3CR1- and MHCIIhiCD83-CD115-CX3CR1- cells were much better APCs for CD4+ OT-2 T cells than MHCIIhiCD83-CD115+CX3CR1+ cells (Figure 4B). Therefore, only the MHCIIhiCD83-CD115+CX3CR1+ cDC2-gated cells exhibited the poor antigen presentation to naive T cells on both MHCI and MHCII pathways. Also, MHCIIhiCD83-CD115+CX3CR1+ cDC2-gated cells survived most poorly in the co-culture with OVA-specific T cells (Supplementary Figure 8). Meanwhile, unlike cDC1s isolated from the spleen (Supplementary Figure 9B), cDC1s in FL-BM culture were poor at cross-presenting both soluble OVA and cell-associated OVA antigens to CD8+ OT-1 T cells (Figure 4A; Supplementary Figure 9A) indicating that cDC1s in FL-BM culture require an additional maturation stimulus, such as treatment with GM-CSF (Supplementary Figure 9C), to acquire cross-presentation capacity (40, 41).
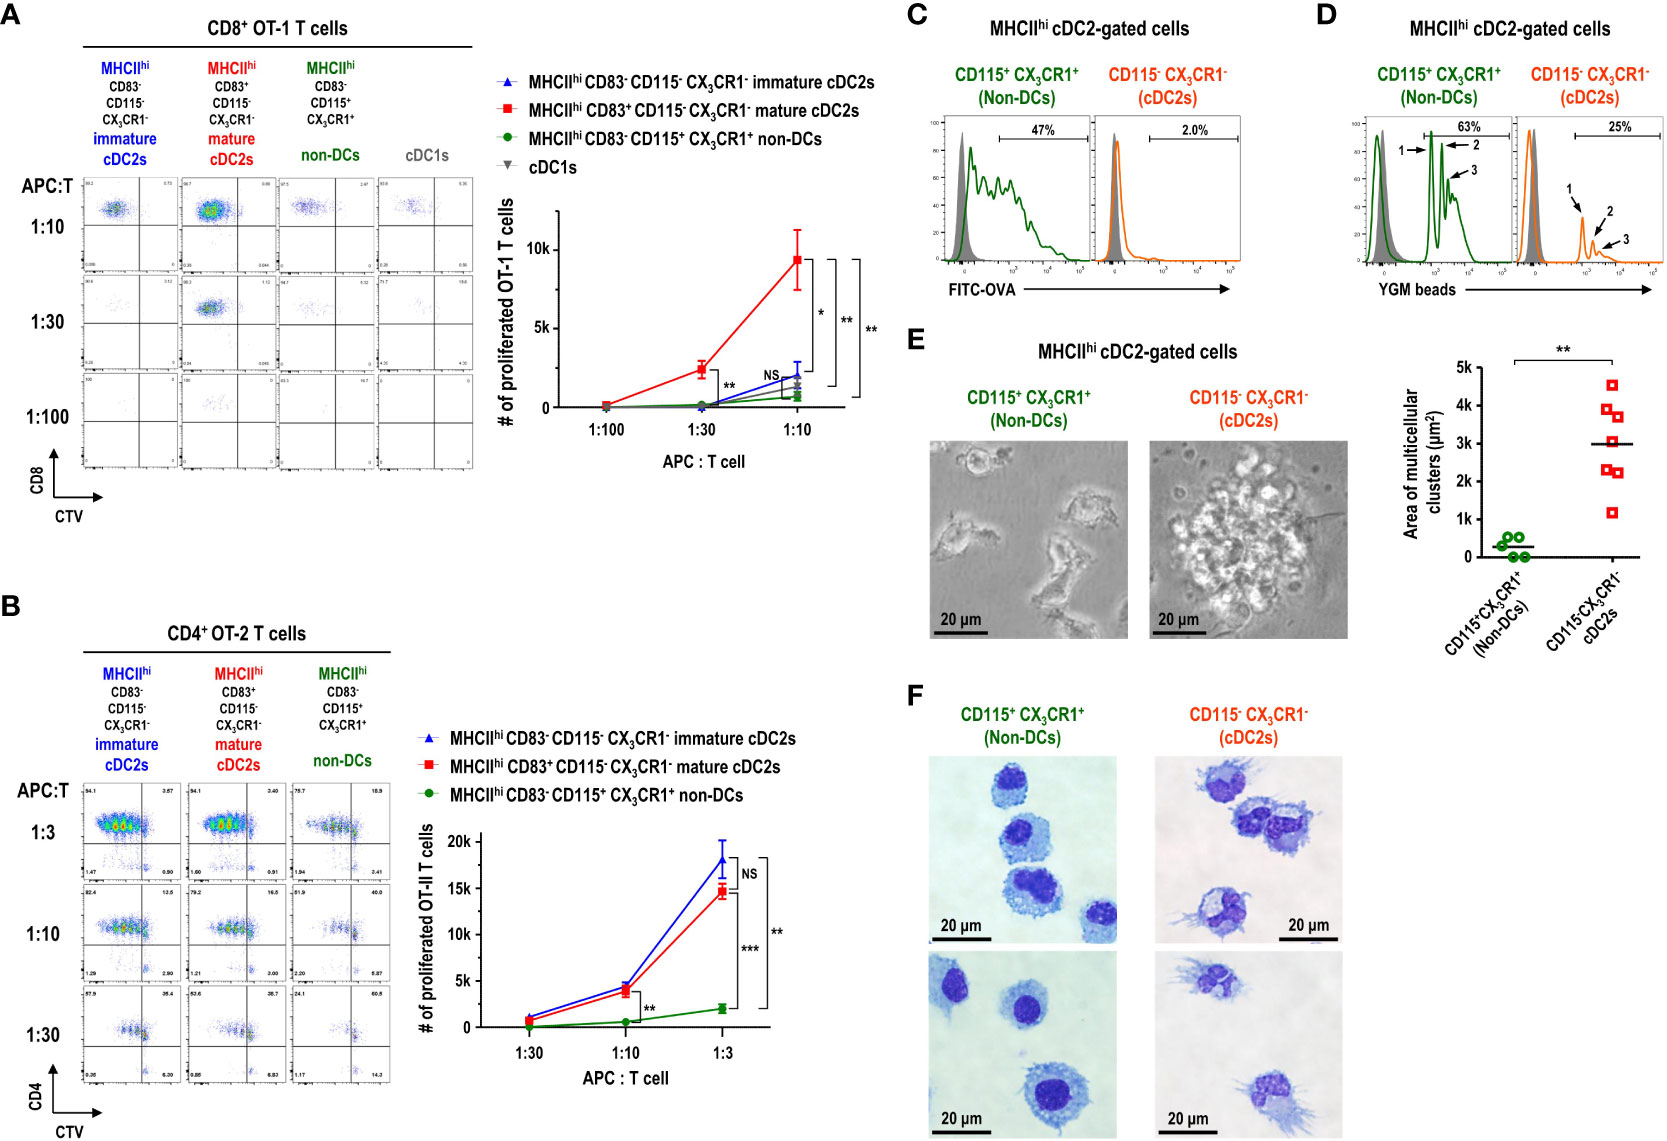
Figure 4 CD11c+MHCIIhi cDC2-gated cells in FL-BM culture are functionally and morphologically heterogeneous. (A, B) Antigen presentation to OVA-specific TCR transgenic naive T cells by CD11c+MHCII+ cDC-gated cell subpopulations. CD11c+MHCII+ cell subsets are isolated as APCs from FL-BM culture (at day 9) after being pulsed with OVA (100 μg/ml) for 30 minutes. Proliferation of CTV-labeled naive splenic CD8+ OT-1 (A) and CD4+ OT-2 (B) T cells are assessed following co-culture with graded doses of the respective APCs. Representative flow cytograms are from 5 independent experiments. Graphs are shown in mean ± SEM (n = 4). *p ≤ 0.05; **p ≤ 0.01; ***p ≤ 0.001; NS, not significant; two-way ANOVA test. In FL-BM culture (at day 9), CD11c+MHCIIhi cDC2-gated cell subpopulations are analyzed by flow cytometry after being pulsed with (C) soluble antigen FITC-OVA (100 μg/ml) or (D) particulate antigen YGM beads (0.000675%) for 1 hour at 37°C (open histograms) or at 4°C (closed histograms). Representatives flow cytograms are from 4 independent experiments. (E) Morphologies (left panels) of CD11c+MHCIIhi cDC2-gated cell subsets isolated from FL-BM culture (at day 9) and cultured overnight (magnification, 400×; scale bars, 20 μm). Graph (right) shows the area of cell clusters which consist of more than 2 cells. Bars indicate the mean of clusters (n = 5 for non-DCs; n = 7 for cDC2s). **p ≤ 0.01; Welch’s t-test. Data are collected from 3 independent experiments. (F) Wright-Giemsa stain of CD11c+MHCIIhi cDC2-gated cell subsets. Representatives are from 4 independent experiments.
Then, the antigen uptake ability of MHCIIhi subpopulations was examined from the FL-BM culture pulsed with soluble FITC-OVA or particulate 1 μm YGM beads. The MHCIIhiCD115+CX3CR1+ cells were much better capable of taking up soluble antigens (Figure 4C) as well as phagocytosing particulate microbeads (Figure 4D) than the MHCIIhiCD115-CX3CR1- cells in FL-BM culture. Although the MHCIIhiCD83-CD115+CX3CR1+ cDC2-gated cells expressed high levels of MHC class I molecules (MHCI) on surface (Supplementary Figure 10) and took up antigens efficiently (Figures 4C, D), the MHCIIhiCD83-CD115+CX3CR1+ cDC2-gated cells were poor at processing OVA antigen and presenting OT-1 peptide epitope on MHCI (Supplementary Figure 10). DCs are considered as professional APCs with low endocytic and phagocytic capacities, as compared to other mononuclear phagocytes (7, 26, 42–44). Therefore, MHCIIhi cDC2-gated cells in the FL-BM culture likely consist of 2A1-CD83-CD115-CX3CR1- immature cDC2s, 2A1+CD83+CD115-CX3CR1- mature cDC2s, and 2A1-CD83-CD115+CX3CR1+ non-DCs.
Particular morphology is one of the key features that characterize distinct types of hematopoietic cells (24, 26, 29, 33). In the overnight culture of MHCIIhi cDC2-gated cells isolated from FL-BM culture, the individual morphologies of each subpopulation were examined. As expected, CD115-CX3CR1- cDC2s illustrated the large clusters of non-adherent cells with noticeably long cellular processes or dendrites (Figures 4E, F), a typical morphology of DCs (7, 33, 45). In contrast, CD115+CX3CR1+ non-DCs were devoid of the morphology and clustering of DCs (Figures 4E, F). Besides, CD115-CX3CR1- cDC2s exhibited the typical electron microscopic features of DCs (12, 46–48) that the irregularly shaped nuclei possessed a dense rim of heterochromatin and small nucleoli; the cytoplasm comprised many scattered mitochondria, short slips of rough endoplasmic reticulum, few electron-dense membrane-bound lysosomes but many electron-lucent vesicles including multivesicular bodies of varying size in the Golgi region (Supplementary Figure 11), while CD115+CX3CR1+ non-DCs displayed more frequent electron-dense membrane-bound lysosomes (Supplementary Figure 12).
Gene expression profiles indicate that MHCIIhi cDC2-gated non-DCs in FL-BM culture are closely related to MHCIIint GM-Macs
Bulk RNA sequencing (RNA-Seq) was performed to check the distinctive gene expression profile of each cell subset in GM-BM and FL-BM cultures, which are GM-DCs and MHCIIint GM-Macs from GM-BM culture; MHCIIhi FL-cDC2-gated non-DCs, mature FL-cDC2s, immature FL-cDC2s, mature FL-cDC1s, and immature FL-cDC1s from FL-BM culture. Comparative analysis of the transcriptomes revealed the transcriptional differences and similarities among those cell subsets in GM-BM and FL-BM cultures. The principal components analysis (PCA) of the transcriptomes showed that the clusters of CD83+ cell subsets (i.e., GM-DCs, mature FL-cDC2s, and mature FL-cDC1s) were located close to each other; so were those of CD83- cDC subsets (i.e., immature FL-cDC2s and immature FL-cDC1s) and those of CD83- non-DC subsets (i.e., MHCIIint GM-Macs and MHCIIhi FL-cDC2-gated non-DCs), respectively (Figure 5A). Also, the hierarchical cluster analysis (HCA) of the transcriptomes revealed comparable outcomes (Figure 5B). In FL-BM culture, CD83+ mature cDC2s elevated the expression of marker genes for mature DCs such as CCR7 and CCL22 (49–51); CD83- immature cDC2s augmented the expression of DCs-related genes including Kmo, Flt3, and CD209a (DC-SIGN) (29, 52, 53); CD83- cDC2-gated non-DCs exhibited higher levels of gene expression for macrophage signatures such as Lyz2, Apoe, Csf1r, Clec4e, Mmp12 (54) (Supplementary Figure 13). Select gene expression profiles among cell subsets in FL-BM and GM-BM cultures were compared to those among MHCII+ mononuclear phagocytes in mice such as splenic cDC subsets, peritoneal DC subsets, and small peritoneal macrophages (SPMs) (Supplementary Figure 14). While each cell subset in FL-BM and GM-BM cultures was clustered close to the related cell subset in the spleen and peritoneal cavity, it was notable that FL-cDC2-gated non-DCs and MHCIIint GM-Macs showed close clustering with splenic cDC2s and peritoneal DC2s in the expression profiles of DC signature genes (Supplementary Figure 14D).
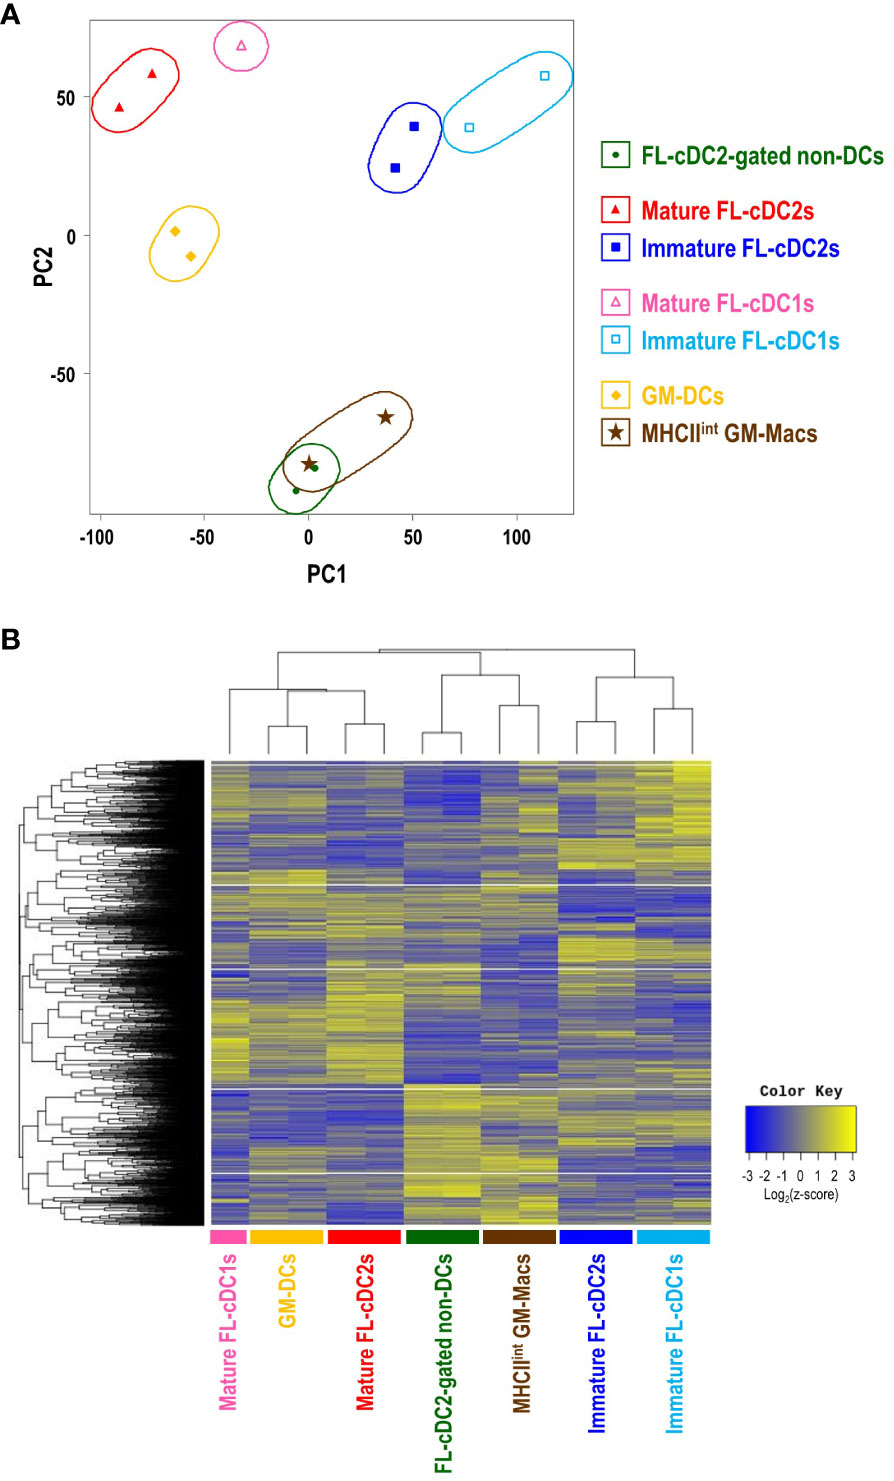
Figure 5 Transcriptome analysis reveals the close relationship between MHCIIint GM-Macs and MHCIIhiCD115+CX3CR1+ cDC2-gated non-DCs in FL-BM culture. (A) Principal component analysis (PCA) of transcriptomes of cell subsets in GM-BM and FL-BM cultures. (B) Heatmap displays the one-way hierarchical clustering using z-score for normalized value of randomly selected genes that are differentially expressed among cell subsets in GM-BM and FL-BM cultures.
Differentiation of MHCIIhi cDC2-gated non-DCs in FL-BM culture
CD11c+ cells in the gate of MHCIIint GM-Macs, exhibiting a similar gene expression profile as that of CD11c+MHCIIhi cDC2-gated non-DCs in FL-BM culture (Figures 5A, B), have been suggested to contain mixed populations of precursors or immature DCs in addition to the Macs or Mac-like cells (55). MHCIIhi cDC2-gated non-DCs were found to express higher levels of various toll-like receptors (TLRs) than other cells within the cDC2 gate in FL-BM culture (Supplementary Figure 15). Because the treatment with TLR agonists is commonly employed to induce the maturation or differentiation of DCs (7), we investigated the phenotype change of MHCIIhi cells in FL-BM culture following overnight treatment with graded doses of LPS. Treatment of FL-BM culture with more than 10 ng/ml of LPS sharply reduced the number of MHCIIhi cDC2-gated non-DCs and largely augmented the population of MHCIIhi mature cDC2s (Figure 6A; Supplementary Figure 16). Similarly, upon stimulation of FL-BM culture with TLR3 or TLR9 ligands, MHCIIhi cDC2-gated non-DCs disappeared and MHCIIhi mature cDC2s increased (Supplementary Figure 17). Meanwhile, we found that the MHCIIhi cDC2-gated cell subsets in FL-BM culture were not MHCII+RORγt+ APCs such as ILC3s, Janus cells, or Thetis cells (56–58) (Supplementary Figure 18).
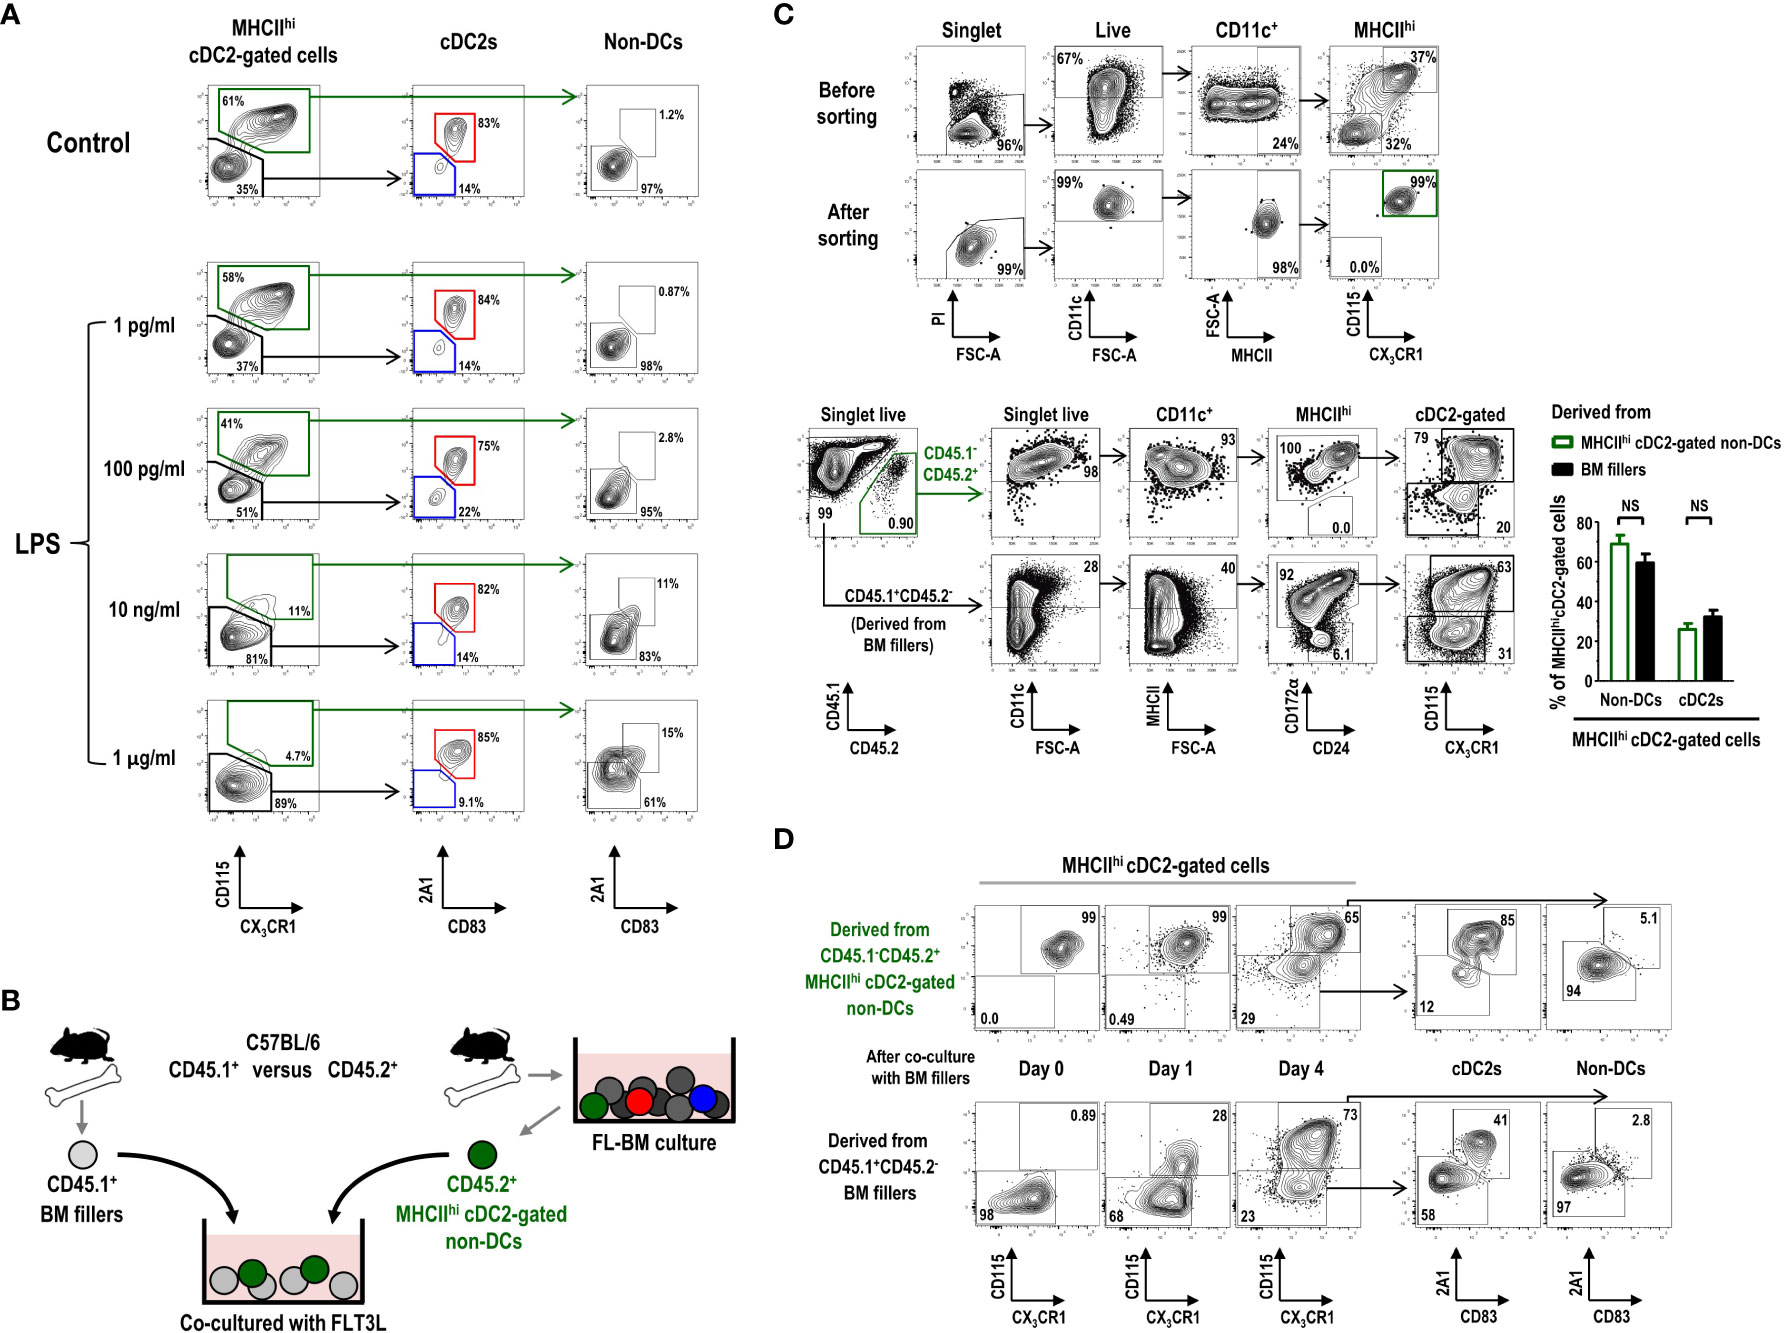
Figure 6 MHCIIhiCD115+CX3CR1+ cDC2-gated non-DCs in FL-BM culture can differentiate into cDC2s. (A) Graded doses of LPS are added into FL-BM culture (at day 8) for 18 hours prior to the flow cytometric analysis. (B) Experimental scheme of co-culture shown in (C, D) CD45.2+MHCIIhiCD115+CX3CR1+ cDC2-gated non-DCs are isolated from FL-BM culture (at day 7 or 8) and co-cultured with freshly isolated filler BM cells. (C) Gating strategies for sorting and resulting purity of CD45.2+MHCIIhi CD115+CX3CR1+ cDC2-gated non-DCs (upper panels). After 4 days of co-culture with BM fillers, cells are analyzed (lower panels and graph). Graph is shown in mean ± SEM (n = 3). NS, not significant; one-way ANOVA test. (D) Expression of 2A1 and CD83 is analyzed over the differentiation of CD45.2+MHCIIhiCD115+CX3CR1+ cDC2-gated non-DCs as in (B, C) All the flow cytograms are representative from 3 independent experiments (n = 3).
Then, we tested whether the MHCIIhi cDC2-gated non-DCs, vanishing by stimulation of FL-BM culture with TLR ligands, could differentiate into MHCIIhi mature cDC2s. After isolation from the FL-BM culture at day 8, MHCIIhi cDC2-gated non-DCs were further co-cultured with BM filler cells from congenic mice (Figures 6B, C). After more than 4 days of additional co-culture with FLT3L, a significant fraction of the MHCIIhi cDC2-gated non-DCs became MHCIIhi cDC2s (Figure 6C). As expected, in the FL-BM co-culture, the MHCIIhi cDC2s which had differentiated from the MHCIIhi cDC2-gated non-DCs also expressed the higher levels of 2A1 and CD83 than the undifferentiated MHCIIhi cDC2-gated non-DCs (Figure 6D). Therefore, the MHCIIhi cDC2-gated non-DCs in FL-BM culture are precursors to the MHCIIhi cDC2s, i.e., MHCIIhi pre-cDC2s.
MHCIIhi Pre-cDC2s in FL-BM culture are derived from pre-cDCs and CDPs but not from monocytes and cMoPs
In the development of DC lineage cells, MDPs can differentiate either into cDCs via CDPs and pre-cDCs (35, 37) or into Mo-DCs via cMoPs and monocytes (11, 38). Hence, we examined the differentiation potential of various DC progenitors and precursors into the MHCIIhi pre-cDC2s in FL-BM culture. Lineage-CD11c+CD135+MHCII- pre-cDCs, immediate precursors to cDCs (36), were isolated from the BM, and further co-cultured in FL-BM culture of congenic mice (Supplementary Figure 19). After 6 days of the co-culture with BM fillers and FLT3L, pre-cDCs differentiated mostly into the cells within the MHCIIhicDC2 gate, which consisted of MHCIIhi pre-cDC2s and MHCIIhi cDC2s in a similar ratio as found in the MHCIIhi cDC2-gated cells derived from the BM fillers (Figure 7A). Next, lineage-CD115+CD117+CD135+MHCII- CDPs, progenitors to cDCs and some pDCs (37), were isolated from the BM, and co-cultured with the BM fillers of congenic mice and FLT3L (Supplementary Figure 20). After 8 days of the co-culture, CDPs were able to differentiate into a variety of CD11c+ cells in FL-BM culture where the MHCIIhi cDC2-gated cells comprised MHCIIhi pre-cDC2s and MHCIIhi cDC2s in a similar ratio as found in the MHCIIhi cDC2-gated cells derived from the BM fillers (Figure 7B). Monocytes, more abundant than DCs in the blood and BM, are precursors to MHCIIhi GM-DCs and MHCIIint/lo GM-Macs in GM-BM culture and can rapidly differentiate into MHCIIhi Mo-DCs in vivo during infection and inflammation (7, 11, 26). Next, we have tested whether monocytes could differentiate into the MHCIIhi pre-cDC2s in FL-BM culture. Lineage-Ly6ChiCD11b+CD115+MHCII- monocytes were isolated from the BM, and then co-cultured with the BM fillers of congenic mice and FLT3L (Supplementary Figure 21). After 6 days of the co-culture, monocytes have differentiated mainly into CD11c+MHCIIint and CD11c+MHCIIlo cells but hardly into the CD11c+MHCIIhi cells in FL-BM culture (Figure 7C). Then, lineage-Ly6C+CD16/32+ CD34+CD115+CD117+MHCII- cMoPs, progenitors to monocytes (5), were also isolated from the BM, and co-cultured with the BM fillers of congenic mice and FLT3L (Supplementary Figure 22). After 8 days of the co-culture, cMoPs have rarely survived and mostly differentiated into CD11c+MHCIIint and CD11c+MHCIIlo cells but not into the CD11c+MHCIIhi cells in FL-BM culture (Figure 7D). Therefore, in FL-BM culture, MHCIIhi pre-cDC2s are derived from pre-cDCs and CDPs but not from monocytes and cMoPs (Figures 7E, F). When we tested the co-culture of pre-cDCs and BM fillers with FLT3L to be further treated with LPS, most of the MHCIIhi pre-cDC2s derived from both pre-cDCs and BM fillers differentiated similarly into MHCIIhi cDC2s (Figure 8A). We also examined the expression of DC-specific transcription factor Zbtb46 and found that MHCIIhi pre-cDC2s expressed Zbtb46 as highly as MHCIIhi immature cDC2s in FL-BM culture (Figure 8B), indicating that MHCIIhi pre-cDC2s are closely related to the DC lineage.
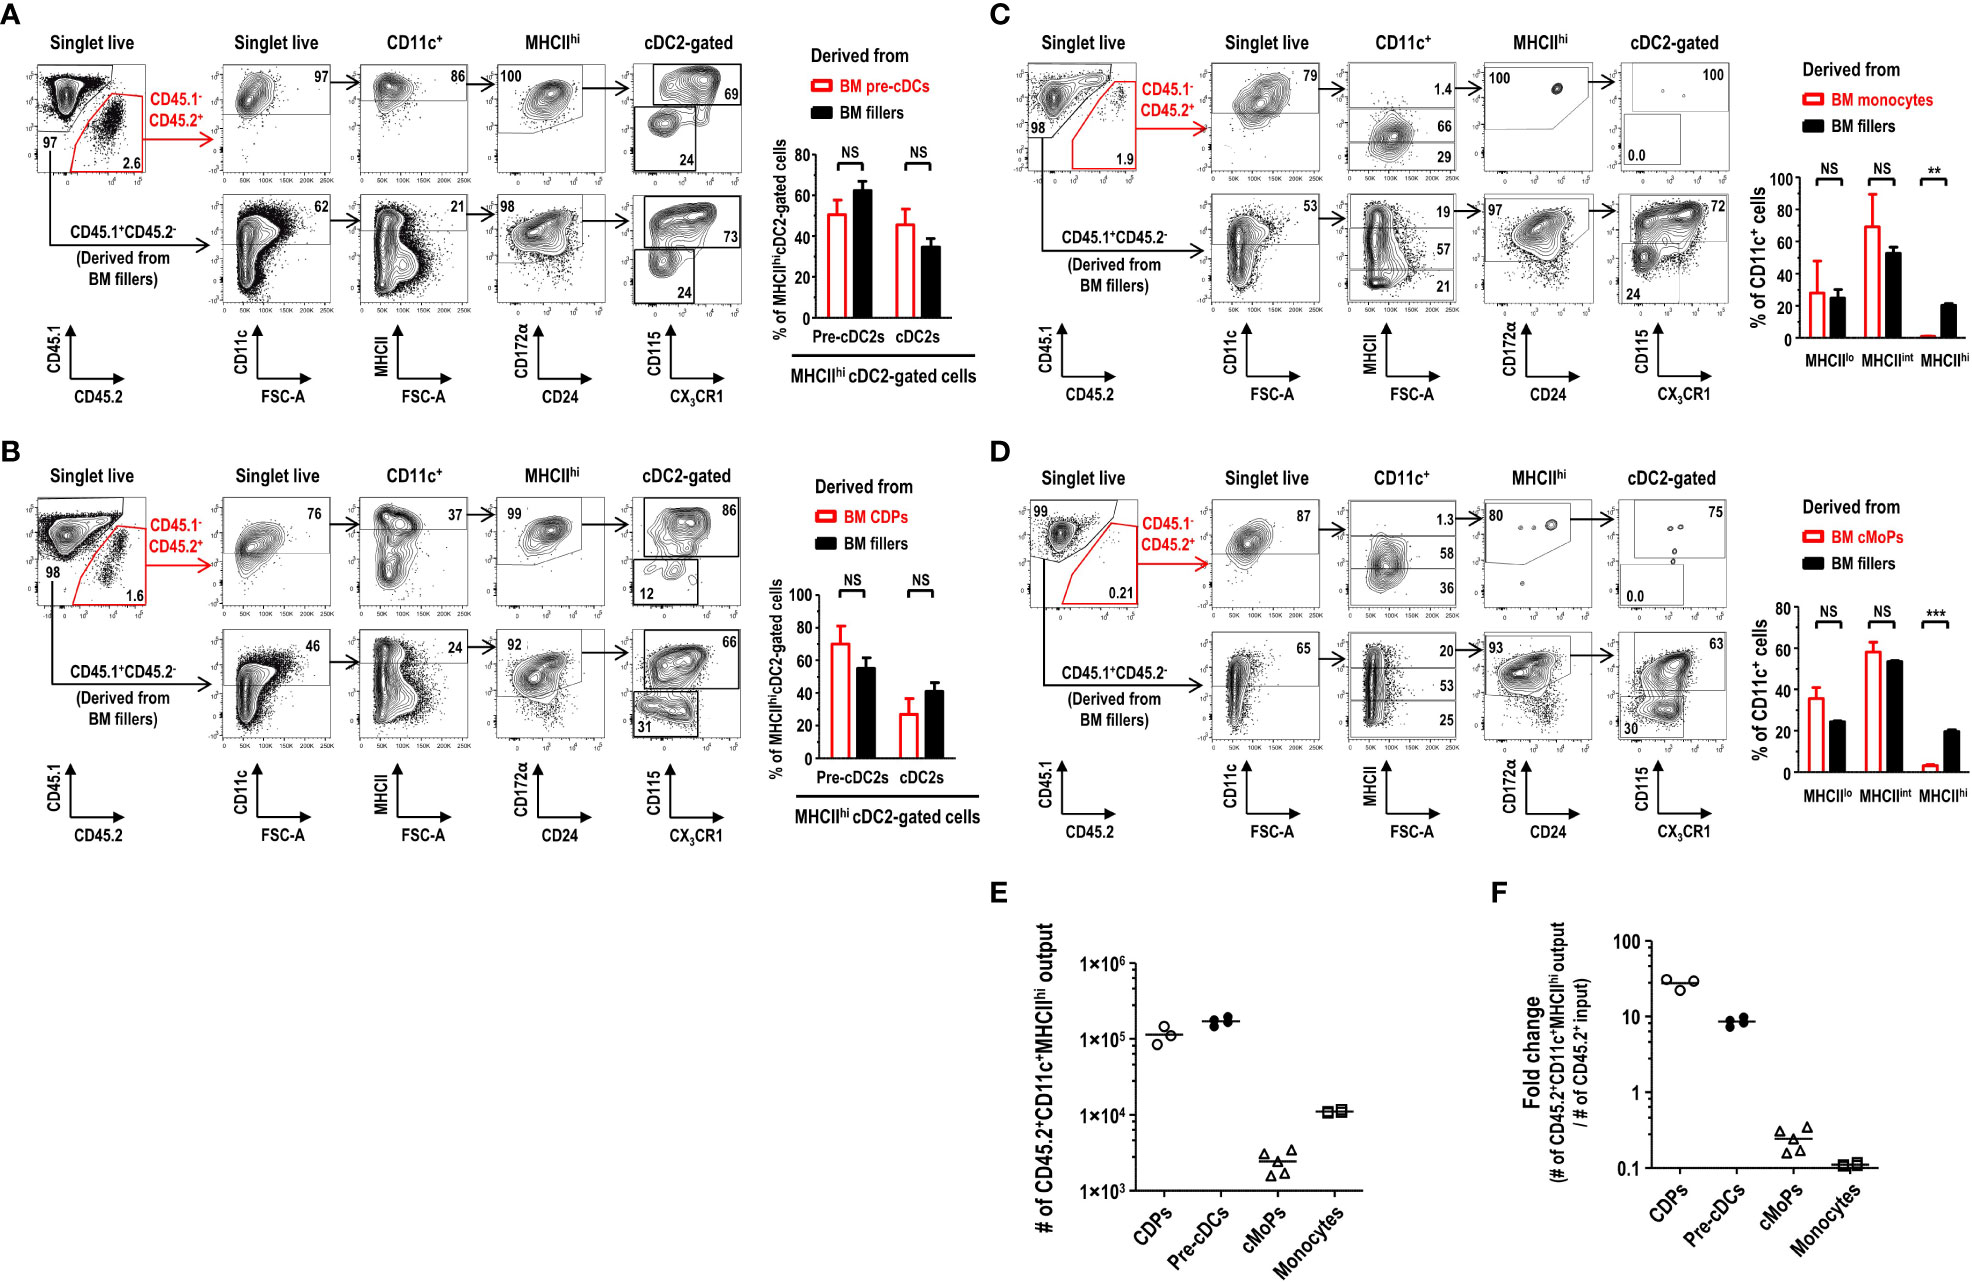
Figure 7 MHCIIhiCD115+CX3CR1+ cDC2-gated pre-cDC2s in FL-BM culture are derived from pre-cDCs and CDPs but not from monocytes and cMoPs. (A) Gating strategies to analyze the co-culture of isolated pre-cDCs and BM fillers at day 6 (upper panels). Graph (lower) is shown in mean ± SEM (n = 4). NS, not significant; one-way ANOVA test. (B) Gating strategies to analyze the co-culture of isolated CDPs and BM fillers at day 8 (upper panels). Graph (lower) is shown in mean ± SEM (n = 3). NS, not significant; one-way ANOVA test. (C) Gating strategies to analyze the co-culture of isolated monocytes and BM fillers at day 6 (upper panels). Graph (lower) is shown in mean ± SEM (n = 4). **p ≤ 0.01; NS, not significant; one-way ANOVA test. (D) Gating strategies to analyze the co-culture of isolated cMoPs and BM fillers at day 8 (upper panels). Graph (lower) is shown in mean ± SEM (n = 5). ***p ≤ 0.001; NS, not significant; one-way ANOVA test. (E, F) Resulting output numbers and fold changes of the CD45.2+CD11c+MHCIIhi cells generated from the respective CD45.2+ BM precursor/progenitor inputs are shown. The input numbers of CD45.2+ precursor/progenitor are 5×10³ for CDPs, 2×10⁴ for pre-cDCs, 1×10⁴ for cMoPs, and 1×10⁵ for monocytes, respectively, per well. Bars indicate the mean. Data are collected from more than 3 independent experiments (n = 3 for CDPs; n = 4 for pre-cDCs; n = 5 for cMoPs; n = 4 for monocytes).
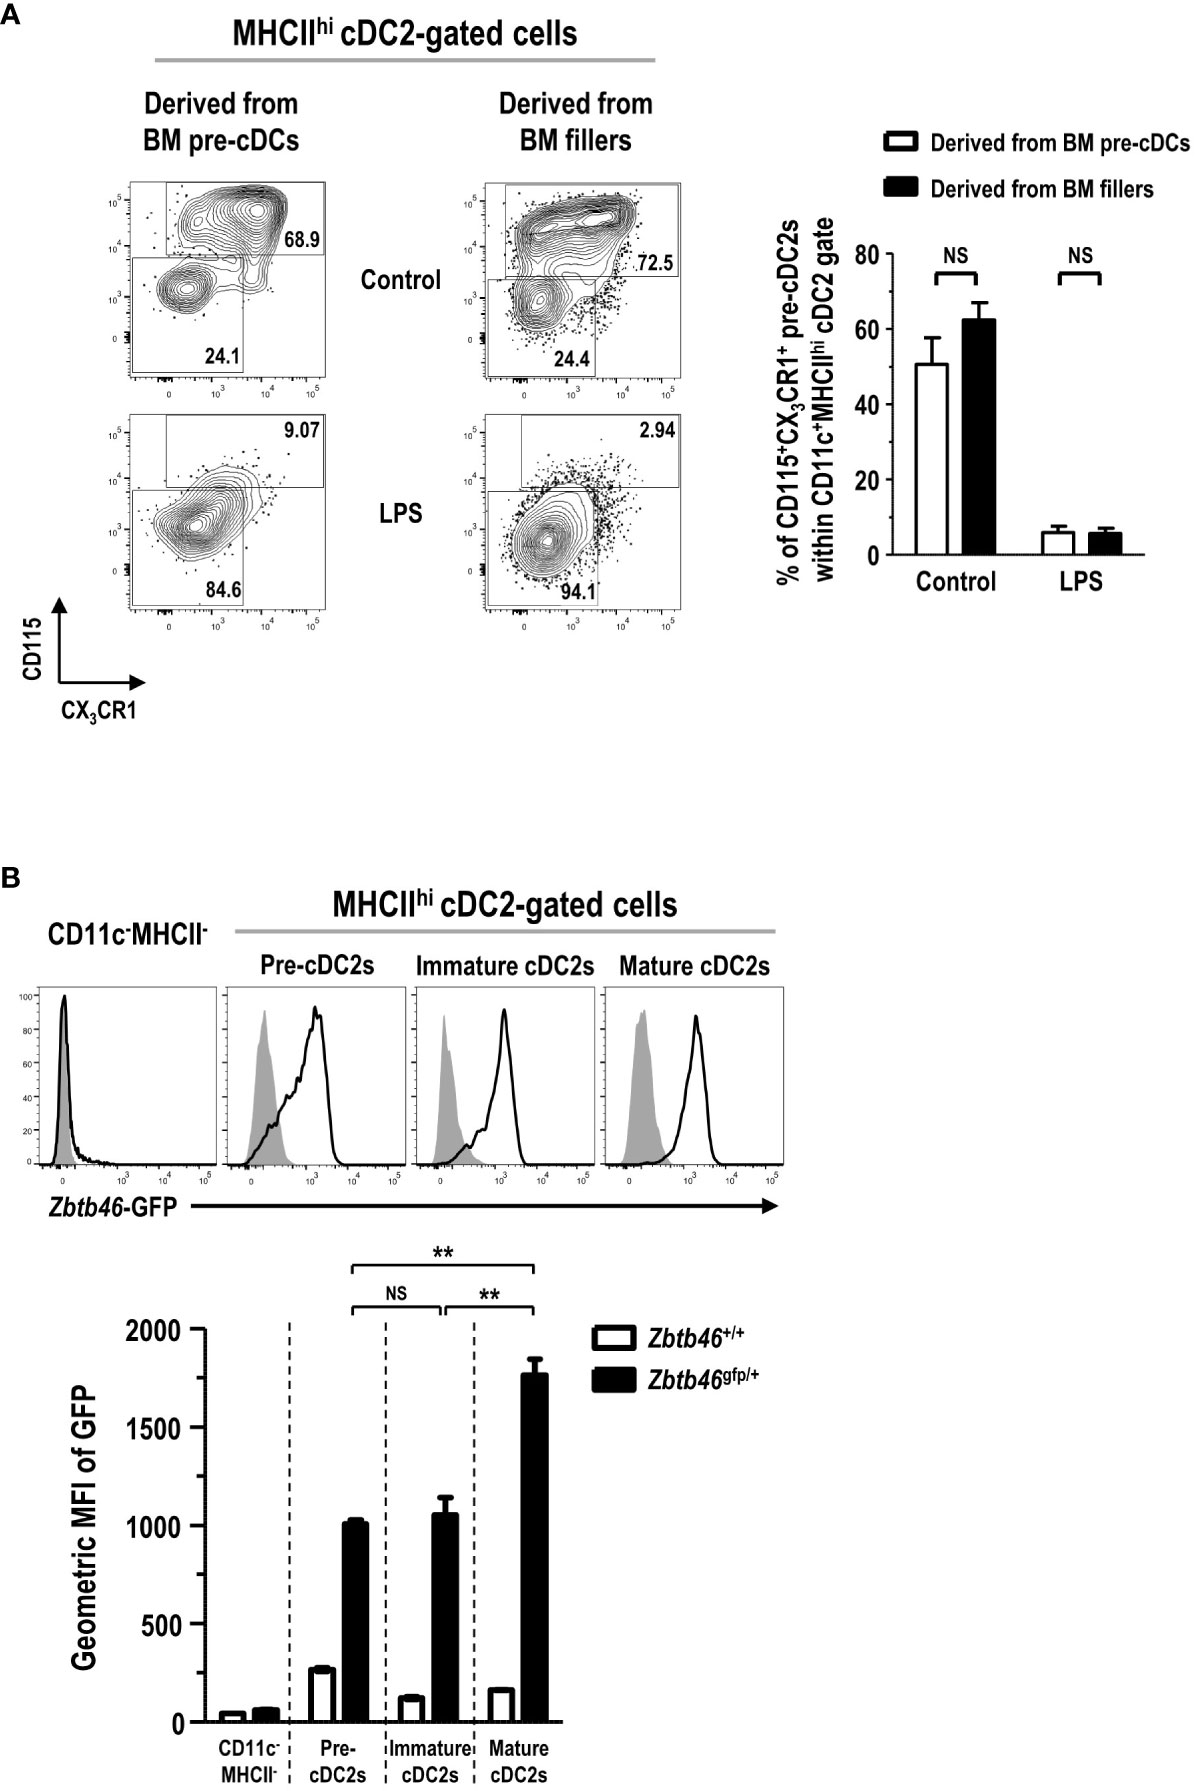
Figure 8 CD11c+MHCIIhi cDC2-gated CD115+CX3CR1+ pre-cDC2s are a close precursor to cDC2s. (A) LPS (1 μg/ml) is added into the co-culture of isolated pre-cDCs and BM fillers at day 5. After 18 hours, CD11c+MHCIIhi cDC2-gated cells are flow cytometrically analyzed (left panels). Representatives are from 4 independent experiments. Graph (right) is shown in mean ± SEM (n = 4). NS, not significant; one-way ANOVA test. (B) BMs are prepared from Zbtb46+/+ and Zbtb46gfp/+ mice, respectively, and cultured with FLT3L for 8 days. Representative flow cytograms (upper panels) show the expression of Zbtb46-GFP in different cell subsets from Zbtb46+/+ (closed histograms) and Zbtb46gfp/+ (open histograms) FL-BM cultures. Representatives are from 3 independent experiments. Graph (lower) shows the geometric MFI value for each cell subset in mean ± SEM (n = 3). **p ≤ 0.01; NS, not significant; one-way ANOVA test.
Discussion
DCs have been typically identified as CD11c+MHCIIhi cells in various mouse tissues and organs (59). Likewise, from GM-BM culture as well as FL-BM culture, CD11c+MHCIIhi cells (11), if not CD11c+ cells (60), have been routinely isolated and used as in vitro-generated DCs for the numerous experiments. Our present study, however, demonstrated that only a half of the CD11c+MHCIIhi cells in FL-BM culture were DCs whereas the remaining half were precursor cells with poor antigen-presenting capacity.
Considering that Helft and others (11) had shown that GM-BM culture comprised heterogeneous populations of CD11c+CD11bhiMHCIIint GM-Macs and CD11c+CD11bintMHCIIhi GM-DCs, we began to investigate the heterogeneity of CD11c+ cells in GM-BM culture in terms of expression of 2A1, an intracellular antigen of mature or activated DCs (12, 14). Subsequently, in GM-BM culture, we found that CD11c+CD11bhiMHCIIint GM-Macs are 2A1- and CD11c+CD11bintMHCIIhi GM-DCs are 2A1+, indicating that 2A1 could be a valuable marker to distinguish DCs from non-DCs among the CD11c+MHCII+ cell population.
Then, we examined the heterogeneity of CD11c+ cells in FL-BM culture in terms of expression of 2A1. Surprisingly, in FL-BM culture, we discovered that less than a half of the CD11c+MHCIIhi cells were 2A1+, but the remaining cells were 2A1-. Flow cytometric analysis revealed that almost of all the CD11c+MHCIIhi cells in FL-BM culture were within the cDC2 gate, and categorized into three groups: two large majorities of 2A1+CD83+CD115-CX3CR1- and 2A1-CD83-CD115+CX3CR1+ cells and a smaller number of 2A1-CD83-CD115-CX3CR1- cells. According to the assays on antigen uptake and presentation capacities, morphologies, and gene expression profiles of the CD11c+MHCIIhi cDC2-gated cell subsets, 2A1-CD83-CD115-CX3CR1- cells were immature cDC2s; 2A1+CD83+CD115-CX3CR1- cells were mature cDC2s; and 2A1-CD83-CD115+CX3CR1+ cells were non-DCs. The treatment with LPS and other TLR ligands greatly decreased both non-DCs and immature cDC2s but highly increased mature FL-cDC2s among the CD11c+MHCIIhi cDC2-gated cells in FL-BM culture. Then, the FL-BM culture with adoptively transferred cells confirmed that the MHCIIhi cDC2-gated non-DCs were precursors to cDC2s, i.e., MHCIIhi pre-cDC2s. Besides, MHCIIhi pre-cDC2s also showed the higher expression of DC-specific transcription factor Zbtb46 as similarly as immature cDC2s in FL-BM culture. In the meantime, the MHCIIhi pre-cDC2s were found generated from pre-cDCs and CDPs but not from monocytes and cMoPs, corroborating that the MHCIIhi pre-cDC2s have close lineage to cDCs but not Mo-DCs. All in all, our present study identified and characterized a novel cDC precursor population, exhibiting a CD11c+MHCIIhiCD115+CX3CR1+ phenotype, in FL-BM culture.
DCs are the most efficient professional PCs and typically form clusters under the in vitro culture condition. Meanwhile, DCs are much poorer at taking up antigens than other APCs such as monocytes and macrophages (7, 26, 43, 44). For example, Mo-DCs are much poorer at taking up antigens than monocytes, i.e., their precursors. Therefore, the loss of the strong ability to take up antigens and other characteristics of monocytes and macrophages is considered as key features of fully differentiated Mo-DCs (7). In this study, we discovered that MHCIIhi cDC2-gated CD115+CX3CR1+ cells are precursors to cDC2s in FL-BM culture. The newly identified MHCIIhi cDC2 precursor cells might possess certain characteristics similar to those of monocytes and macrophages prior to differentiating into cDC2s in FL-BM culture. Besides, there are still unresolved differences in view on the nature of MHCIIint GM-Macs (11, 55, 61, 62). Helft and others classified CD11c+CD11bhiMHCIIint cells in GM-BM culture as Macs or GM-Macs on the basis of their poor antigen presentation capacity, morphology, progenitor/precursor, and gene expression profile (11), whereas Lutz and others argued that GM-Macs might be a mixture of macrophages and immature DCs (55). The features of MHCIIhi pre-cDC2s that we have identified and characterized in the present study are quite similar to those of GM-Macs in many aspects: lack of dendritic morphology and cell clustering, poor antigen presentation, CD11c+2A1-CD83-CD115+CX3CR1+ phenotype, and similar gene expression profiles. Those two cell populations also have some notable differences: MHCIIhi pre-cDC2s in FL-BM culture have a MHCIIhi phenotype and are derived efficiently from pre-cDCs and CDPs but not from monocytes and cMoPs; GM-Macs have a MHCIIint phenotype and are derived efficiently from monocytes and cMoPs. Therefore, it will be intriguing to investigate and compare the differentiation potentials of those two cell populations under a variety of conditions.
It is well known that FLT3L-induced BM-DCs do not fully recapitulate the phenotype of cDCs in vivo. It is also recognized that developing better phenotypes of FLT3L-induced BM-DCs in vitro requires the addition of still many unidentified factors into FL-BM culture (63). Our discovery of a large number of MHCIIhi pre-cDC2s in FL-BM culture may reflect less than perfect in-vitro culture conditions for FLT3L-induced BM-DCs. If so, it is not likely that the in-vivo counterpart cells of the MHCIIhi pre-cDC2s exist in large numbers. Nonetheless, in the future studies, it will be important to determine and characterize an in-vivo counterpart of the MHCIIhi pre-cDC2s identified in FL-BM culture.
Data availability statement
The datasets presented in this study can be found in online repositories. The names of the repository/repositories and accession number(s) can be found below: https://www.ncbi.nlm.nih.gov/geo/query/acc.cgi?acc=GSE225321, GSE225321.
Ethics statement
The animal study was approved by The Institutional Animal Care and Use Committee of the Yonsei University College of Medicine. The study was conducted in accordance with the local legislation and institutional requirements.
Author contributions
Conceptualization: CP. Methodology: HI, JSP, HS, SR, MS, WC, SP, SH, HN, and CP. Formal Analysis: HI, HN, and CP. Investigation: HI, JSP, SR, WC, SH, and HN. Resources: JP, LC, and T-GK. Data Curation: HI. Writing – Original Draft: HI and CP. Writing – Review & Editing: HI, MC, HN, and CP. Visualization: HI and JSP. Supervision: HN and CP. Project Administration: HI and HN. Funding Acquisition: HN, MC, and CP. All authors contributed to the article and approved the submitted version.
Funding
The author(s) declare financial support was received for the research, authorship, and/or publication of this article. This work was supported by grants from the National Research Foundation of Korea to CP (2017R1D1A1B03028385, 2017M3A9C8064887, 2019M3A9B6064691, 2019R1F1A1041700), HN (2021R1I1A1A01043872), and MC (2022R1A2C1091767); the Korea Health Technology R&D Project through the Korea Health Industry Development Institute to MC (HV22C0106); the Brain Korea 21 PLUS/FOUR Project for Medical Science, Yonsei University.
Acknowledgments
We thank the Department of Laboratory Animal Resources, the Flow Cytometry Core Facility, and the Yonsei Advanced Imaging Center in cooperation with Carl Zeiss Microscopy of the Yonsei University College of Medicine for their kind help and technical support.
Conflict of interest
The authors declare that the research was conducted in the absence of any commercial or financial relationships that could be construed as a potential conflict of interest.
Publisher’s note
All claims expressed in this article are solely those of the authors and do not necessarily represent those of their affiliated organizations, or those of the publisher, the editors and the reviewers. Any product that may be evaluated in this article, or claim that may be made by its manufacturer, is not guaranteed or endorsed by the publisher.
Supplementary material
The Supplementary Material for this article can be found online at: https://www.frontiersin.org/articles/10.3389/fimmu.2023.1179981/full#supplementary-material
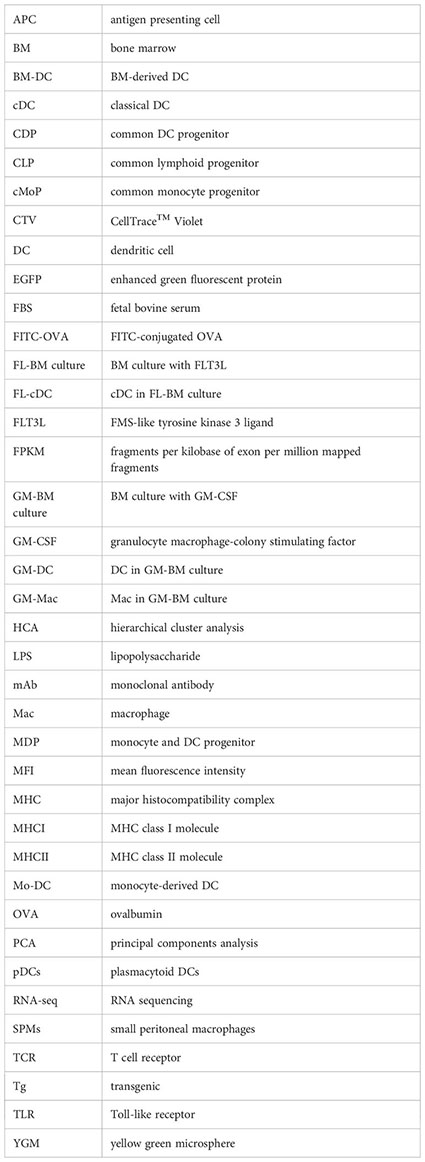
Glossary
References
1. Steinman RM, Witmer MD. Lymphoid dendritic cells are potent stimulators of the primary mixed leukocyte reaction in mice. Proc Natl Acad Sci U.S.A. (1978) 75(10):5132–6. doi: 10.1073/pnas.75.10.5132
2. Steinman RM. Decisions about dendritic cells: past, present, and future. Annu Rev Immunol (2012) 30:1–22. doi: 10.1146/annurev-immunol-100311-102839
3. Park CG. Vaccine strategies utilizing C-type lectin receptors on dendritic cells in vivo. Clin Exp Vaccine Res (2014) 3(2):149–54. doi: 10.7774/cevr.2014.3.2.149
4. Rodrigues PF, Alberti-Servera L, Eremin A, Grajales-Reyes GE, Ivanek R, Tussiwand R. Distinct progenitor lineages contribute to the heterogeneity of plasmacytoid dendritic cells. Nat Immunol (2018) 19(7):711–22. doi: 10.1038/s41590-018-0136-9
5. Hettinger J, Richards DM, Hansson J, Barra MM, Joschko A-C, Krijgsveld J, et al. Origin of monocytes and macrophages in a committed progenitor. Nat Immunol (2013) 14(8):821–30. doi: 10.1038/ni.2638
6. Fogg DK, Sibon C, Miled C, Jung S, Aucouturier P, Littman DR, et al. A clonogenic bone marrow progenitor specific for macrophages and dendritic cells. Science (2006) 311(5757):83–7. doi: 10.1126/science.1117729
7. Cheong C, Matos I, Choi JH, Dandamudi DB, Shrestha E, Longhi MP, et al. Microbial stimulation fully differentiates monocytes to dc-sign/cd209(+) dendritic cells for immune T cell areas. Cell (2010) 143(3):416–29. doi: 10.1016/j.cell.2010.09.039
8. Lutz MB, Kukutsch N, Ogilvie AL, Rossner S, Koch F, Romani N, et al. An advanced culture method for generating large quantities of highly pure dendritic cells from mouse bone marrow. J Immunol Methods (1999) 223(1):77–92. doi: 10.1016/S0022-1759(98)00204-X
9. Inaba K, Swiggard WJ, Steinman RM, Romani N, Schuler G, Brinster C. Isolation of dendritic cells. Curr Protoc Immunol (2009). 86(1):3.7.1–3.7.19. doi: 10.1002/0471142735.im0307s86. Chapter 3:Unit 3 7
10. Naik SH, Proietto AI, Wilson NS, Dakic A, Schnorrer P, Fuchsberger M, et al. Cutting edge: generation of splenic cd8+ and cd8- dendritic cell equivalents in fms-like tyrosine kinase 3 ligand bone marrow cultures. J Immunol (2005) 174(11):6592–7. doi: 10.4049/jimmunol.174.11.6592
11. Helft J, Bottcher J, Chakravarty P, Zelenay S, Huotari J, Schraml BU, et al. Gm-csf mouse bone marrow cultures comprise a heterogeneous population of cd11c(+)Mhcii(+) macrophages and dendritic cells. Immunity (2015) 42(6):1197–211. doi: 10.1016/j.immuni.2015.05.018
12. Inaba K, Inaba M, Romani N, Aya H, Deguchi M, Ikehara S, et al. Generation of large numbers of dendritic cells from mouse bone marrow cultures supplemented with granulocyte/macrophage colony-stimulating factor. J Exp Med (1992) 176(6):1693–702. doi: 10.1084/jem.176.6.1693
13. Girolomoni G, Lutz MB, Pastore S, Aßmann CU, Cavani A, Ricciardi-Castagnoli P. Establishment of a cell line with features of early dendritic cell precursors from fetal mouse skin. Eur J Immunol (1995) 25(8):2163–9. doi: 10.1002/eji.1830250807
14. Inaba K, Steinman RM, Pack MW, Aya H, Inaba M, Sudo T, et al. Identification of proliferating dendritic cell precursors in mouse blood. J Exp Med (1992) 175(5):1157–67. doi: 10.1084/jem.175.5.1157
15. Stössel H, Koch F, Romani N. Maturation and migration of murine dendritic cells in situ. In: Ricciardi-Castagnoli P, editor. Dendritic Cells in Fundamental and Clinical Immunology, vol. 3 . Boston, MA: Springer US (1997). p. 311–5.
16. Kelsall BL, Strober W. Distinct populations of dendritic cells are present in the subepithelial dome and T cell regions of the murine peyer's patch. J Exp Med (1996) 183(1):237–47. doi: 10.1084/jem.183.1.237
17. Inaba K, Pack M, Inaba M, Sakuta H, Isdell F, Steinman RM. High levels of a major histocompatibility complex ii–self peptide complex on dendritic cells from the T cell areas of lymph nodes. J Exp Med (1997) 186(5):665–72. doi: 10.1084/jem.186.5.665
18. Tiefenthaler M, Marksteiner R, Neyer S, Koch F, Hofer S, Schuler G, et al. M1204, a novel 2′,5′ Oligoadenylate synthetase with a ubiquitin-like extension, is induced during maturation of murine dendritic cells. J Immunol (1999) 163(2):760. doi: 10.4049/jimmunol.163.2.760
19. Stoitzner P, Stössel H, Wankell M, Hofer S, Heufler C, Werner S, et al. Langerhans cells are strongly reduced in the skin of transgenic mice overexpressing follistatin in the epidermis. Eur J Cell Biol (2005) 84(8):733–41. doi: 10.1016/j.ejcb.2005.04.003
20. Naik SH, O’Keeffe M, Proietto A, Shortman HHK, Wu L. Cd8+, cd8–, and plasmacytoid dendritic cell generation in vitro using flt3 ligand. In: Naik SH, editor. Dendritic Cell Protocols. Totowa, NJ: Humana Press (2010). p. 167–76.
21. Mayer JU, Hilligan KL, Chandler JS, Eccles DA, Old SI, Domingues RG, et al. Homeostatic il-13 in healthy skin directs dendritic cell differentiation to promote th2 and inhibit th17 cell polarization. Nat Immunol (2021) 22(12):1538–50. doi: 10.1038/s41590-021-01067-0
22. Tian L, Tomei S, Schreuder J, Weber TS, Amann-Zalcenstein D, Lin DS, et al. Clonal multi-omics reveals bcor as a negative regulator of emergency dendritic cell development. Immunity (2021) 54(6):1338–51.e9. doi: 10.1016/j.immuni.2021.03.012
23. Han SM, Na HY, Ham O, Choi W, Sohn M, Ryu SH, et al. Tcf4-targeting mir-124 is differentially expressed amongst dendritic cell subsets. Immune Network (2016) 16:61–74. doi: 10.4110/in.2016.16.1.61
24. Ryu SH, Na HY, Sohn M, Han SM, Choi W, In H, et al. Reduced expression of granule proteins during extended survival of eosinophils in splenocyte culture with gm-csf. Immunol Lett (2016) 173:7–20. doi: 10.1016/j.imlet.2016.03.003
25. Park SH, Cheong C, Idoyaga J, Kim JY, Choi J-H, Do Y, et al. Generation and application of new rat monoclonal antibodies against synthetic flag and ollas tags for improved immunodetection. J Immunol Methods (2008) 331(1):27–38. doi: 10.1016/j.jim.2007.10.012
26. Ryu SH, Na HY, Sohn M, Choi W, In H, Shin HS, et al. Competent antigen-presenting cells are generated from the long-term culture of splenocytes with granulocyte-macrophage colony-stimulating factor. Immunol Lett (2017) 188:96–107. doi: 10.1016/j.imlet.2017.06.010
27. Na HY, Sohn M, Ryu SH, Choi W, In H, Shin HS, et al. Extended culture of bone marrow with granulocyte macrophage-colony stimulating factor generates immunosuppressive cells. Immune network (2018) 18(2):e16–e. doi: 10.4110/in.2018.18.e16
28. Kim T-G, Kim SH, Park J, Choi W, Sohn M, Na HY, et al. Skin-specific cd301b+ Dermal dendritic cells drive il-17–mediated psoriasis-like immune response in mice. J Invest Dermatol (2018) 138(4):844–53. doi: 10.1016/j.jid.2017.11.003
29. Sohn M, Na HY, Ryu SH, Choi W, In H, Shin HS, et al. Two distinct subsets are identified from the peritoneal myeloid mononuclear cells expressing both cd11c and cd115. Immune Netw (2019) 19(3):e15. doi: 10.4110/in.2019.19.e15
30. Kang YS, Yamazaki S, Iyoda T, Pack M, Bruening SA, Kim JY, et al. Sign-R1, a novel C-type lectin expressed by marginal zone macrophages in spleen, mediates uptake of the polysaccharide dextran. Int Immunol (2003) 15(2):177–86. doi: 10.1093/intimm/dxg019
31. Kang YS, Kim JY, Bruening SA, Pack M, Charalambous A, Pritsker A, et al. The C-type lectin sign-R1 mediates uptake of the capsular polysaccharide of streptococcus pneumoniae in the marginal zone of mouse spleen. Proc Natl Acad Sci U.S.A. (2004) 101(1):215–20. doi: 10.1073/pnas.0307124101
32. Cheong C, Choi JH, Vitale L, He LZ, Trumpfheller C, Bozzacco L, et al. Improved cellular and humoral immune responses in vivo following targeting of hiv gag to dendritic cells within human anti-human dec205 monoclonal antibody. Blood (2010) 116(19):3828–38. doi: 10.1182/blood-2010-06-288068
33. Ryu SH, Shin HS, Eum HH, Park JS, Choi W, Na HY, et al. Granulocyte macrophage-colony stimulating factor produces a splenic subset of monocyte-derived dendritic cells that efficiently polarize T helper type 2 cells in response to blood-borne antigen. Front Immunol (2022) 12:767037. doi: 10.3389/fimmu.2021.767037
34. Sohn M, Na HY, Shin HS, Ryu SH, Park S, In H, et al. Global gene expression of T cells is differentially regulated by peritoneal dendritic cell subsets in an il-2 dependent manner. Front Immunol (2021) 12:648348(1795). doi: 10.3389/fimmu.2021.648348
35. Onai N, Obata-Onai A, Schmid MA, Ohteki T, Jarrossay D, Manz MG. Identification of clonogenic common flt3+M-csfr+ Plasmacytoid and conventional dendritic cell progenitors in mouse bone marrow. Nat Immunol (2007) 8(11):1207–16. doi: 10.1038/ni1518
36. Liu K, Victora GD, Schwickert TA, Guermonprez P, Meredith MM, Yao K, et al. In vivo analysis of dendritic cell development and homeostasis. Science (2009) 324(5925):392–7. doi: 10.1126/science.1170540
37. Naik SH, Sathe P, Park HY, Metcalf D, Proietto AI, Dakic A, et al. Development of plasmacytoid and conventional dendritic cell subtypes from single precursor cells derived in vitro and in vivo. Nat Immunol (2007) 8(11):1217–26. doi: 10.1038/ni1522
38. Lutz MB, Ali S, Audiger C, Autenrieth SE, Berod L, Bigley V, et al. Guidelines for mouse and human dc generation. Eur J Immunol. (2023). 53(11):2249816. doi: 10.1002/eji.202249816
39. Kwok I, Becht E, Xia Y, Ng M, Teh YC, Tan L, et al. Combinatorial single-cell analyses of granulocyte-monocyte progenitor heterogeneity reveals an early uni-potent neutrophil progenitor. Immunity (2020) 53(2):303–18.e5. doi: 10.1016/j.immuni.2020.06.005
40. Sathe P, Pooley J, Vremec D, Mintern J, Jin JO, Wu L, et al. The acquisition of antigen cross-presentation function by newly formed dendritic cells. J Immunol (2011) 186(9):5184–92. doi: 10.4049/jimmunol.1002683
41. Joffre OP, Segura E, Savina A, Amigorena S. Cross-presentation by dendritic cells. Nat Rev Immunol (2012) 12(8):557–69. doi: 10.1038/nri3254
42. Bohmwald K, Espinoza JA, Pulgar RA, Jara EL, Kalergis AM. Functional impairment of mononuclear phagocyte system by the human respiratory syncytial virus. Front Immunol (2017) 8:1643. doi: 10.3389/fimmu.2017.01643
43. Delamarre L, Pack M, Chang H, Mellman I, Trombetta ES. Differential lysosomal proteolysis in antigen-presenting cells determines antigen fate. Science (2005) 307(5715):1630–4. doi: 10.1126/science.1108003
44. Choi JH, Cheong C, Dandamudi DB, Park CG, Rodriguez A, Mehandru S, et al. Flt3 signaling-dependent dendritic cells protect against atherosclerosis. Immunity (2011) 35(5):819–31. doi: 10.1016/j.immuni.2011.09.014
45. Steinman RM, Cohn ZA. Identification of a novel cell type in peripheral lymphoid organs of mice. I. Morphology, quantitation, tissue distribution. J Exp Med (1973) 137(5):1142–62. doi: 10.1084/jem.137.5.1142
46. Steinman RM, Cohn ZA. Identification of a novel cell type in peripheral lymphoid organs of mice : ii. Functional properties in vitro. J Exp Med (1974) 139(2):380–97. doi: 10.1084/jem.139.2.380
47. Steinman RM, Adams JC, Cohn ZA. Identification of a novel cell type in peripheral lymphoid organs of mice. Iv. Identification and distribution in mouse spleen. J Exp Med (1975) 141(4):804–20.
48. Steinman RM, Kaplan G, Witmer MD, Cohn ZA. Identification of a novel cell type in peripheral lymphoid organs of mice. V. Purification of spleen dendritic cells, new surface markers, and maintenance in vitro. J Exp Med (1979) 149(1):1–16. doi: 10.1084/jem.149.1.1
49. Riol-Blanco L, Sánchez-Sánchez N, Torres A, Tejedor A, Narumiya S, Corbí AL, et al. The chemokine receptor ccr7 activates in dendritic cells two signaling modules that independently regulate chemotaxis and migratory speed. J Immunol (2005) 174(7):4070. doi: 10.4049/jimmunol.174.7.4070
50. Tang HL, Cyster JG. Chemokine up-regulation and activated T cell attraction by maturing dendritic cells. Science (1999) 284(5415):819–22. doi: 10.1126/science.284.5415.819
51. Rapp M, Wintergerst MWM, Kunz WG, Vetter VK, Knott MML, Lisowski D, et al. Ccl22 controls immunity by promoting regulatory T cell communication with dendritic cells in lymph nodes. J Exp Med (2019) 216(5):1170–81. doi: 10.1084/jem.20170277
52. Geijtenbeek TBH, Torensma R, van Vliet SJ, van Duijnhoven GCF, Adema GJ, van Kooyk Y, et al. Identification of dc-sign, a novel dendritic cell-Specific icam-3 receptor that supports primary immune responses. Cell (2000) 100(5):575–85. doi: 10.1016/S0092-8674(00)80693-5
53. Miller JC, Brown BD, Shay T, Gautier EL, Jojic V, Cohain A, et al. Deciphering the transcriptional network of the dendritic cell lineage. Nat Immunol (2012) 13(9):888–99. doi: 10.1038/ni.2370
54. Gautier EL, Shay T, Miller J, Greter M, Jakubzick C, Ivanov S, et al. Gene-expression profiles and transcriptional regulatory pathways that underlie the identity and diversity of mouse tissue macrophages. Nat Immunol (2012) 13(11):1118–28. doi: 10.1038/ni.2419
55. Lutz Manfred B, Inaba K, Schuler G, Romani N. Still alive and kicking: in-vitro-generated gm-csf dendritic cells! Immunity (2016) 44(1):1–2. doi: 10.1016/j.immuni.2015.12.013
56. Kedmi R, Najar TA, Mesa KR, Grayson A, Kroehling L, Hao Y, et al. A rorγt+ Cell instructs gut microbiota-specific treg cell differentiation. Nature (2022) 610(7933):737–43. doi: 10.1038/s41586-022-05089-y
57. Akagbosu B, Tayyebi Z, Shibu G, Paucar Iza YA, Deep D, Parisotto YF, et al. Novel antigen-presenting cell imparts treg-dependent tolerance to gut microbiota. Nature (2022) 610(7933):752–60. doi: 10.1038/s41586-022-05309-5
58. Teng F, Goc J, Zhou L, Chu C, Shah MA, Eberl G, et al. A circadian clock is essential for homeostasis of group 3 innate lymphoid cells in the gut. Sci Immunol (2019) 4(40):eaax1215. doi: 10.1126/sciimmunol.aax1215
59. Guilliams M, Dutertre C-A, Scott Charlotte L, McGovern N, Sichien D, Chakarov S, et al. Unsupervised high-dimensional analysis aligns dendritic cells across tissues and species. Immunity (2016) 45(3):669–84. doi: 10.1016/j.immuni.2016.08.015
60. Ferris ST, Ohara RA, Ou F, Wu R, Huang X, Kim S, et al. Cdc1 vaccines drive tumor rejection by direct presentation independently of host cdc1. Cancer Immunol Res (2022) 10(8):920–31. doi: 10.1158/2326-6066.Cir-21-0865
61. Helft J, Böttcher JP, Chakravarty P, Zelenay S, Huotari J, Schraml BU, et al. Alive but confused: heterogeneity of cd11c(+) mhc class ii(+) cells in gm-csf mouse bone marrow cultures. Immunity (2016) 44(1):3–4. doi: 10.1016/j.immuni.2015.12.014
62. Guilliams M, Malissen B. A matter of perspective: moving from a pre-omic to a systems-biology vantage of monocyte-derived cell function and nomenclature. Immunity (2016) 44(1):5–6. doi: 10.1016/j.immuni.2015.12.020
Keywords: antigen presentation, bone marrow cells, cell differentiation, cultured cells, dendritic cells, FLT3 ligand, GM-CSF, precursor cells
Citation: In H, Park JS, Shin HS, Ryu SH, Sohn M, Choi W, Park S, Hwang S, Park J, Che L, Kim T-G, Chu MK, Na HY and Park CG (2023) Identification of dendritic cell precursor from the CD11c+ cells expressing high levels of MHC class II molecules in the culture of bone marrow with FLT3 ligand. Front. Immunol. 14:1179981. doi: 10.3389/fimmu.2023.1179981
Received: 05 March 2023; Accepted: 08 November 2023;
Published: 29 November 2023.
Edited by:
Thomas Hieronymus, University Hospital RWTH Aachen, GermanyReviewed by:
Jan-Hendrik Schroeder, King’s College London, United KingdomMichael Chopin, Monash University, Australia
Copyright © 2023 In, Park, Shin, Ryu, Sohn, Choi, Park, Hwang, Park, Che, Kim, Chu, Na and Park. This is an open-access article distributed under the terms of the Creative Commons Attribution License (CC BY). The use, distribution or reproduction in other forums is permitted, provided the original author(s) and the copyright owner(s) are credited and that the original publication in this journal is cited, in accordance with accepted academic practice. No use, distribution or reproduction is permitted which does not comply with these terms.
*Correspondence: Chae Gyu Park, ChaeGyu@goodcapital.org; Hye Young Na, hyeyna@yuhs.ac; Min Kyung Chu, chumk@yonsei.ac.kr
†These authors have contributed equally to this work and share senior authorship