 Siwei Mo1,2†Chenyan Shi2,3†
 Yi Cai2Maozhu Xu4
 Hongmei Xu5
 Yuzhong Xu6Kehong Zhang6Yue Zhang2Jiao Liu7Siyi Che8Xiangyu Liu1Chaonan Xing2Xiaoru Long1*
 Xinchun Chen2*
 Enmei Liu1*
- 1Department of Respiratory Medicine, Children’s Hospital of Chongqing Medical University, National Clinical Research Center for Child Health and Disorders, Ministry of Education Key Laboratory of Child Development and Disorders, China International Science and Technology Cooperation Base of Child Development and Critical Disorders, Children’s Hospital of Chongqing Medical University, Chongqing Key Laboratory of Pediatrics, Chongqing, China
- 2Guangdong Provincial Key Laboratory of Regional Immunity and Diseases, Department of Pathogen Biology, School of Medicine, Shenzhen University, Shenzhen, China
- 3School of Public Health, Shenzhen University Medical School, Shenzhen University, Shenzhen, Guangdong, China
- 4Maternal and Child Care Health Hospital of Zunyi City, Zunyi, Guizhou, China
- 5Department of Infectious Diseases, Children’s Hospital of Chongqing Medical University, Chongqing, China
- 6Department of Clinical Laboratory, Shenzhen Baoan Hospital, The Second Affiliated Hospital of Shenzhen University, Shenzhen University, Shenzhen, China
- 7Pediatric Research Institute, Children’s Hospital of Chongqing Medical University, Chongqing, China
- 8Department of Radiology, Children’s Hospital of Chongqing Medical University, National Clinical Research Center for Child Health and Disorders, Ministry of Education Key Laboratory of Child Development and Disorders, Chongqing Key Laboratory of Pediatrics, Chongqing, China
Background: Tuberculous meningitis (TBM) is a devastating form of tuberculosis (TB) causing high mortality and disability. TBM arises due to immune dysregulation, but the underlying immune mechanisms are unclear.
Methods: We performed single-cell RNA sequencing on peripheral blood mononuclear cells (PBMCs) and cerebrospinal fluid (CSF) cells isolated from children (n=6) with TBM using 10 xGenomics platform. We used unsupervised clustering of cells and cluster visualization based on the gene expression profiles, and validated the protein and cytokines by ELISA analysis.
Results: We revealed for the first time 33 monocyte populations across the CSF cells and PBMCs of children with TBM. Within these populations, we saw that CD4_C04 cells with Th17 and Th1 phenotypes and Macro_C01 cells with a microglia phenotype, were enriched in the CSF. Lineage tracking analysis of monocyte populations revealed myeloid cell populations, as well as subsets of CD4 and CD8 T-cell populations with distinct effector functions. Importantly, we discovered that complement-activated microglial Macro_C01 cells are associated with a neuroinflammatory response that leads to persistent meningitis. Consistently, we saw an increase in complement protein (C1Q), inflammatory markers (CRP) and inflammatory factor (TNF-α and IL-6) in CSF cells but not blood. Finally, we inferred that Macro_C01 cells recruit CD4_C04 cells through CXCL16/CXCR6.
Discussion: We proposed that the microglial Macro_C01 subset activates complement and interacts with the CD4_C04 cell subset to amplify inflammatory signals, which could potentially contribute to augment inflammatory signals, resulting in hyperinflammation and an immune response elicited by Mtb-infected tissues.
Introduction
Tuberculous meningitis (TBM) is the most severe manifestation of extrapulmonary tuberculosis (TB). Although the incidence of TBM among individuals infected with Mycobacterium tuberculosis (Mtb) is low, this pathology is characterized by a disability and mortality rate (1) reaching as high as 20% in affected children under 5 years-of-age (2). TBM affects the central nervous system (CNS) and manipulates the activity of immune response (3); however, the specific role played by the immune system in this context is unclear.
So far, we know that lymphocytes — predominantly T/natural killer (NK) cells/natural killer T (NKT) cells—are the main infiltrating leukocytes in TBM (4–6). Flow cytometry results from a cohort study revealed that αβT and γδT cells, NK cells and MAIT cells were decreased in the cerebrospinal fluid (CSF) of those with TBM patients compared to those with pulmonary TB (5). Moreover, TBM is characterized by high production of pro- and anti-inflammatory cytokines such as tumor necrosis factor-α (TNF-α), interferon-γ (IFN-γ), IL-1β, IL-6, IL-8 and IL-10, which ultimately leads to immune disruption (7, 8). Specifically, increased inflammasome activation and decreased T-cell activation has been reported in the peripheral blood, and a high concentration of cytokines and chemokines in the CSF, along with brain injury biomarkers in the ventricular CSF (4). Interestingly, both an insufficient and excessive host inflammatory response has been associated with poor outcomes, thus implying that a delicate balance is crucial for a favorable prognosis (9, 10). While these observations provide a certain level of insight into TBM pathology, a mechanistic understanding is lacking. Methods used in previous studies have predominantly relied on bulk-RNA sequencing and flow cytometry, which have limited resolution to resolve the heterogeneity of immune cells in complex microenvironments.
Unveiling the profiles of the local and systemic immune response in TBM patients is urgently needed to improve the clinical care of affected patients. In this study, we aimed to determine the characterization of local immune responses to Mycobacterium tuberculosis, leading to insights into the specific immune landscape at the site of local Mtb infection. To do so, we performed massively parallel single-cell RNA sequencing (scRNA-seq) to compare the immune cell landscape of CSF cells and peripheral blood mononuclear cells (PBMCs) in a cohort of six children with TBM to determine the anti-Mtb response at the tissue level. We identified that a CD4 T-cell subset (with Th17 and Th1 phenotypes) and microglia were specifically enriched in the CSF of TBM patients compared to PBMCs. These cells exhibited a stronger interaction with tissue-resident CD4 T cells than other cell subclusters based on ligand-receptors analysis. Importantly, we observed that microglia participated in complement activation, thereby amplifying inflammatory signals and potentially contributing to pathological inflammation and brain damage.
Materials and methods
Patient recruiting, diagnostic criteria
Children with tuberculous meningitis (TBM) and non-TBM [viral meningitis (VM) and cryptococcal meningitis (CM)] admitted to the Affiliated Children’s Hospital of Chongqing Medical University, China, from September 2021 to October 2022 were recruited into this study. The study cohort included six children with TBM and one with CM whose PBMCs and lumbar CSF samples were collected, and one pediatric VM with only CSF sample. All collected PBMCs and CSF samples were used for scRNA-seq. A TBM diagnosis was confirmed if the child had a positive CSF culture for Mtb, or a positive CSF gene X-pert result, or a positive CSF Mtb macrogene test result, or a positive CSF antacid staining assay showing evidence of TB plus TBM clinical symptoms evident 1 week after anti-tuberculosis drug therapy. A VM diagnosis was confirmed if the child had a positive CSF macro gene test. A CM diagnosis was confirmed if the child had a positive CSF cryptococcal culture, or a positive CSF cryptococcal macrogene test result, or if the CM clinical symptoms were still evident after 1 week of lumbar spinal sheath injection therapy. At the time of sample collection, all children had received antimicrobial treatment, anti-cancer treatment, antibiotic treatment, corticosteroids or non-steroidal anti-inflammatory drugs for no longer than 2 weeks. The characteristics of all children are shown in Supplementary Table 1.
PBMC and CSF cell isolation
EDTA-whole blood samples were collected by venipuncture. PBMCs were obtained from 2 ml of whole blood samples by Ficoll-Hypaque density gradient separation (Ficoll-Paque Plus; Amersham Biosciences) (11). Lumbar CSF samples were collected during routine lumbar punctures for diagnostic or treatment purposes. CSF cells and the supernatant were separated by centrifugation of ≤1 ml CSF at 500 g for 5 min at 4°C within 1 h of fresh CSF collection. The isolated PBMCs and CSF cells were immediately stored at - 195°C until further use. Plasma from PBMCs and CSF cells supernatant were stored at - 80°C until further use.
Processing and sequencing of single-cell libraries
Cell viability was assessed by Trypanosoma cruzi blue staining and samples (with cell viability ≥90%) were prepared using a 10x Genomics Single Cell 30 v2 kit according to the manufacturer’s instructions (BGI, China). The single cell libraries were prepared as previously described (12) and sequenced on an Illumina HiSeq X Ten system (Illumina).
scRNA-seq data processing and quality control
Reads from single cells isolated using 10x chromium were demultiplexed and then aligned to the human genome (GRCh38), version 32 (Ensembl 98) using Cell Ranger (version 6.1.2, 10x Genomics) with default parameters, and counted by molecular identifier (UMI). The UMI matrix was then analyzed using the Seurat package (version 4.1.1) in R software (version 4.1.2). Low-quality cells were filtered out if they expressed fewer than 200 genes or had a percent.mt (The Percentage of Reads that Map to The Mitochondrial Genome) >10% (12).
Dimensionality reduction, unsupervised clustering, and cell type determination
The gene expression matrices of the remaining cells were normalized with default parameters using the “NormalizeData” (normalization.method = “LogNormalize”, scale.factor = 10000) function. Then, the normalized values were used to select highly variable genes (HVGs) with the “FindVariableFeatures” function (election.method = “vst”). The expression profiles of HVGs were converted to z-scores using the function “ScaleData” while unwanted variables were regressed out with the function vars.to.regress = “percent.mt”. Principle components (PCs) were estimated based on the selected HVGs with the function “RunPCA”, and the first 20 PCs explaining most of the overall changes were selected for downstream analysis. Harmony package (version 1.0) (13) was used to remove the batch effects of the samples. The two functions “FindNeighbors” and “FindClusters” were then used to find clusters of expression-similar cells with empirically set resolutions, and “resolution = 0.8” was used in the downstream analyses.
For visualization, t-distributed stochastic neighbor embedding (t-SNE) was used to generate a two-dimensional cell atlas. Two rounds of clustering were performed to identify the cell type of each cluster; if a cluster from the second round needed to be further subdivided, the clustering analysis was performed again. The main immune cell types were annotated based on the expression pattern of differentially expressed genes (DEGs) and the canonical gene markers for various cell types. The first round of clustering identified four main immune cell types including T cells (CD3D, CD3E, and CD3G), NK cells (CD16 and CD56), B cells (CD79A, CD20, MZB1, and JCHAIN), and myeloid cells (CD68, CD14, LYZ, and CST3). Several clusters were removed, including platelets (PPBP, PF4, and NRGN), erythroblast (HBB, HBA1, and HBA2), and doublets (cells expressing more than one major cell type marker were considered as doublets). A second-round clustering was performed with the same method to identify subclusters of T cells, NK cells, B cells and myeloid cells
Differential composition analysis
A T-test and the Wilcox to test were used for differences in cluster abundance (cell counts) between CSF donors and PBMC donors. Both methods were used as the estimated proportion of one cell type in each donor might be over-dispersed when cell types are scarce. As the outcomes from both methods were consistent, only the difference component analysis from the Wilcoxon comparisons is presented (14).
Differential expression, gene ontology enrichment and KEGG enrichment analysis
The significantly overexpressed marker genes for clusters were identified using the “FindMarkers” or “FindAllMarkers” function of Seurat. Genes with an adjusted p value < 0.05 by Wilcoxon rank-sum test were defined as cluster-specific signature genes. To identify the potential functions of cell clusters, an enrichment analysis was performed with marker genes for cell clusters. Gene Ontology (GO) enrichment and Kyoto Encyclopedia of Genes and Genomes (KEGG) pathway enrichment were performed with the R package “cluster Profiler (version 4.7.1.2)”.
Gene set enrichment analysis
For the single cluster enrichment analysis, normalized and centered expression data were converted to z-scores; for each cluster, the z-score for each cell was the mean value for each gene. The Wilcoxon rank sum test in the presto package (v1.0.0) was used to obtain the rank of all genes before the fgsea package (v1.17.1) was used to calculate GSEA enrichment scores and p values for each gene set collection. Overall, activity scores for each cell were compared using generalized linear models and visualized in heatmaps.
AddModuleScore
Enrichment scores were calculated using Seurat function AddModuleScore, which calculated the average expression of a gene set by subtracting the aggregated expression of control gene sets, which could be deemed as the average relative expression. The results are visualized in heatmaps.
Developmental trajectory inference
The monocle2 R package (version 2.22.0) was used to infer the developmental trajectories of each major cell type or cell populations. The monocle function, “Differential Gene Test”, was used to detect genes with differential expression between clusters to construct the cluster-based trajectory.
Cell-cell interaction analysis
To study intercellular communication among cell populations, the R package “Cell Chat (version 1.6.1)” was applied (15). The aggregated cell-cell communication network was calculated using the “aggregate Net” function in Cell Chat. The results were visualized using the function “net Visual circle” and “net Visual chord gene”.
Measurement of C1Q, C-reactive protein, TNF-α and IL-6
The concentrations of C1Q, C-Reactive Protein (CRP), TNF-α, and IL-6 in paired blood plasma and CSF cells supernatant from patients with TBM (n=8, see Supplementary Table 1 for Cohort II) were determined using an enzyme-linked immunosorbent assay (ELISA) kit (Elabscience/Liankebio, China) according to the manufacturer’s instructions.
Statistical analysis
The statistical tools, methods, and thresholds for each analysis are described within the respective results, figure legends or methods sections. Differences between two groups were analyzed by paired t-test. All statistical analyses were performed in GraphPad Prism (v8.0). Two-sided statistical tests were conducted, and P values <0.05 were considered statistically significant.
Results
Single-cell transcriptional profiles of paired PBMCs and CSF cells in pediatric TBM patients
Our first aim was to objectively characterize the specific composition and expression of CSF cells compared to PBMCs from pediatric patients with TBM. To do so, we performed single-cell RNA sequencing (scRNA-seq) on paired CSF cells and PBMCs from six patients (one patient lacked a PBMC sample) (Figure 1A). We obtained 57,797 single-cell transcriptomes of CSF cells (six samples) and 64,399 of PBMCs (five samples) (Supplementary Figure 1A and Supplementary Tables 2, 3). After removing approximately 12.94% of the non-immune cells (0.06% basal cells, 1.95% erythroblast and 0.59% platelets), duplex cells (7.05% doublet cells, 0.36% Mix/HSC-like cells, and 2.93% undefined cells), empty droplets and poor quality droplets (see Materials and Methods), we extracted 106,386 cells from CSF and PBMC datasets for further analysis (Supplementary Figures S1B–D and Supplementary Table 3).
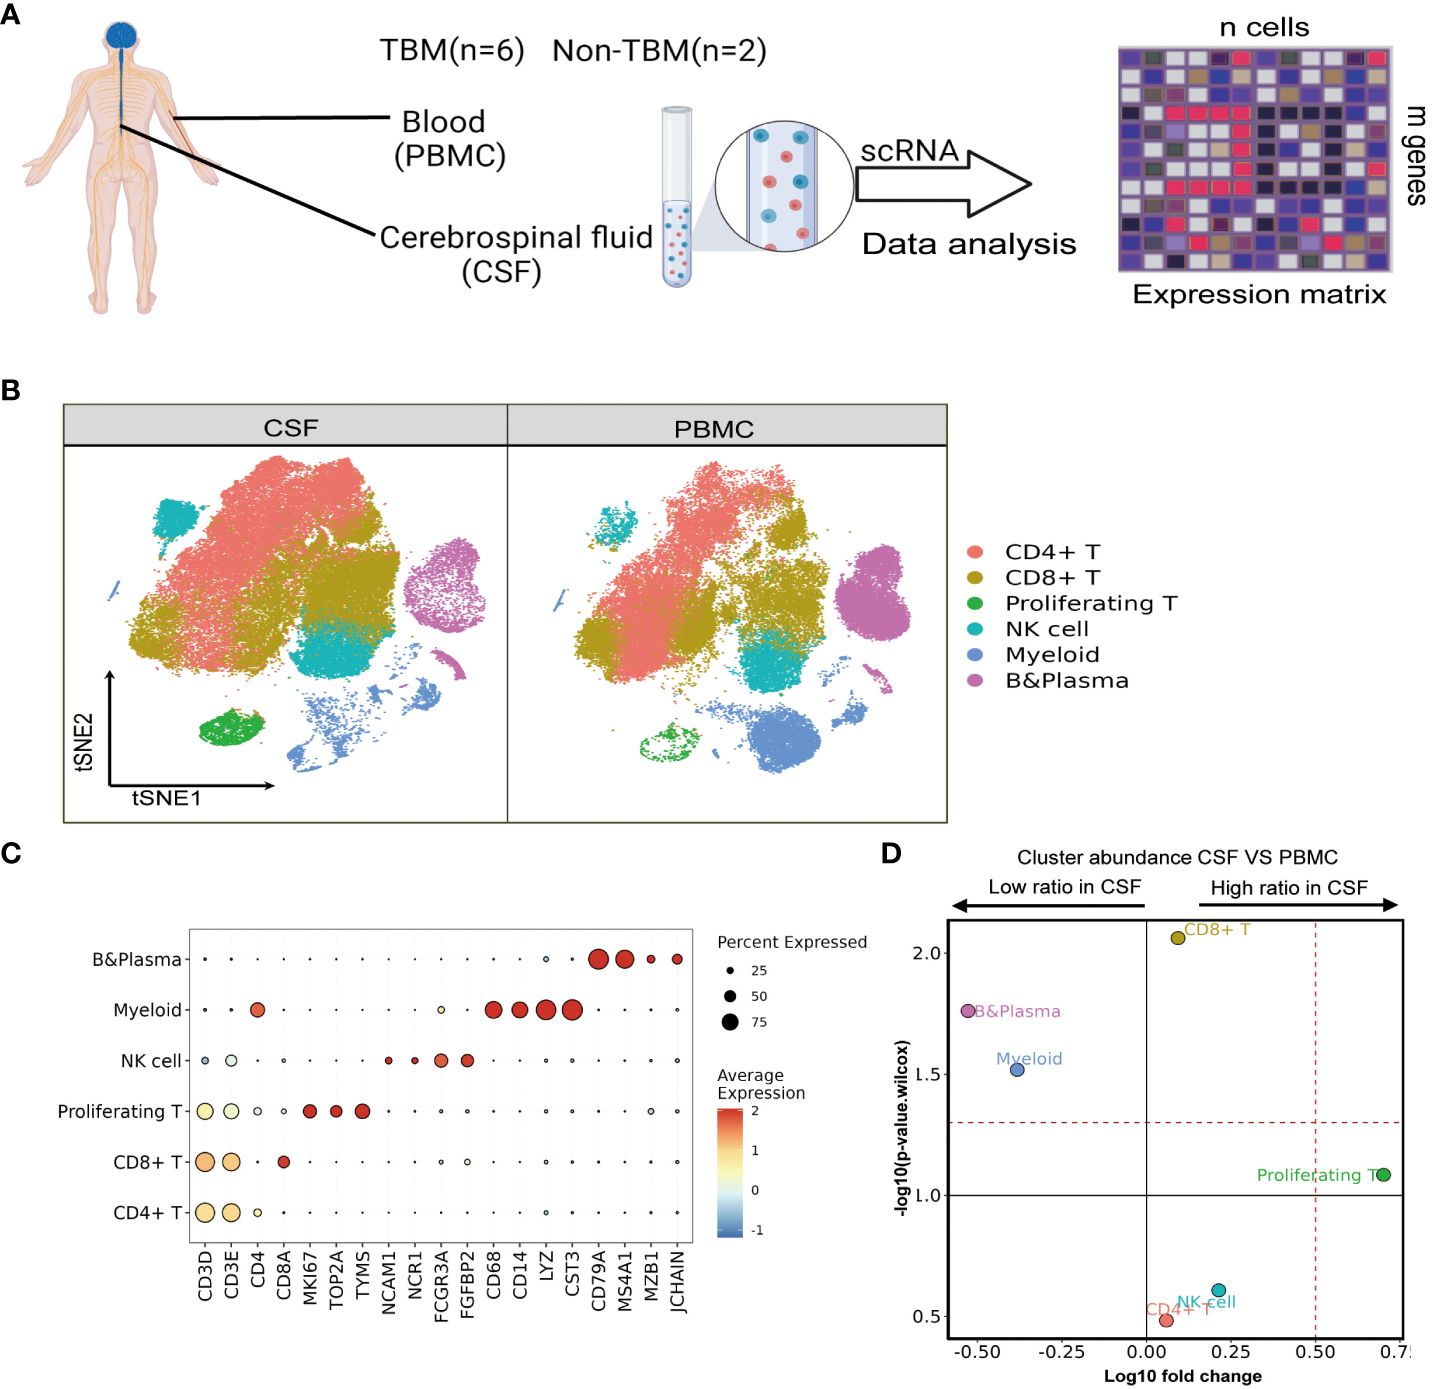
Figure 1 Single-cell transcriptional profiles of paired PBMCs and CSF cells from pediatric TBM patients. (A) Experimental procedure for defining and comparing immune PBMCs and CSF cells in TBM and Non-TBM samples. (B) Immune cell profiles of tSNE, color-coded for each major cell type and associated cell subpopulations from TBM patients (samples of PBMCs, n = 6; samples of CSF cells n = 5). (C) Dot plots depicting selected marker genes in cell clusters. The dot size encodes the percentage of cells expressing the gene, and the color encodes the average level of gene expression per cell. (D) Volcano plots depicting differences in cluster abundance in CSF cells versus PBMCs based on β-binomial regression plotting the change in multiplicity of differences (log10) versus p-value (- log10) (Methods). Horizontal lines indicate significance thresholds.
We classified all remaining cells into six distinct clusters by unsupervised clustering, which were annotated as CD4, CD8, NK, Myeloid, and B cells as well as proliferating T cells from the cell cycle based on marker gene expression (Figures 1B, C). We observed a moderate increase in T cells in the CSF, which consisted of 36.28% and 32.14% CD4 T cells (n=36556), followed by 36.47% and 29.59% CD8 T cells (n=35407) and 3.96% and 0.74% proliferating T cells (n=2624) in CSF cells and PBMCs, respectively. Notably, myeloid cells and B cells were significantly reduced among CSF cells: Myeloid cells (n=8604) accounted for 11.95% in PBMCs but only 4.76% in CSF cells, while B cells (n= 11868) accounted for 17.81% of PBMCs but only 5.32% in CSF cells. Meanwhile, the NK cell population was increased in CSF cells compared to PBMCs, but the difference was not statistically significant (Figure 1D and Supplementary Table 3).
High heterogeneity of CD4 T cells in paired PBMCs and CSF cells from patients with TBM
We saw that CD4 T-cells accounted for the largest proportion of immune cells in the CSF and PBMCs, and thus likely played a crucial role in regulating Mtb infection. We next further separated the CD4 T cells into six subsets in order to reveal high level of heterogeneity (Figure 2A and Supplementary Tables 4, 5). To annotate the subsets, we collected marker gene signatures from FindAllMarkers in the Seurat package and from published datasets, which we used for cellular identification or phenotypic determination (Figures 2B, C and Supplementary Table 6). Based on classical markers and published signatures (16–22), we identified two naive CD4 T-cell subsets, CD4_C01 and CD4_C02, which highly expressed CCR7, SELL, LEF1, and TCF7 and were enriched in the naive signatures. CD4_C03 was enriched in the central memory signature and highly expressed ANXA1, ANXA2, IL7R, CD74 and CD69. Meanwhile CD4_C04, a tissue-resident subset (CD4_TRM) (22), was characterized by high HOPX, ID2, CXCR6, ITGAE, ITGA1, MYADM and PTGER4 expression. According to previous studies (18, 19), CD4_C04 also exhibited Th17 and Th1 phenotypic signatures (Figure 2C and Supplementary Table 6). CD4 regulatory T cells (CD4_C05) (18) had high FOXP3, CTLA4, IL2RA and RTKN2 expression, while CD4_C06 resembled exhausted T cells with high LAG3, PDCD1, TIMD4, HAVCR2 expression (Figures 2B, C and Supplementary Tables 4–6). Although all subsets were found in both PBMCs and CSF cells, their relative proportions varied depending on the tissue. CD4_C04 and CD4_C06 were significantly enriched in CSF cells, and CD4_C05 had a slight increase, although it was significantly enriched in CSF cells compared to PBMCs. By contrast, CD4_C01 were significantly reduced in the CSF cells compared to PBMCs (Figure 2D and Supplementary Table 3).
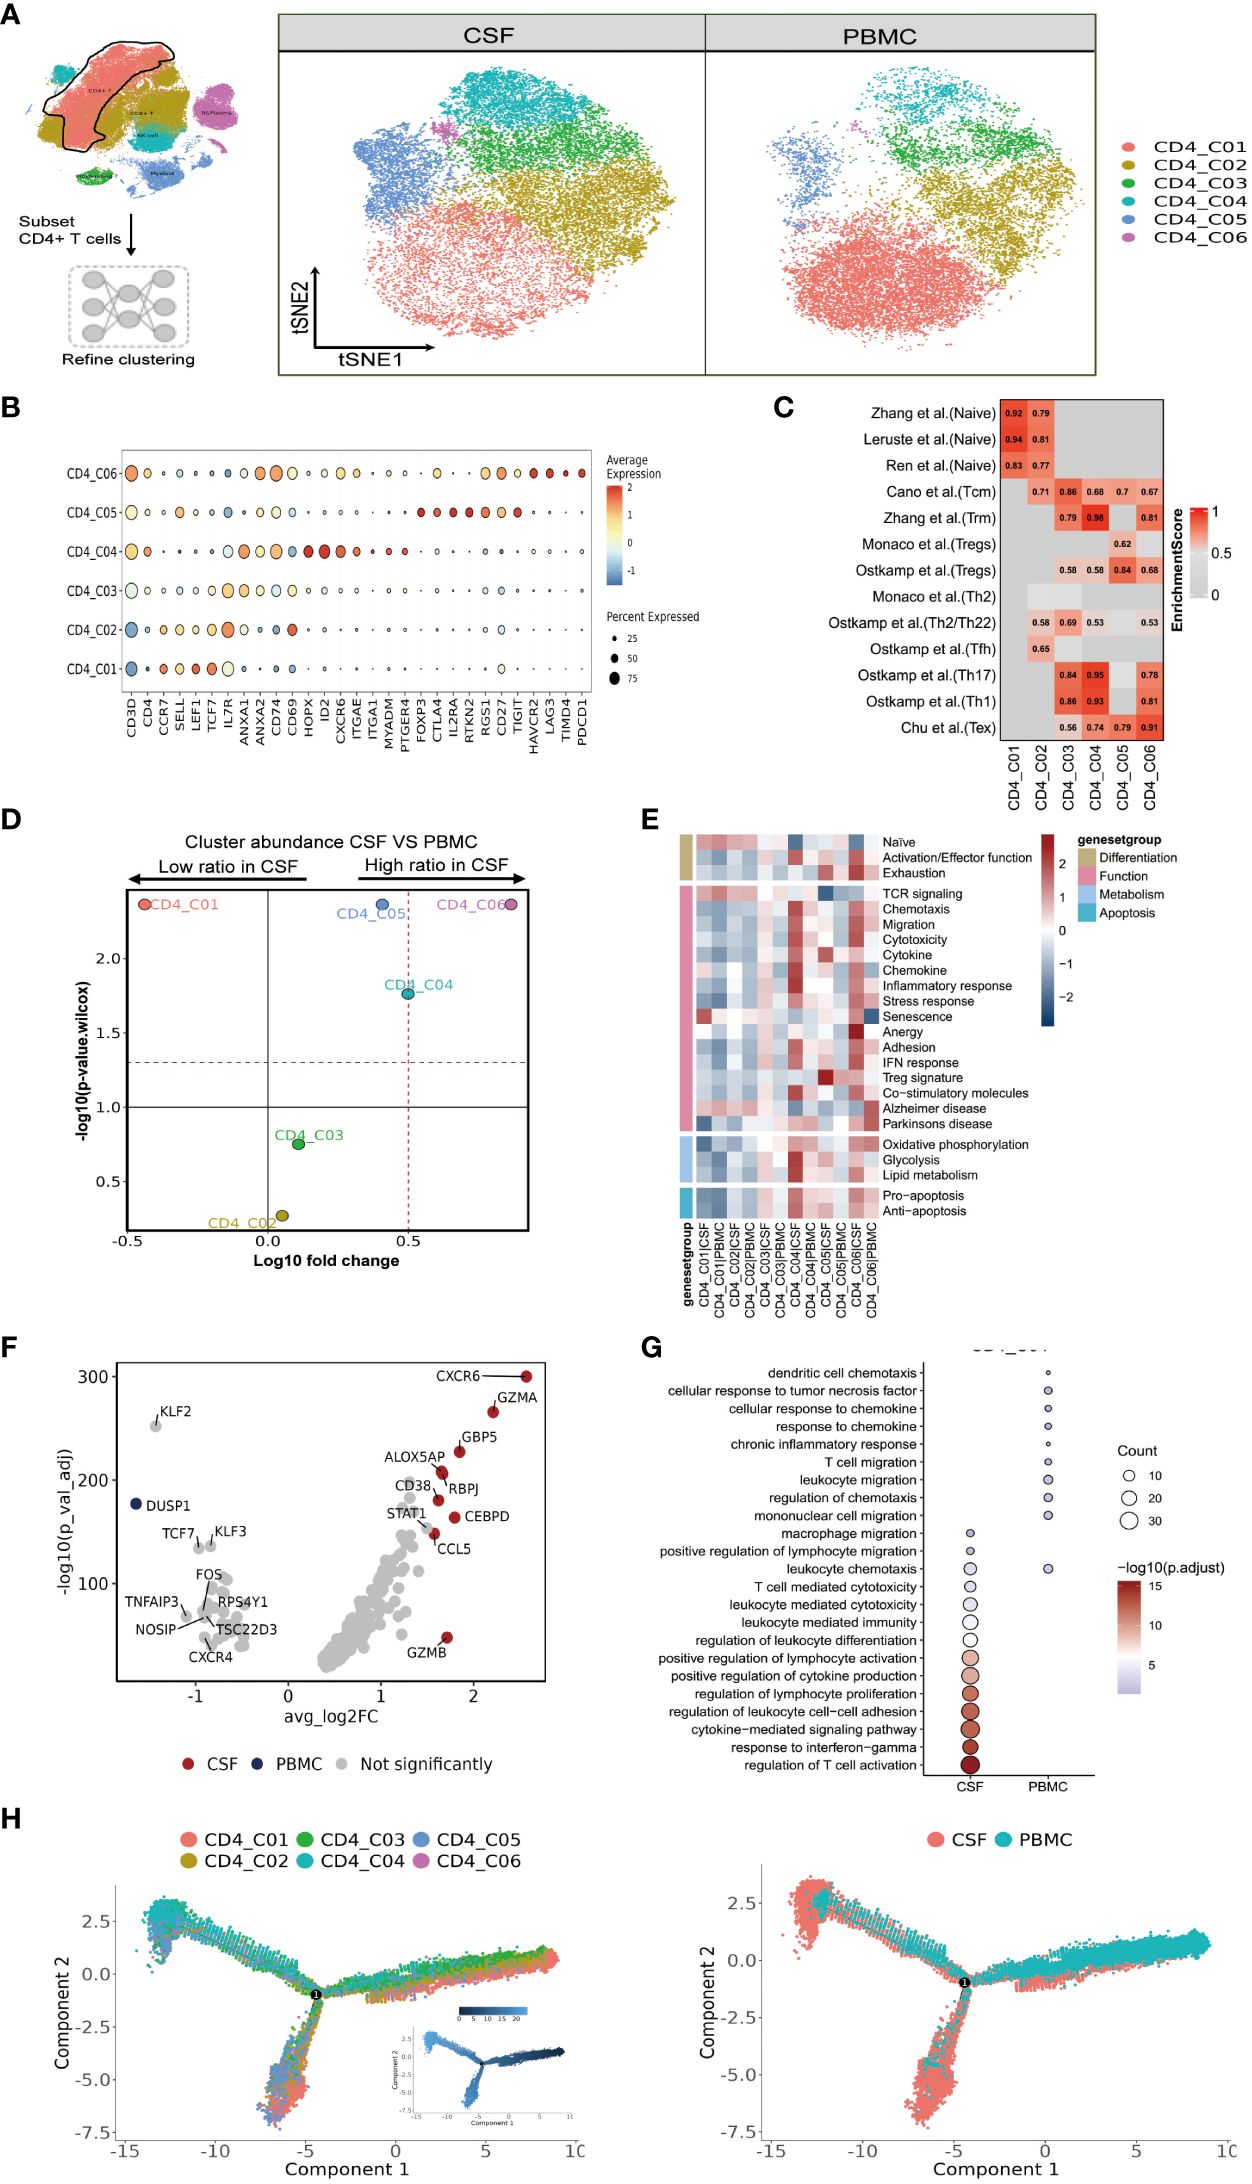
Figure 2 High heterogeneity of CD4 T cells in paired PBMCs and CSF cells from patients with TBM. (A) The subset strategy and flow diagram of CD4 T-cell lineage after clustering from paired PBMCs and CSF cells. (B) Dot plots of the average expression of selected typical markers and the percentage of cells expressing these markers in each labeled CD4 T-cell subtype. (C) CD4 T-cell subsets enriched for specific markers or marker genes from published datasets; enrichment scores are shown in heatmaps. TRM, tissue resident memory; Tex, exhaustion. (D) Volcano plots showing differences in CSF versus PBMC CD4 T-cell cluster abundance based on t-tests, plotted as the fold change (log10) versus the p-value (- log10). (E) Heatmaps showing the expression of 24 curated gene signatures (see Supplementary Table 8) in CD4 T-cell clusters. (F) Volcano plots showing the differentially expressed genes in CSF CD4_C04 versus PBMC CD4_C04 cells (n = 6). Each red dot indicates passing the P-value and fold difference (P < 0.01; average fold-change >1.5) thresholds. (G) Enrichment of GO bioprocess (BP) terms in CD4_C04 cells between CSF cells and PBMCs (options shown; adjusted p-values are indicated by colored bars). (H) Monocle2 analysis of CD4 T-cell cluster pseudotimes: associated cell types and corresponding states (samples of PBMCs, n = 6; samples of CSFs, n = 5) are shown.
We next performed functional enrichment analyses of the DEGs of these subsets. To do so, we examined each state of each subcluster of CD4 cells across multiple datasets (23) (Figure 2E and Supplementary Table 8). Among the CSF-enriched CD4 clusters, we discovered that CD4_C04 and CD4_C06 exhibited high expression of activation and effector gene signatures, while CD4_C05 and CD4_C06 cells were predominantly in the exhaustion state. Additionally, when compared to other CD4 cells, CD4_C04 and CD4_C06 clusters not only displayed strong chemotactic, migratory and adhesion features, but also significantly expressed genes related to cytolytic activity, chemokines, a strong inflammatory response/IFN response, and co-stimulatory molecules. CD4_C04 cells exhibited stronger glycolysis and lipid metabolism, as well as stronger expression of pro- and anti-apoptotic gene signatures. CD4_C05 showed typical Treg marker expression and high cytokine expression. TCR signaling was only observed in CD4_C01 and CD4_C02 (Figure 2E and Supplementary Table 8).
Because the CD4_C06 cluster had a low number of cells (n=384), we investigated the gene signature of the characteristic CD4_C04 subcluster in CSF cells. Nine genes were defined by selected from DEGs between CSF and PBMC (with threshold adjusted P value <0.05 and the absolute value of log2 fold change >1.5). Here, two known IFN-γ-related genes (GBP5 and CCL5), and four genes with cytotoxic functions (ALOX5AP, CEBPD, GZMA and GZMB) were more highly expressed in CSF CD4_C04 cells compared to the corresponding PBMCs (Figure 2F and Supplementary Table 7). Gene ontology (GO) enrichment analysis revealed that genes upregulated in CSF CD4_C04 were associated with regulation of lymphocyte proliferation, leukocyte differentiation, chemotaxis and positive regulation of lymphocyte activation and migration compared to the corresponding PBMCs (Figure 2G).
Complete transcriptomic data for most T cells allowed us to gain insight into the functional states and interrelationships of these cells. Using this information, we could construct intercellular developmental trajectories (24) to model the course of CD4 T cells over time and to determine their differential trajectories between CSF cells and PBMCs. By generating a monocle2 plot, we saw a connecting node between the CD4 T-cell subsets that represents a potential bridge to transdifferentiation. Among them, CD4_C03 and CD4_C05 were on the trajectory differentiation pathway, connecting with other naïve (CD4_C01 and CD4_C02) CD4 T-cell subsets. We also observed that tissue-resident CD4_C04 cells, regulatory CD4_C05 T cells, and CD4_C06 T cells with exhaustion features appeared at one end of the pseudo-temporal node and were in a state of terminal differentiation (Figure 2H). Together, we could conclude that the developmental states of CD4 T cells in the CSF are ultimately CD4_C04, CD4_C05 and CD4_C06, with CD4_C04 cells being more enriched in the CSF compared to PBMC (Figure 2H).
Heterogeneity of CD8 T cells in paired PBMCs and CSFs from patients with TBM
We next focused our attention on CD8 T cells, as optimal immunization against Mtb infection involving CD8 T cells (25). We were able to classify CD8 T cells into six subclusters (Figure 3A and Supplementary Tables 4, 5), and according to the FindAllMarkers labeling and published signatures, we could annotate CD8_C02 and CD8_C03 as naive CD8 T cells (CCR7, SELL, LEF1, TCF7), CD8_C01 and CD8_C05 as effector memory CD8 T cells (GZMK, CCL5, CCL4, NKG7), CD8_C04 as mucosal-associated invariant CD8 T (MAIT) cells (SLC4A10, NCR3, ZBTB16, RORA, KLRB1), and CD8_C06 as exhausted T cells (LAG3, PDCD1, TIMD4, HAVCR2; Figure 3B and Supplementary Tables 5, 6). We then confirmed the phenotypes of these cells by referring to published signatures (17, 22, 26–28). Specifically, CD8_C01 was characterized by terminal effector CD8 T cells, whereas CD8_C04 was characterized by tissue-resident CD8 T cells and MAIT cells (Figure 3C and Supplementary Table 6). In terms of the proportions of CD8 T cells between the CSF and PBMCs, we noticed that subset CD8_C02 were significantly decreased. Meanwhile, CD8_C01, CD8_C03, CD8_C05 and CD8_C06 were increased in CSF, with the latter being significantly increased (Figure 3D and Supplementary Table 3). Compared to PBMCs, the CSF CD8 T-cell subsets C01-C05 highly expressed inflammation-associated genes (GBP1, GBP4 and GBP5) and IFN-related genes (ISG20, SOCS1, STAT1, IFI16, IFI44L) in CSF (Table S7 in the Supplementary Appendix). In addition, CSF CD8_C01 exhibited high GZMK and low GNLY expression, indicative of cytotoxicity, while CD8_C04 showed high GZMB and CXCR6, indicative of cytotoxicity and residency (Supplementary Table 7).
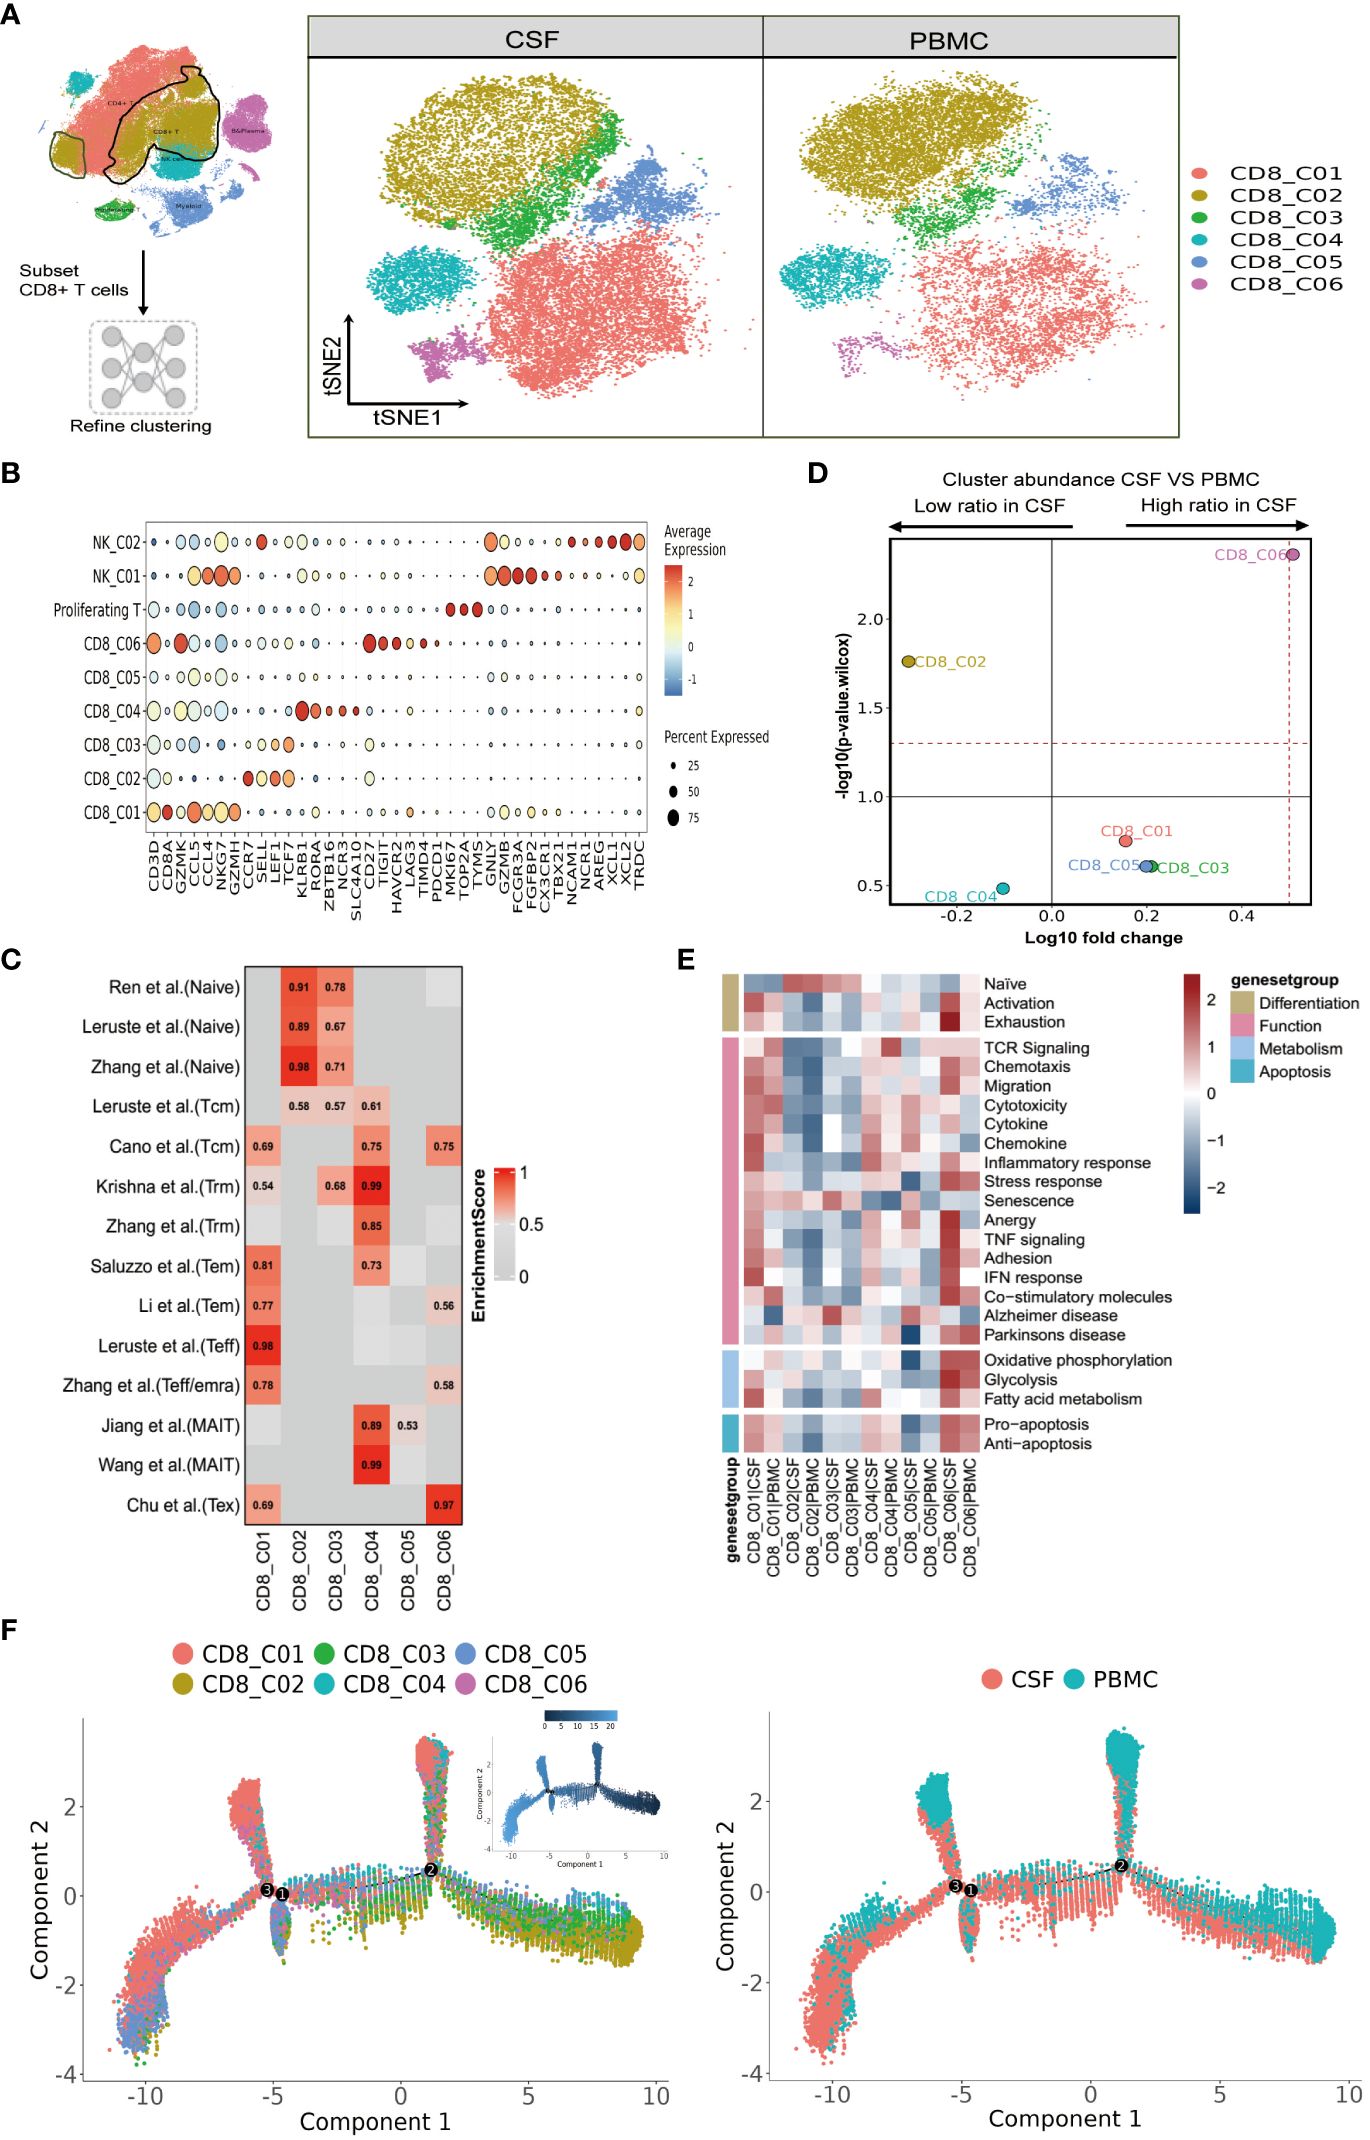
Figure 3 Heterogeneity of CD8 T cells in paired PBMCs and CSF cells from patients with TBM. (A) Subset strategy and flow diagram of the CD8 T-cell lineage after clustering from paired PBMCs and CSF cells. (B) Dot plots showing marker genes for each CD8 T-cell subcluster. (C) CD8 T-cell subsets enriched for specific markers or marker genes from published datasets; enrichment scores are shown in heatmaps. Temra, effector memory or effector; Teff, effector; TRM, tissue resident memory; Tex, exhaustion. (D) Volcano plots showing the differences in CSF versus PBMC CD8 T-cell cluster abundance based on t-tests, plotted as the fold change (log10) versus the p-value (- log10). (E) Heatmaps showing the expression of 24 curated gene signatures (see Supplementary Table 8) in CD4 T-cell clusters. (F) Monocle2 analysis of CD8 T-cell cluster pseudotimes: associated cell types and corresponding states (samples of PBMCs, n = 6; samples of CSFs, n = 5) are shown.
We next analyzed the state of each subcluster of CD8 cells using 24 curated gene signatures (23). Among the CD8 clusters enriched in the CSF, we discovered that CD8_C01 exhibited stronger responses in all four cell states, as characterized by high inflammatory/IFN responses (Figure 3E and Supplementary Table 8). For the DEGs of CD8_C03, these were enriched in senescence and Alzheimer’s disease. Meanwhile, the CD8_C06 subset represented an activated state with characteristics of exhaustion. Moreover, CD8_C06, enriched in CSF, not only displayed enhanced Pro-apoptosis/Anti-apoptosis signaling and metabolism, but also demonstrated strong signaling states in Chemotaxis, Migration, Stress response, Anergy, TNF signaling, Adhesion, IFN response, and Co-stimulatory molecules compared to all other CD8 subsets. The MAIT cells (CD8_C04) (which were in a lower proportion in CSF compared to PBMCs) displayed stronger cytokine, inflammatory, and IFN responses and fatty acid metabolic states. Finally, we observed that the TCR signaling of CD8 subclusters was mainly concentrated in CD8_C01 and CD8_C04 of PBMC (Figure 3E and Supplementary Table 8).
We then utilized the same method to track the trajectory of CD8 T-cell development. Monocle2 analysis revealed the differentiation gradient of CD8 T cells from the initial clusters (CD8_C02 and CD8_C03) to the activated clusters, as well as the potential differentiation trajectories among the CD8 subsets (Figure 3F). The developmental trajectories of CD8 T cells was similar for CD8_C01 cells (predominantly from the CSFs); by contrast, CD8_C04 cells (predominantly from PBMCs) and CD8_C05 cells (from CSFs) exhibited different trajectories according to the Pseudotime trajectory nodes and were connected to other CD8 subsets. Further analysis revealed that CD8_C01 and CD8_C05 were located at one end of terminal differentiation (the opposite end of the initial CD8 cluster) and that CD8_C01 and CD8_C05 were more enriched in CSFs (Figure 3F), suggestive of distinct cell fates of CD8_C01 and CD8_C05 cells in CSF cells and PBMCs.
Single-cell immune profiling reveals a unique myeloid cell population in paired PBMCs and CSF
We next aimed to resolve the composition and transcriptome of the myeloid cells present in the PBMCs and CSF. Again, using FindAllMarkers, we sorted the available myeloid cells into 15 cell subsets comprising five monocyte, four macrophage, four dendritic cell, and two neutrophil clusters (Figure 4A and Supplementary Tables 4, 5). Mono_C01, C02, C03 and C05 contained the CD14+CD16- (“classical”) monocytes, as indicated by high VCAN, FCN1, S100A12 and S100A9 marker expression. Mono_C04 represented non-classical (CD14-CD16+) monocytes, with high HK3, CX3CR1, PILRA and LST1 expression (Figure 4B and Supplementary Tables 4, 5). As before, we confirmed the monocyte cell subsets using published signatures (29) (Figure 4C and Supplementary Table 6). Among the four defined macrophage subsets, Macro_C01 exhibited characteristics of microglia (30–32) with the expression of C1QA, C1QB, C1QC, APOE, C3, PLTP, MAF and SLCO2B1 (Figures 4B, C and Supplementary Tables 5, 6). Macro_C02 showed high expression of the inflammatory marker S100A9, while Macro_C03 represented IFN-responsive macrophages with high IFIT2, ISG15, IFIT3 and TNFSF10 expression. Finally, Macro_C04 showed high LYZ expression (Figure 4C and Supplementary Table 6).
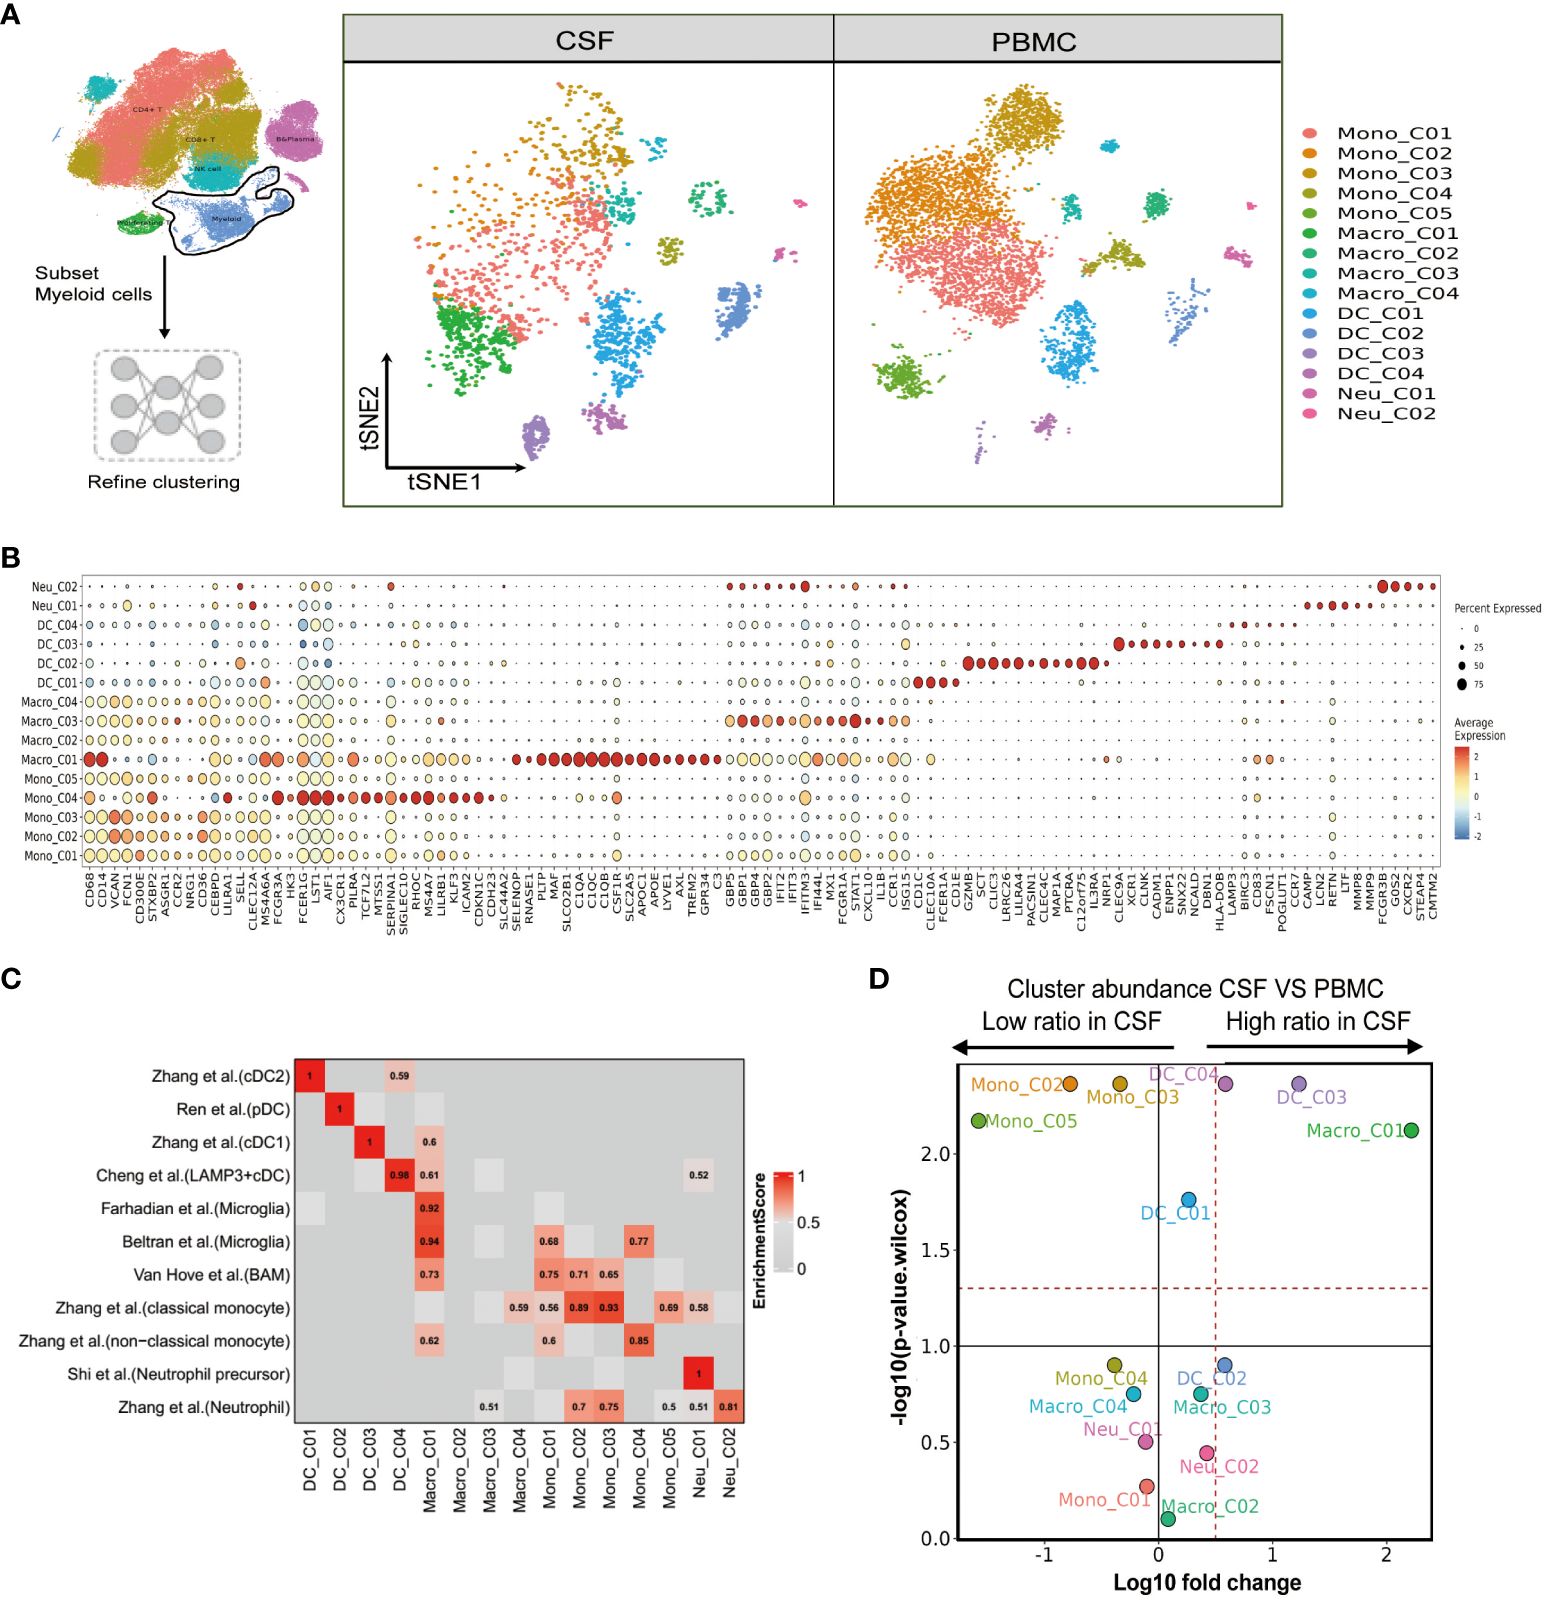
Figure 4 Single-cell immune profiling reveals the specific composition and transcriptome of myeloid cells in paired PBMCs and CSF cells. (A) Subset strategy and flow diagram of myeloid cell lineage after clustering from paired PBMCs and CSF cells. (B) Dot plots showing marker genes for each myeloid cell subcluster. (C) Myeloid cell subsets enriched for specific markers or marker genes from published datasets; enrichment scores are shown in heatmaps; BAM, border-associated macrophages. (D) Volcano plots showing differences in CSF versus PBMC myeloid cell cluster abundance based on t-tests, plotted as the fold change (log10) versus the p-value (- log10).
We also determined that the dendritic cell subset DC_C01 and DC_C03 represented classical cDC2 (CD1C, CLEC10A, FCER1A and CD1E) and cDC1 (CLEC9A, XCR1, CLNK and CADM1), respectively. A pDC (plasma-like DC) subset DC_C02 was also identified based on high LILRA4, MZB1, ITM2C and CLEC expression. Finally, DC_C04 showed cDC characteristics with high LAMP3 expression (Figure 4B and Supplementary Table 6). We further defined the characters of DC cell subsets using published signatures (20, 29, 33, 34) (Figure 4C and Supplementary Table 6). We identified two neutrophil subsets based on our FindAllmarker analysis and published references (29, 35). Neu_C02 highly expressed neutrophil markers (CSF3R, FCGR3B, G0S2 and NAMPT), whereas Neu_C01 represented a neutrophil precursor characterized by CAMP, LCN2, RETN and LTF (Figures 4B, C and Supplementary Tables 4–6). In the comparison analysis, we observed that Macro_C01 as microglia and DC_C03 were specifically enriched in the CSF from TBM patients, while Mono_C02, Mono_C03 and Mono_C05 cells were significantly decreased (Figure 4D and Supplementary Table 3).
CSF-enriched Macro_C01 cells are highly activated
To further investigate the function of microglia (Macro_C01) in the CFS, we conducted a functional modules enrichment analysis using multiple datasets and 22 curated gene signatures (Figure 5A and Supplementary Table 8). The microglia significantly enriched in the CSF exhibited a stronger response compared to other myeloid cells, including stronger leukocyte differentiation and activation, as well as enhanced chemotaxis, migration and chemokine expression. However, another significantly enriched subset in the CSF, DC_C03, did not exhibit any enhanced functional module (Figure 5A and Supplementary Table 8). By comparing to other myeloid cells, we subsequently identified 36 CSF microglia-specific genes (adjusted P value <0.05 and fold-change >1.5). In addition to the complement related genes (C1QA, C1QB, C1QC and A2M), these genes included CCL3, APOC1 and APOE (Figure 5B and Supplementary Table 7), suggesting that CSF microglia might have pro-inflammatory functions. Our GO results confirmed that CSF microglia exhibited an activated immune response and were involved in positively regulating cytokine production and cytokine-mediated signaling compared to PBMCs (Figure 5C).
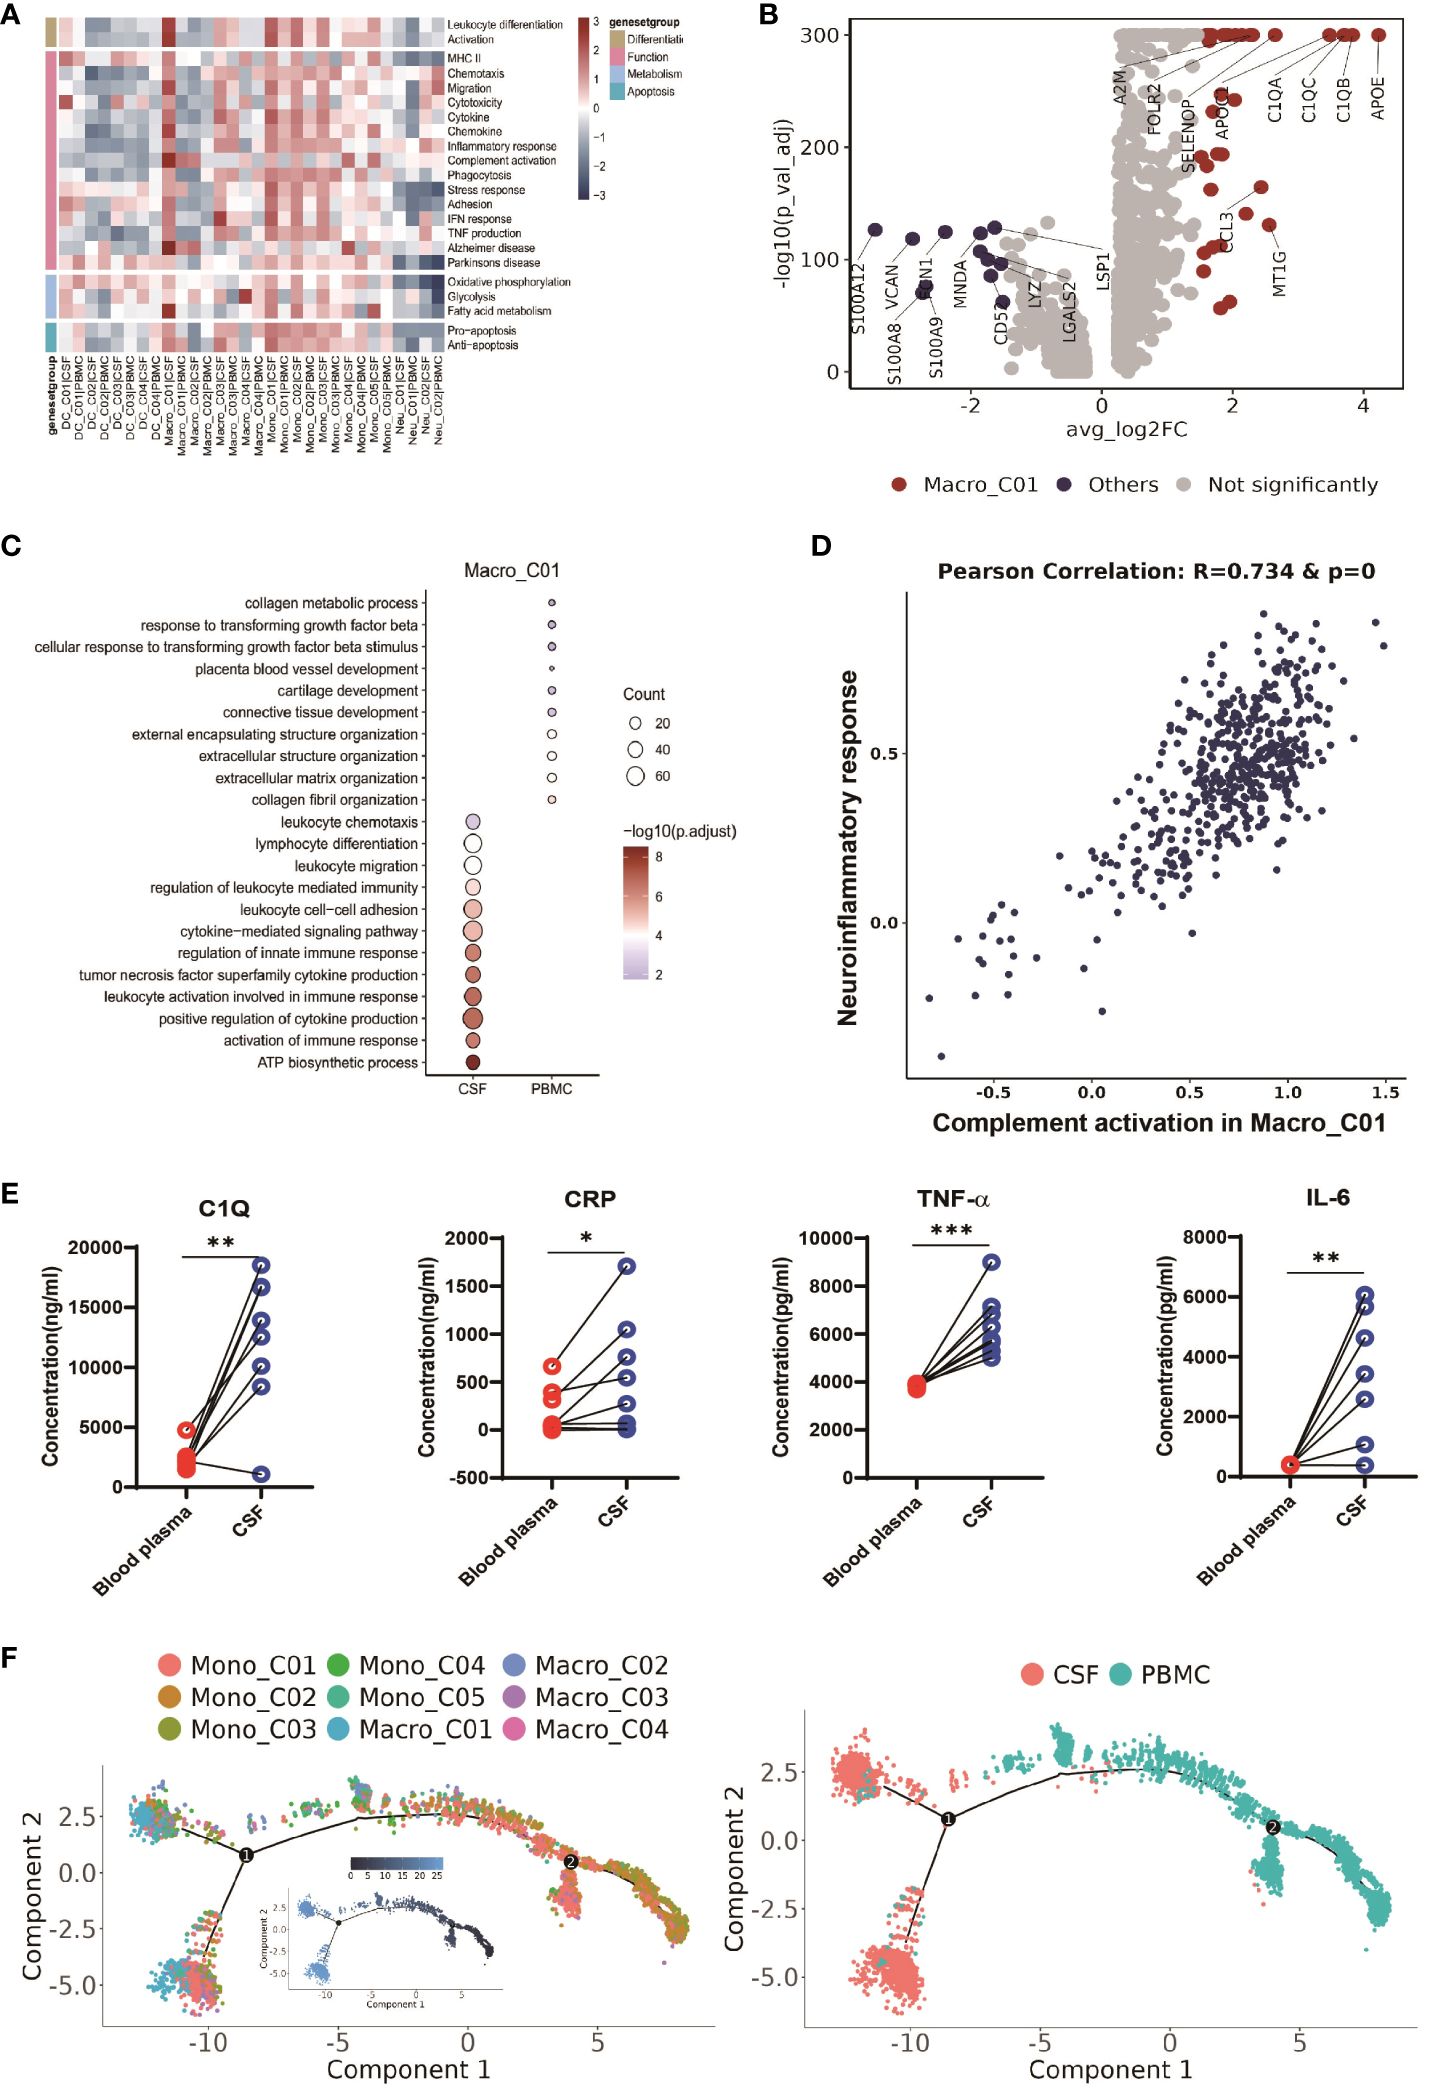
Figure 5 CSF-enriched Macro_C01 cells are highly activated. (A) Heatmaps showing the expression of 22 curated gene signatures (see Supplementary Table 8) in myeloid cell clusters. (B) Volcano plot showing differentially expressed genes in CSF Macro_C01 versus other myeloid cells (n = 6). Each red dot indicates passage of the P-value (val) and the fold difference (P < 0.01; average fold-change >1.5). (C) Enrichment of GO bioprocesses (BP) in Macro_C01 cells between CSF cells and PBMCs (options shown; adjusted p-values are indicated by colored bars). (D) Pearson’s correlation regression plot between the Macro_C01 cells complement activation and neuroinflammatory response enrichment score (log2 transformed). Each point represents a unique cell. The Pearson’s test showed R2 > 0.6 as significant. (E) The levels of C1Q, CRP, TNF-α and IL-6 in paired Blood plasma and CSF cells from TBM patients, detected by enzyme-linked immunosorbent assay (ELISA) (n = 8). Paired sample differences were analyzed using by paired t-test; *, P < 0.05; **, P < 0.01; ***, P < 0.001. (F) Monocle2 analysis of myeloid cell cluster pseudotimes: associated cell types and corresponding states (PBMCs, n = 6; CSF, n = 5) are shown.
CSF microglia also displayed robust fatty acid metabolism. Interestingly, we discovered that CSF microglia exhibited a strong phenotype related to the Alzheimer gene signature (Figure 5A and Supplementary Table 8), suggesting a potential association between CSF microglia and increased CSF inflammation in TBM. We therefore calculated the Pearson correlation between complement activation and the neuroinflammatory response (Figure 5D and Supplementary Table 9), and found that CSF microglia enriched for complement activation exhibited a significant correlation with inflammatory signaling (R=0.734 and p-value=0). We confirmed the possible link between complement activation and inflammatory by ELISA of paired blood plasma and CSF samples from TBM patients. Consistent with the scRNA-seq data, we detected significantly higher levels of complement protein C1Q, the inflammatory marker CRP, and inflammatory factors TNF-α and IL-6 in the CSF compared to blood (n = 8, see Supplementary Table 1, Figure 5E). These findings suggest that microglia-mediated complement activation enhances the release of inflammatory signals, leading to excessive inflammation in the CSF.
We also looked at the developmental trajectory of the monocyte subsets. Both the DC and macrophage subsets followed the same pathway, but eventually, Macro_C01 served as the two end states of differentiation. In contrast to PBMCs, the CSF cells had the most abundant end state of developmental differentiation with Macro_C01 cells, but exhibited two different developmental trajectory directions (Figure 5F). Taken together, these data support the existence of an enhanced inflammatory response of CSF microglia cells than other myeloid cells in TBM, and their involvement in excessive inflammation through complement activation.
A scRNA-seq data expose four B-cell subsets in paired PBMCs and CSF cells
The role of B cells during Mtb infection is unclear, as only a few studies have explored their function in TB (36) and even fewer in TBM (37). Moreover, information on B-cell phenotype and function is limited due to difficulties in maneuvering B cells. Our scRNA-seq analysis identified four distinct B-cell subsets in TBM, each representing a different stage of B-cell development (Supplementary Figure 2A and Supplementary Tables 4, 5). In addition to expressing CD79A, CD79B, MS4A1 and BANK1, B_C01 also had high levels of IGHD, FCER2, TCL1A and IL4R, and were subsequently defined as naive B cells. By contrast, B_C02 showed high CD24, AIM2, TNFRSF13B and LRMP expression and so were defined as memory B cells. B_C03 was specifically enriched in MZB1, JCHAIN, CD27, SDC1 and CD38 and so was annotated as comprising plasma B cells. B _C04 cells were annotated as plasmablasts due to high MNKI67, TOP2A and TYMS expression (Supplementary Figure 2B and Supplementary Tables 4, 5). In our cohort, all six TBM individuals had the four B-cell subsets present; however, and in contrast to PBMCs, none of these four subsets were significantly enriched in the CSF (Supplementary Figure 2C and Supplementary Table 3).
Further functional modules analysis of the B-cell subsets revealed that B_C01 cells exhibited weaker states of function, metabolism and apoptosis. B_C02 showed stronger signaling in antigen presentation, proliferation, chemotaxis, migration and adhesion compared to other B cell subsets, while B_C03 showed stronger BCR signaling, phagocytosis and senescence compared to other B-cell subsets enriched in the CSF compared to PBMC. Interestingly, we also observed that the CSF-enriched B_C03 subset exhibited strong stress, metabolism, and apoptosis responses (Supplementary Figure 2D and Supplementary Table 8). Finally, the trajectory analysis demonstrated that B_C01 and B_C02 subsets in the CSF differentiated toward the B_C03 and B_C04 subsets, and reached the final developmentally differentiated state of the cells (Supplementary Figure 2E).
Macro_C01 has stronger interactions with CD4_04 T cells than other CD4 T cells
Thus far, we have gained an understanding of the landscape and function of T cells and myeloid cells in TBM. In our final analyses, we investigated how Macro_C01 cells regulate these T-cell subsets. To do so, we utilized a set of ligand-receptors (L-R) to understand the relationship between these cell clusters. We discovered that the interaction between macrophages and T cells was particularly prominent in the CSF, especially within the Macro_C01 cluster (microglia). Furthermore, the number and strength of interactions between Macro_C01 and CD4 T cells was stronger than those with CD8 T cells in the CSF (Figures 6A, B), with strong interactions between Macro_C01 and CD4_C04 (tissue-resident T cells) and CD4_C06 (exhausted T cells) compared to other subsets in the CSF (Figures 6C, D). The interaction between Macro_C01 and CD4_C04, CD4_C06 in CSF was mediated by CXCL16 and CXCR6; CXCL9, CXCL10 and CXCR3; CXCL12 and CXCR4; and CCL3 and CCR5. The interaction between Macro_C01 and CD4_C04, however, was primarily mediated by the ligand-receptor CXCL16–CXCR6 (Figure 6E). These interaction analyses revealed the axis of cellular plasticity and ligand pleiotropy in TBM.
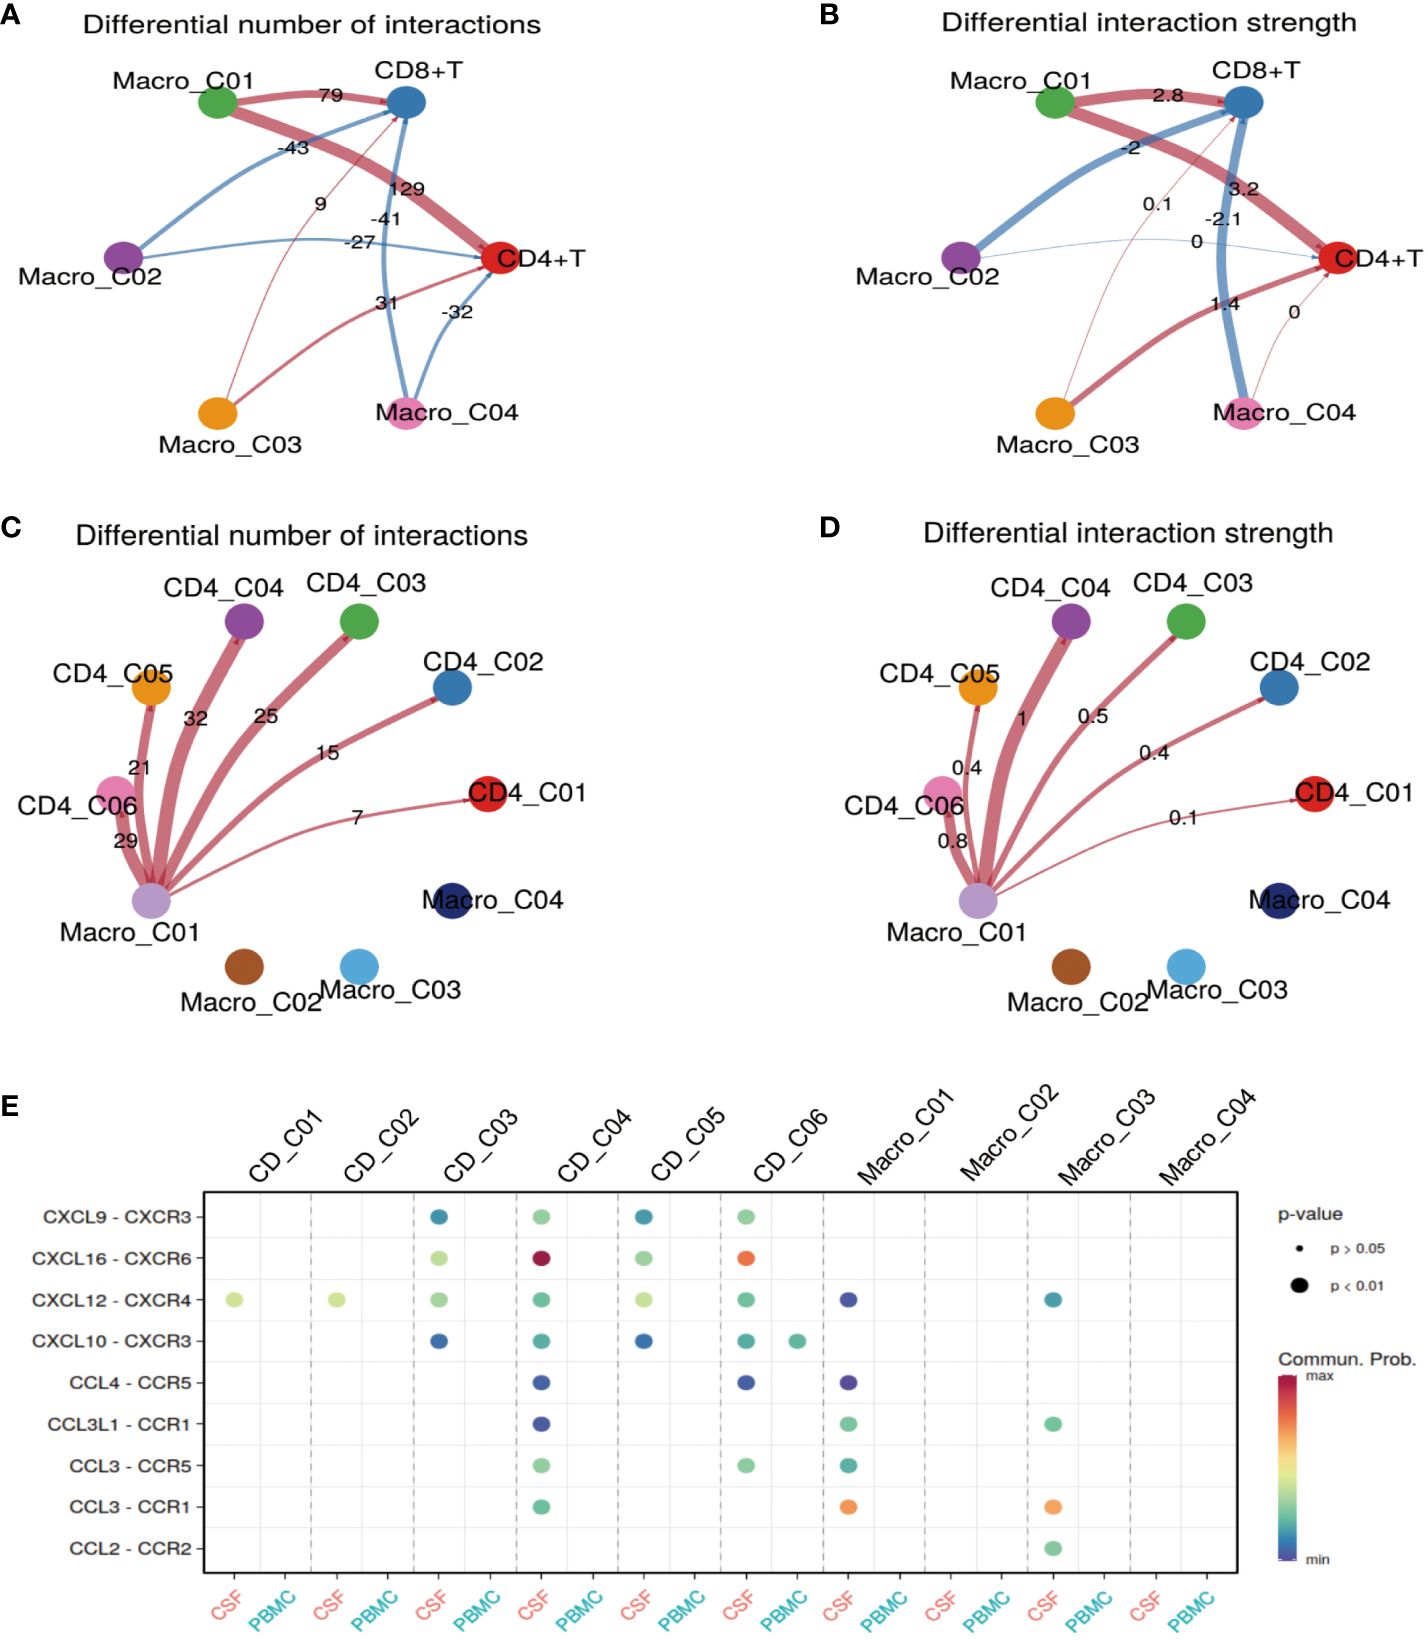
Figure 6 Macro_C01 has stronger interactions with CD4_04 T cells than others. (A, B) The interactions made by CD4 and CD8 T cells with different macrophage subpopulations in the CSF and blood. The number and strength of interactions between cell clusters are indicated. (C, D) The interactions made by CD4 T cells and Macro_C01 cells in the CSF compared to in the blood. The number and strength of interactions between cell clusters are indicated. (E) A dot plot of ligand–receptor (L–R) pairs between CD4 T cells and Macro_C01 cells in the CSF compared to in the blood.
Given that TBM and Non-TBM (VM, CM) are completely different forms of meningitis, we further analyzed the available single-cell data by mapping cell types (Supplementary Figures 3A, B). We discovered that Macro_C01 and CD4_C04 were significantly more abundant in the CSF than PBMCs, from those with Non-TBM (n = 2; Supplementary Figures 3C, D and Supplementary Table 3). Interestingly, we also observed that Macro_C01 and CD4_C04 were significantly more abundant in TBM, rather than Non-TBM (n = 2; Supplementary Figures 3E, F and Supplementary Table 3). These findings provide a reference point for future studies on the specific roles of TBM and Non-TBM in Macro_C01 and CD4_C04 cells.
Discussion
TBM is a deadly and challenging-to-treat form of tuberculosis (TB) that occurs in parts of the body other than the lungs, but immune insights into its development are still limited. In this study, our objective was to characterize the local immune response in TBM to gain insight into the Mtb-specific immune landscape at the site of localized infection in TBM. We obtained paired PBMCs and CSF cells from children with TBM and performed scRNA-seq and pathway analysis to identify the immune cell composition. From >100,000 isolated cells, we distinguished three major cell types: T cells, B cells and myeloid cells. We subsequently categorized these cells into 33 clusters based on quantitative gene expression and from here, identified CSF-specific leukocyte transcriptomic, compositional and functional enrichments, including tissue-resident CD4 T cells (CD4_C04) and microglia (Macro_C01). Furthermore, we revealed the connections and potential developmental pathways of T cells and myeloid cells in TBM. We most notably provide evidence that CSF-enriched microglia (Macro_C01) might be involved in complement activation, leading to the development of excessive inflammation. We identified a distinctive myeloid cell subset in the CSF that partially resembled CNS-associated macrophages, emphasizing the unique immune microenvironment of the CSF. Our transcriptomics data, combined with information on microglia (Macro_C01) and tissue-resident CD4 T cell (CD4_C04) interactions, ultimately provide a comprehensive, multidimensional cellular signature of local T-cell and myeloid cell immunity, particularly in the context of Mtb infection. This information could inform further studies on the role of immune cell subsets in the pathogenesis of TBM and protective immunity against TBM.
Numerous studies have shown that lymphoid infiltrating cell populations in TBM CSF have high levels of IFN-γ and other associated cytokines (3, 5, 7). We know that the CSF contains large numbers of CD4 T cells (38). Increasing evidence also suggests that tissue-resident memory T cells (Trm) are superior in controlling many pathogens, including Mtb (39–42). Consistent with these reports, we newly identified a multifunctional subcluster CD4_C04 in CD4 T cells, which was enriched in the CSF compared to the blood. CD4_C04 not only seems to act as a source of tissue-resident memory T cells (ID2, CXCR6, ITGAE, ITGA1, MYADM and PTGER4) (22), but also contains Th17-like and Th1-like signatures (RORC, CXCR6, RHOC and HOPX) (18, 19). Notably, we found that CD4_C04 was also a cytotoxic CD4 T lymphocyte (CD4-CTL, expressing GZMA, GZMB), with a similar gene expression feature to that of cytotoxic CD8 T cells (43, 44), which was reported in a previous study of tuberculous pleural effusion (TPE) (12). CD4-CTL cells aid in the dormitory clearance of pathogens (45, 46), while several studies have shown that CD4-CTL cells exhibit Th1 and Th17 characteristics (47, 48) and produce Th1 cytokines, Th17 cytokines, IFN-γ and TNF-α (49, 50). Consistently, our results support that CTL CD4_C04 cells exhibited robust cytokine and IFN-γ expression, as well as an inflammatory response status. In addition, our analysis of the developmental differentiation of CD4 T cells suggested that CD4_C04 cells might originate from the differentiation pathway — a finding that now warrants further investigation. It would now be interesting to explore whether therapeutic strategies targeting these intermediate populations could promote the killing and/or activation of Mtb-infected macrophages. Nevertheless, our results clearly highlight the persistent adaptive immune response in the CSF of TBM patients, and prompt us to further investigate the role of CD4-CTL cells in TB. In contrast to blood, we also identified a regulatory T cell subset, CD4_C05, enriched in the CSF. Previous studies have shown that cytokine activation/expansion and the recruitment of specific chemokines is involved in the enrichment of regulatory T cells (Treg) in local tissues or organs under pathological conditions (51). Here, we saw that CD4_C05 was also characterized by exhaustion, suggesting a reduced ability to inhibit inflammation production and maintain immune cell homeostasis.
Mounting evidence suggests that the control of Mtb infection by CD8 T cells is mediated by granzymes (25, 52, 53). From the samples used in our study, we observed that heterogeneous CD8 T-cell subsets in the CSF exhibited a different phenotype compared to those derived from PBMCs. We observed upregulated GZMK in CD8_C01 cells within the CSF, implying that the CSF microenvironment influences the development of CD8 T cells expressing GZMK. This phenomenon might signify distinctions in antigens, tissue factors, or bacterial presence between the blood and CSF. We know that CD8 T cells expressing GZMK can produce cytokines in response to antigen-dependent and antigen-independent stimuli, potentially driving inflammation (54, 55). Notably, our findings revealed that GZMK-expressing CD8_C01 cells in the CSF expressed IFN-like inflammatory genes. Moreover, these cells were notably enriched for cytokines, IFN and inflammatory response states. This compelling evidence strongly suggests that this cell subset possesses the capacity to actively promote and contribute to inflammatory responses.
The antimicrobial function of MAIT cells, a unique innate class of T cells, was supported by the reported protective effects observed in infection experimental models (56, 57). MAIT cells produce interferon-γ (characteristic of Th1 cells) and interleukin IL-17 (characteristic of Th17 cells) with cytotoxic activity (58–60). Consistent with these studies, we found that CD8_C04 cells were characterized as MAIT cells (27, 28) and expressed GZMA and inflammatory genes. The developmental trajectory supported that CD8_C04 cells were at a late stage of cell development in the CSF. Thus, the enrichment of CD8_C01 and CD8_C04 cells in the CSF might represent an active, tissue-specific effector mechanism that mediates tissue inflammation. However, we cannot exclude the possibility that GZMK-expressing CD8 T cells and GZMA expressing CD8 MAIT cells contribute to immunopathology, even though CD8 MAIT cells were fewer in the CSF than PBMCs. Therefore, future studies should investigate the exact role of GZMK/GZMA-expressing CD8 T cells in TB progression. Nevertheless, our data identified CD8_C06 cells that were enriched in the CSF, which were characterized by exhaustion. This subset exhibited a strong inflammatory response, energy metabolism and IFN response. However, many studies have shown (61–63) that T-cell exhaustion manifests as a result of inactivated T-cell proliferation, the secretion of suppressor cytokines and decreased production of IFNγ.
Microglia are a preferred target for Mtb and immune effector cells in the CNS. Neuronal cell phenotypes have also been reported, such as microglia activation (64–66). Once stimulated and activated by Mtb, microglia secrete cytokines and chemokines that have a central role in initiating, coordinating, and modulating immune responses to TB (8, 64). We identified a population of microglia (Macro_C01) enriched in the CSF (19, 30–32, 67). Consistent with previous reports (3, 6, 67), the Macro_C01 subset not only highly expressed inflammatory genes (APOC1, APOE) and cytokines (CCL3), but also the complement-activating genes C1QA, C1QB, C1QC, A2M compared to other myeloid cells. Increasing evidence supports the idea that pathogens might have a role in the development of neurodegenerative diseases (68, 69). Several recent studies also found that proteins and metabolites typical of neurodegenerative diseases (e.g. apolipoproteins) are significantly associated with TBM (1, 4, 70). Here, we found a significant enrichment of Macro_C01 in Alzheimer disease and fatty acid metabolism states (71, 72), suggesting that the TBM CSF is characterized by intrinsic immune-mediated inflammation. Others have shown that activated complement signaling by microglia increases pro-inflammatory cytokine levels, leading to neuroinflammation (72). Data derived from a mouse model also found involvement of microglia and complement in Alzheimer disease attributed to neuroinflammation (73). Others have shown that tissues infected with Mtb, as well as other infectious meningitis agents, cause complement activation and induce large amounts of inflammatory factor production (74, 75). Results of an ELISA revealed the activation of the complement system in TPE (76), with the complement genes C3a and C5a inducing large amounts of inflammatory cytokines (77). Other studies on bacterial meningitis have also shown a positive correlation with complement signaling activation and the production of large amounts of inflammatory factors in the CSF (78–80). One prospective study on pneumococcal-induced meningitis found significantly higher levels of complement (C3a, iC3b, and C5b-9) in the CSF of affected patients (79). Notably, we found that activated complement signaling in Macro_C01 cells was significantly associated with neuroinflammation, thus suggesting that microglial-mediated complement activation in the CSF is responsible for persistent inflammation.
Based on our data, we cannot exclude the possibility that complement-activated microglia promote pathological inflammation, because activated microglia have the ability to induce cell death and increase inflammatory responses (64, 81), which may in turn lead to brain tissue damage and infiltration in TBM. Furthermore, our proposed temporal trajectory analysis of myeloid cells indicated that Macro_C01 cells were in a terminal differentiation state in the CSF compared to other myeloid cells, potentially implying that they originate from a distinct differentiation pathway. It will now be crucial to track the differentiation trajectory, cellular origin, phenotypic transformation and antigenic specificity of Macro_C01 cells during TBM progression and treatment in order to understand whether excessive pathological inflammation. A particularly intriguing discovery in our study was the identification of a more robust and direct interaction between CD4 T cells and Macro_C01 cells in the CSF compared to CD8 T cells, which was characterized by greater numbers and greater intensity. Supporting this finding, others have shown that antigen-presenting cells populate the dural sinus and upon activation can interact with patrolling lymphocytes (38, 82). Taken together, our results emphasize the possibility that Macro_C01 cells sustain excessive pathological inflammation in the CSF, but further studies are now needed to clarify the exact role of microglia-associated functions in TBM.
There remains a lack of standardized diagnostic criteria for distinguishing TBM and Non-TBM (VM and CM) in the clinic (2, 83, 84) — both causative pathogens can potentially cross the blood-brain barrier and invade the brain leading to meningitis development (84). Remarkably, we found that microglia Macro_C01 and tissue-resident CD4_C04 cells were significantly enriched in the CSF of TBM patients, compared to Non-TBM patients. This finding suggests that the two population of cells are promising differential diagnostic markers for TBM and Non-TBM, despite their exact roles need further investigation.
There are several limitations in this study to consider when interpreting these findings. First, the cohort of Non-TBM patients (n=2) resulted in relatively small samples for scRNA-seq. Second, the analysis of the T cell receptor (TCR) group library was limited by the absence of paired PBMC and CSF scTCR-seq data. This meant that the interaction of TCR with MHC-presenting antigens is crucial for acquired immunity; however, understanding the characteristics of local and systemic immune responses in patients with TBM still contribute to the therapeutic efficacy of TBM. Third, we did not characterize non-immune cell populations. Indeed, non-immune cell clusters may have some kind of regulatory role on the immune cell population. We also removed certain immune cell clusters due to cells expressing more than one major cell type marker were considered as doublets, and these cells might also be co-regulated by multiple cell clusters. If we wish to characterize these removed subsets in the future, we will need to isolate more cells and leverage additional single-cell analysis tools such as surface protein labeling (10x Genomics Single Cell 30 v3 Reagent Kit). Applying these methods will enhance our ability to detect and identify these crucial cell populations in future analyses.
Our annotation of the molecular and functional differences between paired PBMCs and CSFs in TBM confirm many important previous observations, add new detail to the literature, and also highlight key areas of ongoing research and challenges. For example, the topic of how specific tissue-resident cell populations change and contribute to the development of TB is currently under discussion. To the best of our knowledge, our data represent the first description of PBMCs and CSF immune-cell subpopulations in TBM at the scRNA-seq resolution. We believe that our characterization of tissue-resident cell subsets in TBM provides a useful framework for studying the role of cell subsets in the progression of TBM. A thorough understanding of the mechanisms underlying the increase in TB-associated cell subsets, such as tissue-resident CD4 T cells and microglia, is expected to lead to new opportunities for therapeutic and diagnostic interventions in TBM.
Data availability statement
The data presented in the study are deposited in the NCBI repository, accession number PRJNA1100176.
Ethics statement
The studies involving humans were approved by The Institutional Review Board of the Children’s Hospital of Chongqing Medical University, China (Ethics number: 2023-273). The studies were conducted in accordance with the local legislation and institutional requirements. Written informed consent for participation in this study was provided by the participants’ legal guardians/next of kin.
Author contributions
SM: Writing – original draft, Data curation, Formal analysis, Investigation, Validation. CS: Writing – review & editing, Data curation, Investigation. YC: Formal analysis, Writing – original draft, Data curation. MX: Data curation, Writing – original draft, Investigation. XH: Investigation, Writing – original draft. YX: Investigation, Writing – original draft. KZ: Formal analysis, Writing – original draft, Validation. YZ: Validation, Writing – original draft. JL: Investigation, Writing – original draft. SC: Investigation, Writing – original draft. XLi: Investigation, Writing – original draft. CX: Investigation, Writing – original draft. XLo: Data curation, Writing – original draft, Investigation. XC: Data curation, Formal analysis, Supervision, Writing – original draft, Writing – review & editing. EL: Data curation, Formal analysis, Supervision, Visualization, Writing – original draft, Writing – review & editing.
Funding
The author(s) declare financial support was received for the research, authorship, and/or publication of this article. This work was supported by the National Key Research and Development Program projects (2022YFC2302900), the Shenzhen Medical Research Special Fund Project (A2304001), National Natural Science Youth Foundation of China (82202574, 82304839), General program of clinical Medical Research (NCRCCHD-2020-GP-06), and Chongqing Science and health joint medical scientific research project (2023MSXM051).
Acknowledgments
The authors would like to thank Dr. Jessica Tamanini (Shenzhen University and ET editing) for editing the manuscript prior to submission.
Conflict of interest
The authors declare that the research was conducted in the absence of any commercial or financial relationships that could be construed as a potential conflict of interest.
Publisher’s note
All claims expressed in this article are solely those of the authors and do not necessarily represent those of their affiliated organizations, or those of the publisher, the editors and the reviewers. Any product that may be evaluated in this article, or claim that may be made by its manufacturer, is not guaranteed or endorsed by the publisher.
Supplementary material
The Supplementary Material for this article can be found online at: https://www.frontiersin.org/articles/10.3389/fimmu.2024.1387808/full#supplementary-material
References
1. Cresswell FV, Davis AG, Sharma K, Basu Roy R, Ganiem AR, Kagimu E, et al. Recent developments in tuberculous meningitis pathogenesis and diagnostics. Wellcome Open Res. (2019) 4:164. doi: 10.12688/wellcomeopenres
2. Huynh J, Abo YN, du Preez K, Solomons R, Dooley KE, Seddon JA. Tuberculous meningitis in children: reducing the burden of death and disability. Pathogens. (2021) 11(1):38. doi: 10.3390/pathogens11010038
3. Manyelo CM, Solomons RS, Walzl G, Chegou NN. Tuberculous meningitis: pathogenesis, immune responses, diagnostic challenges, and the potential of biomarker-based approaches. J Clin Microbiol. (2021) 59(3):e01771-20. doi: 10.1128/JCM.01771-20
4. Rohlwink UK, Figaji A, Wilkinson KA, Horswell S, Sesay AK, Deffur A, et al. Tuberculous meningitis in children is characterized by compartmentalized immune responses and neural excitotoxicity. Nat Commun. (2019) 10:3767. doi: 10.1038/s41467-019-11783-9
5. van Laarhoven A, Dian S, van Dorp S, Purnama F, Koeken V, Diandini E, et al. Immune cell characteristics and cytokine responses in adult HIV-negative tuberculous meningitis: an observational cohort study. Sci Rep. (2019) 9:884. doi: 10.1038/s41598-018-36696-3
6. Zhang X, Zhao Z, Wu Q, Wang L, Li L, Wang M, et al. Single-cell analysis reveals changes in BCG vaccine-injected mice modeling tuberculous meningitis brain infection. Cell Rep. (2023) 42:112177. doi: 10.1016/j.celrep.2023.112177
7. Simmons CP, Thwaites GE, Quyen NT, Torok E, Hoang DM, Chau TT, et al. Pretreatment intracerebral and peripheral blood immune responses in Vietnamese adults with tuberculous meningitis: diagnostic value and relationship to disease severity and outcome. J Immunol. (2006) 176:2007–14. doi: 10.4049/jimmunol.176.3.2007
8. Almolda B, Gonzalez B, Castellano B. Are microglial cells the regulators of lymphocyte responses in the CNS? Front Cell Neurosci. (2015) 9:440. doi: 10.3389/fncel.2015.00440
9. Wilkinson RJ, Rohlwink U, Misra UK, van Crevel R, Mai NTH, Dooley KE, et al. Tuberculous meningitis. Nat Rev Neurol. (2017) 13:581–98. doi: 10.1038/nrneurol.2017.120
10. Huynh J, Donovan J, Phu NH, Nghia HDT, Thuong NTT, Thwaites GE. Tuberculous meningitis: progress and remaining questions. Lancet Neurol. (2022) 21:450–64. doi: 10.1016/S1474-4422(21)00435-X
11. Chen X, Zhou B, Li M, Deng Q, Wu X, Le X, et al. CD4(+)CD25(+)FoxP3(+) regulatory T cells suppress Mycobacterium tuberculosis immunity in patients with active disease. Clin Immunol. (2007) 123:50–9. doi: 10.1016/j.clim.2006.11.009
12. Cai Y, Wang Y, Shi C, Dai Y, Li F, Xu Y, et al. Single-cell immune profiling reveals functional diversity of T cells in tuberculous pleural effusion. J Exp Med. (2022) 219(3):e20211777. doi: 10.1084/jem.20211777
13. Korsunsky I, Millard N, Fan J, Slowikowski K, Zhang F, Wei K, et al. Fast, sensitive and accurate integration of single-cell data with Harmony. Nat Methods. (2019) 16:1289–96. doi: 10.1038/s41592-019-0619-0
14. Schafflick D, Xu CA, Hartlehnert M, Cole M, Schulte-Mecklenbeck A, Lautwein T, et al. Integrated single cell analysis of blood and cerebrospinal fluid leukocytes in multiple sclerosis. Nat Commun. (2020) 11:247. doi: 10.1038/s41467-019-14118-w
15. Jin S, Guerrero-Juarez CF, Zhang L, Chang I, Ramos R, Kuan CH, et al. Inference and analysis of cell-cell communication using CellChat. Nat Commun. (2021) 12:1088. doi: 10.1038/s41467-021-21246-9
16. Cano-Gamez E, Soskic B, Roumeliotis TI, So E, Smyth DJ, Baldrighi M, et al. Single-cell transcriptomics identifies an effectorness gradient shaping the response of CD4(+) T cells to cytokines. Nat Commun. (2020) 11:1801. doi: 10.1038/s41467-020-15543-y
17. Leruste A, Tosello J, Ramos RN, Tauziede-Espariat A, Brohard S, Han ZY, et al. Clonally expanded T cells reveal immunogenicity of rhabdoid tumors. Cancer Cell. (2019) 36:597–612.e598. doi: 10.1016/j.ccell.2019.10.008
18. Monaco G, Lee B, Xu W, Mustafah S, Hwang YY, Carre C, et al. RNA-seq signatures normalized by mRNA abundance allow absolute deconvolution of human immune cell types. Cell Rep. (2019) 26:1627–40.e1627. doi: 10.1016/j.celrep.2019.01.041
19. Ostkamp P, Deffner M, Schulte-Mecklenbeck A, Wunsch C, Lu IN, Wu GF, et al. A single-cell analysis framework allows for characterization of CSF leukocytes and their tissue of origin in multiple sclerosis. Sci Transl Med. (2022) 14:eadc9778. doi: 10.1126/scitranslmed.adc9778
20. Ren X, Wen W, Fan X, Hou W, Su B, Cai P, et al. COVID-19 immune features revealed by a large-scale single-cell transcriptome atlas. Cell. (2021) 184:1895–913.e1819. doi: 10.1016/j.cell.2021.10.023
21. Saluzzo S, Pandey RV, Gail LM, Dingelmaier-Hovorka R, Kleissl L, Shaw L, et al. Delayed antiretroviral therapy in HIV-infected individuals leads to irreversible depletion of skin- and mucosa-resident memory T cells. Immunity. (2021) 54:2842–58.e2845. doi: 10.1016/j.immuni.2021.10.021
22. Zhang L, Yu X, Zheng L, Zhang Y, Li Y, Fang Q, et al. Lineage tracking reveals dynamic relationships of T cells in colorectal cancer. Nature. (2018) 564:268–72. doi: 10.1038/s41586-018-0694-x
23. Chu Y, Dai E, Li Y, Han G, Pei G, Ingram DR, et al. Pan-cancer T cell atlas links a cellular stress response state to immunotherapy resistance. Nat Med. (2023) 29:1550–62. doi: 10.1038/s41591-023-02371-y
24. Qiu X, Mao Q, Tang Y, Wang L, Chawla R, Pliner HA, et al. Reversed graph embedding resolves complex single-cell trajectories. Nat Methods. (2017) 14:979–82. doi: 10.1038/nmeth.4402
25. Woodworth JS, Wu Y, Behar SM. Mycobacterium tuberculosis-specific CD8+ T cells require perforin to kill target cells and provide protection in vivo. J Immunol. (2008) 181:8595–603. doi: 10.4049/jimmunol.181.12.8595
26. Krishna C, DiNatale RG, Kuo F, Srivastava RM, Vuong L, Chowell D, et al. Single-cell sequencing links multiregional immune landscapes and tissue-resident T cells in ccRCC to tumor topology and therapy efficacy. Cancer Cell. (2021) 39:662–77.e666. doi: 10.1016/j.ccell.2021.03.007
27. Jiang H, Yu D, Yang P, Guo R, Kong M, Gao Y, et al. Revealing the transcriptional heterogeneity of organ-specific metastasis in human gastric cancer using single-cell RNA Sequencing. Clin Transl Med. (2022) 12:e730. doi: 10.1002/ctm2.730
28. Wang X, Shen X, Chen S, Liu H, Hong N, Zhong H, et al. Reinvestigation of classic T cell subsets and identification of novel cell subpopulations by single-cell RNA sequencing. J Immunol. (2022) 208:396–406. doi: 10.4049/jimmunol.2100581
29. Zhang L, Li Z, Skrzypczynska KM, Fang Q, Zhang W, O'Brien SA, et al. Single-cell analyses inform mechanisms of myeloid-targeted therapies in colon cancer. Cell. (2020) 181:442–59.e429. doi: 10.1016/j.cell.2020.03.048
30. Farhadian SF, Mehta SS, Zografou C, Robertson K, Price RW, Pappalardo J, et al. Single-cell RNA sequencing reveals microglia-like cells in cerebrospinal fluid during virologically suppressed HIV. JCI Insight. (2018) 3(18):e121718. doi: 10.1172/jci.insight.121718
31. Beltran E, Gerdes LA, Hansen J, Flierl-Hecht A, Krebs S, Blum H, et al. Early adaptive immune activation detected in monozygotic twins with prodromal multiple sclerosis. J Clin Invest. (2019) 129:4758–68. doi: 10.1172/JCI128475
32. Van Hove H, Martens L, Scheyltjens I, De Vlaminck K, Pombo Antunes AR, De Prijck S, et al. A single-cell atlas of mouse brain macrophages reveals unique transcriptional identities shaped by ontogeny and tissue environment. Nat Neurosci. (2019) 22:1021–35. doi: 10.1038/s41593-019-0393-4
33. Cheng S, Li Z, Gao R, Xing B, Gao Y, Yang Y, et al. A pan-cancer single-cell transcriptional atlas of tumor infiltrating myeloid cells. Cell. (2021) 184:792–809.e723. doi: 10.1016/j.cell.2021.01.010
34. Zhang Q, He Y, Luo N, Patel SJ, Han Y, Gao R, et al. Landscape and dynamics of single immune cells in hepatocellular carcinoma. Cell. (2019) 179:829–45.e820. doi: 10.1016/j.cell.2019.10.003
35. Shi K, Li H, Chang T, He W, Kong Y, Qi C, et al. Bone marrow hematopoiesis drives multiple sclerosis progression. Cell. (2022) 185:2234–47.e2217. doi: 10.1016/j.cell.2022.05.020
36. du Plessis WJ, Walzl G, Loxton AG. B cells as multi-functional players during Mycobacterium tuberculosis infection and disease. Tuberculosis (Edinb). (2016) 97:118–25. doi: 10.1016/j.tube.2015.10.007
37. Yu N, Zhang QQ, Zhang K, Xie Y, Zhu HQ, Lin XJ, et al. Comparative study of CD4 and CD45RO T cells and CD20 B cells in cerebrospinal fluid of syphilitic meningitis and tuberculous meningitis patients. APMIS. (2016) 124:764–9. doi: 10.1111/apm.12572
38. Smolders J, van Luijn MM, Hsiao CC, Hamann J. T-cell surveillance of the human brain in health and multiple sclerosis. Semin Immunopathol. (2022) 44:855–67. doi: 10.1007/s00281-022-00926-8
39. Pross V, Sattler A, Lukassen S, Toth L, Thole LML, Siegle J, et al. SARS-CoV2 mRNA-vaccination-induced immunological memory in human non-lymphoid and lymphoid tissues. J Clin Invest. (2023) 133(24):e171797. doi: 10.1101/2023.02.22.23286293
40. Pahuja I, Negi K, Kumari A, Agarwal M, Mukhopadhyay S, Mathew B, et al. Berberine governs NOTCH3/AKT signaling to enrich lung-resident memory T cells during tuberculosis. PloS Pathog. (2023) 19:e1011165. doi: 10.1371/journal.ppat.1011165
41. Ogongo P, Tezera LB, Ardain A, Nhamoyebonde S, Ramsuran D, Singh A, et al. Tissue-resident-like CD4+ T cells secreting IL-17 control Mycobacterium tuberculosis in the human lung. J Clin Invest. (2021) 131(10):e142014. doi: 10.1172/JCI142014
42. O'Neil TR, Hu K, Truong NR, Arshad S, Shacklett BL, Cunningham AL, et al. The role of tissue resident memory CD4 T cells in herpes simplex viral and HIV infection. Viruses. (2021) 13(3):359. doi: 10.3390/v13030359
43. Li H, van der Leun AM, Yofe I, Lubling Y, Gelbard-Solodkin D, van Akkooi ACJ, et al. Dysfunctional CD8 T cells form a proliferative, dynamically regulated compartment within human melanoma. Cell. (2020) 181:747. doi: 10.1016/j.cell.2020.04.017
44. Maehara T, Kaneko N, Perugino CA, Mattoo H, Kers J, Allard-Chamard H, et al. Cytotoxic CD4+ T lymphocytes may induce endothelial cell apoptosis in systemic sclerosis. J Clin Invest. (2020) 130:2451–64. doi: 10.1172/JCI131700
45. Devarajan P, Vong AM, Castonguay CH, Silverstein NJ, Kugler-Umana O, Bautista BL, et al. Cytotoxic CD4 development requires CD4 effectors to concurrently recognize local antigen and encounter type I IFN-induced IL-15. Cell Rep. (2023) 42:113182. doi: 10.1016/j.celrep.2023.113182
46. Noshadi N, Yaghoubi R, Afshari A, Forouzanfar M, Soleimanian S. Impaired CD4+ Cytotoxic T lymphocyte activity in polyomavirus BK infected kidney transplant recipients. Iran J Allergy Asthma Immunol. (2023) 22:379–89. doi: 10.18502/ijaai.v22i4.13610
47. Di Roio A, Hubert M, Besson L, Bossennec M, Rodriguez C, Grinberg-Bleyer Y, et al. Mdr1-expressing cd4(+) T cells with Th1.17 features resist to neoadjuvant chemotherapy and are associated with breast cancer clinical response. J Immunother Cancer. (2023) 11(11):e007733. doi: 10.1136/jitc-2023-007733
48. Martini GR, Tikhonova E, Rosati E, DeCelie MB, Sievers LK, Tran F, et al. Selection of cross-reactive T cells by commensal and food-derived yeasts drives cytotoxic T(H)1 cell responses in Crohn's disease. Nat Med. (2023) 29:2602–14. doi: 10.1038/s41591-023-02556-5
49. Jin W, Zheng Y, Zhu P. T cell abnormalities in systemic sclerosis. Autoimmun Rev. (2022) 21:103185. doi: 10.1016/j.autrev.2022.103185
50. Hashimoto K, Kouno T, Ikawa T, Hayatsu N, Miyajima Y, Yabukami H, et al. Single-cell transcriptomics reveals expansion of cytotoxic CD4 T cells in supercentenarians. Proc Natl Acad Sci U.S.A. (2019) 116:24242–51. doi: 10.1073/pnas.1907883116
51. Shi G, Han J, Liu G, Hao Y, Ma Y, Li T, et al. Expansion of activated regulatory T cells by myeloid-specific chemokines via an alternative pathway in CSF of bacterial meningitis patients. Eur J Immunol. (2014) 44:420–30. doi: 10.1002/eji.201343572
52. Kamath AB, Woodworth J, Xiong X, Taylor C, Weng Y, Behar SM. Cytolytic CD8+ T cells recognizing CFP10 are recruited to the lung after Mycobacterium tuberculosis infection. J Exp Med. (2004) 200:1479–89. doi: 10.1084/jem.20041690
53. Lewinsohn DA, Heinzel AS, Gardner JM, Zhu L, Alderson MR, Lewinsohn DM. Mycobacterium tuberculosis-specific CD8+ T cells preferentially recognize heavily infected cells. Am J Respir Crit Care Med. (2003) 168:1346–52. doi: 10.1164/rccm.200306-837OC
54. Jonsson AH, Zhang F, Dunlap G, Gomez-Rivas E, Watts GFM, Faust HJ, et al. Granzyme K(+) CD8 T cells form a core population in inflamed human tissue. Sci Transl Med. (2022) 14:eabo0686. doi: 10.1126/scitranslmed.abo0686
55. Mogilenko DA, Shpynov O, Andhey PS, Arthur L, Swain A, Esaulova E, et al. Comprehensive profiling of an aging immune system reveals clonal GZMK(+) CD8(+) T cells as conserved hallmark of inflammaging. Immunity. (2021) 54:99–115.e112. doi: 10.1016/j.immuni.2020.11.005
56. Zhang Y, Bailey JT, Xu E, Singh K, Lavaert M, Link VM, et al. Mucosal-associated invariant T cells restrict reactive oxidative damage and preserve meningeal barrier integrity and cognitive function. Nat Immunol. (2022) 23:1714–25. doi: 10.1038/s41590-022-01349-1
57. Hinks TSC. Zhang XW MAIT cell activation and functions. Front Immunol. (2020) 11:1014. doi: 10.3389/fimmu.2020.01014
58. Constantinides MG, Link VM, Tamoutounour S, Wong AC, Perez-Chaparro PJ, Han SJ, et al. MAIT cells are imprinted by the microbiota in early life and promote tissue repair. Science. (2019) 366(6464):eaax6624. doi: 10.1126/science.aax6624
59. Legoux F, Bellet D, Daviaud C, El Morr Y, Darbois A, Niort K, et al. Microbial metabolites control the thymic development of mucosal-associated invariant T cells. Science. (2019) 366:494–9. doi: 10.1126/science.aaw2719
60. Rudak PT, Choi J, Haeryfar SMM. MAIT cell-mediated cytotoxicity: Roles in host defense and therapeutic potentials in infectious diseases and cancer. J Leukoc Biol. (2018) 104:473–86. doi: 10.1002/JLB.4RI0118-023R
61. Singh A, Mohan A, Dey AB, Mitra DK. Inhibiting the programmed death 1 pathway rescues Mycobacterium tuberculosis-specific interferon gamma-producing T cells from apoptosis in patients with pulmonary tuberculosis. J Infect Dis. (2013) 208:603–15. doi: 10.1093/infdis/jit206
62. Khan N, Vidyarthi A, Amir M, Mushtaq K, Agrewala JN. T-cell exhaustion in tuberculosis: pitfalls and prospects. Crit Rev Microbiol. (2017) 43:133–41. doi: 10.1080/1040841X.2016.1185603
63. Pan J, Zhang X, Xu J, Chang Z, Xin Z, Wang G. Landscape of exhausted T cells in tuberculosis revealed by single-cell sequencing. Microbiol Spectr. (2023) 11:e0283922. doi: 10.1128/spectrum.02839-22
64. Spanos JP, Hsu NJ, Jacobs M. Microglia are crucial regulators of neuro-immunity during central nervous system tuberculosis. Front Cell Neurosci. (2015) 9:182. doi: 10.3389/fncel.2015.00182
65. Tucker EW, Pokkali S, Zhang Z, DeMarco VP, Klunk M, Smith ES, et al. Microglia activation in a pediatric rabbit model of tuberculous meningitis. Dis Model Mech. (2016) 9:1497–506. doi: 10.1242/dmm.027326
66. Lee HM, Kang J, Lee SJ, Jo EK. Microglial activation of the NLRP3 inflammasome by the priming signals derived from macrophages infected with mycobacteria. Glia. (2013) 61:441–52. doi: 10.1002/glia.22448
67. Esaulova E, Cantoni C, Shchukina I, Zaitsev K, Bucelli RC, Wu GF, et al. Single-cell RNA-seq analysis of human CSF microglia and myeloid cells in neuroinflammation. Neurol Neuroimmunol Neuroinflamm. (2020) 7(4):e732. doi: 10.1212/NXI.0000000000000732
68. Harris SA, Harris EA. Herpes simplex virus type 1 and other pathogens are key causative factors in sporadic alzheimer's disease. J Alzheimers Dis. (2015) 48:319–53. doi: 10.3233/JAD-142853
69. Bu XL, Yao XQ, Jiao SS, Zeng F, Liu YH, Xiang Y, et al. A study on the association between infectious burden and Alzheimer's disease. Eur J Neurol. (2015) 22:1519–25. doi: 10.1111/ene.12477
70. Pinon JM, Puygauthier-Toubas D, Lepan H, Marx C, Bonhomme A, Boulant J, et al. Rapid detection of proteins by enzyme-linked immunofiltration assay after transfer onto nitrocellulose membranes. Electrophoresis. (1990) 11:41–5. doi: 10.1002/elps.1150110110
71. Su W, Saravia J, Risch I, Rankin S, Guy C, Chapman NM, et al. CXCR6 orchestrates brain CD8(+) T cell residency and limits mouse Alzheimer's disease pathology. Nat Immunol. (2023) 24:1735–47. doi: 10.1038/s41590-023-01604-z
72. Leng F, Edison P. Neuroinflammation and microglial activation in Alzheimer disease: where do we go from here? Nat Rev Neurol. (2021) 17:157–72. doi: 10.1038/s41582-020-00435-y
73. Hong S, Beja-Glasser VF, Nfonoyim BM, Frouin A, Li S, Ramakrishnan S, et al. Complement and microglia mediate early synapse loss in Alzheimer mouse models. Science. (2016) 352:712–6. doi: 10.1126/science.aad8373
74. Cai Y, Yang Q, Tang Y, Zhang M, Liu H, Zhang G, et al. Increased complement C1q level marks active disease in human tuberculosis. PloS One. (2014) 9:e92340. doi: 10.1371/journal.pone.0092340
75. Qiao N, Zhang J, Zhang Y, Liu X. Synergistic regulation of microglia differentiation by CD93 and integrin beta1 in the rat pneumococcal meningitis model. Immunol Lett. (2022) 251-252:63–74. doi: 10.1016/j.imlet.2022.11.001
76. Porcel JM, Vives M, Gazquez I, Vicente de Vera MC, Perez B, Rubio M. Usefulness of pleural complement activation products in differentiating tuberculosis and Malignant effusions. Int J Tuberc Lung Dis. (2000) 4:76–82.
77. Luo L, Li X, Hu X, Hu C, Tang W, Deng S, et al. Anaphylatoxins enhance recruitment of nonclassical monocytes via chemokines produced by pleural mesothelial cells in tuberculous pleural effusion. Am J Respir Cell Mol Biol. (2019) 60:454–64. doi: 10.1165/rcmb.2018-0075OC
78. Mook-Kanamori BB, Valls Seron M, Geldhoff M, Havik SR, van der Ende A, Baas F, et al. Thrombin-activatable fibrinolysis inhibitor influences disease severity in humans and mice with pneumococcal meningitis. J Thromb Haemost. (2015) 13:2076–86. doi: 10.1111/jth.13132
79. Mook-Kanamori BB, Brouwer MC, Geldhoff M, Ende A, van de Beek D. Cerebrospinal fluid complement activation in patients with pneumococcal and meningococcal meningitis. J Infect. (2014) 68:542–7. doi: 10.1016/j.jinf.2013.12.016
80. Mook-Kanamori BB, Geldhoff M, van der Poll T, van de Beek D. Pathogenesis and pathophysiology of pneumococcal meningitis. Clin Microbiol Rev. (2011) 24:557–91. doi: 10.1128/CMR.00008-11
81. Yu L, Huang L, Zhao Y, Liu S, Zhou R, Yue Y, et al. Atorvastatin promotes pro/anti-inflammatory phenotypic transformation of microglia via wnt/beta-catenin pathway in hypoxic-ischemic neonatal rats. Mol Neurobiol. (2023). doi: 10.1007/s12035-023-03777-y
82. Rustenhoven J, Drieu A, Mamuladze T, de Lima KA, Dykstra T, Wall M, et al. Functional characterization of the dural sinuses as a neuroimmune interface. Cell. (2021) 184:1000–16.e1027. doi: 10.1016/j.cell.2020.12.040
83. Daneman R, Prat A. The blood-brain barrier. Cold Spring Harb Perspect Biol. (2015) 7:a020412. doi: 10.1101/cshperspect.a020412
Keywords: pediatric tuberculous meningitis, cerebrospinal fluid, microglia, inflammation, single Cell RNA sequencing, complement
Citation: Mo S, Shi C, Cai Y, Xu M, Xu H, Xu Y, Zhang K, Zhang Y, Liu J, Che S, Liu X, Xing C, Long X, Chen X and Liu E (2024) Single-cell transcriptome reveals highly complement activated microglia cells in association with pediatric tuberculous meningitis. Front. Immunol. 15:1387808. doi: 10.3389/fimmu.2024.1387808
Received: 18 February 2024; Accepted: 16 April 2024;
Published: 30 April 2024.
Edited by:
Qiushui He, University of Turku, FinlandReviewed by:
Debora Decote-Ricardo, Federal Rural University of Rio de Janeiro, BrazilDanielle Oliveira Nascimento, Federal Rural University of Rio de Janeiro, Brazil
Copyright © 2024 Mo, Shi, Cai, Xu, Xu, Xu, Zhang, Zhang, Liu, Che, Liu, Xing, Long, Chen and Liu. This is an open-access article distributed under the terms of the Creative Commons Attribution License (CC BY). The use, distribution or reproduction in other forums is permitted, provided the original author(s) and the copyright owner(s) are credited and that the original publication in this journal is cited, in accordance with accepted academic practice. No use, distribution or reproduction is permitted which does not comply with these terms.
*Correspondence: Enmei Liu, emliu186@126.com; Xinchun Chen, chenxinchun@szu.edu.cn; Xiaoru Long, 2387207074@qq.com
†These authors have contributed equally to this work