 Colby T. Ford1,2*
 Gezahegn Solomon Alemayehu3Kayla Blackburn4Karen Lopez1Cheikh Cambel Dieng4
 Lemu Golassa3Eugenia Lo2,4Daniel Janies1
- 1Department of Bioinformatics and Genomics, University of North Carolina at Charlotte, Charlotte, NC, United States
- 2School of Data Science, University of North Carolina at Charlotte, Charlotte, NC, United States
- 3Aklilu Lemma Institute of Pathobiology, Addis Ababa University, Addis Ababa, Ethiopia
- 4Department of Biological Sciences, University of North Carolina at Charlotte, Charlotte, NC, United States
Malaria, predominantly caused by Plasmodium falciparum, poses one of largest and most durable health threats in the world. Previously, simplistic regression-based models have been created to characterize malaria rapid diagnostic test performance, though these models often only include a couple genetic factors. Specifically, the Baker et al., 2005 model uses two types of particular repeats in histidine-rich protein 2 (PfHRP2) to describe a P. falciparum infection, though the efficacy of this model has waned over recent years due to genetic mutations in the parasite. In this work, we use a dataset of 100 P. falciparum PfHRP2 genetic sequences collected in Ethiopia and derived a larger set of motif repeat matches for use in generating a series of diagnostic machine learning models. Here we show that the usage of additional and different motif repeats in more sophisticated machine learning methods proves effective in characterizing PfHRP2 diversity. Furthermore, we use machine learning model explainability methods to highlight which of the repeat types are most important with regards to rapid diagnostic test sensitivity, thereby showcasing a novel methodology for identifying potential targets for future versions of rapid diagnostic tests.
1 Introduction
There are over 228 million infections of malaria yearly and, in 2018, resulted in 405,000 deaths (1). Genomics is beginning to bear fruit in abatement of malaria but presents analytical challenges due to the complexity of the disease and its components (human, Plasmodium spp., and vector mosquitoes).
In most developing countries, the detection of Plasmodium falciparum and diagnosis of malaria is often performed using simple rapid diagnostic tests (RDTs). Specifically, these tests are lateral flow immuno-chromatographic antigen detection tests that are similar in modality to common at-home pregnancy tests. These tests use dye-labeled antibodies to bind to a particular parasite antigen and display a line on a test strip if the antibodies bind to the antigen of interest (2). In many parts of Africa, RDTs are designed to detect the presence of P. falciparum’s histidine-rich protein 2 (PfHRP2). In fact, PfHRP2-based RDTs accounted for around 74% of all RDTs used in sub-Saharan Africa in 2016 (3).
If patients are properly diagnosed, P. falciparum infections may be treated using antimalarial drugs such as artemisinin or artemisinin combined therapies (ACTs). Unfortunately, the efficacy of RDTs and artemisinin treatment have diminished in some settings around world, specifically in locations where the deletion or mutation of the kelch domain–carrying protein K13 gene are observed as is the case in Ethiopia (4).
In 2005, Baker et al. published a simple linear regression-based model that purports to predict the detection sensitivity of RDTs using a small fraction of genetic sequence variants that code for PfHRP2 (5). While with the data available at the time, the accuracy of the Baker model was high (87.5%), the explanation ability of the RDT sensitivity was low (R2 = 0.353). Enthusiasm for the Baker model has since diminished. In 2010, Baker et al. published a report in which they concluded that they can no longer correlate sequence variation and RDT failure with their model (6). Nevertheless, there is no alternative to the Baker model and it is still in use.
Given that simple correlation fails to show definitive relationships between motif repeats and RDT results, we looked to machine learning as a more advanced alternative. In this study, our hypothesis is that a model for understanding the relationship between RDT test sensitivity and sequence variation can be improved by using a larger set of genetic sequence variants with better machine learning modeling. Our purpose is to use molecular datasets and machine learning methods to address the shortcomings in malaria diagnosis test sensitivity1 and to provide a novel approach to direct the development of future RDTs using PfHRP2. In this study, we analyze a collection of genetic data and metadata from 100 P. falciparum sequences collected from Ethiopia with the Baker model along with a sweep of other machine learning models that we generate.
Beyond simply training a better model using more sophisticated algorithms, our research focus is to allow for interpretable insights of the machine learning models to be derived from the “black box”. We have shown previous success in AI-driven explanations of gene expression underlying drug resistant strains of Plasmodium falciparum (7, 8). We apply this model interpretability here to identify which types of histidine-rich repeats, present in PfHRP2, are most indicative of malaria test performance.
While our work here only uses a relatively small dataset from a single African country, our purpose is to showcase the utility of machine learning model interpretation for the improvement and design of future RDTs.
2 Materials and Methods
2.1 Data Collection
Blood samples and demographic data were collected from suspected malaria patients greater than five years of age in various health clinics during both the low and high transmission seasons in different regions of Assosa, Ethiopia. Specifically, this health facility-based, cross-sectional study was conducted in febrile patients seeking malaria diagnosis at four selected health facilities: Assosa, Bambasi, Kurmuk and Sherkole from November to December 2018. Note: This work encompasses the same set of samples as described in Alemayehu et al. (9).
Microscopy and rapid diagnostic testing were performed within the health clinics, and drops of blood spotted on Whatman 3MM filter paper were kept in sealed pouches for later analyses. CareStart™ malaria combination RDTs (lot code 18H61 from Access Bio Ethiopia) were used to diagnose P. falciparum and to evaluate their performance against microscopy as a reference test.
The P. falciparum DNA concentration in dried blood spot samples was analyzed using real-time quantitative PCR (RT-PCR). The P. falciparum DNA was extracted using phosphate buffered saline, Saponin, and Chelex (10) and confirmed P. falciparum positive samples as those whose RT-PCR values were less than or equal to 37 (11). The null hypothesis was that RDT testing and the detection of P. falciparum by RT-PCR will have a strong correlation (e.g., positive RDT samples will lead to positive RT-PCR and negative RDT samples will lead to negative RT-PCR). However, early findings have shown incongruence between the RDT results and RT-PCR (9).
In Tables 1, 2, note the concordance of the qPCR results with RDT results. Also note, in Figure 1, that parasitemia findings may also differ from RDT results. This shows that, while effective, RDTs can be improved.
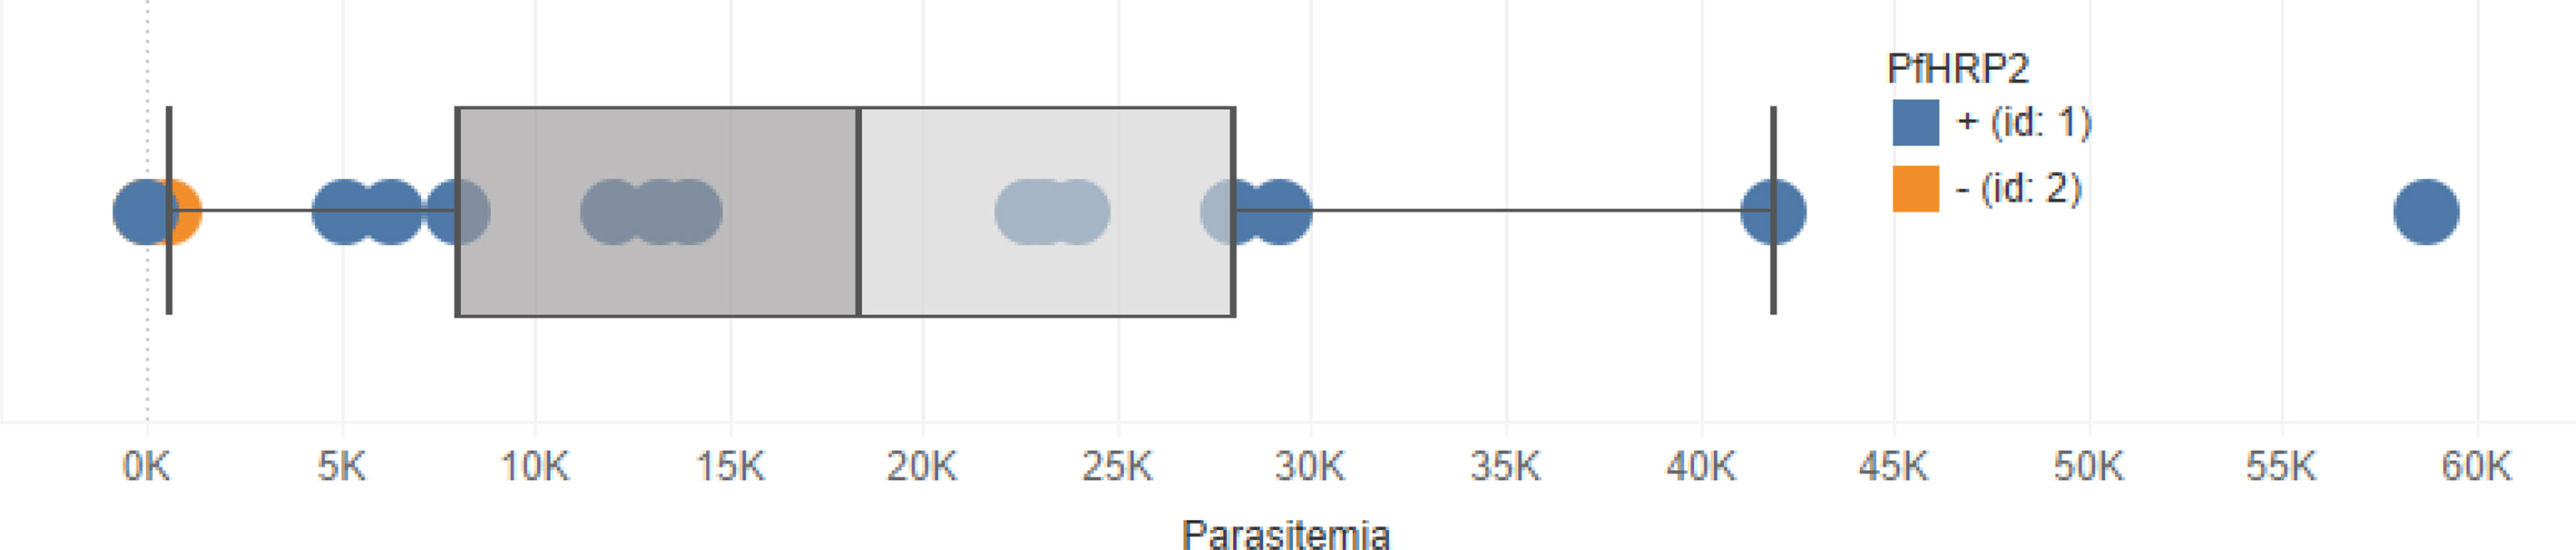
Figure 1 Boxplot showing the distribution of parasitemia among the 100 samples used in this study. Blue points represent RDT-positive cases and orange points represent RDT-negative cases. Note that there are some RDT-positive samples that with zero parasitemia.
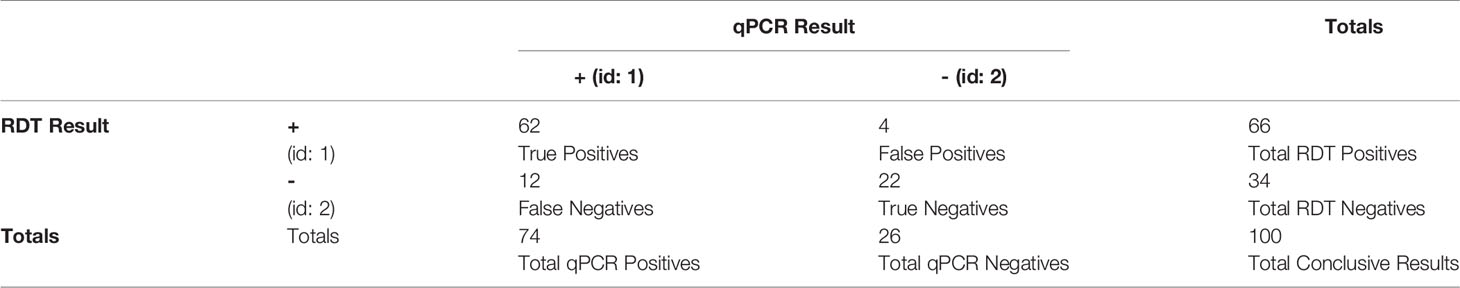
Table 1 Confusion matrix of conclusive RDT results versus qPCR results.
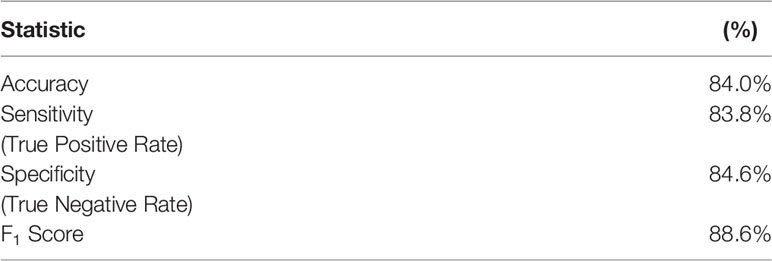
Table 2 Derived statistics from Table 1 with regards to RDT performance compared to qPCR validation. Note that the term “sensitivity” here refers to the statistical measure of the true positive rate.
Using the primers listed in Table 3, an amplicon was sequenced, including a 600 to 960-bp fragment for Pfhrp2 Exon 2 (5). Each sample was sequenced once, in both forward and reverse directions to create a consensus sequence for each sample. Polymerase Chain Reaction (PCR) conditions for Pfhrp2 Exon 2 are also shown in Table 3. The DNA amplicon quality was observed by means of agarose gel electrophoresis and the bands visualized in a UV transilluminator. PCR products were cleaned with 10 units of Exonuclease I (Thermo Scientific) and 0.5 units of shrimp alkaline phosphatase (Affymetrix) at 37°C for 1 h followed by a 15 min incubation at 65°C to deactivate the enzymes. PCR products were sequenced with ABI BigDye Terminator v3.1 (Thermo Fisher Scientific) following the manufacturer’s protocol using the conditions of (1) 95°C for 10 s, (2) 95°C for 10 s, (3) 51°C for 5 s, (4) 60°C for 4 min, and (5) repeat steps 2-4 for 39 more cycles. The samples were cleaned using Sephadex G-50 (Sigma-Aldrich) medium in a filter plate and centrifuged in a vacufuge to decant.

Table 3 PCR conditions and primer sequences from (12).
The samples were reconstituted with Hi-Di Formamide (Thermo Fisher Scientific) and the plates were placed on the ABI 3130 Sequencer. Sequence trace files from all samples and repeat samples were imported into CodonCode Aligner (CodonCode Corporation). The bases were called for each sample. The ends of the sequences were trimmed by the application when possible and manually when necessary. All sequences were examined and evaluated on both the forward and reverse strands, with manual base corrections and manual base calls occurring when necessary. This resulted in 102 usable sequences, of which 100 had a corresponding and conclusive RDT and qPCR results.
2.2 Data Preparation
All Pfhrp2 exon 2 nucleotide sequences were exported from CodonCode Aligner (CodonCode Corporation) and individually pasted into the ExPASy Translate tool (Swiss Institute of Bioinformatics Resource Portal). Both forward and reverse DNA strands were translated using the standard NCBI genetic code. The six reading frames of the amino acid sequence produced were examined. CodonCode’s default parameters were used for clipping the ends and a visual check was performed of each sequence to ensure base calls were correct, and trimmed further as needed.
For each nucleotide sequence, the amino acid sequence presenting the fewest number of stop codons was selected for further analysis. If two or more of the reading frames appeared to produce sequences with an equally minimal number of stop codons, the reading frame that produced a sequence exhibiting the previously recognized pattern in prior sequences was selected for further analysis. While most of the sequences had a clear, single best translation, 11 of the sequences required further editing. In these 11 sequences, the sequence portion before or after the stop codon which exhibited a pattern similar to prior sequences was used in analysis, while the portion of the sequence preceding or following the stop codon, which did not exhibit the recognized pattern, was discarded. Nucleotide sequence input into the ExPASy Translate Tool (Swiss Institute of Bioinformatics Resource Portal) was repeated and verified for accuracy of amino acid sequences. The verified sequences were compiled. For a visual representation of this process, see Figure 2.
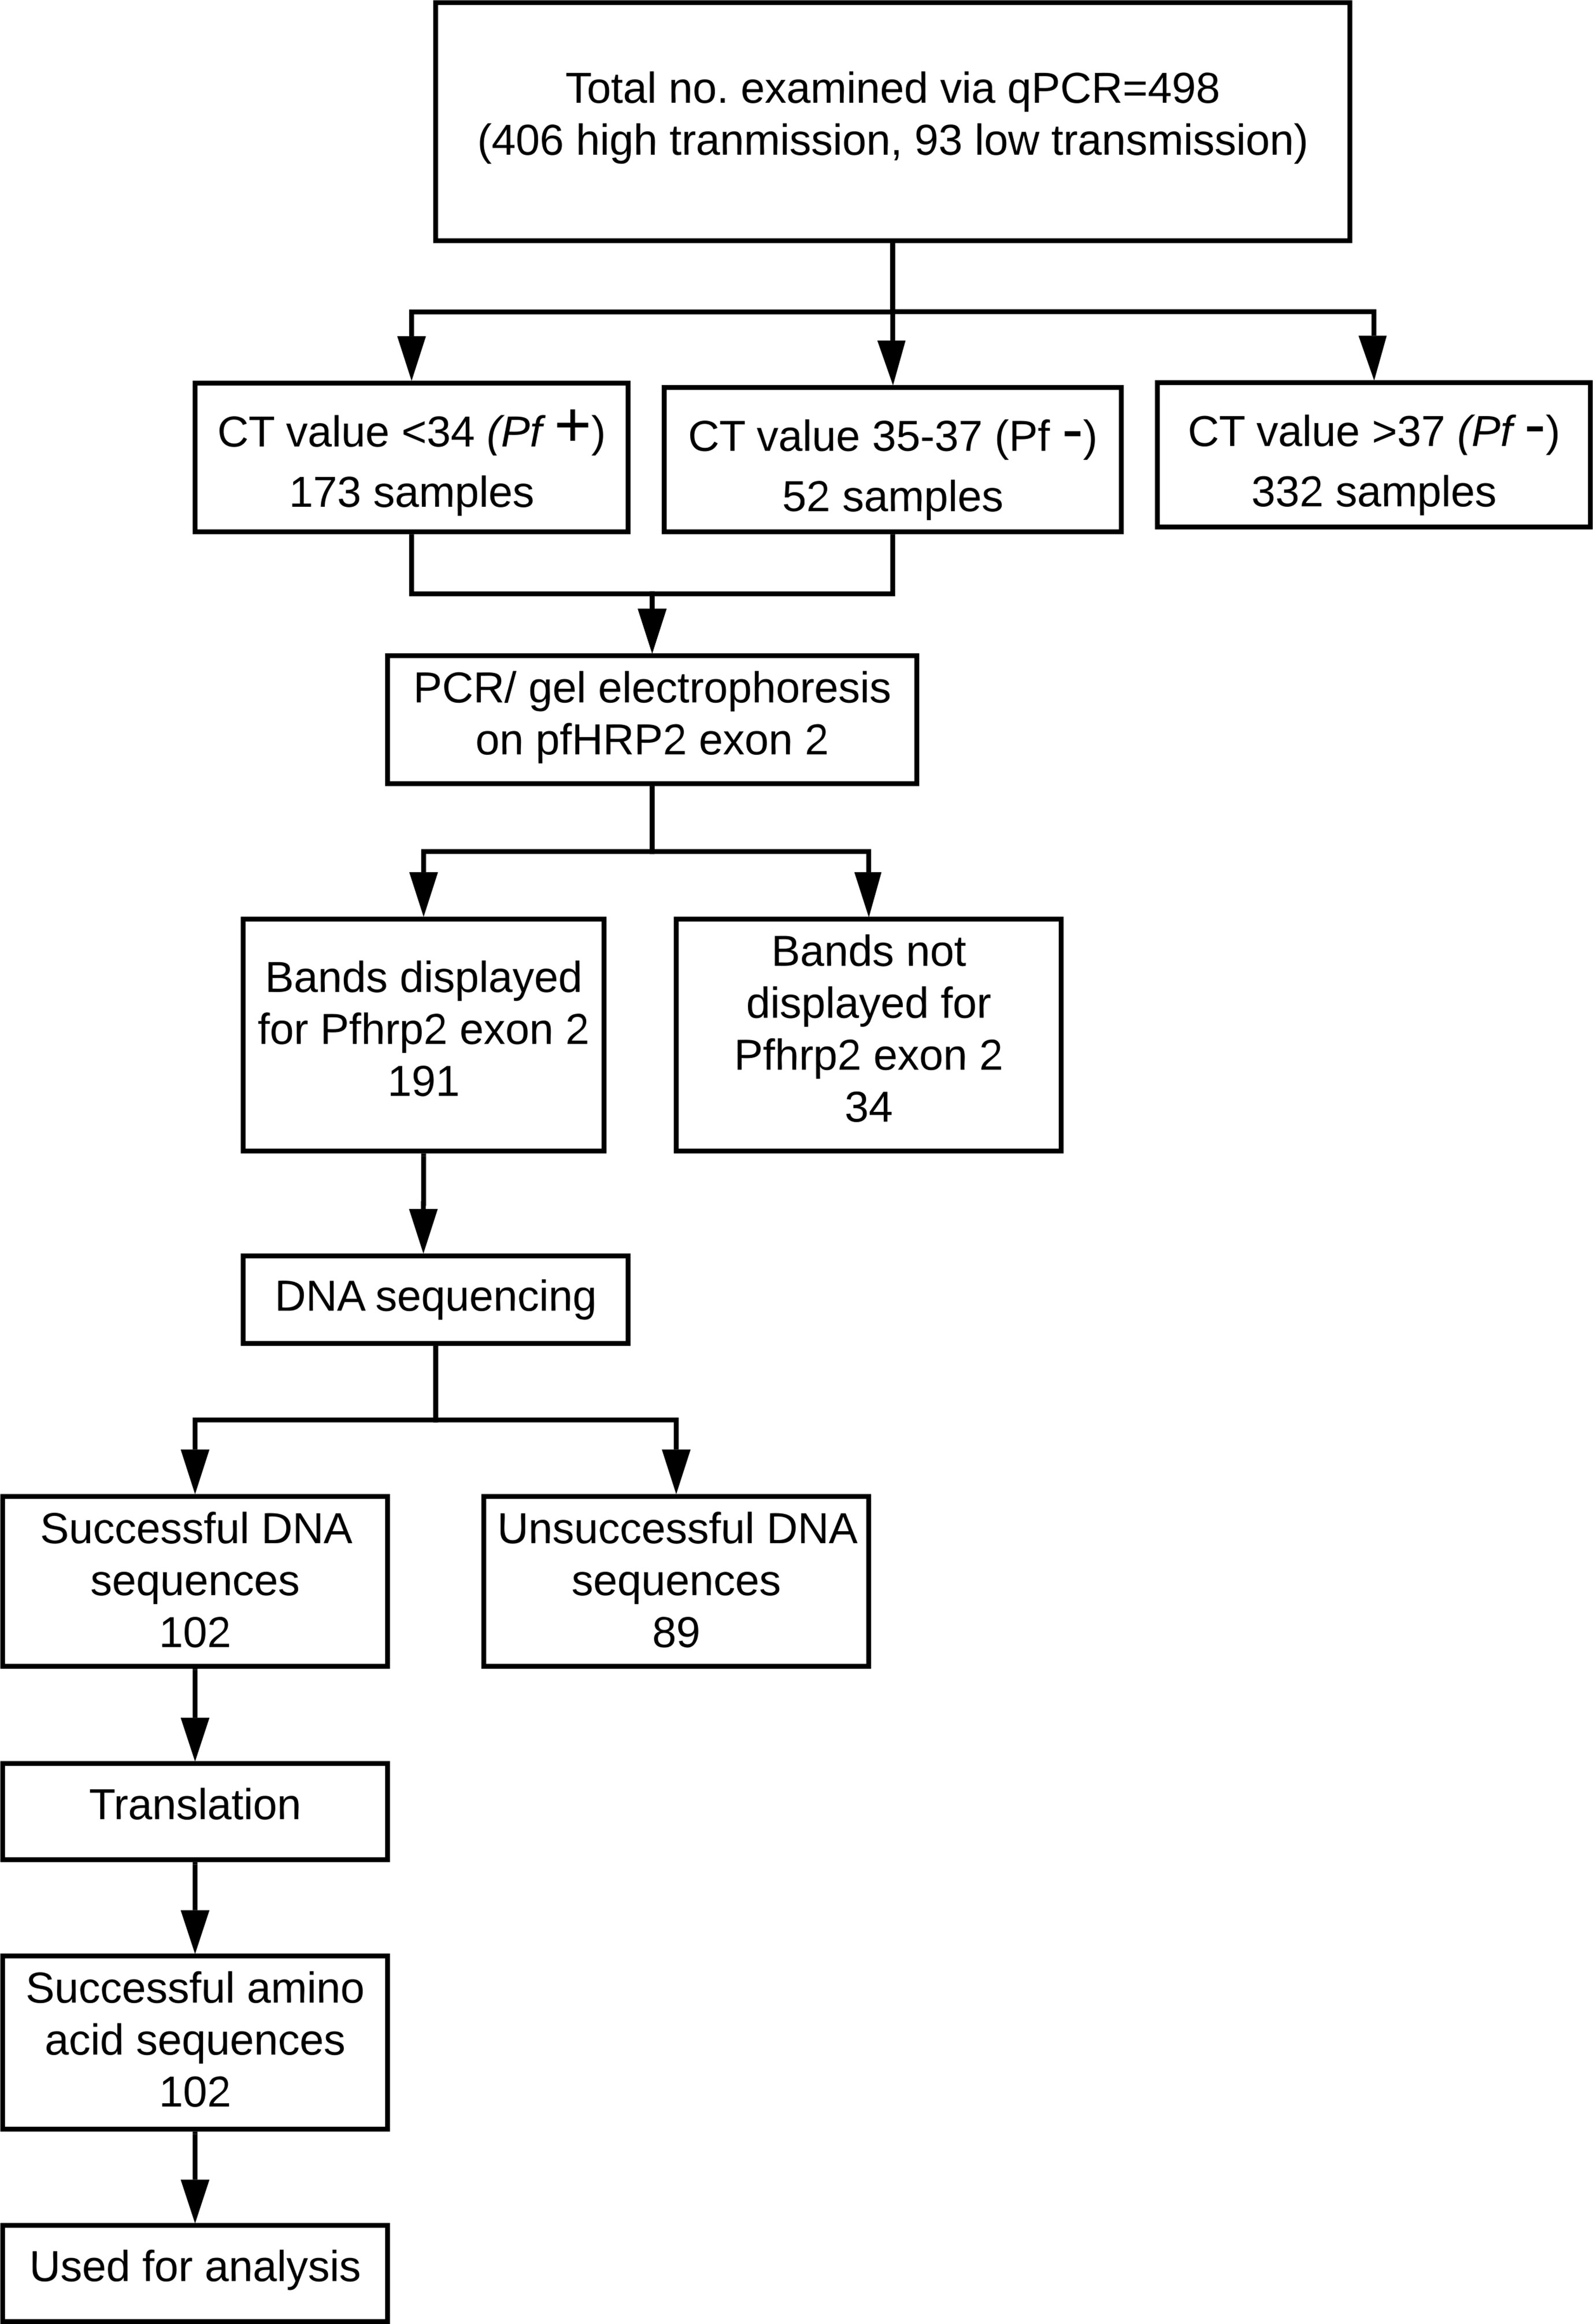
Figure 2 Breakdown of P. falciparum samples used in this study. 100 of the final 102 sequences have corresponding and conclusive RDT and qPCR results and thus were used in the machine learning analysis.
This process resulted in a final dataset of 74 qPCR-positive samples, of which 12 (16%) were RDT-negative and 62 (84%) were RDT-positive. Though the RDTs in this study have an accuracy of 84% (when using qPCR as the ground truth, see Table 2), there is still room for improvement in malaria cases with lower levels of parasitemia or distant clones of P. falciparum. As shown in Table 4, there is a statistically significant relationship between the RDT results and the qPCR results.
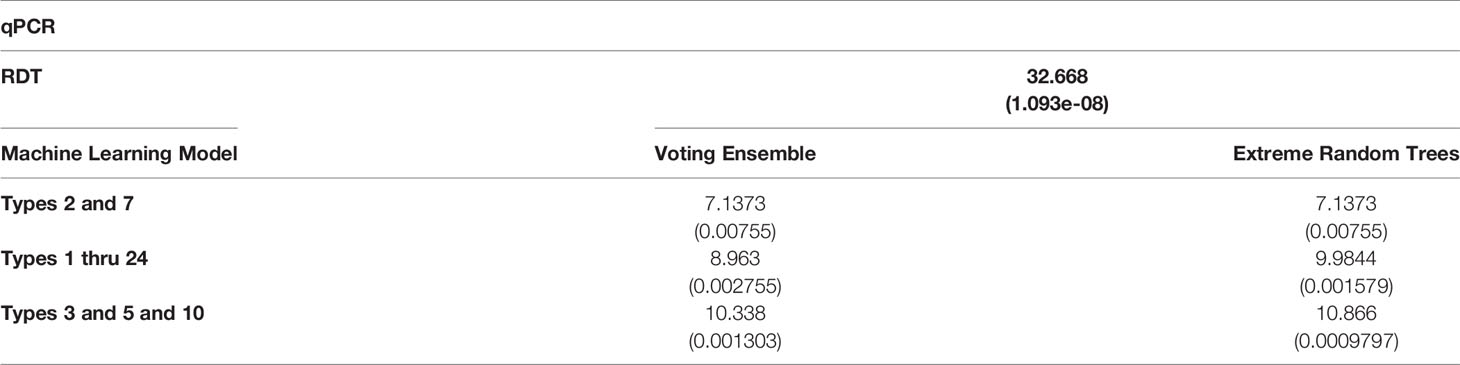
Table 4 χ2 statistics comparing the relationship of qPCR results with RDT results and predicted machine learning model results (with p-values are shown in parentheses).
2.2.1 Motif Search
A motif search was performed across 24 different types of histidine-based repeats. These repeat types, listed in Table 5, were originally defined by Baker et al. (6). This search was completed using the motif.find() function in the bio3d package in R (13). Specifically, each amino acid sequence was searched for each of the 24 repeat motifs and the count of matches was reported back into the data. See Table 6. The breakdown of match frequencies by location is shown in Figure 3.
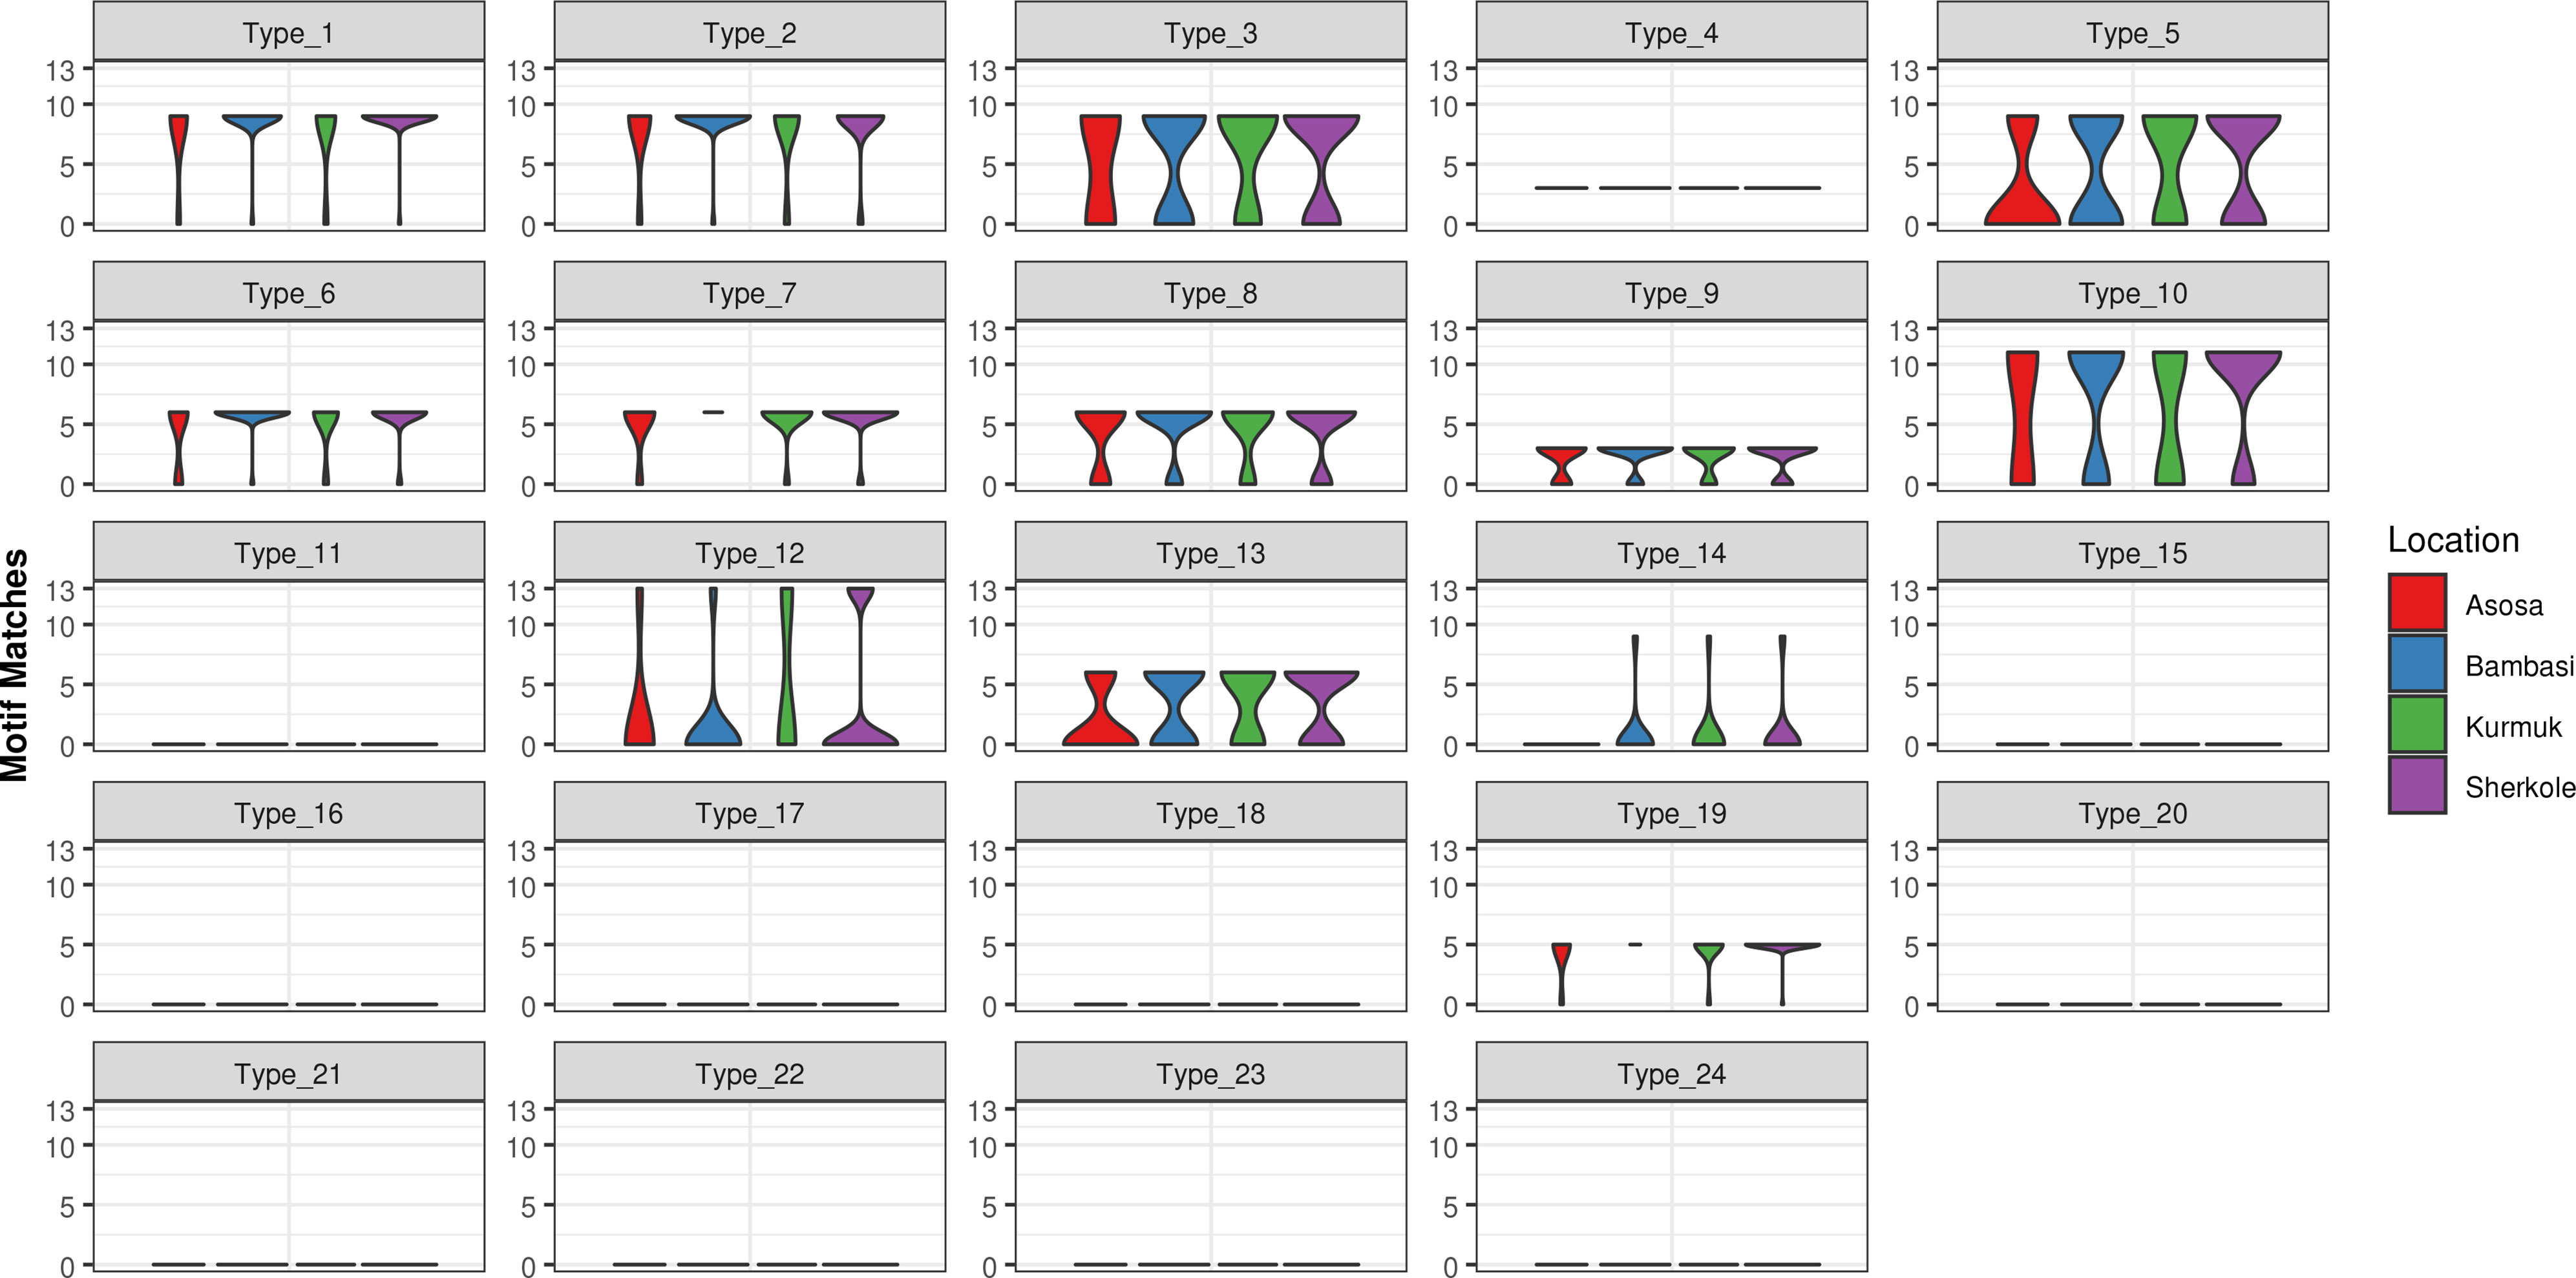
Figure 3 Type frequencies by location.
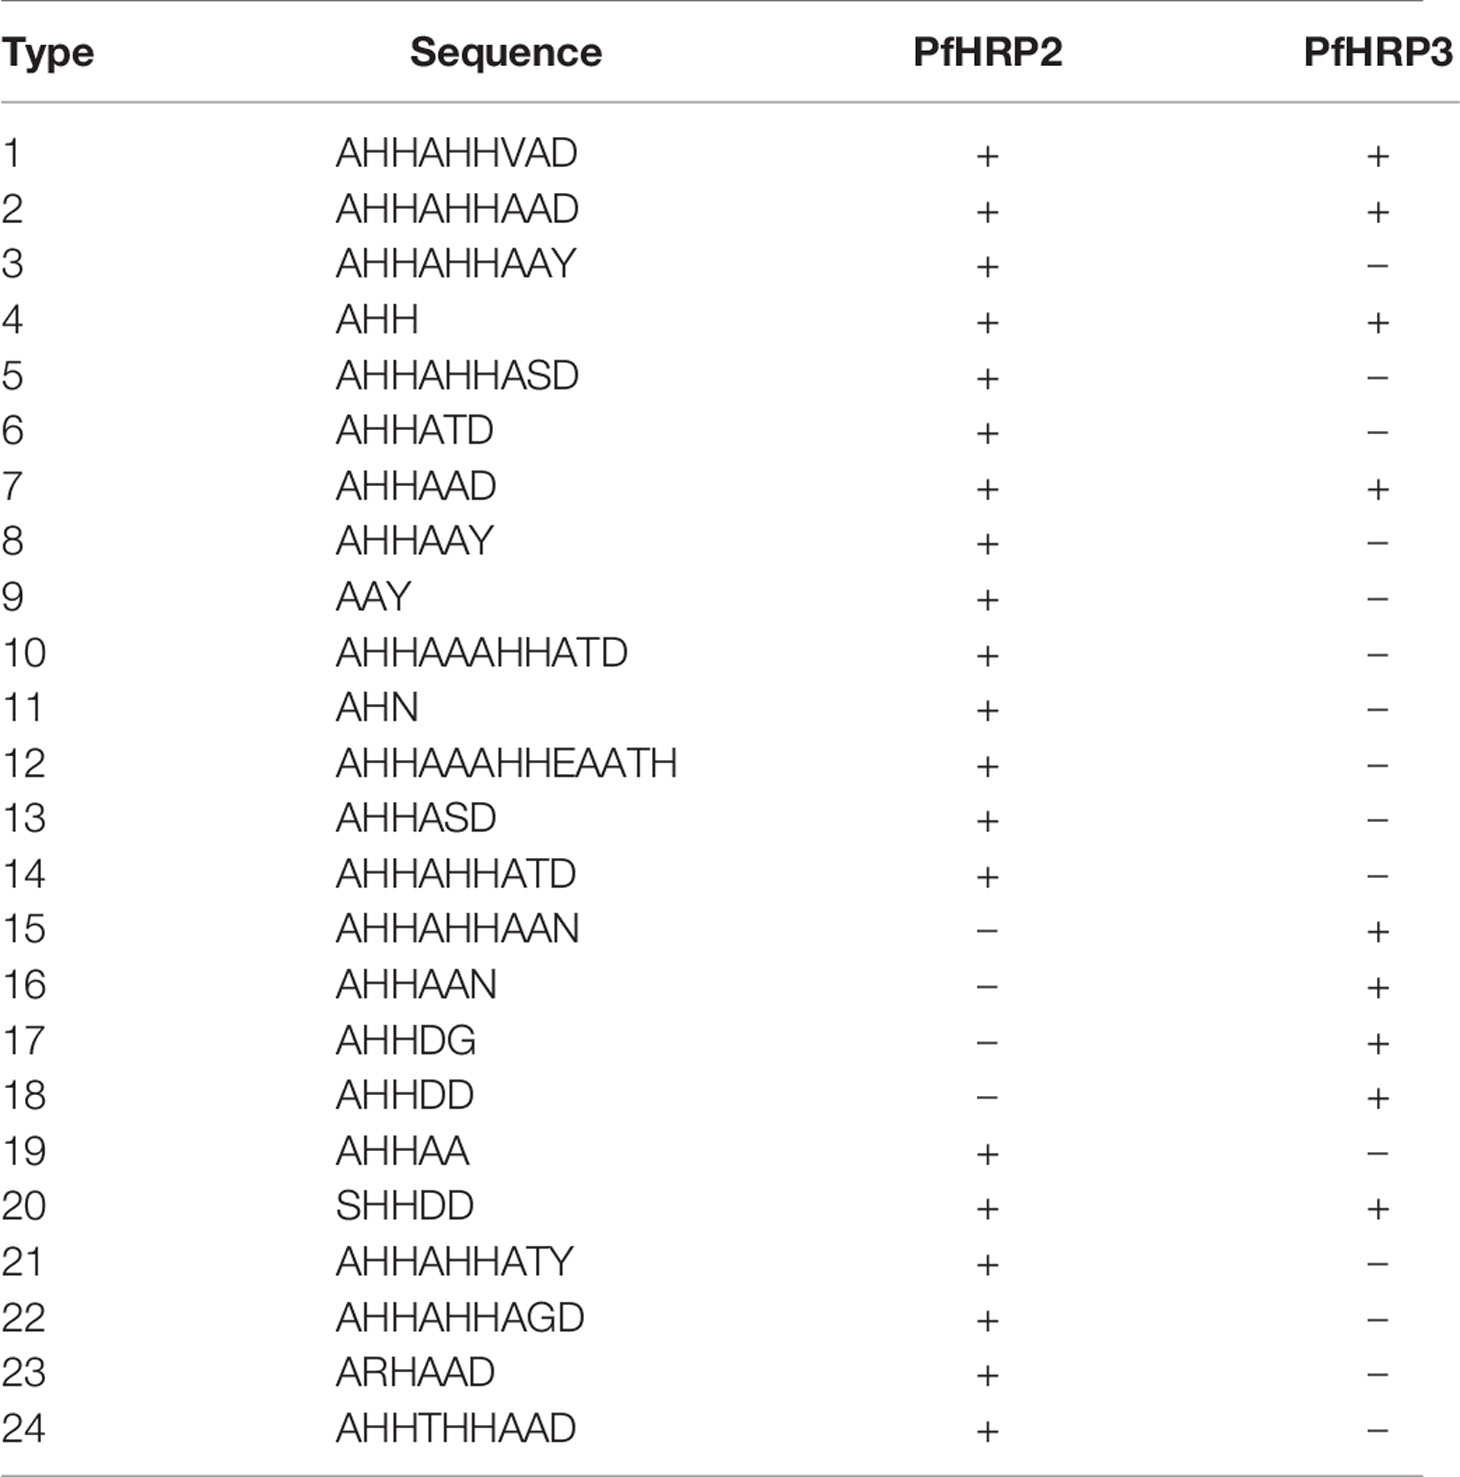
Table 5 PfHRP2 and PFHRP3 repeat motif types as defined by Baker et al. (6).
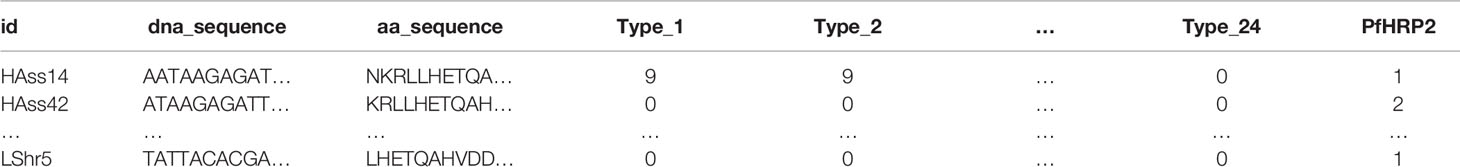
Table 6 Example data format with counts of types 1 through 24 matches in the amino acid sequence. In the PfHRP2 column, a “1” represents positive cases and a “2” represents negative cases of malaria.
2.3 Machine Learning
In this work, three machine learning experiments were created on different sets of features: 1.) using only the types that are in the original Baker model (Types 2 and 7), 2.) using all motif repeat type counts (Types 1 through 24), and 3.) using only the features found to be important in the experiment with all motif repeat types (Types 3, 5, and 10). Note that the PfHRP2 column in Table 6 is treated as the dependent variable in which a “1” represents a positive RDT result for malaria and a “2” represents a negative RDT result. The motif repeat types are used as the independent variables and the PfHRP2 column is treated as the dependent variable.
We used the Microsoft Azure Machine Learning Service (14, 15) as the tracking platform for retaining model performance metrics as the various models were generated. For this use case, multiple machine learning models were trained using various scaling techniques and algorithms. Scaling and normalization methods are shown in Table 7. We then created two ensemble models of the individual models using stack ensemble and voting ensemble methods.
The Microsoft AutoML package (16) allows for the parallel creation and testing of various models, fitting based on a primary metric. For this use case, models were trained using Decision Tree, Elastic Net, Extreme Random Tree, Gradient Boosting, Lasso Lars, LightGBM, RandomForest, and Stochastic Gradient Decent algorithms along with various scaling methods from Maximum Absolute Scaler, Min/Max Scaler, Principal Component Analysis, Robust Scaler, Sparse Normalizer, Standard Scale Wrapper, Truncated Singular Value Decomposition Wrapper (as defined in Table 7). All of the machine learning algorithms are from the scikit-learn package (17) except for LightGBM, which is from the LightGBM package (18). The settings for the model sweep are defined in Table 8. The Monte Carlo cross validation by default takes 10% of the initial training data set as the validation set. The validation set is then used for metrics calculation.
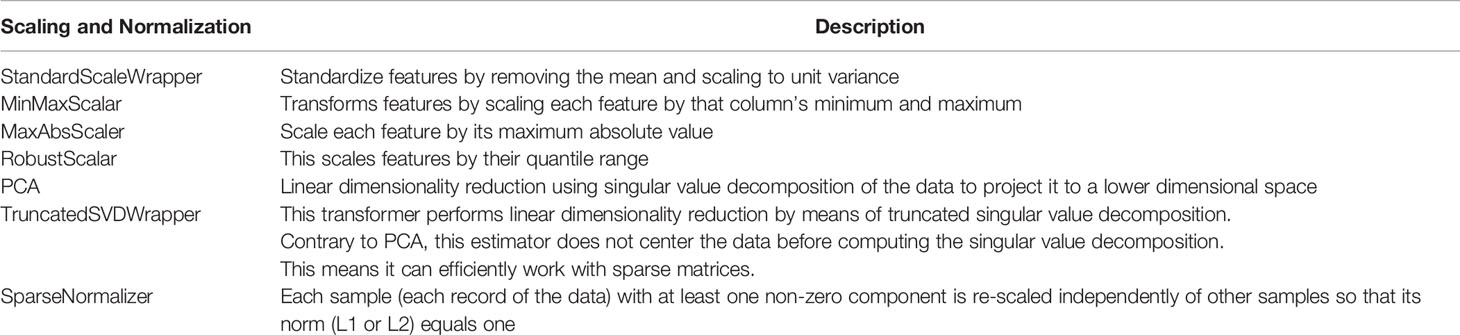
Table 7 Scaling function options in the machine learning model search Microsoft (2019b).
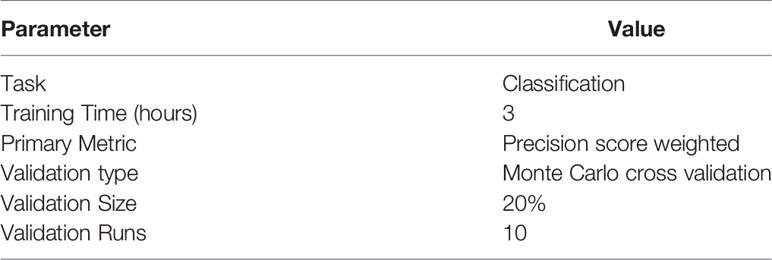
Table 8 Parameter settings for the model searches.
For the experiment using only Types 2 and 7, 35 models were trained. For the experiment using Types 1 through 24, 35 models were trained. For the experiments using Types 3, 5, and 10, 31 models were trained. This variation in the number of models trained is a factor of the automated model and parameter selection process. When an assumed optimal model and parameter set is found, the algorithm stops training individual models and then performs ensembling of the various singular models that were trained.
Two ensemble models (voting ensemble and stack ensemble) were created and tested for each experiment. The voting ensemble method makes a prediction based on the weighted average of the previous models’ predicted classification outputs whereas the stacking ensemble method combines the previous models and trains a meta-model using the elastic net algorithm based on the output from the previous models. The model selection method used was the Caruana ensemble selection algorithm (19).
For a visual representation of this analysis process, see Figure 4 below.
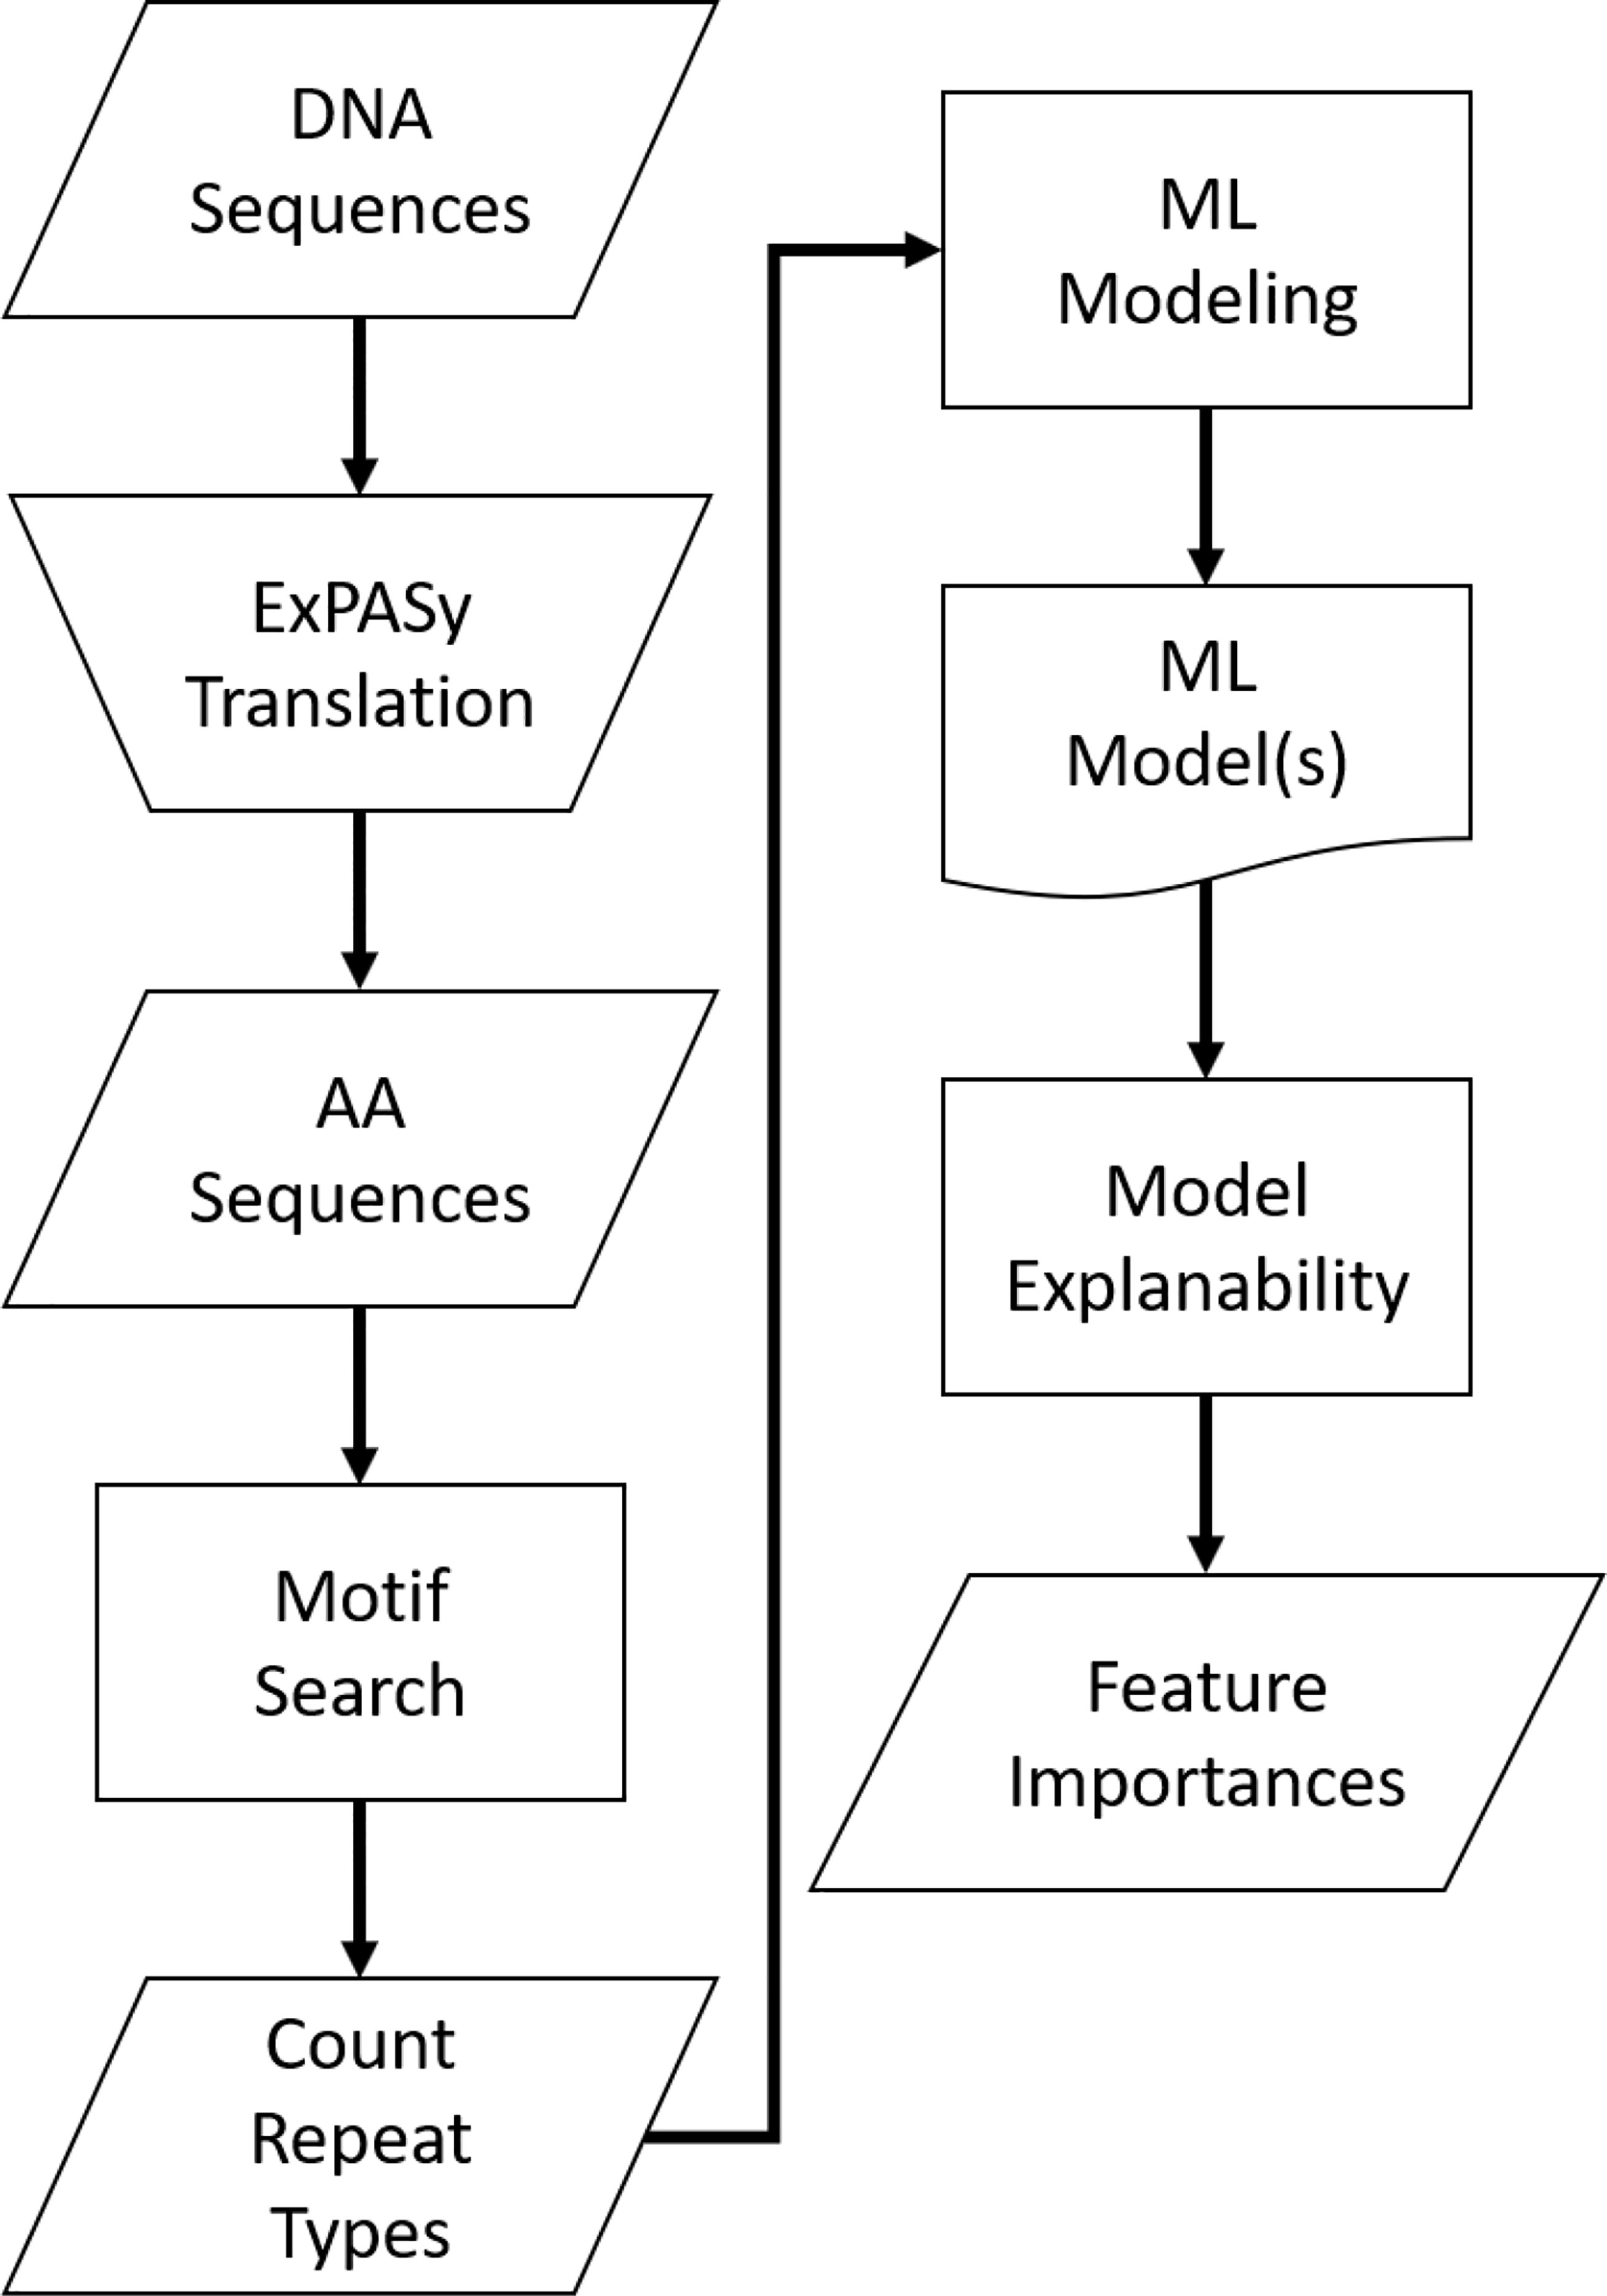
Figure 4 Analysis process flow.
3 Results
Metrics from the three experiments’ machine learning models (one each for the best ensemble model and a best singular model) are reported in Table 9. The precision-recall curves for these models are shown in Table 10 and the receiver operating characteristic (ROC) curves are shown in Table 11. The ideal scenario is shown as a dash-dot-dash (-.-) line. The best model overall is the Extreme Random Trees model using only Types 3, 5, and 10. This was determined by looking at the overall model metrics and the generated curves. Note that many models were generated for each experiment, some of which have equal overall performance. The best ensemble model and most simplistic singular model are shown here, but all model runs can be found in the Supplementary Data.
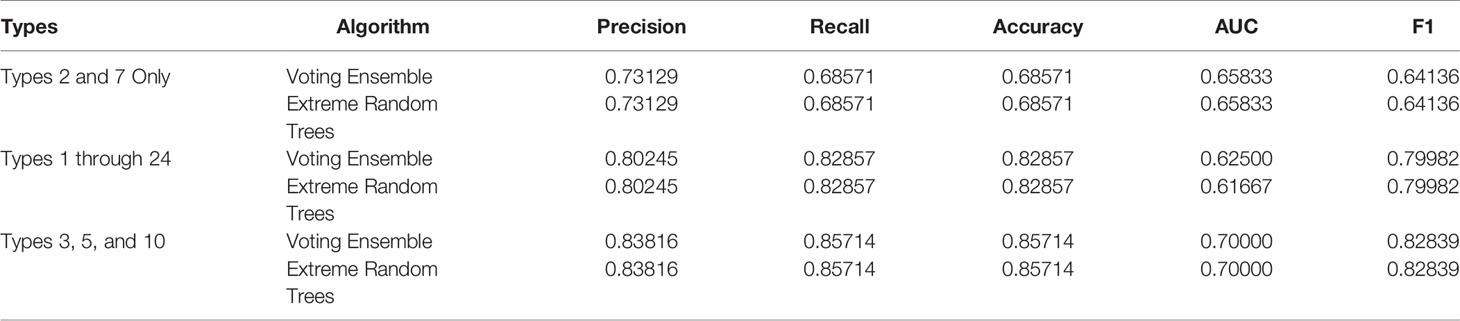
Table 9 Model metrics for the best singular model and voting ensemble model for each experiment.
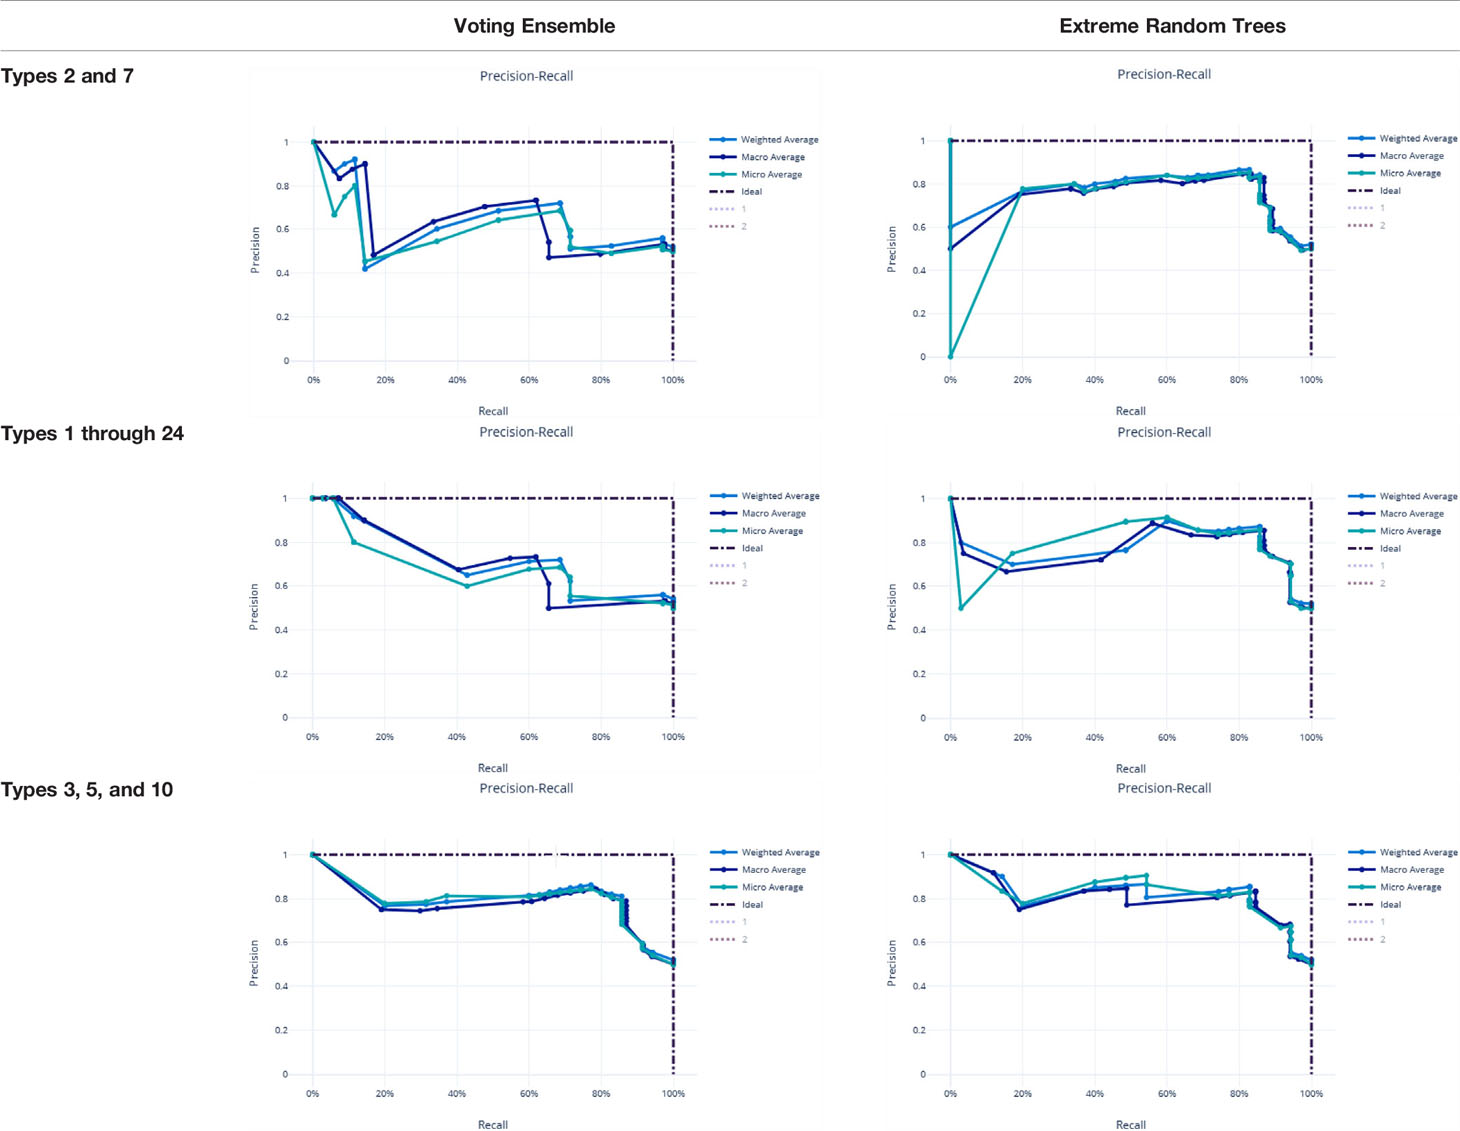
Table 10 Precision-recall curves for the best singular model and voting ensemble model for each experiment.
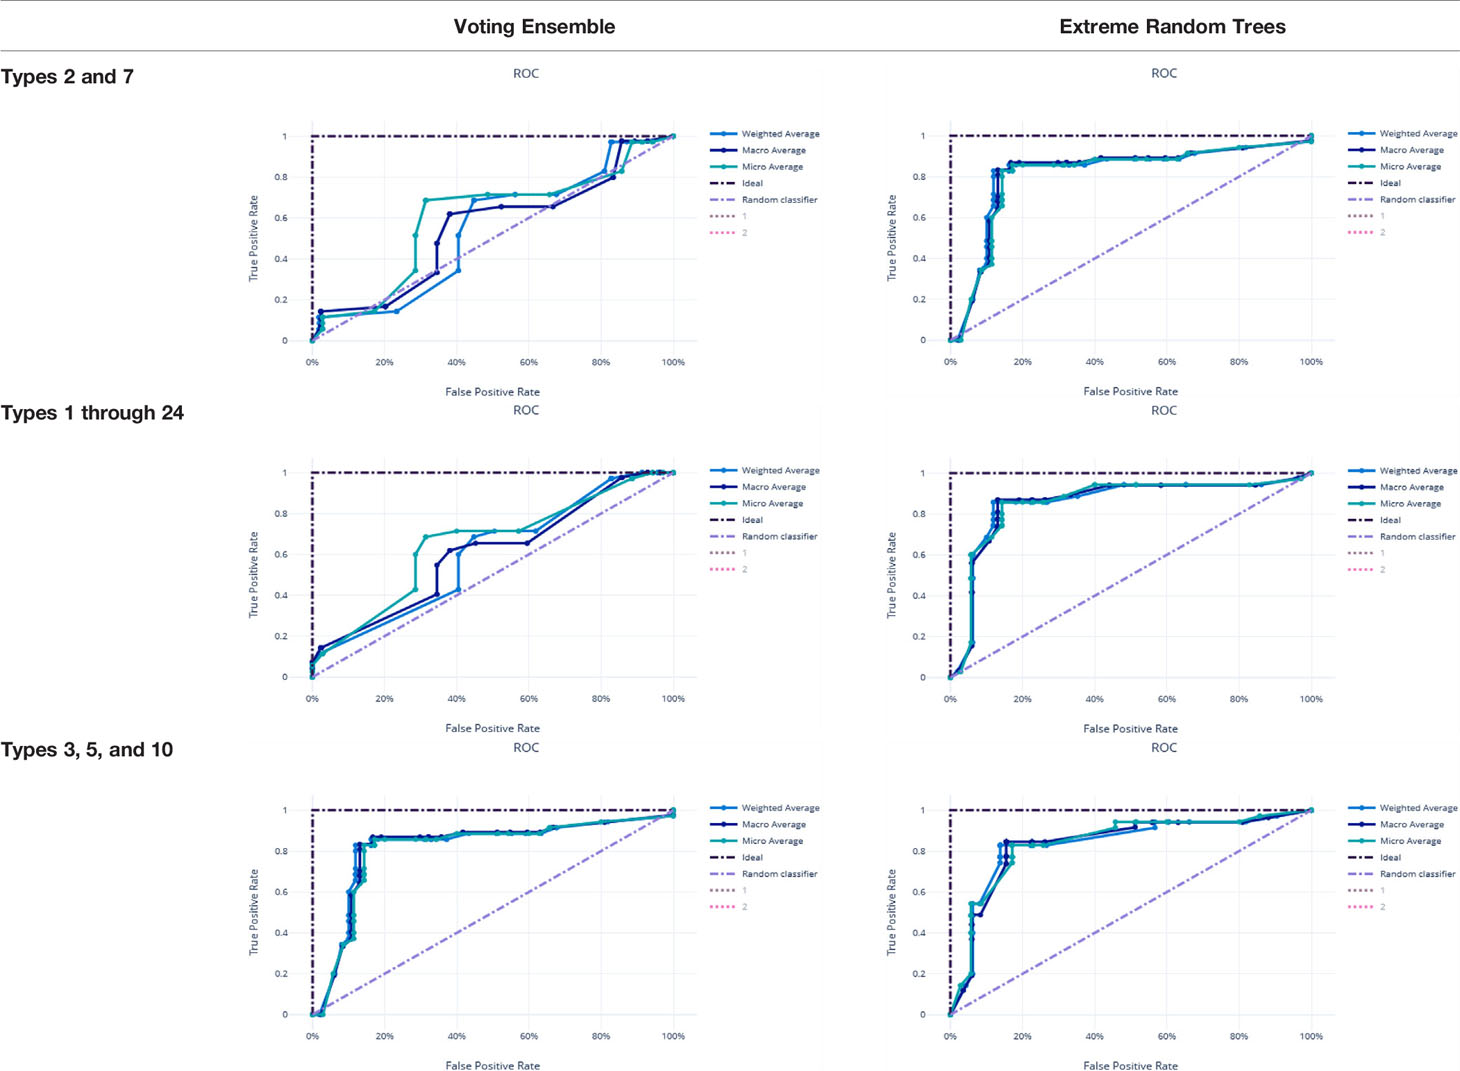
Table 11 ROC Curves for the best singular model and voting ensemble model for each experiment.
χ2 tests were performed to evaluate the relationship between the individual machine learning model results, by Type set, and qPCR results. See Table 4. The Extreme Random Trees model using only Types 3, 5, and 10, has the best significance and shows the most significant relationship between the predictions and the qPCR results. Though all of the machine learning result comparisons are statistically significant at the α = 0.05 level, the use of Types 3, 5, and 10 results in the best concordance with qPCR results.
3.1 Feature Importance
Feature importances were calculated using mimic-based model explanation of the voting ensemble model for Types 1 through 24. The mimic explainer works by training global surrogate models to mimic a black box model (20). The surrogate model is an interpretable model, trained to approximate the predictions of a black box model as accurately as possible (21). See Figure 5 and Table 12.
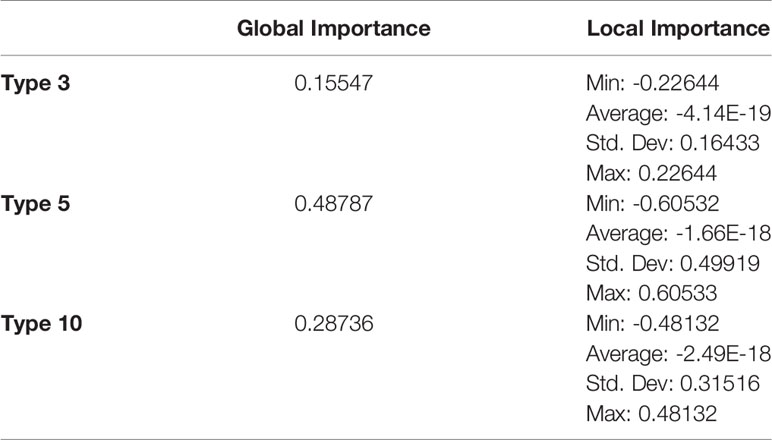
Table 12 Global and local feature importances of all features with non-zero importance (Types 3, 5, and 10) from the voting ensemble model using types 1 through 24.
In the Voting Ensemble model using Types 1 through 24, Types 3, 5, and 10 were found to have non-zero importance. Types 3, 5, and 10 were then selected to train a more parsimonious model, which resulted in the best overall performance, as shown in above Tables 10, 11.
3.2 Repeat Type Prevalence
As shown in Figure 5 and Table 13, many of the repeat types described by Baker et al. (6) (Table 5) are represented in the Ethiopian sequences analyzed in this study. Specifically, Types 1-10, 12-14, and 19 were found among these isolates. This is in general agreement to a similar report by Willie et al. (22) using samples collected from Papua New Guinea. They report that Types 1, 2, 6, 7, and 12 were present in almost all (≥ 89%) sequences, Types 3, 5, 8, and 10 were present in most (≥ 56%) sequences, and Type 4, 13, and 19 were seen in ≤ 33% of sequences. In contrast, we see a higher prevalence of Types 4 and 19 and a lower prevalence of Type 12 than in the previous study.
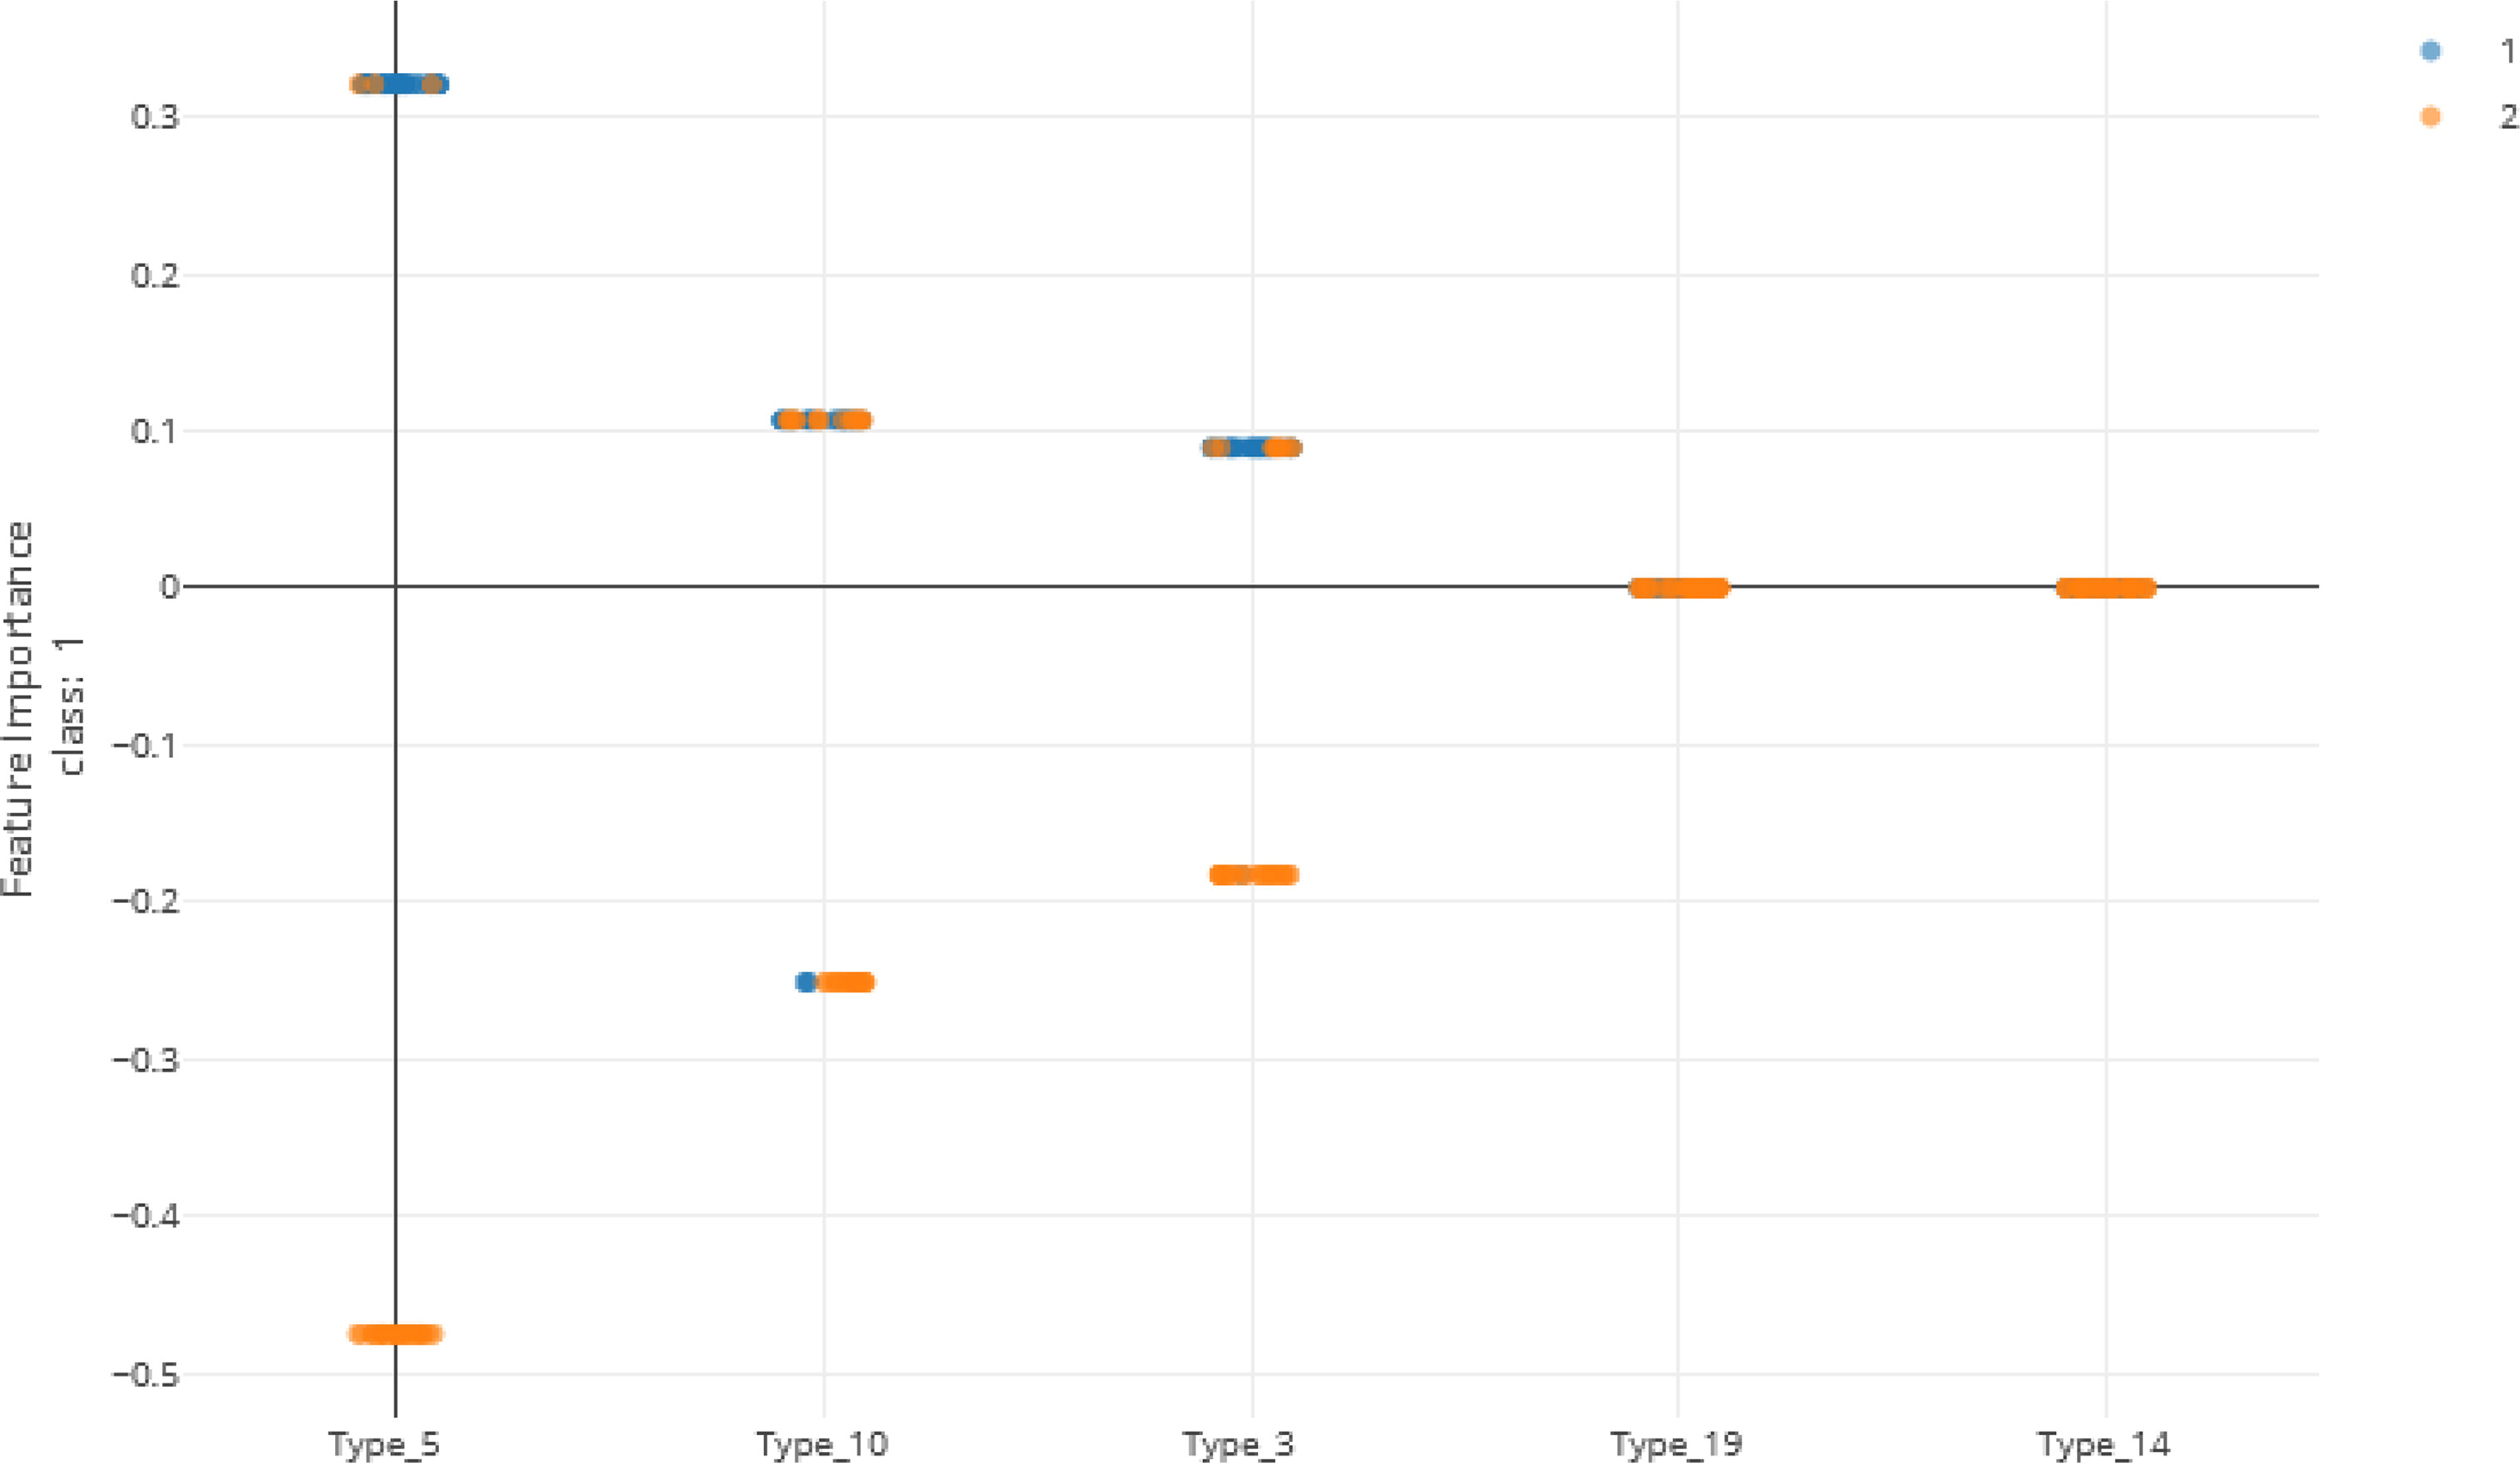
Figure 5 Local feature importance of the top 5 features. Note that only the top 3 have non-zero importances from the Voting Ensemble model using Types 1 through 24. Class “1” (orange dots) represents positive cases and class “2” (blue dots) represents negative cases of malaria.
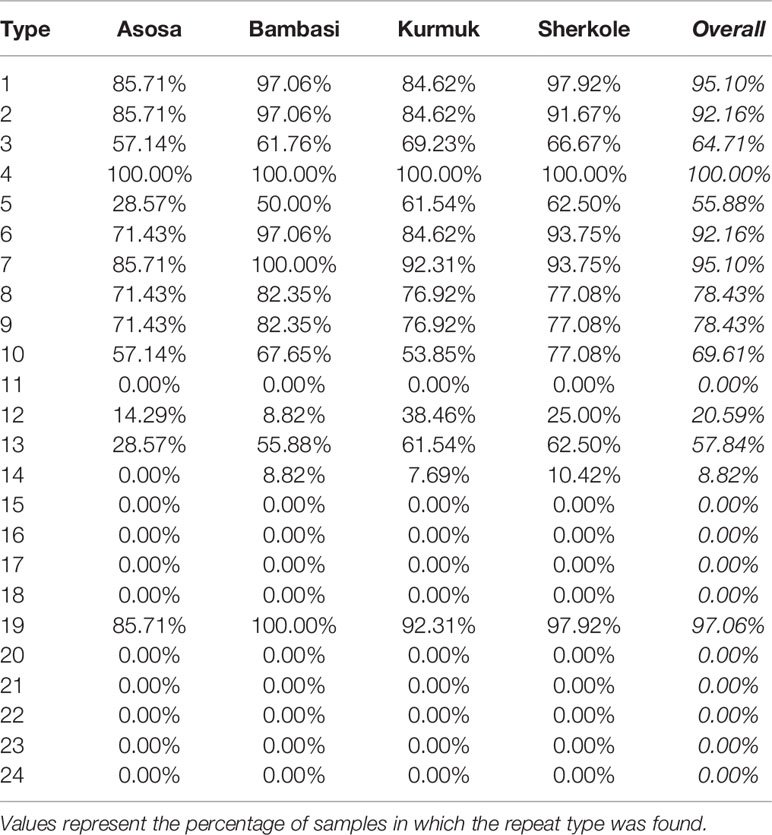
Table 13 Overall prevalence of each repeat type by location.
Another study by Bharti et al. (23) that used samples collected from multiple sites in India, reported that Types 1, 2, 7, and 12 were seen in 100% of their sequences. However, in our sequences from Ethiopia, we see multiple examples where these repeats are not present, especially Type 12.
4 Discussion
Our work here is not to replace PCR-based testing, which is still reliable and accurate, but to use machine learning to propose specific updates to RDTs. Given that RDTs are useful in remote settings and are quicker and cheaper than PCR-based tests, their accuracy is crucial in the diagnosis of malaria and in the epidemiological understanding of the spread of the disease.
Furthermore, our claim here is not that this preliminary machine learning model should be used across the globe or even in Ethiopia without further validation. Instead, we are proposing that the derivation of feature importance from ensembled machine learning models may prove beneficial in the understanding of RDT sensitivity as a factor of complex polymorphic variations of genes. A limitation of this study is that only 100 samples were used from 4 locations in Ethiopia and this study only asserts the utility of RDTs based on a single gene (Pfhrp2). This does not assess RDT sensitivity for other P. falciparum genes, isolates without the Pfhrp2 gene (gene deletion), or the cross-reactivity of RDTs against the Pfhrp3 gene. Thus, there is a need to use larger datasets to increase our confidence in any machine learning model that is created and to sufficiently validate any model’s findings with additional data from a similar parasite population.
Here we show the utility of machine learning in the identification of important factors in malaria diagnosis. Previous modeling by Baker et al. (5) had shown that the parasitic infection can be diagnosed by looking at the prevalence of particular types of amino acid repeats. The original regression-based model may no longer by valid for this region of Ethiopia and, in this study, we show that even modeling Types 2 and 7 using more sophisticated machine learning algorithms fails to produce a reliable model of sensitivity. However, the usage of all Types 1 through 24 proves to make effective models that better characterize test performance to detect P. falciparum infections in our dataset. Furthermore, the usage of machine learning model explainability helps to pinpoint particular features of interest. In this case, Types 3, 5 and 10 reveal better diagnostic sensitivity for these malaria isolates collected from regions of Ethiopia.
Several studies have indicated that the Type 2 repeat (AHHAHHAAD) and Type 7 repeat (AHHAAD) have been described as possible epitopes targeted by monoclonal antibodies used to detect PfHRP2 (6, 24). The highest frequency Types 2, 4, and 7 are also observed in some African countries (25). This is in agreement with our findings in this work for the Types that have a high prevalence frequency (between 85%-100%). However, our analysis here may reveal better diagnostic sensitivity for Types 3, 5, and 10, which have lower frequencies (between ~28%-70%) among the malaria isolates collected from our study area in Ethiopia. These Type prevalences by region are shown in Table 13.
When comparing the prevalences of Types in our Ethiopian samples (as shown in Table 13) to samples in other HRP2/3-based studies from other regions, there are often many differences in the breakdown of Types. For example, in the Type prevalences across the Indian samples in Kumar Bharti et al. (26) (see Supplementary Data), we see that Types 2, 6, 7, and 12 are almost always seen and that the Types that are less pervasive (which seem to be important in understanding RDT sensitivity) vary drastically from the Ethiopian samples used in our study. Interestingly, in samples from a Papua New Guinea study by Willie et al. (22), we see that Types 2, 7, and 12 are almost always seen and that Types are 3, 5, and 10 are less prevalent, similar to the findings in this study.
These comparisons support the argument that regional models must be created as a “one size fits all” approach to modeling RDT sensitivity will not be adequate given the global variability in the parasite. While some Types are quite common globally, the key to RDT sensitivity may lie in the Types that are less ubiquitous, as is shown in our study and is exemplified by the waning utility of Types 2 and 7 despite their common prevalence.
In future work, additional genetic factors need to be taken into account so that isolates without PfHRP2/3 are detected as well. It has been shown that a substantial portion of Ethiopian isolates experience PfHRP2 deletion in some regions (for example, over 62% of isolates in Eritrea) and, as such, this necessitates the evaluation of other genes when designing RDTs (27). RDTs will only be able to test for a finite set of features, so we should ensure any modeling is performed on data that represents the entire diversity in a given region. This activity should be performed at a regional or smaller level as worldwide parasite diversity will be infeasible to capture in a small enough set of features that can be implemented in a single RDT. Our purpose here is to showcase this innovative methodology for highlighting such features in genetic data. Furthermore, we show an example insight that Types 3, 5, and 10 could be used in future RDTs upon further in vitro testing and validation.
5 Conclusion
In this work, we show the utility of employing broad machine learning modeling on various genetic features and then deriving the important features from top performing models to hone in on potential targets for future RDTs. This work posits the idea that RDTs can be revised to accommodate the genetic differences seen in today’s P. falciparum infections and malaria cases. While this study focuses on a small region of Ethiopia, we can conclude that HRP2 variants may not correlate with RDT accuracy at a global level. Future versions of RDTs may be improved using our novel methodology for identifying genetic variants of interest to improve test sensitivity on a regional level. Though more work is to be done to empirically validate these findings, this in silico simulation may direct where to take experimental testing next. Also, while this work showcases important histidine-rich repeats of Types 3, 5, and 10, this is specific to the Ethiopian sequences used in this study and other P.falciparum strains in other regions may result in different results. Furthermore, training machine learning models on sets of malaria sequences from other areas such as Papua New Guinea, India, or other areas of Africa may reveal that different repeats are important in those areas, likely suggesting the RDTs may need to be region-specific due to variations in P. falciparum across the globe.
Data Availability Statement
The datasets presented in this study can be found in online repositories. The names of the repository/repositories and accession number(s) can be found below: https://github.com/colbyford/pfHRP_MLModel, GitHub.
Ethics Statement
The studies involving human participants were reviewed and approved by Addis Ababa University and The University of North Carolina at Charlotte. Written informed consent to participate in this study was provided by the participants’ legal guardian/next of kin.
Author Contributions
GA and LG designed and performed the patient recruitment and sampling. GA, LG and DJ managed ethical approval, funding, and visas. GA, KL, KB, and CD performed the DNA extractions, RT-PCR, PCR, and sequencing of the samples under the direction of LG, DJ, and EL. KB and DJ performed the DNA to amino acid translations. CF performed the motif search for repeat types and performed all the machine learning and model interpretability work. All authors contributed to the article and approved the submitted version.
Funding
The field data collection portion of this work was funded in part by Addis Ababa University Thematic Research.
Conflict of Interest
The authors declare that the research was conducted in the absence of any commercial or financial relationships that could be construed as a potential conflict of interest.
Publisher’s Note
All claims expressed in this article are solely those of the authors and do not necessarily represent those of their affiliated organizations, or those of the publisher, the editors and the reviewers. Any product that may be evaluated in this article, or claim that may be made by its manufacturer, is not guaranteed or endorsed by the publisher.
Supplementary Material
The Supplementary Material for this article can be found online at: https://github.com/colbyford/pfHRP_MLModel
Footnotes
- ^ “Sensitivity” here refers to the ability of a RDT to detect a malaria infection despite genetic variations of the parasite. Elsewhere in this article in relation to machine learning, this term is used to describe the statistical measure also known as “true positive rate”.
References
4. Ouattara A, Kone A, Adams M, Fofana B, Maiga AW, Hampton S, et al. Polymorphisms in the K13-Propeller Gene in Artemisinin-Susceptible Plasmodium Falciparum Parasites From Bougoula-Hameau and Bandiagara, Mali. Am J Trop Med Hygiene (2015) 92:1202–6. doi: 10.4269/ajtmh.14-0605
5. Baker J, McCarthy J, Gatton M, Kyle DE, Belizario V, Luchavez J, et al. Genetic Diversity of Plasmodium Falciparum Histidine-Rich Protein 2 (Pfhrp2) and Its Effect on the Performance of Pfhrp2-Based Rapid Diagnostic Tests. J Infect Dis (2005) 192:870–7. doi: 10.1086/432010
6. Baker J, Ho M-F, Pelecanos A, Gatton M, Chen N, Abdullah S, et al. Global Sequence Variation in the Histidine-Rich Proteins 2 and 3 of Plasmodium Falciparum: Implications for the Performance of Malaria Rapid Diagnostic Tests. Malaria J (2010) 9:129. doi: 10.1186/1475-2875-9-129
7. Davis S, Button-Simons K, Bensellak T, Ahsen EM, Checkley L, Foster GJ, et al. Leveraging Crowdsourcing to Accelerate Global Health Solutions. Nat Biotechnol (2019) 37:848–50. doi: 10.1038/s41587-019-0180-5
8. Ford CT, Janies D. Ensemble Machine Learning Modeling for the Prediction of Artemisinin Resistance in Malaria. F1000Research (2020) 9:1–22. doi: 10.12688/f1000research.21539.5
9. Alemayehu GS, Lopez K, Dieng CC, Lo E, Janies D, Golassa L. Evaluation of Pfhrp2 and Pfldh Malaria Rapid Diagnostic Test Performance in Assosa Zone, Ethiopia. Am J Trop Med Hygiene (2020) 103:1902–9. doi: 10.4269/ajtmh.20-0485
10. Miguel RB, Coura JR, Samudio F, Suárez-Mutis MC. Evaluation of Three Different DNA Extraction Methods From Blood Samples Collected in Dried Filter Paper in Plasmodium Subpatent Infections From the Amazon Region in Brazil. Rev do Instituto Med Trop Sao Paulo (2013) 55:205–8. doi: 10.1590/S0036-46652013000300012
11. Snounoua G, Viriyakosol S, Zhu XP, Jarra W, Pinheiro L, do Rosario VE, et al. High Sensitivity of Detection of Human Malaria Parasites by the Use of Nested Polymerase Chain Reaction. Mol Biochem Parasitol (1993) 61:315–20. doi: 10.1016/0166-6851(93)90077-B
12. Parr JB, Anderson O, Juliano JJ, Meshnick SR. Streamlined, Pcr-Based Testing for Pfhrp2- and Pfhrp3-Negative Plasmodium Falciparum. Malaria J (2018) 17:137. doi: 10.1186/s12936-018-2287-4
13. Grant BJ, Rodrigues APC, ElSawy KM, McCammon JA, Caves LSD. Bio3d: An R Package for the Comparative Analysis of Protein Structures. Bioinformatics (2006) 22:2695–6. doi: 10.1093/bioinformatics/btl461
17. Pedregosa F, Varoquaux G, Gramfort A, Michel V, Thirion B, Grisel O, et al. Scikit-Learn: Machine Learning in Python. J Mach Learn Res (2011) 12:2825–30. doi: 10.5555/1953048.2078195
18. Ke G, Meng Q, Finley T, Wang T, Chen W, Ma W, et al. Lightgbm: A Highly Efficient Gradient Boosting Decision Tree. In: Guyon I, Luxburg UV, Bengio S, Wallach H, Fergus R, Vishwanathan S, Garnett R, editors. Advances in Neural Information Processing Systems 30. Curran Associates, Inc. Department of Computer Science at Cornell University, (2017). p. 3146–54.
19. Caruana R, Niculescu-Mizil A, Crew G, Ksikes A. Ensemble Selection From Libraries of Models. In: In Proceedings of the Twenty-First International Conference on Machine Learning. New York, NY, USA: ACM (2004). p. 18. ICML ‘04. doi: 10.1145/1015330.1015432
20. Lundberg SM, Lee S-I. A Unified Approach to Interpreting Model Predictions. In: Guyon I, Luxburg UV, Bengio S, Wallach H, Fergus R, Vishwanathan S, Garnett R, editors. In Advances in Neural Information Processing Systems 30. Curran Associates, Inc, GitHub.io. (2017). p. 4765–74.
21. Molnar C. Interpretable Machine Learning (2019). Available at: https://christophm.github.io/interpretable-ml-book/.
22. Willie N, Zimmerman PA, Mehlotra RK. Plasmodium Falciparum Histidine-Rich Protein 2 Gene Variation in a Malaria-Endemic Area of Papua New Guinea. Am J Trop Med Hygiene (2018) 99:697–703. doi: 10.4269/ajtmh.18-0137
23. Bharti PK, Chandel HS, Ahmad A, Krishna S, Udhayakumar V, Singh N. Prevalence of Pfhrp2 and/or Pfhrp3 Gene Deletion in Plasmodium Falciparum Population in Eight Highly Endemic States in India. PloS One (2016) 11:1–16. doi: 10.1371/journal.pone.0157949
24. Lee N, Gatton ML, Pelecanos A, Bubb M, Gonzalez I, Bell D, et al. Identification of Optimal Epitopes for Plasmodium Falciparum Rapid Diagnostic Tests That Target Histidine-Rich Proteins 2 and 3. J Clin Microbiol (2012) 50:1397–405. doi: 10.1128/JCM.06533-11
25. Deme AB, Park DJ, Bei AK, Sarr O, Badiane AS, Gueye PEHO, et al. Analysis of Pfhrp2 Genetic Diversity in Senegal and Implications for Use of Rapid Diagnostic Tests. Malaria J (2014) 13:34. doi: 10.1186/1475-2875-13-34
26. Kumar Bharti P, Singh Chandel H, Krishna S, Nema S, Ahmad A, Udhayakumar V, et al. Sequence Variation in Plasmodium Falciparum Histidine Rich Proteins 2 and 3 in Indian Isolates: Implications for Malaria Rapid Diagnostic Test Performance. Sci Rep (2017) 7:1308. doi: 10.1038/s41598-017-01506-9
Keywords: malaria, Plasmodium falciparum, rapid diagnostic test, machine learning, model explainability
Citation: Ford CT, Alemayehu GS, Blackburn K, Lopez K, Dieng CC, Golassa L, Lo E and Janies D (2021) Modeling Plasmodium falciparum Diagnostic Test Sensitivity Using Machine Learning With Histidine-Rich Protein 2 Variants. Front. Trop. Dis 2:707313. doi: 10.3389/fitd.2021.707313
Received: 09 May 2021; Accepted: 01 September 2021;
Published: 04 October 2021.
Edited by:
Helder Nakaya, University of São Paulo, BrazilReviewed by:
Mauro Cesar Cafundo Morais, University of São Paulo, BrazilPraveen K. Bharti, National Institute for Research in Tribal Health (ICMR), India
Copyright © 2021 Ford, Alemayehu, Blackburn, Lopez, Dieng, Golassa, Lo and Janies. This is an open-access article distributed under the terms of the Creative Commons Attribution License (CC BY). The use, distribution or reproduction in other forums is permitted, provided the original author(s) and the copyright owner(s) are credited and that the original publication in this journal is cited, in accordance with accepted academic practice. No use, distribution or reproduction is permitted which does not comply with these terms.
*Correspondence: Colby T. Ford, colby.ford@uncc.edu