 Shu-Kai Hsieh
 Yu-Hsiang Tseng
 Da-Chen Lian
 Chi-Wei Wang
- Lab of Ontologies, Language Processing, and E-humanities, Graduate Institute of Linguistics, College of Liberal Arts, National Taiwan University, Taipei, Taiwan
Formosan languages, spoken by the indigenous peoples of Taiwan, have unique roles in the reconstruction of Proto-Austronesian Languages. This paper presents a real-world Formosan language speech dataset, including 144 h of news footage for 16 Formosan languages, and uses self-supervised models to obtain and analyze their speech representations. Among the news footage, 13 h of the validated speech data of Formosan languages are selected, and a language classifier, based on XLSR-53, is trained to classify the 16 Formosan languages with an accuracy of 86%. We extracted and analyzed the speech vector representations learned from the model and compared them with 152 manually coded linguistic typological features. The comparison shows that the speech vectors reflect Formosan languages' phonological and morphological aspects. Furthermore, the speech vectors and linguistic features are used to construct a linguistic phylogeny, and the resulting genealogical grouping corresponds with previous literature. These results suggest that we can investigate the current real-world language usages through the speech model, and the dataset opens a window to look into the Formosan languages in vivo.
1 Introduction
Formosan languages refer to a group of languages spoken by the indigenous peoples of Taiwan with respect to their geographical distribution, all of which are Austronesian languages. The 24 Formosan languages respectively belong to nine subgroups, of which 16 languages, listed in Table 2, are regarded as national languages of Taiwan (Wu et al., 2018). Since most of these currently spoken Formosan languages are extremely fragile or even moribund, we must proactively revitalize these languages.
From the perspective of historical linguistics, Formosan languages also stand out in their role in reconstructing Proto-Austronesian Languages (PAN). Blust (1984) proposes the pulse-pause scenario of the Pacific settlement, in which the Austronesian speakers originated in Taiwan around 5,200 years ago and rapidly spread through the Pacific in a series of expansion pulses and settlement pauses. Past studies propose rich insights into the linguistic phylogeny of Formosan languages through careful analysis of language innovations. However, due to the difficulties of speech data collection and analysis, it is less clear how to approach the phylogenetic questions with real-world data.
We present a real-world dataset of Formosan languages collected from daily news broadcasted over Taiwan's free-to-air channels. The paper is organized as follows: we first summarize the methodology of previous works on the linguistic phylogeny of Formosan languages. Next, the collected speech corpus will be introduced. This corpus includes news footage covering 16 Formosan languages and aims to provide a valuable resource with which researchers can use to study Austronesian languages. Also, to demonstrate one principal value of the dataset, we investigate the relationships among Formosan languages with speech vectors extracted from a deep learning classifier. The language classifier and its implied language phylogeny will be further discussed by analyzing the speech vectors and comparing the learned vectors with manually coded linguistic features.
2 Materials and methods
2.1 Exploring Formosan languages
Studying language families has long been of great interest in historical linguistics. Among language families around the world, Austronesian, which contains more than 1,250 languages and spans across the Indian Ocean into the western Pacific, is the biggest family in the world. The expansion origin of Austronesian is inevitably controversial. Nevertheless, past studies that combine data both from linguistics and archaeology suggest the Formosan languages in Taiwan have played a significant role in Austronesian expansion (Bellwood, 1984; Blust, 1999, 2019; Gray et al., 2009).
Historical linguistics of Formosan languages aims to explore the nature of linguistic relationships, i.e., determining the subgroupings from a phylogenetic context. Different approaches to the phylogeny of Formosan languages have been proposed since the 1930's. Early works such as Asai (1936) classified languages according to features of their phonology, morphology, and lexicon, despite very limited knowledge of Formosan languages at the time and was only based on a general linguistic and anthropological field survey. Later, Dyen (1965) classified the languages via the so-called lexicostatistics method, which assumes that shared retention in the basic vocabulary of different languages would reflect their degree of genetic relationship. Shared cognates in a list of 200 cross-linguistic common words based on the Swadesh list (Swadesh, 1952) was used to calculate the overall similarity.
Moreover, Tsuchida (1975) followed the same lines of thinking as the aforementioned scholars, along with his focus on the reconstruction of historical sound change, especially in Proto-Tsouic phonology, and therefore suggested a revised subgrouping of Formosan languages. At this point it was uncontroversial that Atayalic and Tsouic constituted two main branches of the Formosan language family while the classification of other languages remained debatable. During the 1990's, Starosta (1995) first put forward a grammar-based subgrouping view, suggesting that Rukai should be regarded as one primary branch of Proto-Formosan. Importantly, since then, the status of Formosan languages regarding their subgrouping order within the Austronesian language family has been gradually changed: the notion of “Formosan language” no longer formed a single first-order constituent of Proto-Austronesian (PAN). Instead, all branches which were originally considered second-order constituents of the “Formosan language family” should be promoted as primary branches of PAN. For instance, based on a reconstruction from historical phonology, Blust (1999) proposed a complete classification of Austronesian languages that included 10 primary branches, nine of which were traditional Formosan while the Malayo-Polynesian branch consisted of all Austronesian languages outside Taiwan.
On the other hand, Li (2004, 2006) found further supporting evidence of Blust (1999)'s subgroups and in Li (2008) proposed a modified version of a Formosan language classification based on their phonology, morphology, and grammar. It is worth mentioning that the model in Starosta (1995) is also adopted in this study. As a result, the classification proposed by Li (2008) was time-based, and an equivalence was drawn between the terms “Proto-Formosan” and “PAN.”
Lastly, Sagart (2021) argued that the numerals of Formosan languages, especially for numbers 5 through 10, reflected a spatially nested pattern around Taiwan. Based on the etymologies of the numerals, in addition to the 39 mutually compatible characters which could be categorized as lexical, phonological, and morphological, a numeral-based phylogeny of PAN was proposed. Table 1 briefly summarizes all studies mentioned in this section.
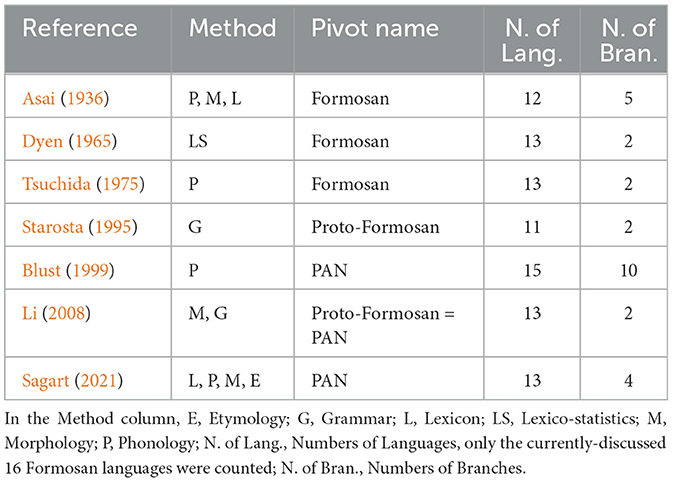
Table 1. A summary table for all studies mentioned above.
Being at the origin of expansion, Formosan languages show great diversity. Studies of Formosan phylogeny follow the cladistic principles, where each tree node is supported by a linguistic innovation, such as phonological, morphological, or basic numeral vocabulary (Ho, 1998; Blust, 1999; Sagart, 2004; Ross, 2012). Another approach to study the relationships among the languages is from structural similarities. These structural features are abstract and were selected to reflect the known linguistic topology in the region. Genealogical groupings are then constructed with computational algorithms, such as maximal parsimony, from their shared structural features (Dunn et al., 2005). However, the structural features are abstract and not all of them are equally prominent in actual usage. Therefore, the similarities implied by the structural features may not directly reflect similarities in real-world use.
2.2 Formosan speech corpus
The collected Formosan speech corpus aims to record the real-world usage of the 16 Formosan languages. The primary data source is from daily news broadcasted over Taiwan's free-to-air channels. A TV tuner connected to an outdoor antenna was used to record the news footage to digital files. News spoken in all 16 Formosan languages provided by the Taiwan Indigenous Television (TITV) channel was captured. Newscasts were chosen for their availability of all Formosan languages and to reduce the variability that can arise from gathering different languages from different programs. Each program is approximately an hour in duration. The corpus comprises 144 h of videos with 9 h for each language's news.
While the news videos serve as an abundant source of information, the interaction among the Formosan languages and Mandarin Chinese in the news provides a unique challenge. Specifically, although the news is broadcasted with a given Formosan language, certain segments still use Mandarin Chinese, like press conferences or interviews. The issue is further complicated because some footage is narrated by the anchor, so there are no consistent visual cues to differentiate the language used in a given video segment. In addition, the Formosan languages are under-resourced, and there are no automatic speech recognition or language identification tools readily available. However, to properly explore the Formosan language in the video, the language used in the segments must at least be tagged.
We address the mixed language problem first with automatic preprocessing, with which we gather primitive data to train a language identification classifier. We first assume the anchor always uses (one of the 16) Formosan languages, and multiple cues in the video frames indicate that the anchor is speaking. We use two sources of information to determine if the frame is an anchor frame. The first source is facial recognition and the second is the headline usually displayed at the lower part of the frame. We first identify the anchor's face from the first 20 s of the video. The anchor is introduced and accompanied by a title card showing their name. We use off-the-shelf face recognition (Geitgey, 2022) and optical text recognition (Jaided, 2022) models to pair the faces and the anchor name. After identifying the anchor's face, we detect in each frame if the anchor appears along with a headline. From these two cues, we determine in five-second intervals, whether the anchor is speaking in a specific segment. The name of the anchor is shown during the broadcast, which we use to identify unique anchors. We also randomly sample from the results to ensure that output is expected. The automatic anchor detection results and the number of different anchors appearing in the news of each language are shown in Table 2. Manually annotated basic information about the anchors are shown in Table 3. From the results we can see that each anchor only speaks one language for the broadcast.
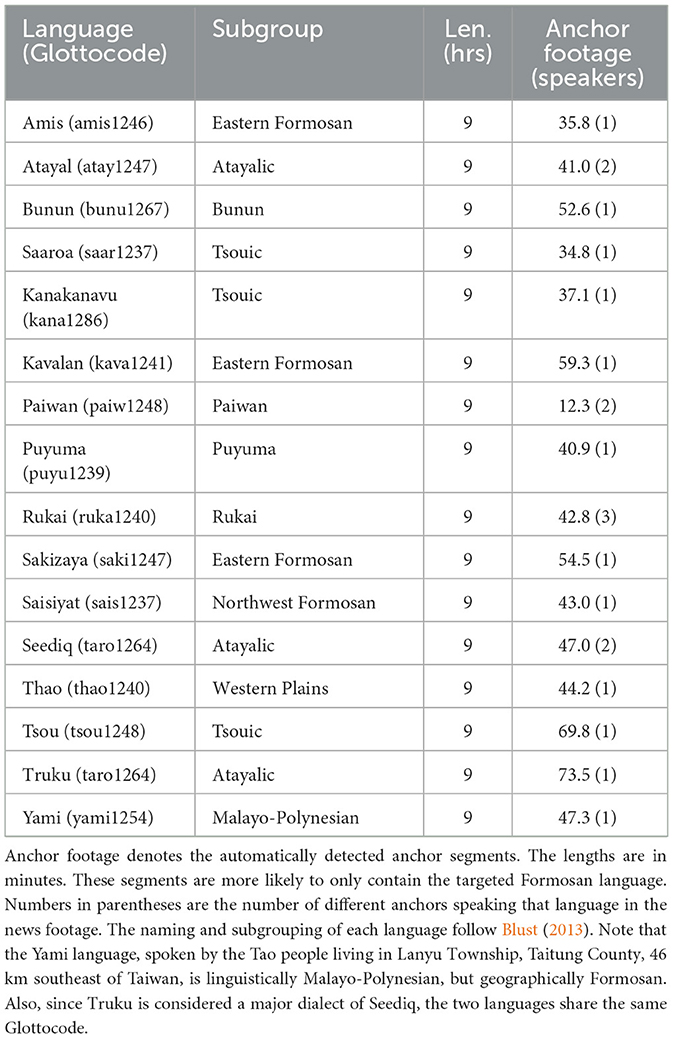
Table 2. Captured video length for each language.
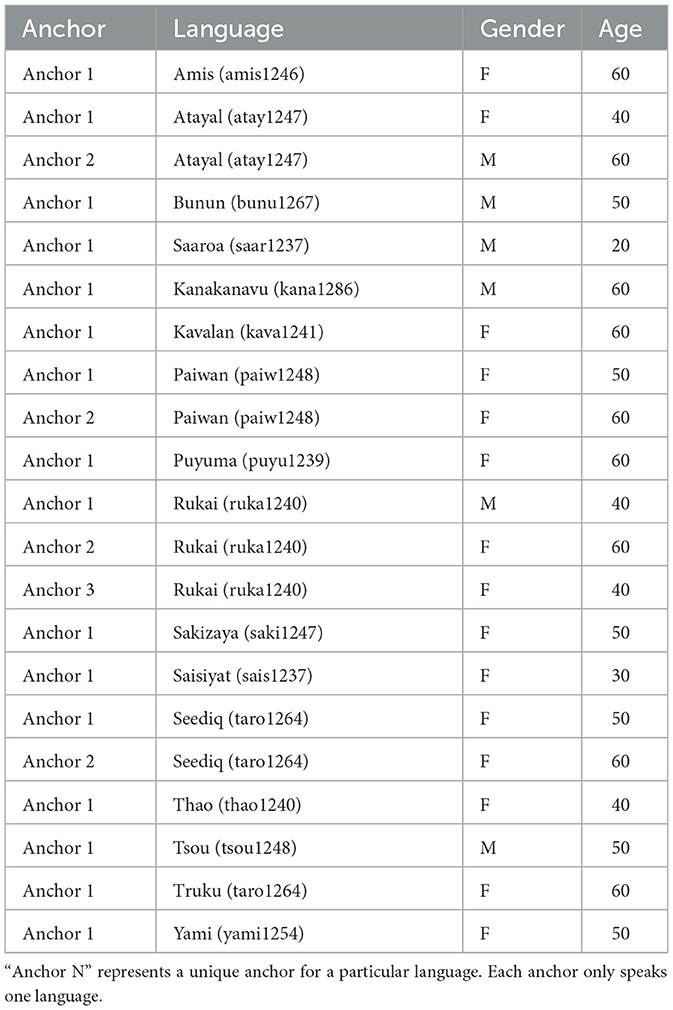
Table 3. Gender and approximate age of the anchors in the dataset.
However, while the detected anchor frames are likely the Formosan languages segments, there will be considerable false negatives in this approach. Segments where the anchor narrates the footage in a Formosan language are inevitably missed with the algorithm described above. This is because the algorithm requires having the anchor's face appear on screen. This algorithm is unable to detect when the anchor is speaking but not actually appearing on screen, thus we are unable to capture these kinds of segments. Therefore, it is still preferable to identify the language with the speech data alone. The trained language classifier not only helps us identify the language, but it also, with computational models, helps us to explore the representations of the underlying speech data.
2.2.1 Classifier training
Recent speech recognition models allow us to work with natural speech data without directly transcribing it. This approach opens up the possibility of examining the real-world usage of Formosan language and studying them systematically. Yan et al. (2021) employs a deep learning feature extraction model based on convolutional neural networks (CNNs) and spectrograms to automatically classify Chinese dialects in a certain region.
When working with audio, the input to a CNN is often a spectrogram, where the X-axis represents time and the Y-axis represents frequency. A CNN is composed for convolution, pooling, and fully connected layers. CNNs employ several kernels (filters) of a particular dimension which are applied to the input by sliding the kernel across the input and performing a dot product (convolution). Each kernel is responsible for detecting different features. The output of these convolutions are called feature maps. Pooling layers are used to reduce the dimension of feature maps. A fully connected layer at the end is used for classification (Papastratis, 2021; Dhanjal and Singh, 2023).
Hartmann (2019) uses deep neural networks to reconstruct the phonetic features of historical sounds based on a language's synchronic phonological features, such as coarticulatory and phonological constraints. Korkut et al. (2020) compare several deep learning methods for spoken language identification. The authors use a hybrid CNN-RNN (CRNNs), X-vectors with feed-forward neural networks (FFNNs), and wav2vec CNNs (Schneider et al., 2019) in a language classification task. They find that the X-vector-based FFNN classifier outperforms the other two models. They also learn that SpecAugment is suitable for language identification data augmentation.
In this study, we leverage speech vectors learned by a language identification model to study the relationships among the Formosan languages. In our first experiment, we train a Formosan language classifier based on the wav2vec 2.0 (Baevski et al., 2020) model architecture and the pre-trained weights of XLSR (Conneau et al., 2021) with gradient reversal (Ganin and Lempitsky, 2015) to mitigate the confounding effect that a speaker of a language themself may have on the language classifier.
2.2.1.1 wav2vec 2.0
Using self-supervised learning, wav2vec 2.0 has produced state-of-the-art results in speech recognition. In this architecture, raw audio X that is normalized to zero mean and unit variance is fed into a multi-layer convolutional feature encoder f:X ↦ Z that outputs latent speech representations z1, ...zT for T time-steps to a low frequency representation. Next, they are fed into a Transformer-based (Vaswani et al., 2017) network g:Z ↦ C to build contextualized representations c1, ..., cT that capture information across the entire audio sequence. Product quantization (Jegou et al., 2010) is then used to transform the output of the feature encoder z into a finite set of speech representations. This process can be seen as choosing entries from G codebooks and concatenating them. Pre-training is done by solving a contrastive learning problem Lm. A certain proportion of time steps in the latent feature encoder space is masked and the model must predict the correct quantized latent audio representation among a set of distractors that are sampled from the same utterance. A diversity loss Ld is also introduced to encourage equal use of the entries in each of the G codebooks. The final loss function is thus: L = Lm+αLd where α is a tuned parameter. The speech representations learned from pre-training can then be used for down-stream tasks.
2.2.1.2 XLSR
Built on wav2vec 2.0, XLSR is a multilingual speech recognition model which jointly learns a quantization of the latents shared across languages and learns to share discrete tokens across languages. We leverage the XLSR model to take advantage of it having already been pretrained on 53 different languages. Although these languages may be significantly different from the Formosan languages, it may be possible for the model to transfer regularities across languages. Figure 1 illustrates the framework. The left side is wav2vec 2.0. An explanation of how it works can be found in the previous section. The right side is a diagram of latent speech representations that are learned through training. We can see that the representations are shared across several languages, which makes this model suitable for representing Formosan languages.
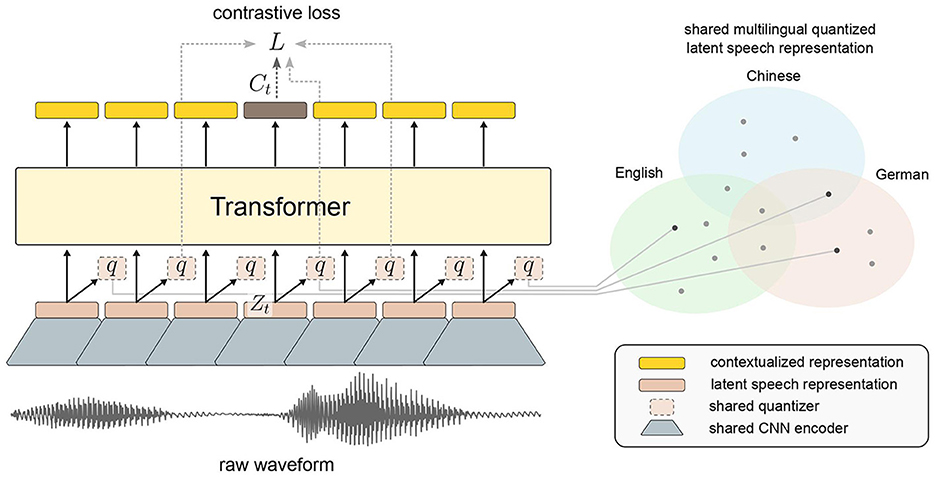
Figure 1. wav2vec 2.0—XLSR approach used in our experiment. The shared quantization module over feature encoder representations produces the embeddings, which are the targets for the Transformer trained with contrastive learning [image by author, based on Conneau et al. (2021)].
2.2.1.3 Gradient reversal
We use gradient reversal to encourage the classifier to focus on the features of the languages and not on idiosyncrasies specific to the anchors. Given two anchors (or even one) that speak the same language, the anchors can be seen as “domains” that change even if the language spoken is the same. Both speakers are considered different domains because the way the same language is spoken is influenced by their idiosyncrasies, such as pitch and speaking speed. When two people speak the same language, While the language stays the same, how it is realized is different and so it affects how the language is represented. This difference in representations can be seen as two different “domains.”
This is similar to number classification using different datasets that represent numbers differently, such as MNIST (Lecun et al., 1998) or SVHN (Netzer et al., 2011). The underlying numbers are common across the datasets in that both contain images of numbers from 0 to 9, but the representation of the numbers is different in each dataset. Specifically, MNIST is a collection of handwritten digits that are in black and white. On the other hand, SVHN is a collection of printed digits from pictures of house number plates. In this case, how the numbers are represented differently create two different domains (MNIST: handwritten, black and white, etc. vs. SVHN: colored, printed, different angles, etc.). Gradient reversal allows us to obtain domain-invariant features.
Besides the wav2vec 2.0 feature encoder with parameters θf and a language classifier with parameters θy that predicts the language given a feature vector, we also have an anchor classifier with parameters θd that predicts an anchor given the same feature vector. During training, we seek parameters for θf that maximize the loss of the anchor classifier but that are also discriminative (minimizes the language classifier loss). At the same time, we are also seeking parameters for the anchor classifier θd that minimize anchor classification loss.
The parameters are updated through backpropagation as can be seen from Equations 1–3 that are found in the original paper in Section 3.2 (Ganin and Lempitsky, 2015):
where μ is the learning rate, is the language classification cross entropy loss for a training example i, is the anchor classification cross entropy loss for a training example i, and λ is a tunable parameter that controls the trade-off between the two objectives. Gradient reversal is implemented using a gradient reversal layer (GRL) that is placed between the wav2vec 2.0 feature encoder and the anchor classifier. During a forward pass, GRL acts as an identity transform. During backpropagation, GRL multiplies the gradient received from the anchor classifier layer by −λ before passing it to the feature encoder. This causes the feature encoder's parameters to be updated in such a way that the anchors are harder to identify.
2.2.1.4 Training data
The training data are the anchor segments automatically identified in the preprocessing stage. Among the 144 h of speech data, 792.75 min of audio data are included in the dataset. In addition to the 16 Formosan languages, we add an other category, which is randomly sampled from the “not-anchor” video segments. The other category serves as a control for the potential idiosyncrasies in each video and prevent the model from classifying languages based on the video's surface features. Finally, we split the dataset so that every language is equally represented in the test data. That is, each language is represented with a video set aside for testing (113.8 min) while the rest are left for training (678.95 min).
2.2.1.5 Training details
We use the Transformers (Wolf et al., 2020) implementation of wav2vec 2.0 that is initialized from a pretrained XLSR checkpoint1. Language classification and anchor classification is fine-tuned from this checkpoint. The language classifier is a fully-connected layer stacked upon the vector output of the wav2vec 2.0 feature encoder model. The anchor classifier is also a fully-connected layer stacked upon the wav2vec 2.0 feature encoder model. The parameters are optimized using AdamW with a learning rate warming up to a peak of 10−3 in the first 200 steps and decreased to 0 with a half-cycle cosine scheduling. We use cross entropy as our loss function. We use a batch size of 16 and train for a maximum of 10 epochs, only saving a checkpoint if accuracy increases on the test set. We use an open-source implementation of gradient reversal (Tadeephuy, 2023). λ is set to a constant 1 during training. We use PyTorch Lightning to organize our code (Falcon and The PyTorch Lightning team, 2019). Model training took 2 h on an NVIDIA A5000 GPU. We use the ninth epoch checkpoint for the results and analysis in the forthcoming sections.
3 Results
As can be seen in Table 4, the language classification model achieved an overall accuracy of 86% across 17 categories (16 languages and the other category), and the anchor classification accuracy in the gradient reversal setting is 70% in the testing set. It is noteworthy that the anchors and the languages are partially confounded in the dataset (as shown in Table 2). The anchor identities may not be entirely partialled out even with using gradient reversal. However, the language classification accuracy shows that the model indeed can identify different Formosan languages. The overall classification results show that the languages with only one anchor do not necessarily have better performances than those with multiple anchors. That is, the anchor identities may not directly influence the classifier.
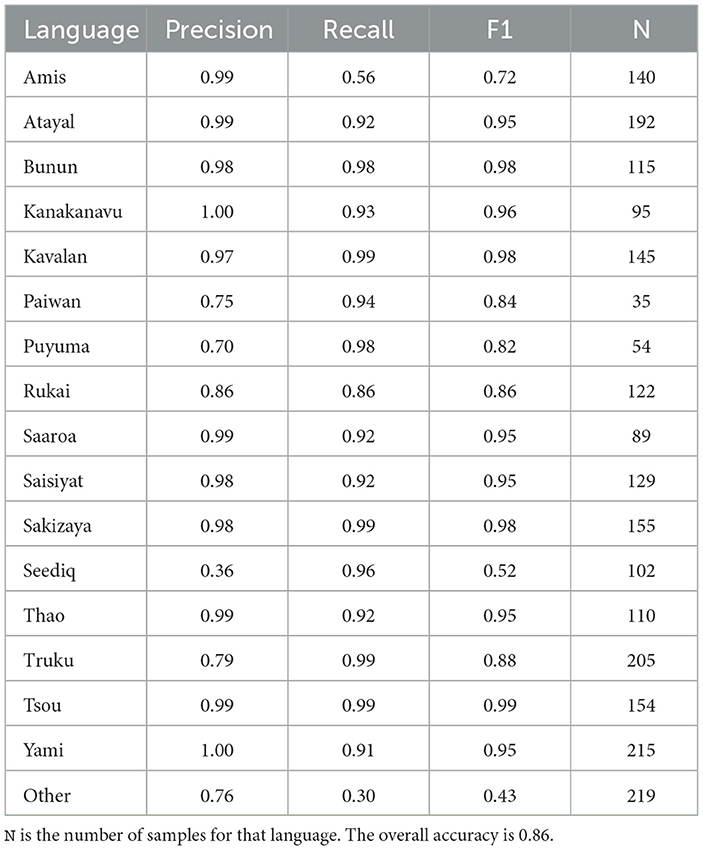
Table 4. Classification results for each of the 16 languages and the “Other” category.
Besides the classifier having the practical value of helping identify relevant segments in the dataset, the self-supervised nature of wav2vec 2.0 provides us with a unique opportunity to explore how these languages are related to each other in this formalized vector space. When the model is only trained on the speech signal, it should particularly shed light on the phonological or phonetic relationships among these languages.
4 Discussion
4.1 Exploratory analysis of speech vectors
The fine-tuned language classification model successfully differentiates the language of a specific speech segment. From the perspective of speech representation, it is interesting to explore the language similarities implied by these speech vectors. The idea is consistent with the findings from other domains of deep learning application in that the model representation may reflect the intrinsic structure underlying the data, such as the word analogy relations that emerge naturally from the vector representations learned from a skip-gram or a CBOW model (Mikolov et al., 2013), or how a Transformer-based language model also implicitly reflects syntactic relations in sentences (Manning et al., 2020).
wav2vec is in a way similar to word embeddings, with the main difference being that wav2vec processes audio instead of text. To compute the language similarities among these 16 languages, we first extract the speech vector representation of each segment from the wav2vec model; that is, the 1,024-dimension vector before it is fed into the final classifier. These 1,024 dimensional vectors are assumed to carry various information, and only some of which are the ones used in language classification. We thus simplify the vector with a linear dimension reduction model (i.e., PCA) into five dimensions. Next, we find the median points, or the medoids, in each language to represent the speech segments of that language. The low dimensional projection of each speech segment is shown in Figure 2, using both PCA (A) and UMAP (B) (McInnes et al., 2018). Each point is a speech segment that is correctly classified by the model. The first five principal components explain 54% of variance in the original dimensions. The overall patterns of the speech segment projections show clear groupings of each language.
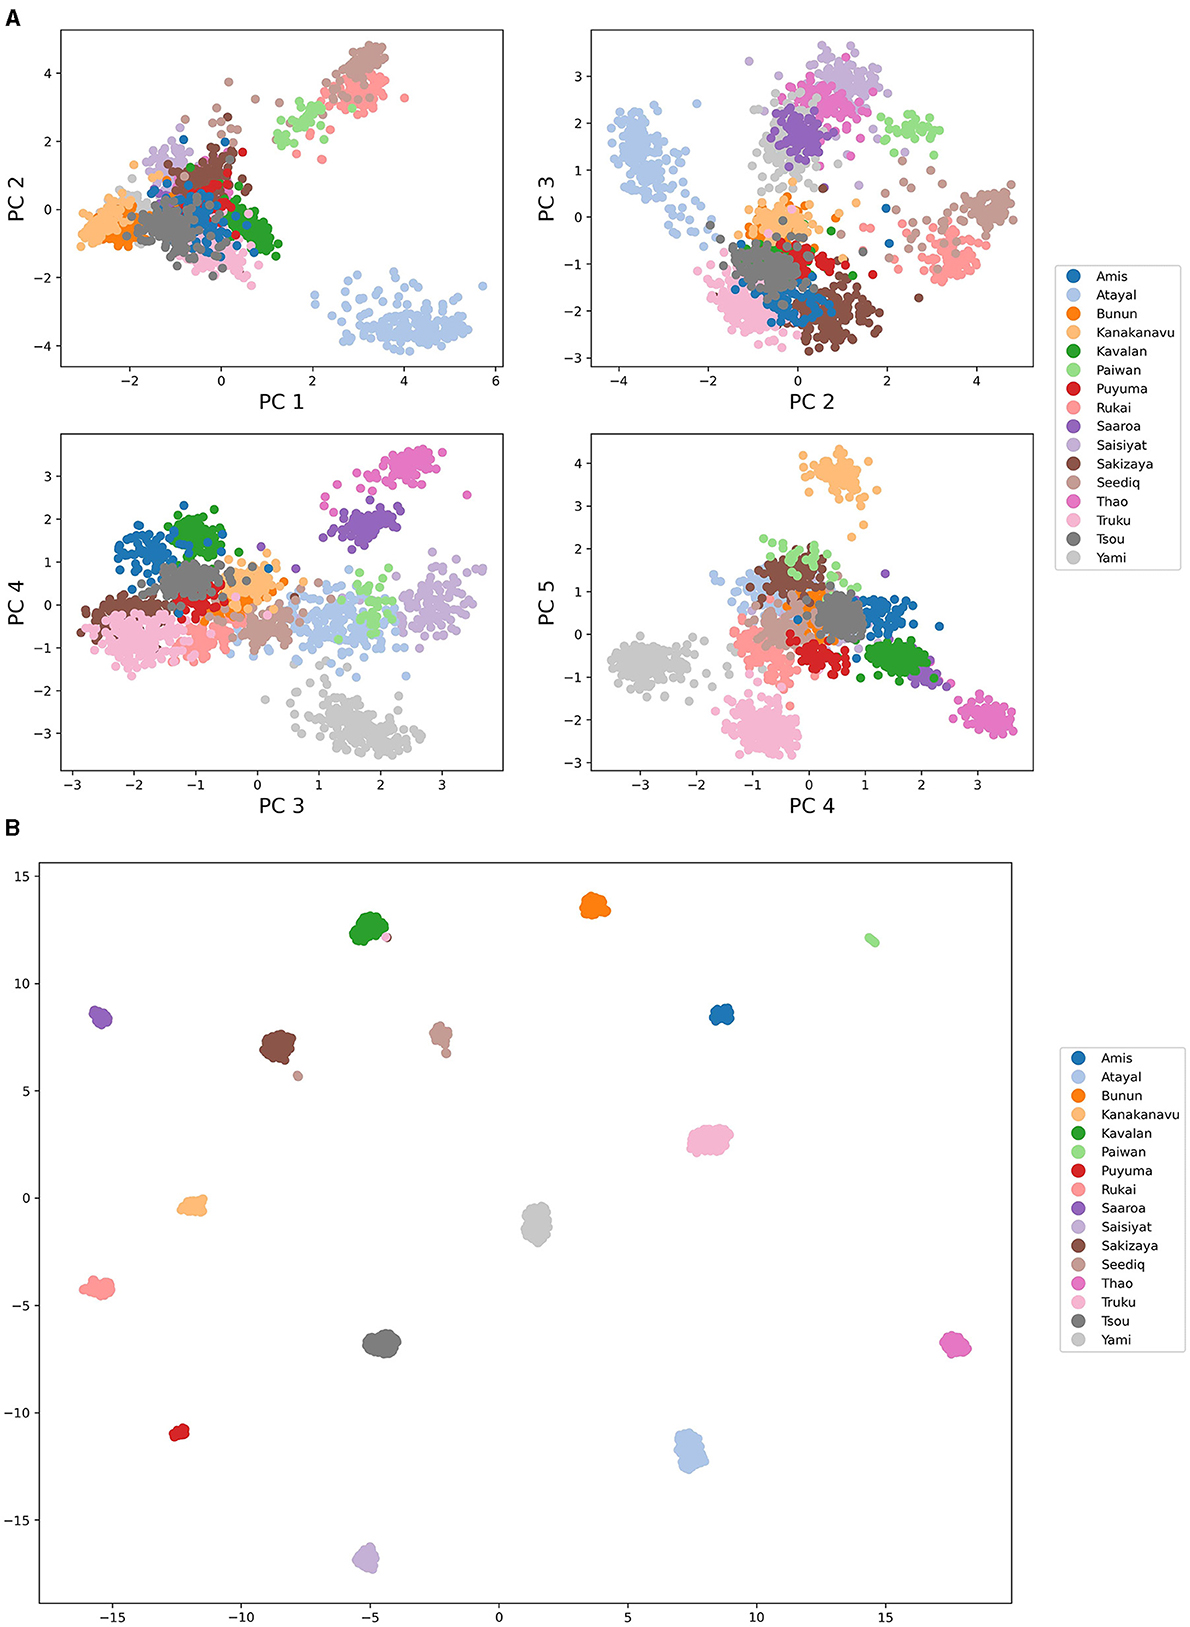
Figure 2. (A) Speech vector PCA projections using pairwise PC-dimension plots. (B) Speech vectors projected onto two dimensions using UMAP with 15 neighbors.
We then assume the speech vector also implies the relations among these 16 languages. To further explore the possible relations, we find the median point for each language, the medoid, which serve as the representative point of that language in the space. The 16 medoids are then clustered with the hierarchical agglomerative algorithm using complete linkage. The clustering result, as shown in Figure 3, interestingly reflects parts of geographical relations among languages, such as Tsou and Kanakanavu, both of which are spoken in central Taiwan; and Atayal, Seediq, and Thao, which are in northern Taiwan.
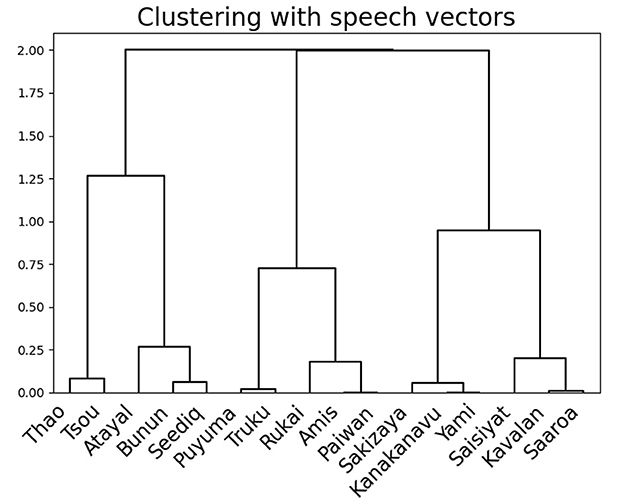
Figure 3. Clustering results using the speech vectors for all 16 languages.
One way to interpret the clustering is that it reflects a snapshot of the current language environment. However, it is open for discussion that there are several possibilities in how the model treats two languages as similar in these vectors: such as geographical closeness, phonetic, morphological, or syntactic relations. Therefore, we further explore the representations of these speech vectors with human annotations in a correlational similarity study.
In the following section, we manually coded a set of linguistic typological features of the 16 Formosan languages based on field knowledge of domain experts. We then compare the language similarities implied by these typological features to the ones computed by the speech vectors, and connect the correlations to the investigation of language phylogenies of Formosan languages.
4.2 Formosan linguistic phylogeny
As mentioned in the Exploring Formosan Languages section, the “Austronesian homeland” hypothesis and related studies on Proto-Formosan have been supported mostly by lexical data and other archaeological evidence (Greenhill et al., 2010). In fact, there are many other algorithmic methods that have been proposed and tested in phylogenetic linguistics in previous years (Dunn, 2015). In addition to a collection of expert cognate judgments [cf. survey in Dunn et al. (2005), Jäger (2018)] demonstrated that it is also possible to probe the linguistic phylogeny by using non-lexical grammatical traits/features.
4.3 Features coding
There have been many linguistic feature systems proposed before, which often serve as a theoretical device to represent the categorical difference between two linguistic units/sounds that can contrast in language. To explore the extent to which a feature system is minimally sufficient to distinguish all the sounds in Formosan languages, we follow the tenets proposed by Duanmu (2016) that (1) the number of features is small, (2) all features are binary (so that they represent a minimal contrast between two units/sounds), and (3) features can be compared across languages.
It is noted that the contrast-based definition of features can be used not only to distinguish sounds, but also to distinguish other grammatical traits distributed among taxonomic units in languages. Our first effort involves a manual encoding by starting with Dunn et al. (2005)'s coding scheme. The completed data matrix now contains data from 16 taxa (i.e., languages, or leaves of the phylogenetic tree) encoded with 152 linguistic typological binary features (manually encoded based on a series of Reference Grammar books by a group of prestigious Formosan linguists with field experience in each language) (Wu et al., 2018), including grammatical traits, such as word order (order of noun phrase elements and verb), pronominals, demonstratives, noun formation and verb formation, numerals and the counting system, adjectives, syntactic roles of noun phrases, the verb complex, TAM (tense, aspect, and mood), core and oblique participants, as well as phonological ones, such as voicing, places and manners of articulation, etc. These structural features are coded for their presence or absence in each of the target 16 languages.
4.4 Language features and speech vectors
The coded language features imply language similarities/genealogical relations among Formosan languages, which we can compare to those implied by speech vectors. The comparison also sheds light on the nature of representations learned automatically with the deep learning model. Specifically, suppose the language similarities are consistent with a set of language features, e.g., phonological ones. In that case, we could infer that the learned speech vector representations encode phonological aspects of those languages.
We first partition the 152 features into three categories: phonological, morphological, and syntactical features. Features all coded as ones and zeros are excluded from further analysis. This leaves 120 features included in this analysis—56 phonological ones, 43 morphological, and 21 syntactical. Among the phonological features, we further distinguish 10 vowel-related features, 46 consonant-related ones, 22 sonorants, and 31 obstruent features. Note that not all phonological features could be classified as sonorant or obstruent, such as syllable-level features (e.g., phonemic stress or consonant clusters). For each feature category, we constructed a correlation matrix from the feature encoding. As a result, eight language correlation matrices are made from eight feature categories, respectively (i.e., All, Phonology, Vowel, Consonant, Sonorant, Obstruent, Morphology, and Syntax).
We compare the language feature-derived correlation matrices and the speech vector-derived matrices with Spearman's rank correlation coefficients (rs). Specifically, the lower triangles of each correlation matrix are extracted and flattened as vectors, from which we computed rs. However, as the data vectors come from a correlation matrix, it is unclear whether the standard inferential statistics apply. Therefore, we bootstrap the speech vectors to infer a confidence interval. Each bootstrap sample comprises 50% of correctly classified sequences in each language. We computed the medoids (following the same procedure as in the Exploratory Analysis of Speech Vector section of each language, from which we derived the correlation matrix of this particular bootstrap sample. For each bootstrapped speech vector-derived correlation, we compute one rs with the language feature-derived correlation. From 100 bootstrapped samples, we calculate the mean, 5% (Q05), and 95% (Q95) quantiles of rs. The same bootstrapping procedures are repeated for the random feature controls, where values in each feature are randomly permuted. The goal of this permutation is to generate a random baseline where the language features provide no information on the language similarities.
Results are shown in Figure 4. First, the speech vector-derived language similarities are consistent with the ones derived from language features, as seen by the non-overlapping confidence intervals computed from the actual samples (blue) and the random baseline (gray). This pattern persists into the phonological feature categories. Most notably, the obstruent feature category shows the most significant difference 0.12, and the sonorant has the smallest one at 0.06.
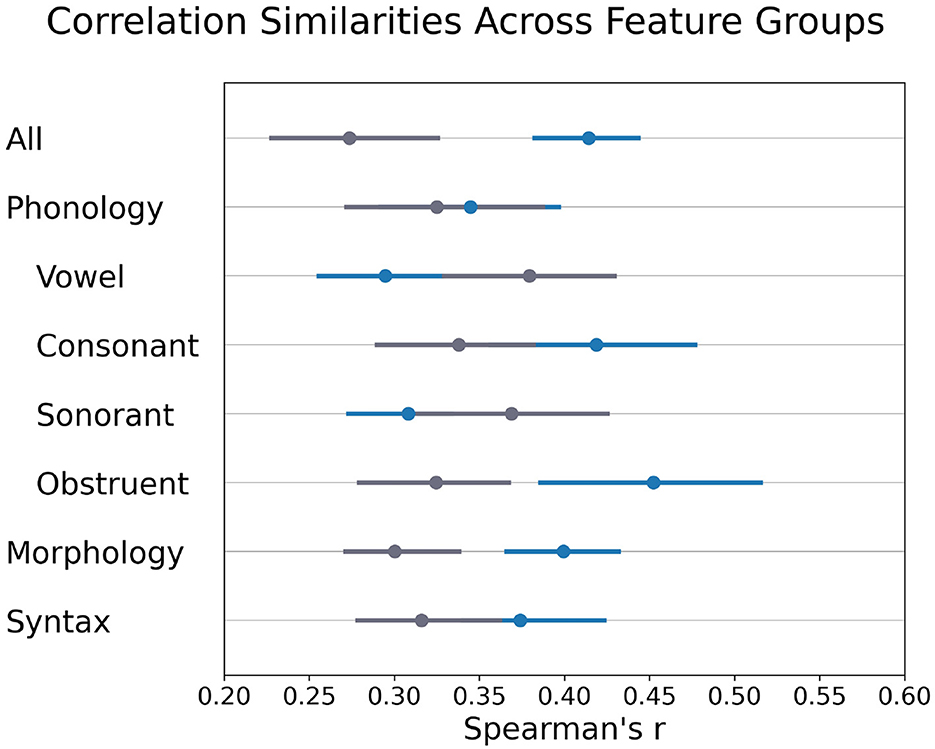
Figure 4. Correlation similarities across different feature categories. The blue segments indicate the similarities between the correlations of Formosan languages implied by the speech vectors and the one implied by feature categories. The gray segments show the similarity scores under a random baseline. The line intervals indicate the bootstrapped confidence interval (Q05–Q95).
Interestingly, the difference is still significant in the morphological category but not in the syntax category. These findings show that the model does capture language-relevant aspects from the audio stream, not just superficial acoustic features (e.g., anchors' voice characteristics). The significant difference in the morphological category also suggests that, while the data is speech only, it does not prevent the model from learning morphological information from the audio sequence. In contrast, the syntactic features do not play a role in speech vectors. Possible explanations may include the insufficient number of features in syntactic categories or the nature of language identification tasks that prevent the model from learning such long-ranged features.
The language feature analysis clearly shows that speech vectors encode phonological, even morphological aspects of Formosan languages. However, it is still unclear how these language features relate to the Formosan language similarities, or linguistic phylogenies, in the literature. Therefore, we use our coded linguistic features to proceed with linguistic phylogenetic inferences.
4.5 Linguistic phylogenetic inferences
The comparison between speech vectors and linguistic features reveals significant similarities. It also shows the speech vectors, unsurprisingly, tend to capture the phonological aspects of languages. However, it is not clear whether the coded linguistic features really reflect, or are consistent with the Formosan phylogeny found in literature. Therefore, we construct a Formosan phylogeny from our linguistic features.
We used 61 phonological features in the following phylogenetic inferences. These phonological features account for most of our linguistic features and are the most significant ones in the correlational similarity study. In addition, as they relied more on phonological innovation to infer the subgroupings of Formosan languages, using phonological features provides a better comparison with past studies.
First, we consider divisive clustering based on the features, as shown in Figure 5. However, the dendrogram obtained does not fit well with previous reconstruction proposals (Starosta, 1995; Li, 2006; Blust, 2013). It is unclear how accurate and robust the phylogenetic estimates of Austronesian language relationships are, and whether these clusterings have any linguistic phylogenetic implications.
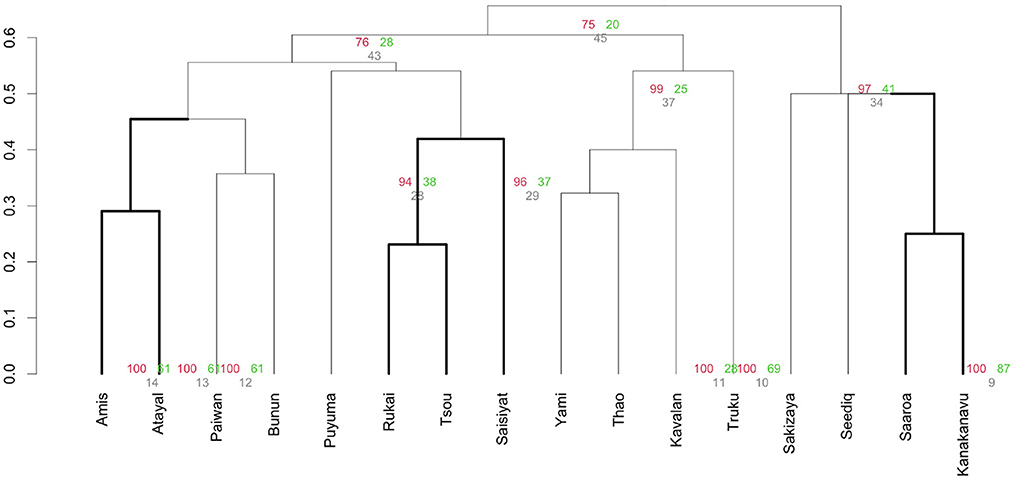
Figure 5. Dendrogram with AU/BP values (%) of divisive hierarchical clustering of 61 phonological features for Austronesian languages in Taiwan. Red: AU (approximately unbiased) p-value; green: BP (bootstrap probability) p-value; gray: SI (Selective inference) p-value.
Since the binary-coded features allow us to apply cladistic algorithms to determine potential phylogenetic relationships hidden behind them, we then turn to a computational phylogenetic method called neighbor-joining algorithm (NJ; Saitou and Nei, 1987) to create a phylogenetic tree without a defined root. The NJ method is a distance-based method which constructs a phylogenetic tree from the data by converting the aligned sequences or pairs of taxa (i.e., the basic unit of comparison) into a matrix of pairwise distances between the sequence/data. The assumption of an unrooted tree has its advantage in not presuming information about the temporal sequence of lineage-splitting events. Figure 6 shows the resulting unrooted tree. The tree presented in (A) shows that the unrooted phylogenetic tree groups languages according to their geographical region, indicated by different font styles (e.g., bold and italics). Interestingly, the tree mostly corresponds to the less controversial hypothesis introduced in Table 1. For instance, Tsou is recognized as being on the primary branches (with its position right after the first offshoot), with Kanakanavu and Saaroa further split in the Tsuoic branch. In addition, the geographical distribution of Bunun is adjacent to that of the three Tsouic languages, which makes this particular clade more reasonable. Also, both Atayal and Truku belong to the Atayalic language subgroup, and both Rukai and Puyuma are spoken in Southern Taiwan.
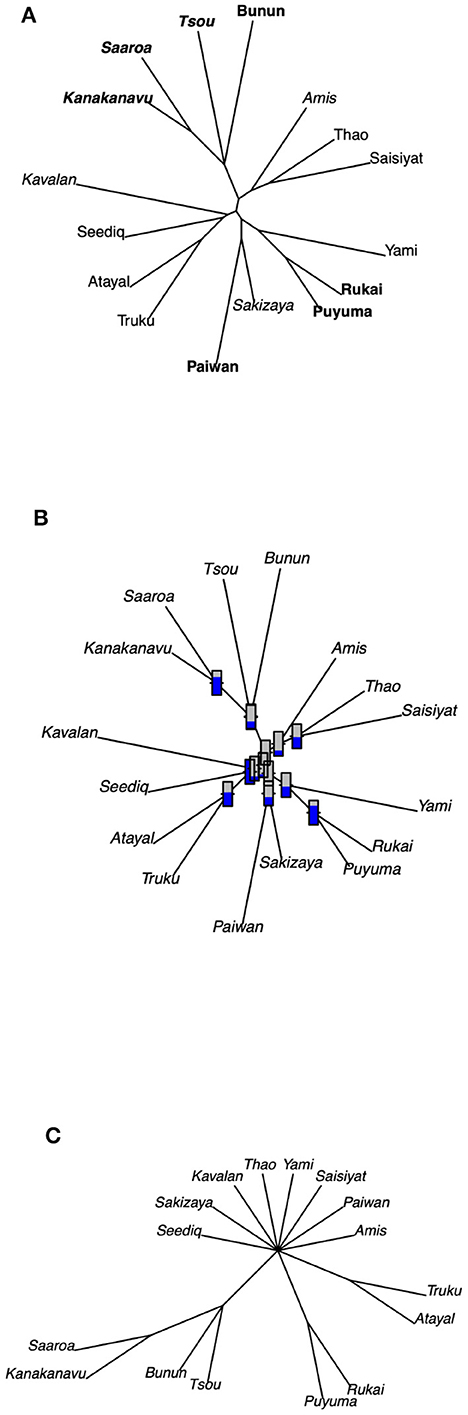
Figure 6. (A) The geographical information is represented by fonts. Plain: Northern (except for Yami); bold: Southern; italics: Eastern; bold italics: Central/Tsouic. (B) Validation of clustering using the bootstrap method. (C) Consensus tree from 200 bootstrap runs.
To validate the results of our cluster analysis, the bootstrap method is applied to the present data. The data is sampled with replacement for 200 bootstrap runs. In each sampling run, the distance matrix is calculated to further yield the unrooted tree with the NJ algorithm. We compare the resulting dendrograms from the bootstrap samples with the original one and calculate the proportions of bootstrapped dendrograms that support the subtrees in the original tree. The proportion of support for different subtrees is shown in (B) with a thermometer symbol attached to each clade, in which a higher temperature indicates a greater proportion of support. Another way to approach a more validated tree is to use the consensus tree (C), where the subgroups that are not observed in all bootstrap trees are collapsed. In a consensus tree, if a subgroup does not occur in all bootstrap trees, then this subgroup will not be adopted. Here we use the ape package developed by Paradis et al. (2004) to implement the calculations of the consensus tree. The result is shown in (C) and also shows correspondence with previous literature, where most of the Formosan languages are claimed to be primary/higher order subgroups.
5 Conclusion
In this paper, we present a Formosan Speech Corpus of 16 Formosan languages with 144 h of speech data collected from news broadcasts in Taiwan. Based on the corpus, we provide two perspectives on Formosan linguistic phylogenetic studies: a speech vector approach using a wav2vec 2.0-based deep learning model and expert coding with linguistic typological features. The speech vector approach is more data-driven, as it is based on the usage aspect of speech data. The speech representation is trained through a language classification task. The model achieves an overall classification accuracy of 86%. Moreover, correlational similarities analysis shows that the extracted speech vector representations echo significant phonological and morphological information from manually curated encoded features in expert judgements. A further look into these correlated typological language features reveals the phylogenetic trees correspond well with previous theories.
Overall, this paper tries to approach the Formosan language similarities through a lens guided by model-learned representation from real-world data and linguistic typological features. The findings reveal that the information embedded in the speech vector representation can be used for language identification and linguistic phylogenetic inferences. Future works include how to interpret the language similarities implied by the speech vectors and further explore the multimodal nature of the dataset. This paper, along with its dataset, is expected to help in the exploration of linguistic phylogeny and with actual usage patterns in the current language environment.
Data availability statement
The datasets presented in this study can be found in online repositories. The names of the repository/repositories and accession number(s) can be found in the article/Supplementary material.
Author contributions
S-KH: Conceptualization, Formal analysis, Methodology, Project administration, Supervision, Visualization, Writing - original draft, Writing - review & editing. Y-HT: Conceptualization, Data curation, Formal analysis, Investigation, Methodology, Software, Validation, Visualization, Writing - original draft, Writing - review & editing. D-CL: Data curation, Investigation, Methodology, Software, Visualization, Writing - original draft, Writing - review & editing. C-WW: Data curation, Formal analysis, Investigation, Methodology, Software, Visualization, Writing - original draft, Writing - review & editing.
Funding
The author(s) declare that no financial support was received for the research, authorship, and/or publication of this article.
Conflict of interest
The authors declare that the research was conducted in the absence of any commercial or financial relationships that could be construed as a potential conflict of interest.
Publisher's note
All claims expressed in this article are solely those of the authors and do not necessarily represent those of their affiliated organizations, or those of the publisher, the editors and the reviewers. Any product that may be evaluated in this article, or claim that may be made by its manufacturer, is not guaranteed or endorsed by the publisher.
Supplementary material
The Supplementary Material for this article can be found online at: https://www.frontiersin.org/articles/10.3389/flang.2024.1338684/full#supplementary-material
Footnotes
References
Asai, E. (1936). A Study of the Yami Language: An Indonesian Language Spoken on Botel Tobago Island. Alexandria, VA: J. Ginsberg.
Baevski, A., Zhou, Y., Mohamed, A., and Auli, M. (2020). wav2vec 2.0: a framework for self-supervised learning of speech representations. Adv. Neural Inform. Process. Syst. 33, 12449–12460. doi: 10.48550/arXiv.2006.11477
Blust, R. (1999). “Subgrouping, circularity and extinction: some issues in austronesian comparative linguistics,” in Selected Papers From the Eighth International Conference on Austronesian Linguistics (Taipei), 31–94.
Blust, R. (2013). The Austronesian Languages (Revised Edition). Canberra, ACT: Australian National University.
Blust, R. (2019). The austronesian homeland and dispersal. Ann. Rev. Linguist. 5, 417–434. doi: 10.1146/annurev-linguistics-011718-012440
Conneau, A., Baevski, A., Collobert, R., Mohamed, A., and Auli, M. (2021). “Unsupervised cross-lingual representation learning for speech recognition,” in Proceedings of Interspeech 2021 (Brno), 2426–2430.
Dhanjal, A. S., and Singh, W. (2023). A comprehensive survey on automatic speech recognition using neural networks. Multimed. Tool. Appl. 23, 1–46. doi: 10.1007/s11042-023-16438-y
Dunn, M. (2015). “Language phylogenies,” in The Routledge Handbook of Historical Linguistics, eds C. Bowern and B. Evans (London: Routledge), 190–211.
Dunn, M., Terrill, A., Reesink, G., Foley, R. A., and Levinson, S. C. (2005). Structural phylogenetics and the reconstruction of ancient language history. Science 309, 2072–2075. doi: 10.1126/science.1114615
Dyen, I. (1965). A Lexicostatistical Classification of the Austronesian Languages. Baltimore, MD: Waverly Press.
Falcon W. The PyTorch Lightning team (2019). PyTorch Lightning. Available online at: https://github.com/Lightning-AI/pytorch-lightning (accessed December 20, 2022).
Ganin, Y., and Lempitsky, V. (2015). “Unsupervised domain adaptation by backpropagation,” in 32nd International Conference on Machine Learning (ICML 2015) (Lille), 1180–1189.
Geitgey, A. (2022). Face_Recognition. Available online at: https://github.com/ageitgey/face_recognition/ (accessed December 20, 2022).
Gray, R. D., Drummond, A. J., and Greenhill, S. J. (2009). Language phylogenies reveal expansion pulses and pauses in pacific settlement. Science 323, 479–483. doi: 10.1126/science.1166858
Greenhill, S. J., Drummond, A. J., and Gray, R. D. (2010). How accurate and robust are the phylogenetic estimates of austronesian language relationships? PLoS ONE 5, 1–6. doi: 10.1371/journal.pone.0009573
Hartmann, F. (2019). “Predicting historical phonetic features using deep neural networks: a case study of the phonetic system of proto-indo-european,” in Proceedings of the 1st International Workshop on Computational Approaches to Historical Language Change (Florence), 98–108.
Ho, D. (1998). Taiwan nandaoyu de yuyan guanxi [genetic relationships among the formosan languages]. Chin. Stud. 16, 141–171.
Jäger, G. (2018). Global-scale phylogenetic linguistic inference from lexical resources. Sci. Data 5, 1–16. doi: 10.1038/sdata.2018.189
Jaided, A. I. (2022). Easyocr. Available online at: https://github.com/JaidedAI/EasyOCR (accessed December 20, 2022).
Jegou, H., Douze, M., and Schmid, C. (2010). Product quantization for nearest neighbor search. IEEE Trans. Pat. Anal. Machine Intell. 33, 117–128. doi: 10.1109/TPAMI.2010.57
Korkut, C., Haznedaroglu, A., and Arslan, L. (2020). “Comparison of deep learning methods for spoken language identification,” in Proceedings of the 22nd International Conference (SPECOM 2020), (St. Petersburg), 223–231.
Lecun, Y., Bottou, L., Bengio, Y., and Haffner, P. (1998). Gradient-based learning applied to document recognition. Proc. IEEE 86, 2278–2324.
Li, P. J.-k. (2004). Origins of the east formosans: Basay, Kavalan, Amis, and Siraya. Lang. Linguist. 5, 363–376. Available online at: http://ir.sinica.edu.tw/handle/201000000A/56966 (accessed July 13, 2022).
Li, P. J.-k. (2006). “The internal relationships of formosan languages,” in 10th International Conference on Austronesian Linguistics (10-ICAL) (Palawan), 17–20.
Li, P. J.-k. (2008). “Time perspective of formosan aborigines,” in Past Human Migrations in East Asia, eds A. Sanchez-Mazas, R. Blench, M. D. Ross, I. Peiros, and M. Lin (London: Routledge), 243–250.
Manning, C. D., Clark, K., Hewitt, J., Khandelwal, U., and Levy, O. (2020). Emergent linguistic structure in artificial neural networks trained by self-supervision. Proc. Natl. Acad. Sci. U. S. A. 117, 30046–30054. doi: 10.1073/pnas.1907367117
McInnes, L., Healy, J., Saul, N., and Grossberger, L. (2018). Umap: uniform manifold approximation and projection. J. Open Source Softw. 3:861. doi: 10.21105/joss.00861
Mikolov, T., Sutskever, I., Chen, K., Corrado, G. S., and Dean, J. (2013). Distributed representations of words and phrases and their compositionality. Adv. Neural. Inform. Process. Syst. 26, 3136–3144. doi: 10.48550/arXiv.1310.4546
Netzer, Y., Wang, T., Coates, A., Bissacco, A., Wu, B., and Ng, A. Y. (2011). “Reading digits in natural images with unsupervised feature learning,” in NIPS Workshop on Deep Learning and Unsupervised Feature Learning 2011 (Granada), 1–9.
Papastratis, I. (2021). Speech Recognition: a Review of the Different Deep Learning Approaches. Available online at: https://theaisummer.com/ (accessed December 18, 2022).
Paradis, E., Claude, J., and Strimmer, K. (2004). Ape: analyses of phylogenetics and evolution in r language. Bioinformatics 20, 289–290. doi: 10.1093/bioinformatics/btg412
Ross, M. (2012). In defense of nuclear austronesian (and against tsouic). Lang. Linguist. 13, 1253–1330. Available online at: http://hdl.handle.net/1885/69808 (accessed July 13, 2022).
Sagart, L. (2004). The higher phylogeny of austronesian and the position of tai-kadai. Ocean. Linguist. 43, 411–444. doi: 10.1353/ol.2005.0012
Sagart, L. (2021). “A more detailed early austronesian phylogeny,” in 15th International Conference on Austronesian Linguistics (15-ICAL) (Olomouc), 1–38.
Saitou, N., and Nei, M. (1987). The neighbor-joining method: a new method for reconstructing phylogenetic trees. Mol. Biol. Evol. 4, 406–425.
Schneider, S., Baevski, A., Collobert, R., and Auli, M. (2019). “wav2vec: unsupervised pre-training for speech recognition,” in Proceedings of Interspeech 2019 (Graz), 3465–3469.
Starosta, S. (1995). A grammatical subgrouping of formosan languages. Austron. Stud. Relat. Taiwan 1995, 683–726.
Swadesh, M. (1952). Lexico-statistic dating of prehistoric ethnic contacts: with special reference to north american indians and eskimos. Proc. Am. Philos. Soc. 96, 452–463.
Tadeephuy (2023). Gradientreversal. Available online at: https://github.com/tadeephuy/GradientReversal (accessed March 1, 2023).
Vaswani, A., Shazeer, N., Parmar, N., Uszkoreit, J., Jones, L., Gomez, A. N., et al. (2017). Attention is all you need. Adv. Neural Inform. Process. Syst. 30, 5999–6009. doi: 10.48550/arXiv.1706.03762
Wolf, T., Debut, L., Sanh, V., Chaumond, J., Delangue, C., Moi, A., et al. (2020). “Transformers: state-of-the-art natural language processing,” in Proceedings of the 2020 Conference on Empirical Methods in Natural Language Processing: System Demonstrations (Association for Computational Linguistics), 38–45.
Wu, J. J.-l., Huang, M.-j., Wu, H.-s., Yeh, M.-l., Chien, S.-l., Sung, L.-m., et al. (2018). Taiwan Nan Dao Yu Yan Cong Shu 1–16 [A Reference Grammar of Formosan Languages, Volumes 1–16]. Taipei: Council of Indigenous Peoples, Executive Yuan.
Yan, W., Wang, M., Xu, F., Dan, Y., and Luo, J. (2021). Automatic partition of gan dialect in Jiangxi province based on spectrogram. J. Chin. Inform. Process. 35, 1–7. Available online at: http://jcip.cipsc.org.cn/CN/Y2021/V35/I4/1 (accessed March 2, 2023).
Keywords: Formosan languages, Austronesian languages, speech representation, linguistic phylogeny, deep learning, wav2vec, XLSR
Citation: Hsieh S-K, Tseng Y-H, Lian D-C and Wang C-W (2024) Self-supervised learning for Formosan speech representation and linguistic phylogeny. Front. Lang. Sci. 3:1338684. doi: 10.3389/flang.2024.1338684
Received: 15 November 2023; Accepted: 19 February 2024;
Published: 06 March 2024.
Edited by:
Qing Cai, East China Normal University, ChinaReviewed by:
Sarah Samson Juan, University of Malaysia Sarawak, MalaysiaSudarsana Reddy Kadiri, University of Southern California, United States
Copyright © 2024 Hsieh, Tseng, Lian and Wang. This is an open-access article distributed under the terms of the Creative Commons Attribution License (CC BY). The use, distribution or reproduction in other forums is permitted, provided the original author(s) and the copyright owner(s) are credited and that the original publication in this journal is cited, in accordance with accepted academic practice. No use, distribution or reproduction is permitted which does not comply with these terms.
*Correspondence: Da-Chen Lian, ZDA4OTQ0MDE5QG50dS5lZHUudHc=
†These authors have contributed equally to this work