
94% of researchers rate our articles as excellent or good
Learn more about the work of our research integrity team to safeguard the quality of each article we publish.
Find out more
REVIEW article
Front. Mar. Sci. , 02 March 2022
Sec. Ocean Observation
Volume 9 - 2022 | https://doi.org/10.3389/fmars.2022.757124
 Natalya D. Gallo1*
 Noelle M. Bowlin2
 Andrew R. Thompson2
 Erin V. Satterthwaite3Briana Brady4
 Brice X. Semmens5
As climate change and other anthropogenic impacts on marine ecosystems accelerate in the 21st century, there is an increasing need for sustained ocean time series. A robust and collaborative network of regional monitoring programs can detect early signs of unanticipated changes, provide a more holistic understanding of ecosystem responses, and prompt faster management actions. Fisheries-related surveys that collect fisheries-independent data (hereafter referred to as “fisheries surveys”) are a key pillar of sustainable fisheries management and are ubiquitous in the United States and other countries. From the perspective of ocean observing, fisheries surveys offer three key strengths: (1) they are sustained due to largely consistent funding support from federal and state public sector fisheries agencies, (2) they collect paired physical, chemical, and biological data, and (3) they have large and frequently overlapping spatial footprints that extend into the offshore region. Despite this, information about fisheries survey data collection can remain poorly known to the broader academic and ocean observing communities. During the 2019 CalCOFI Symposium, marking the 70th anniversary of the California Cooperative Oceanic Fisheries Investigations (CalCOFI), representatives from 21 ocean monitoring programs on the North American West Coast came together to share the status of their monitoring programs and examine opportunities to leverage efforts to support regional ecosystem management needs. To increase awareness about collected ocean observing data, we catalog these ongoing ocean time series programs and detail the activities of the nine major federal or state fisheries surveys on the U.S. West Coast. We then present three case studies showing how fisheries survey data contribute to the understanding of emergent ecosystem management challenges: marine heatwaves, ocean acidification, and contaminant spills. Moving forward, increased cross-survey analyses and cooperation can improve regional capacity to address emerging challenges. Fisheries surveys represent a foundational blueprint for ecosystem monitoring. As the international community moves toward a global strategy for ocean observing needs, fisheries survey programs should be included as data contributors.
Sustained ocean time series are essential for characterizing marine ecosystem shifts and distinguishing between natural and anthropogenic forcing in the ocean but maintaining these time series is costly and requires lasting investment (Benway et al., 2019). Fisheries-related surveys that collect fisheries-independent data (hereafter referred to as “fisheries surveys”) are a key pillar of sustainable fisheries management in the United States, Europe, Peru, Chile, Norway, India, Canada, Japan, and other countries. In addition to collecting data on fisheries species, these surveys typically collect physical, chemical, and biological oceanographic data over both long periods of time and large regional scales. Fisheries surveys can provide a rich source of ocean time series data for monitoring ecosystem change because surveys in a region typically sample different habitats (seafloor to upper water column), life stages (eggs and larvae to adults), and rely on multiple in situ methodologies (e.g., acoustics, plankton tows, and trawls). Differences in approaches relate to which target species or species group each survey is designed to monitor. Despite the wealth of ocean observations collected by fisheries surveys, they are not always integrated as part of ocean observing systems.
Ocean observing programs collect ocean time series data that provide baselines against which the effects of human pressures and climate change may be measured and reported (Miloslavich et al., 2017), and thus provide important input for ecosystem management. While there is no specified time length of a program that determines if it is a sustained time series, the assumption is that funding mechanisms are in place to support continued and consistent sampling. The International Group for Marine Ecological Time Series (IGMETS) (O’Brien et al., 2017), an effort by the Intergovernmental Oceanographic Commission United Nations Educational Science and Cultural Organization to bring together ship-based, biogeochemical time-series from around the world, specifies that programs should ideally have five or more years of data to be considered for entry into this database. Since fisheries surveys are the main sources of fisheries-independent data informing the stock assessment process, fisheries surveys tend to have sustained funding and sample large spatial scales to adequately sample the ranges of the fisheries species of interest. Thus, from the perspective of ocean observing, fisheries surveys offer three key strengths: (1) they are sustained due to largely consistent funding support by federal and state public sector fisheries agencies, (2) they collect combined physical, chemical, and biological data, and (3) they have large spatial footprints that extend from the nearshore to offshore region.
In the United States, federal fisheries surveys collect data to support the sustainable management of fish stocks, as required under the Magnuson-Stevens Fishery Conservation and Management Act (NMFS, 2007). These surveys typically have more than 10 years of data collection and have consistent funding mechanisms in place through the National Oceanic and Atmospheric Administration (NOAA) National Marine Fisheries Service. Data from these surveys inform stock assessments, integrated ecosystem assessments (IEAs) and other regional ecosystem status reports. While United States fisheries management has traditionally focused on single-species stock assessments, the importance of holistic monitoring of ecosystem dynamics is recognized and there is a movement to include more ecosystem factors in fisheries management (Denit, 2016; Lynch et al., 2018). Fisheries surveys are instrumental in this effort because, in addition to collecting data on fisheries species, these surveys also collect data on the oceanographic conditions and the distribution and abundance of species that co-occur with fisheries species of interest. These physical, chemical, and biological observations are used to develop IEAs for different regions of the United States, which support ecosystem-based management priorities (Levin et al., 2009; Monaco et al., 2021).
The North American West Coast is one of the most extensively studied ocean regions in the world. It is a productive eastern boundary upwelling region (Kämpf and Chapman, 2016) with the California Current flowing north to south from approximately British Columbia, Canada to Baja California, Mexico. Pincetich and Drill (2021) provide an overview of the natural history of the California Current Ecosystem (CCE), and current trends in the CCE are presented in the annual State of the California Current Report (e.g., Weber et al., 2021) and the California Current Integrated Ecosystem Assessment (CCIEA) (e.g., Harvey et al., 2021). The CCE hosts a diversity of marine organisms including Eastern Pacific subtropical and subarctic species, with Point Conception representing a regional transition zone or biogeographic barrier for many species (Allen et al., 2006). The CCE is characterized by interannual variability in environmental conditions due to differences in seasonal and regional upwelling, which are linked to basin-scale forcing from the El Niño Southern Oscillation, the Pacific Decadal Oscillation, and the North Pacific Gyre Oscillation (García-Reyes et al., 2015). The CCE supports many productive fisheries including pelagic species (e.g., California market squid, Doryteuthis opalescens), demersal species (e.g., rockfishes, Sebastes spp.), benthic species (e.g., Dungeness crab, Metacarcinus magister), and highly migratory species (e.g., Pacific bluefin tuna, Thunnus orientalis). The CCE is undergoing a period of rapid change due to both climate change and increasing interests in ocean use (e.g., offshore wind power generation and aquaculture). These ocean interests have the potential to interact with ongoing ocean monitoring efforts, making it particularly important to document the temporal and spatial extent of monitoring.
During the 2019 CalCOFI Symposium, marking the 70th anniversary of the California Cooperative Oceanic Fisheries Investigations (CalCOFI), representatives from 21 ocean monitoring programs on the North American West Coast (Table 1 and Figure 1) came together to share the status of their monitoring programs and examine opportunities to leverage efforts to support broad U.S. West Coast ecosystem management needs for a rapidly changing ocean. Considering that the CCE represents a dynamic seascape mosaic where boundaries, extent, and location of features as well as species distributions and ranges can change with time, managing this “seascape” (Kavanaugh et al., 2016) can be done more effectively by integrating data from multiple monitoring programs. The broad array of surveys within the CCE enhance regional capacity to recognize changes and sustainably manage marine resources (Karp et al., 2019; Holsman et al., 2020). Of the 21 programs represented at the Symposium, eight were federal fisheries surveys [CalCOFI, California Current Ecosystem Survey (CCES), Groundfish Bottom Trawl Survey (GBTS), Hook and Line (H&L), Hake Acoustic Trawl Survey (ATS), Juvenile Salmon and Ocean Ecosystem Surveys (JSOES), Pre-recruit Survey (PRS), and Rockfish Recruitment and Ecosystem Assessment Survey (RREAS)] and one was a state fisheries survey (CCFRP) (full program names are in Table 1).
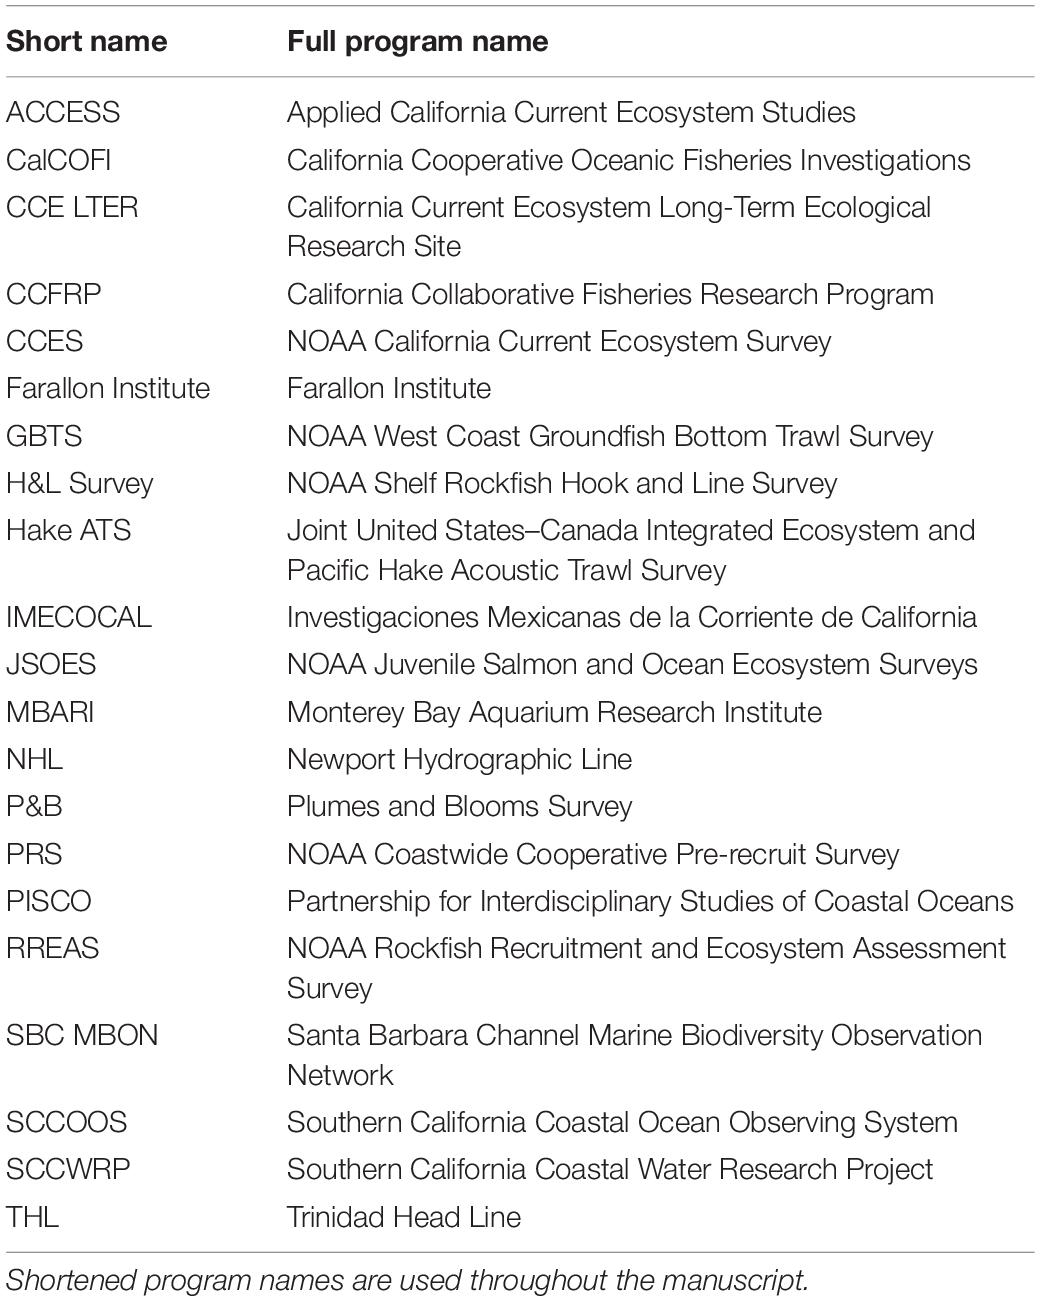
Table 1. These 21 North American West Coast monitoring programs, Surveys, and organizations participated in the 2019 CalCOFI Symposium.
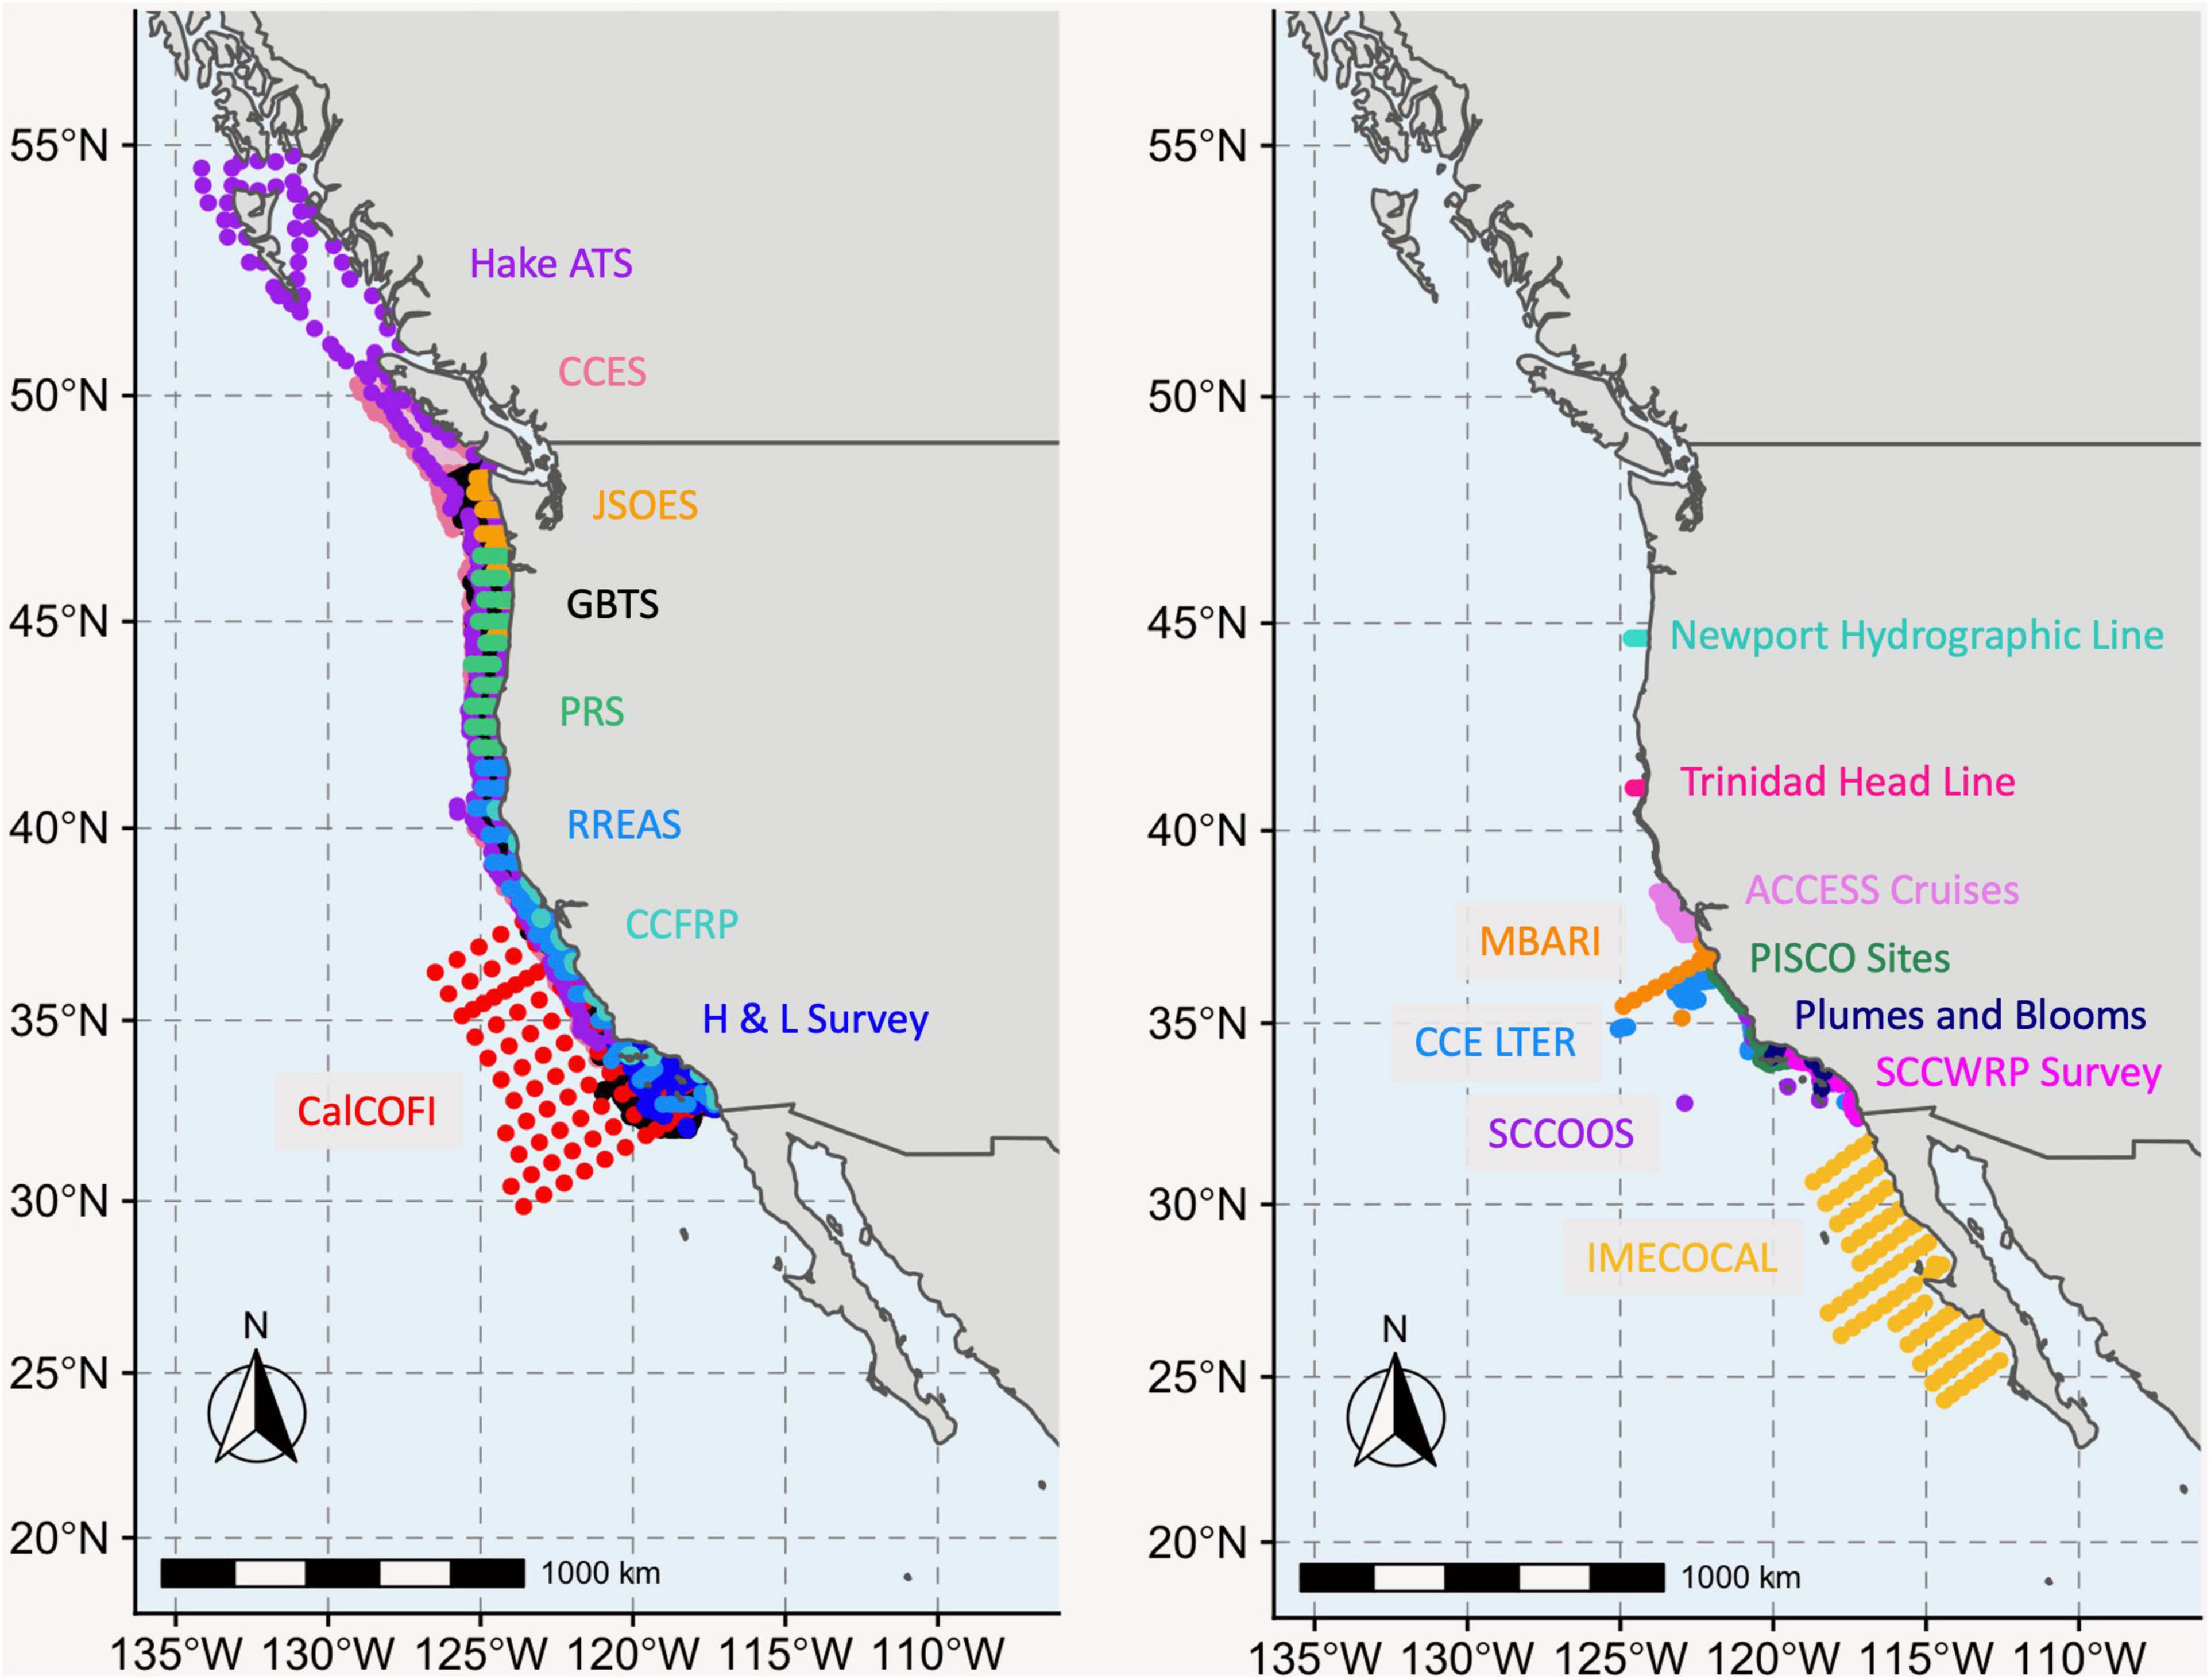
Figure 1. A spatial overview of the North American West Coast monitoring programs represented during the 2019 CalCOFI Symposium. Fisheries surveys that are elaborated on in this manuscript are shown on the left, and other monitoring programs represented at the Symposium are shown on the right. See Table 1 for full survey names. The color of the displayed fisheries surveys is consistent among Figures 1, 2.
The goal of this paper is to demonstrate the value and breadth of ocean observing and ecosystem monitoring data collected by fisheries surveys, using the U.S. West Coast as an example. The non-fisheries monitoring programs presented at the 2019 CalCOFI Symposium (Figure 1) also play an essential role in understanding changes along the U.S. West Coast, but are better known within the academic and ocean observing communities. Here, we provide a brief data inventory and description of each U.S. West Coast fisheries survey and summarize which priority ocean observing variables these surveys measure. We then present three case studies that demonstrate how U.S. West Coast fisheries survey data contribute to the understanding of emergent ecosystem management challenges: marine heatwaves, ocean acidification, and contaminant spills. The manuscript concludes with a discussion of how improved collaboration between the fisheries and ocean observing communities can further the overarching goals of both communities.
To increase awareness about the range of data collected by fisheries surveys on the U.S. West Coast and the value that they add to other regional monitoring efforts, we provide a brief overview of each of the nine fisheries surveys. The spatial extent (Figure 1), timeline of survey continuity (Figure 2), sampling methodologies (Tables 2, 3), and overview of which essential ocean variables (EOVs; Table 4), essential climate variables (ECVs; Table 5), and essential biodiversity variables (EBVs; Table 6) each survey collects, are provided.
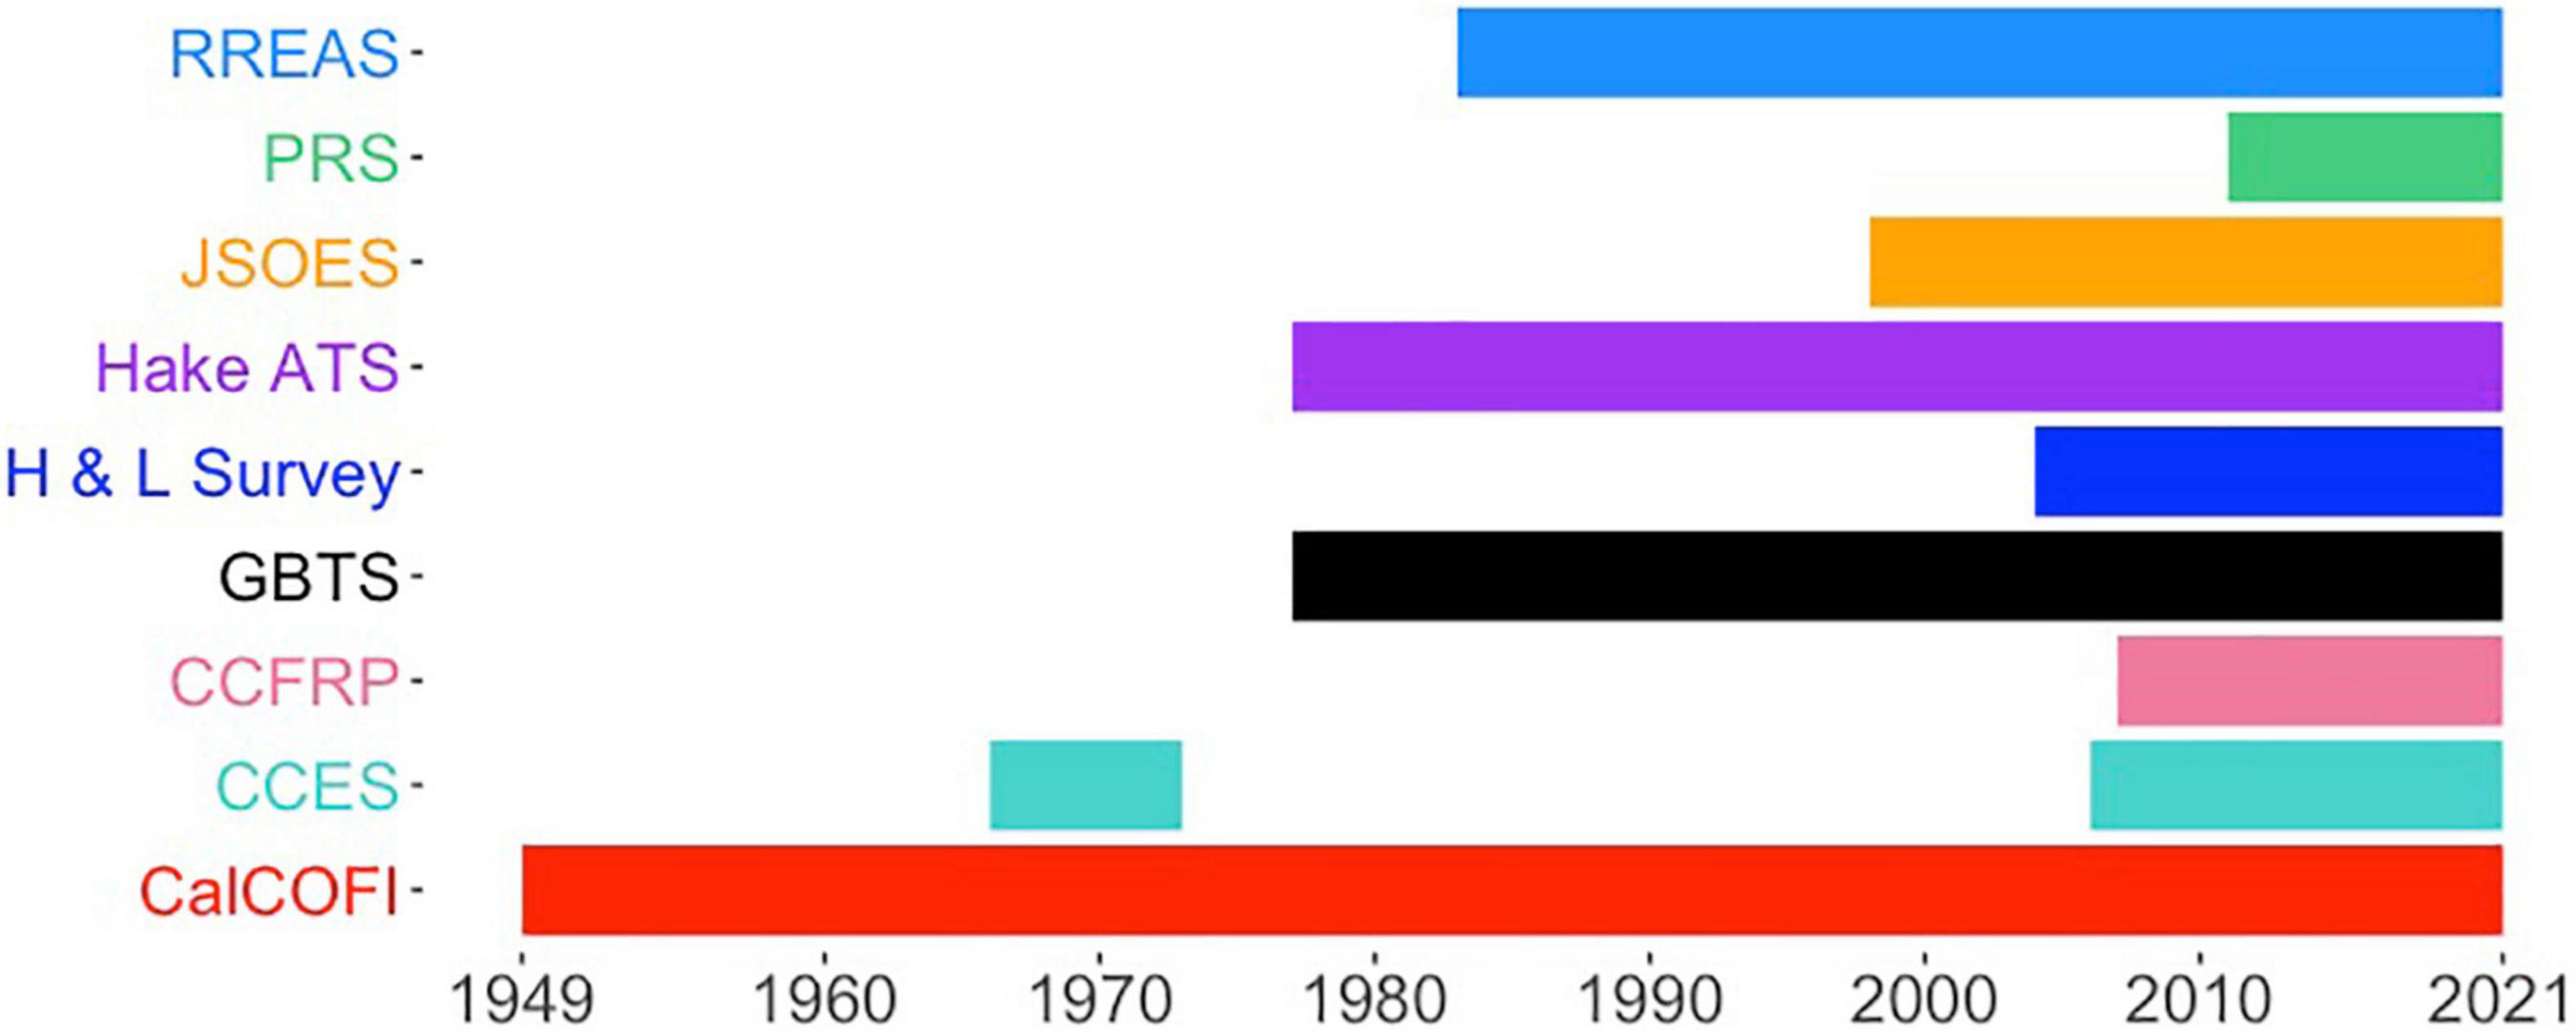
Figure 2. Sampling duration of the U.S. West Coast fisheries surveys (see Table 1 for full program names). The figure displays the general temporal scope of each program, but does not represent changes in sampling frequency over time. All time periods indicate periods where programs were sampling more than once every 3 years, with most sampling at frequencies annually or sub-annually. Additional details on sampling frequency are included in the text and in Table 2.
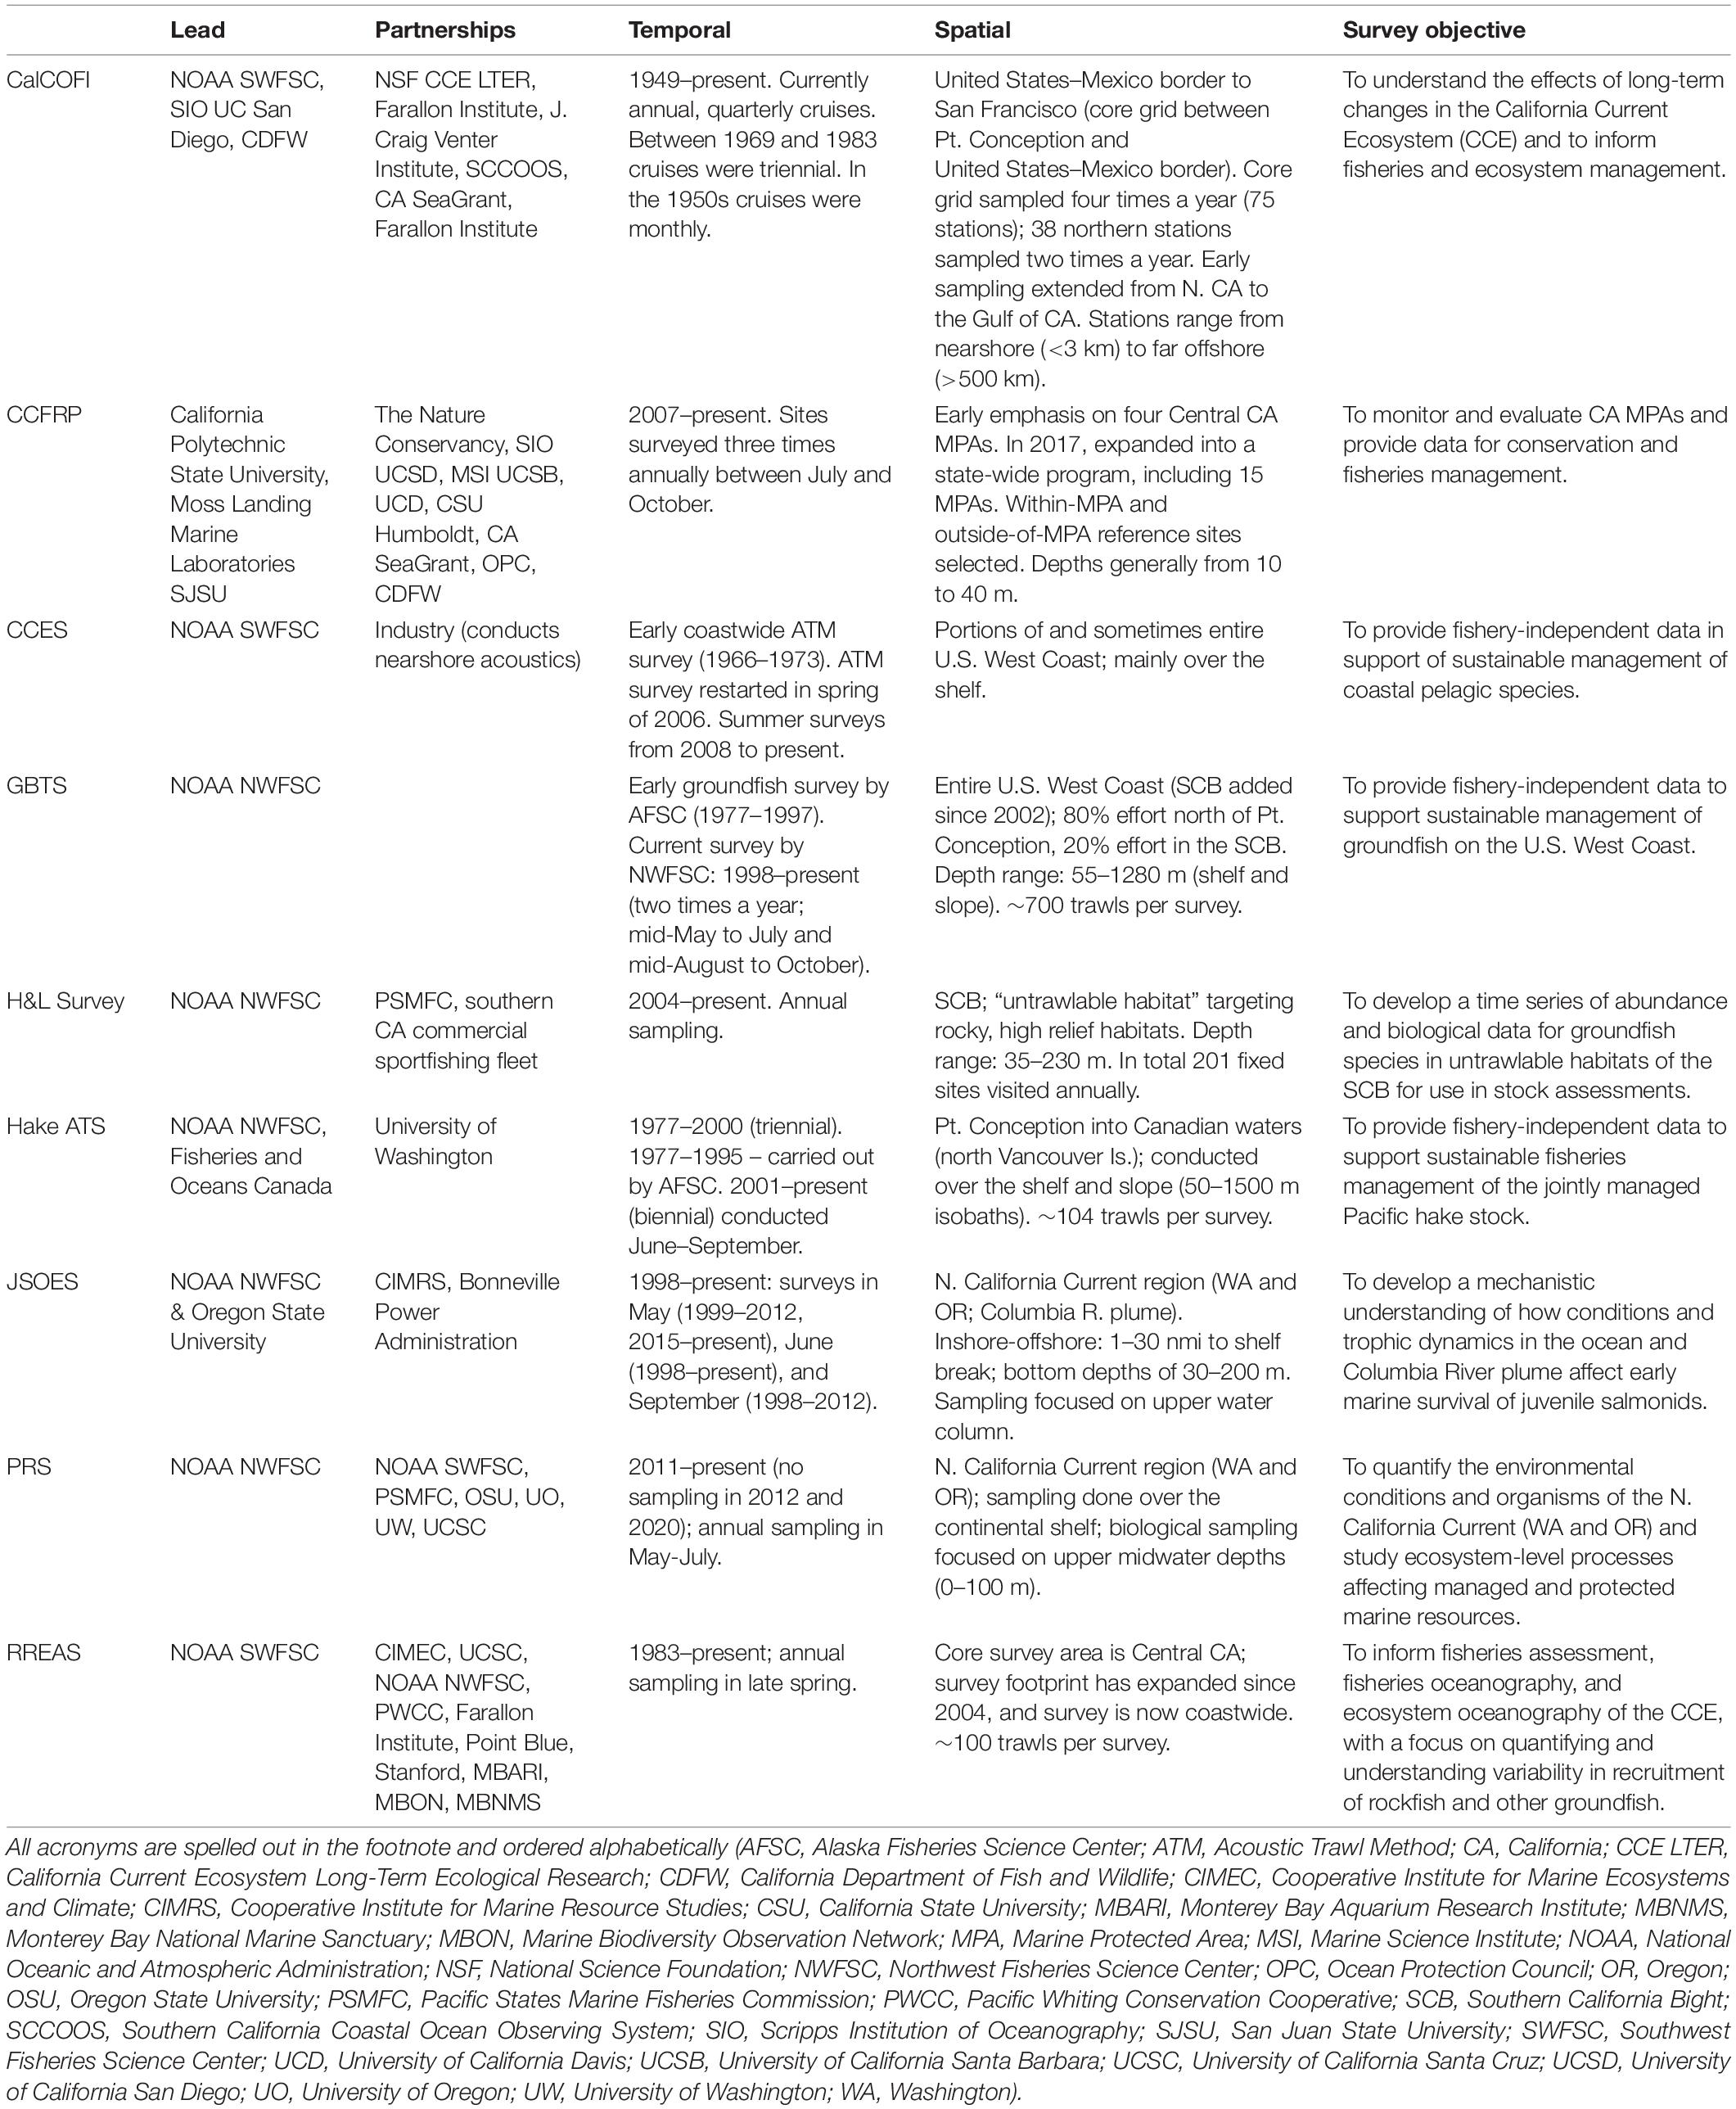
Table 2. Overview of the key program characteristics of the nine U.S. West Coast fisheries surveys.
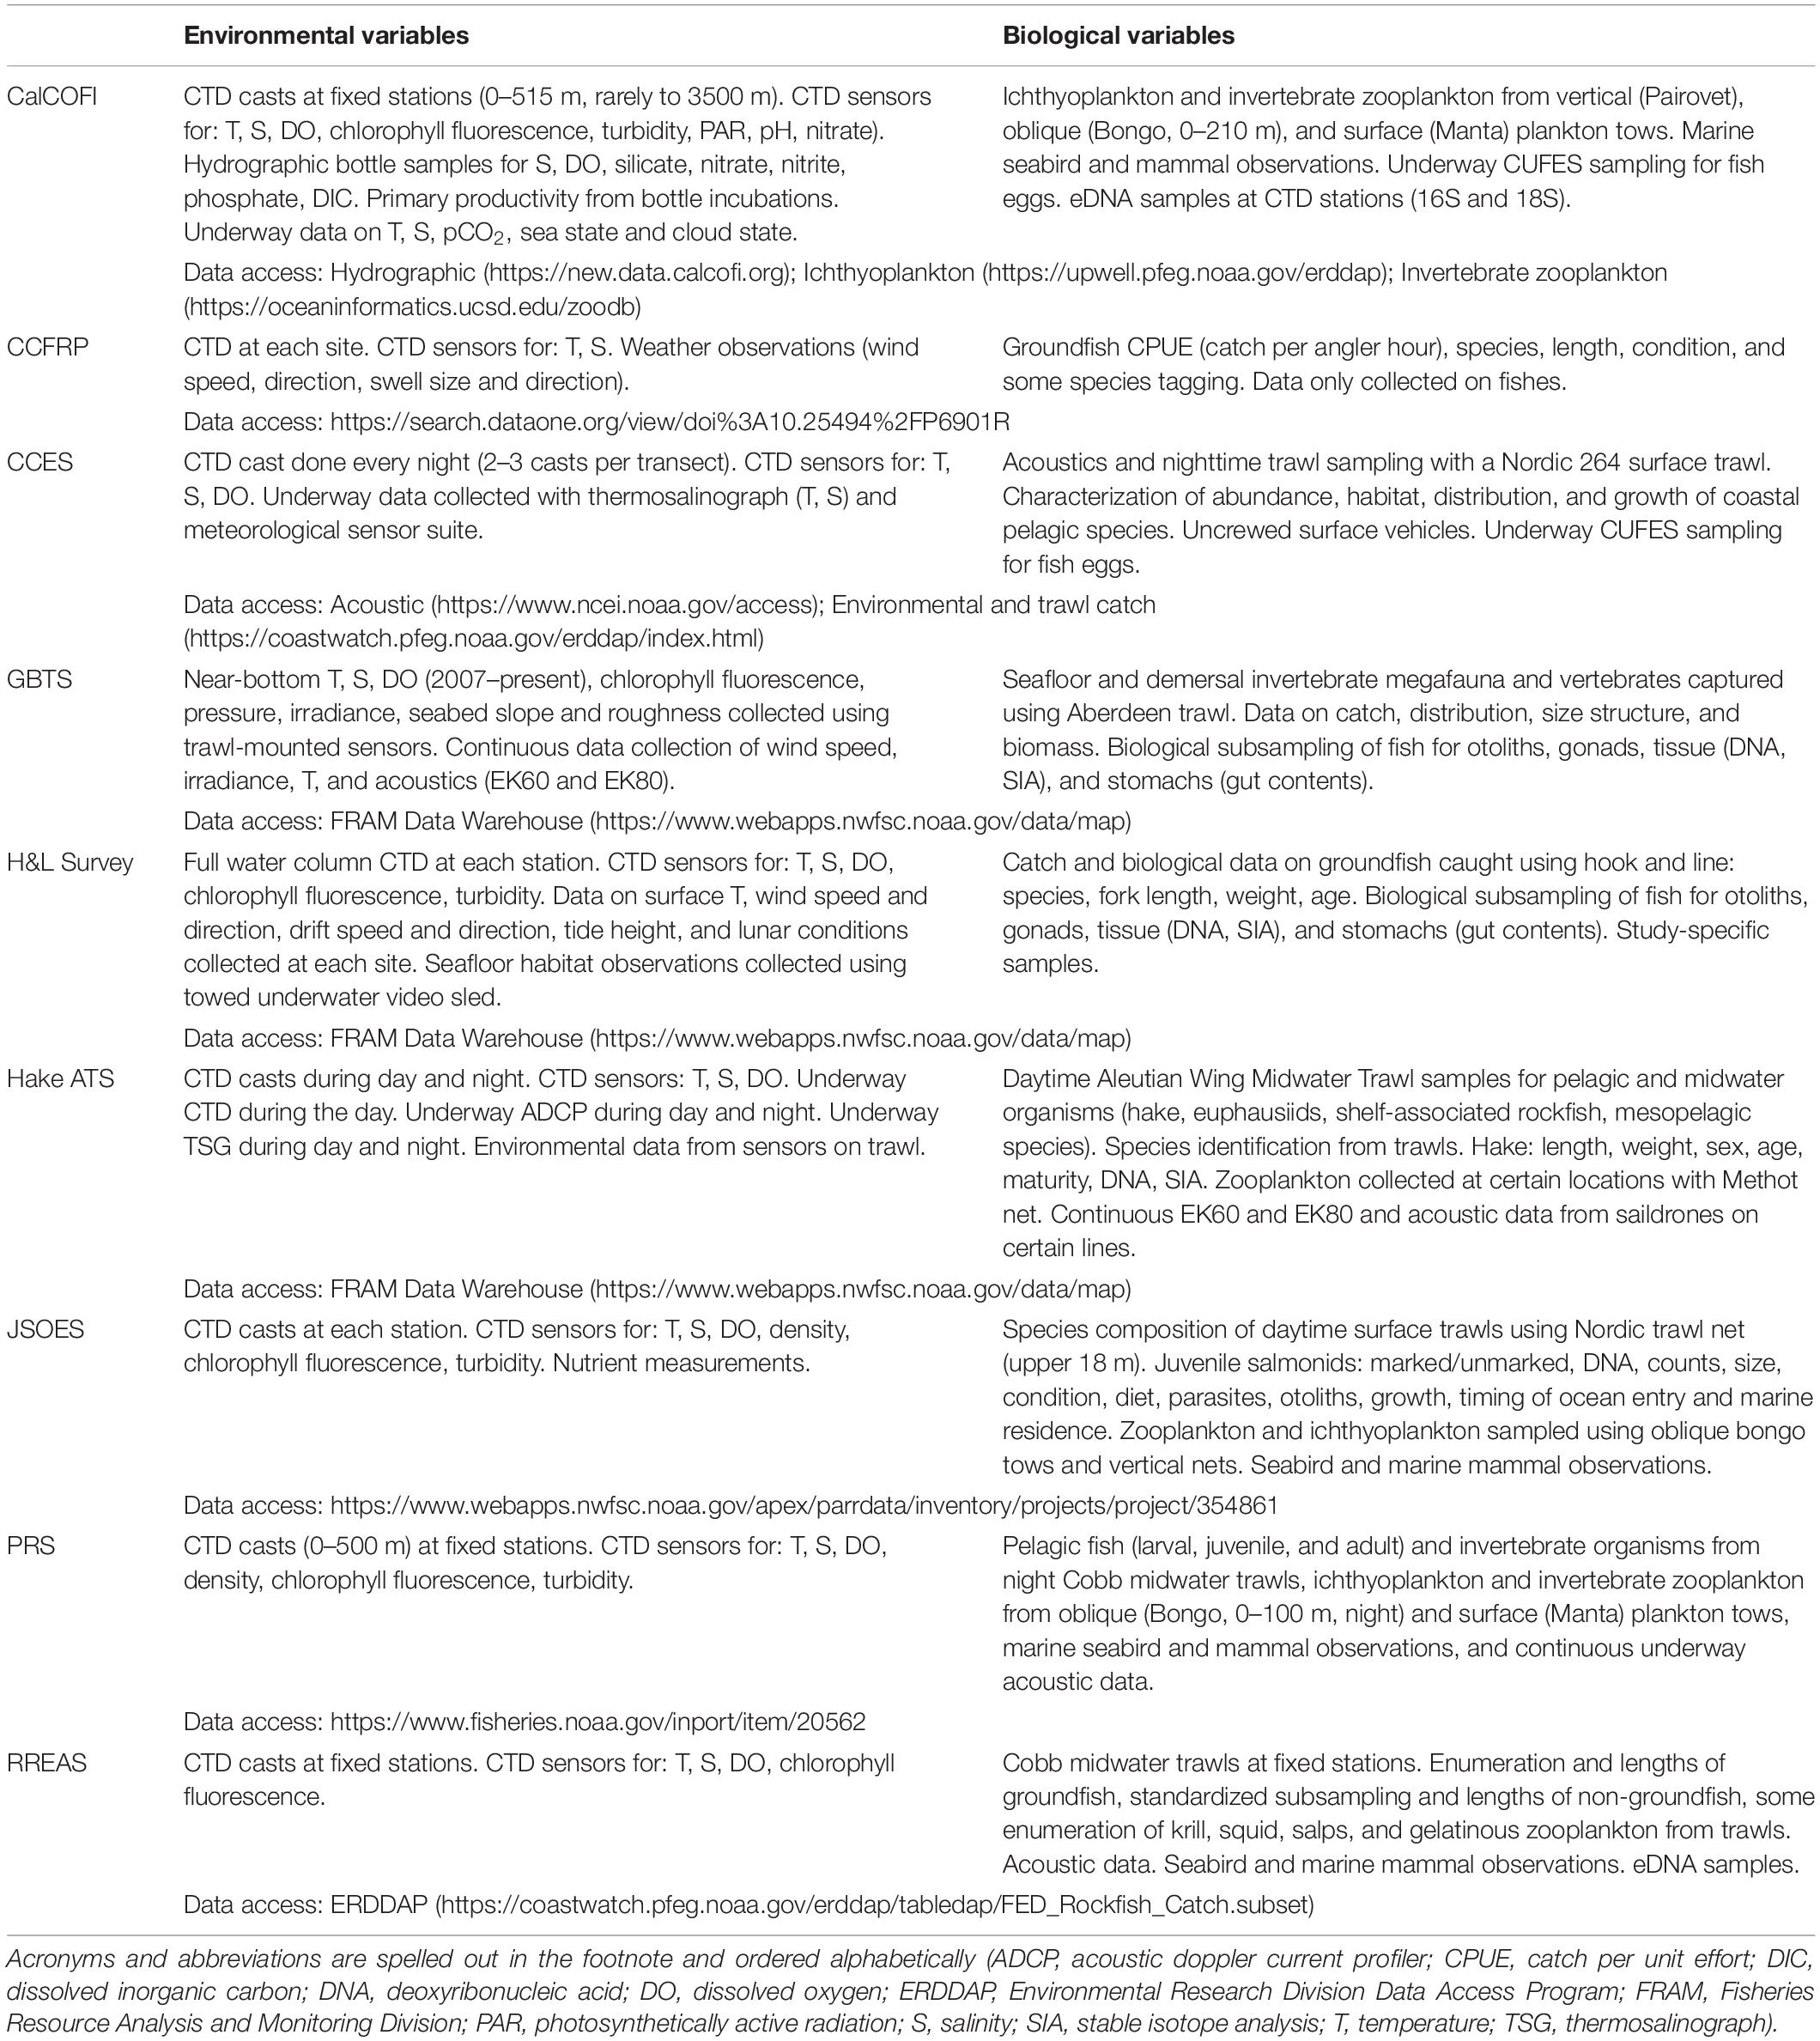
Table 3. Overview of the environmental and biological data collected by the nine U.S. West Coast fisheries surveys, as well as access points to current data repositories.
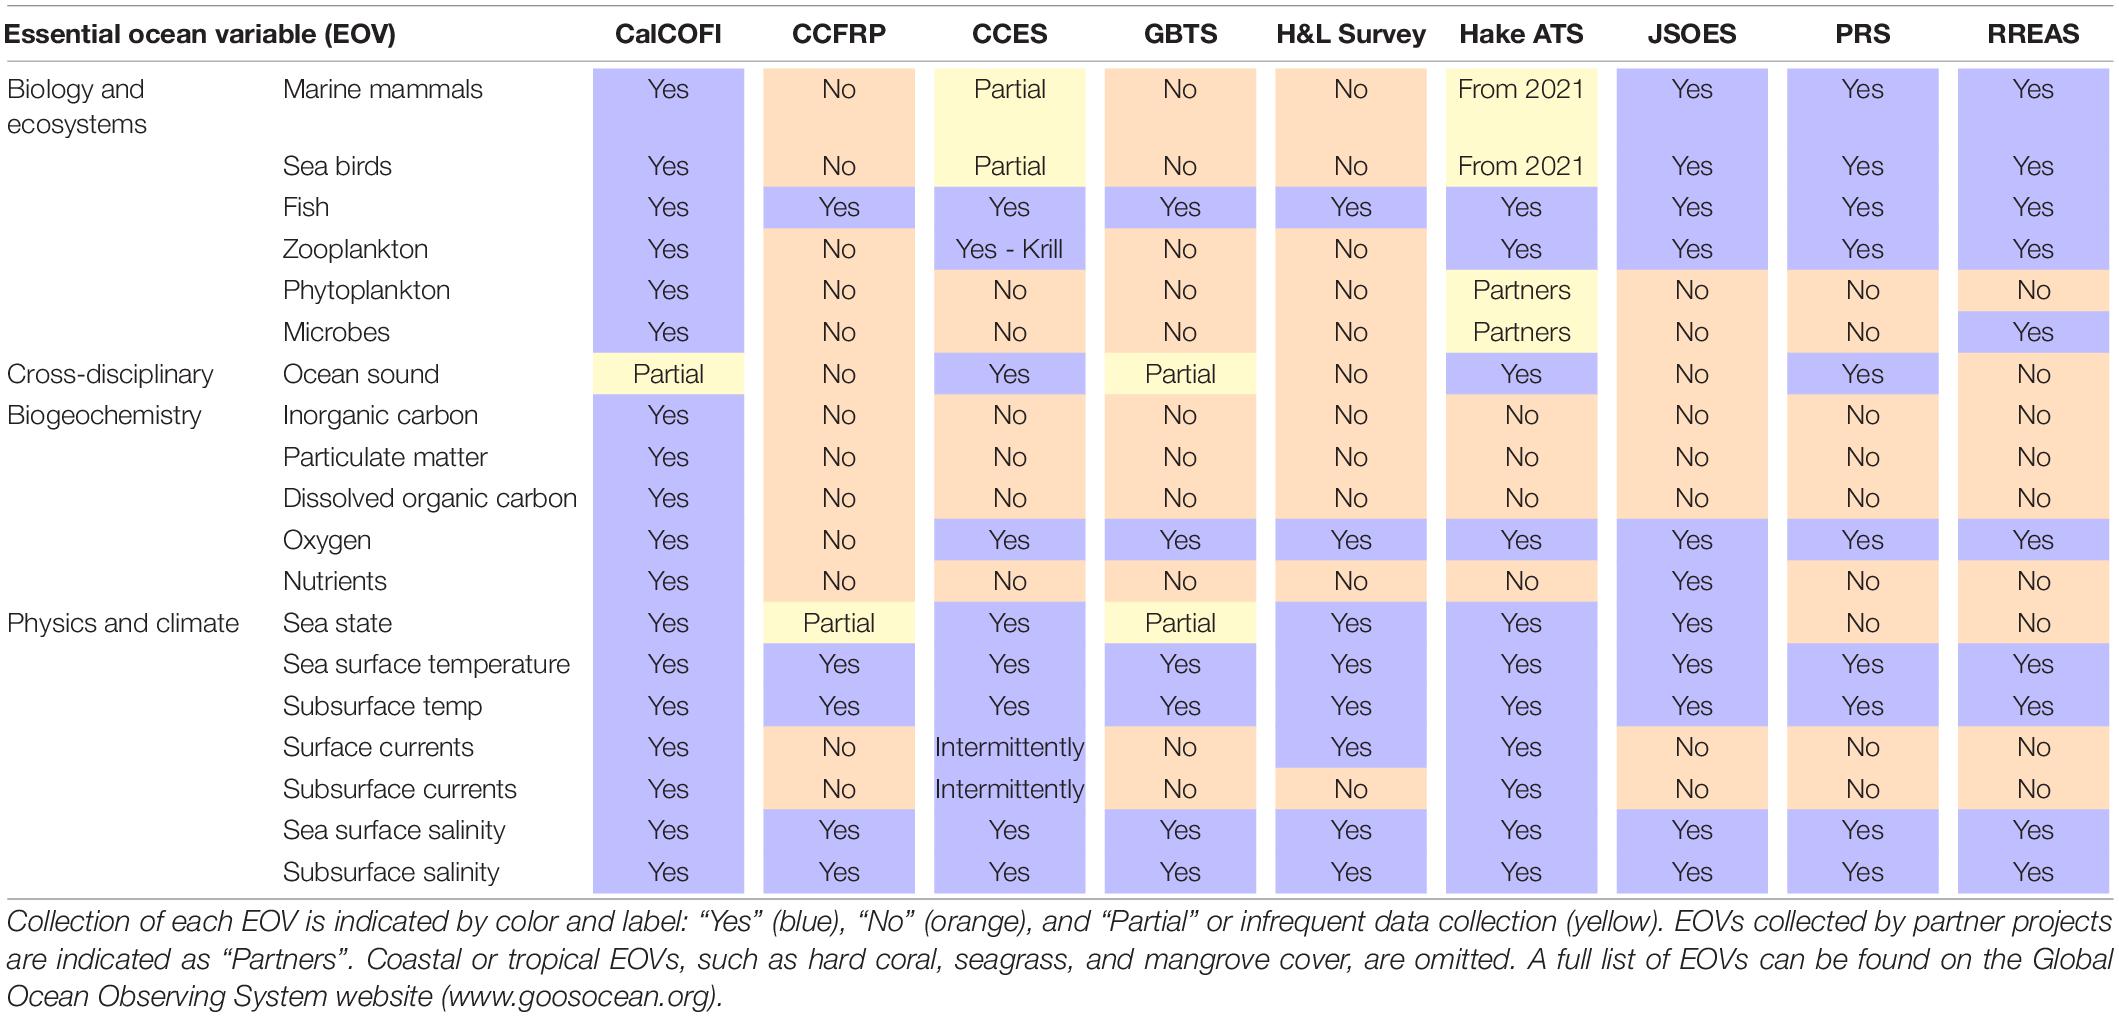
Table 4. Essential ocean variables (EOVs) that are collected on the nine U.S. West Coast fisheries surveys.
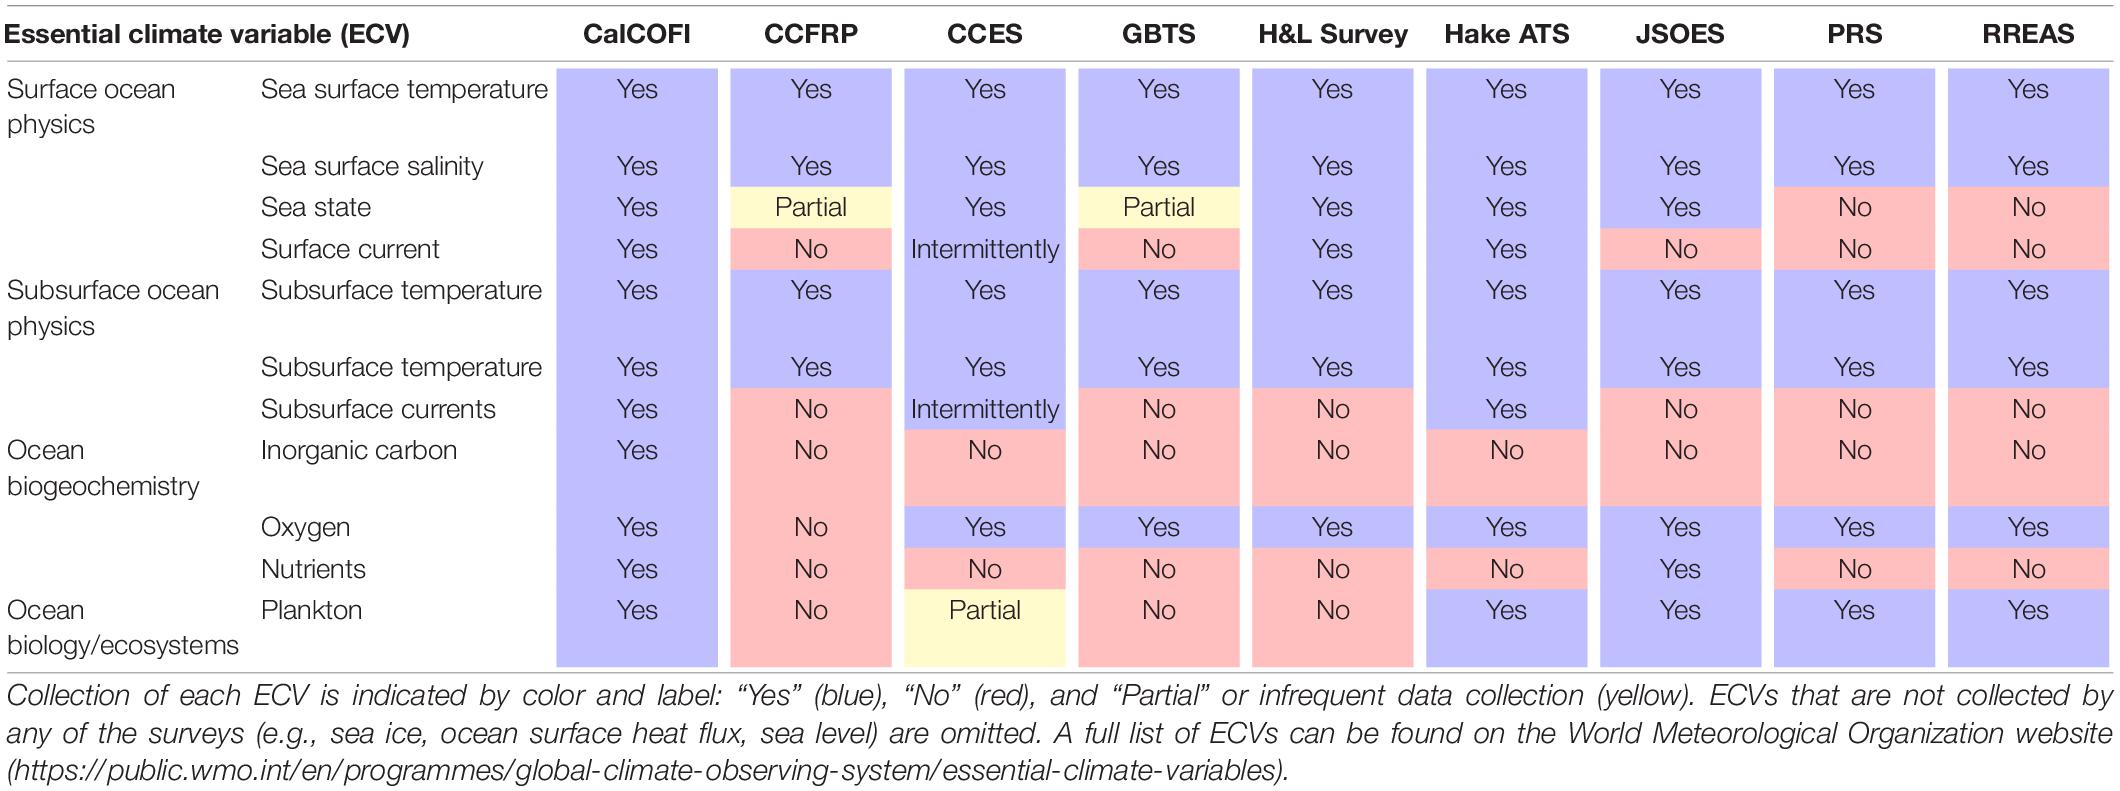
Table 5. Essential climate variables (ECVs) that are collected on the nine U.S. West Coast fisheries surveys.

Table 6. Essential biodiversity variables (EBVs) that are collected on the nine U.S. West Coast fisheries surveys.
The California Cooperative Oceanic Fisheries Investigations started in 1949 to understand the drivers of the Pacific Sardine (Sardinops sagax) crash of the 1940s. From its beginning, CalCOFI represented a partnership between federal, state, and academic scientists with deep-seated roots in oceanography (Hewitt, 1988; Scheiber, 1990) and is recognized as both an ocean observing program and a fisheries survey. At present, CalCOFI conducts quarterly cruises and visits 66 core stations and 9 nearshore stations between Pismo Beach, California and the United States–Mexico border. During the winter and spring, 38 additional northern stations are sampled, going north to San Francisco. CalCOFI samples nearshore (<3 km) to far offshore (>500 km) (Figure 1). During the early years (i.e., 1950s–1960s), sampling regularly extended from northern California into the Gulf of California. The CalCOFI community has published over 1000 scientific papers on topics related to the physical, chemical, and biological aspects of the CCE and how the CCE may respond to climate change (McClatchie, 2014; Gallo et al., 2019). In addition, CalCOFI data contribute to individual stock assessments and inform the CCIEA. CalCOFI data have also been used to demonstrate the effectiveness of the Cowcod Conservation Area (CCA) in supporting the recovery of previously overfished rockfishes (Sebastes spp.) (Thompson et al., 2017a).
CalCOFI collects paired physical, chemical, and biological data. Oceanographic data are currently collected using vertical CTD (conductivity-temperature-depth) casts at all CalCOFI stations with additional CTD-mounted sensors. Niskin bottles on the CTD rosette collect water samples at specific depths to measure salinity, oxygen, nutrients, chlorophyll, pheopigments, primary production, and dissolved inorganic carbon, and water samples are taken and filtered for eDNA. Biological sampling is mainly done using plankton nets. Ring nets were originally used (1949–1976), but since 1977, oblique bongo net tows are conducted at each station; both nets sampled the upper ∼200 m of the water column (Ohman and Lavaniegos, 2002; Thompson et al., 2017b). Manta nets are used to sample surface water (1977–present) and pairovet nets conduct vertical tows (1982–present) from the upper 70 m. Net samples are preserved in formalin and ethanol, fishes and invertebrates are identified and archived at the NOAA Southwest Fisheries Science Center (SWFSC; fishes and cephalopods) and the Scripps Institution of Oceanography Pelagic Invertebrate Collection (invertebrate zooplankton). Since 1987, marine bird and mammal observations have been made in partnership with the Farallon Institute and the Office of Naval Research. Underway data are also collected including the Continuous Underway Fish Egg Sampler (CUFES) (Checkley et al., 1997), acoustic doppler current profiler (ADCP), surface pCO2, sea surface conditions, and advanced laser fluorometry. CalCOFI works in close partnership with the National Science Foundation-funded California Current Ecosystem Long-term Ecological Research (CCE LTER) program, which contributes ship time, supports biogeochemical sampling, and identification of invertebrate zooplankton from the plankton tows.
The NOAA CCE survey’s objective is to provide fishery-independent data in support of sustainable fishery management of coastal pelagic species (CPS), which are important forage species for many marine predators. It is based out of the SWFSC. In the spring of 2006, the CCES was initiated and surveyed from the Mexican border to Vancouver Island (Zwolinski et al., 2012). In 2008, CCE surveys were conducted in both the spring (April) and the summer (July), and from 2008 to 2021, spring surveys were conducted in some, and summer surveys in nearly all years. Prior to the initiation of the CCES in 2006, the California Department of Fish and Game (CDFG) conducted acoustic trawl surveys (1966–1973), which collected comparable data on pelagic fish species from northern California to southern Baja California using an echosounder, sonar, and midwater trawls (Mais, 1974). Between 1970 and 1975, the SWFSC, CDFG, and the United States Navy conducted additional sonar mapping surveys to examine the distribution of CPS in the Southern California Bight (Smith, 1978). Survey data from the CCES have revealed how the distribution and potential habitat of CPS shifts seasonally (Demer et al., 2012), interannually, and across longer timescales (2008–2019), and in response to changes in the Pacific Decadal Oscillation. Survey data have also informed our understanding of the habitat, distribution, recruitment, growth, natural mortality, abundance, and assemblage structure of CPS. Survey data are used for stock assessments of CPS.
The CCES is conducted on NOAA ships and uses acoustics, trawls, and CUFES to collect data on acoustic backscatter, egg densities, and species composition of CPS, namely Northern Anchovy (Engraulis mordax), Pacific Herring (Clupea pallasii), Jack Mackerel (Trachurus symmetricus), Pacific Mackerel (Scomber japonicus), and Pacific Sardine (Stierhoff et al., 2019). The survey also collects information about additional species captured in the trawl, although the methods for quantifying these taxa has varied across cruises. In recent years, fishing vessels and uncrewed surface vehicles have been integrated into the CCES to estimate the biomass of CPS in the nearshore region where shallow depths are unsafe for the larger NOAA ships (Stierhoff et al., 2019). Environmental data are collected using daily CTD casts, and underway measurements such as CTD casts and thermosalinographs. Marine mammal and seabird observations are also made on surveys.
The NOAA West Coast GBTS’s objective is to provide fishery-independent data to support sustainable fishery management of groundfish on the U.S. West Coast. It is based out of the Northwest Fisheries Science Center (NWFSC). The survey samples depths from 55 to 1280 m, spanning waters from Canada to Mexico, and conducts two passes (North to South) down the coast each year in the summer (May–July) and in the fall (August–October). Approximately, 700 locations are selected for each survey using a stratified random sampling design, with more effort focused north of Point Conception (80%), compared to south of Point Conception (20%). The existing survey builds on a historic survey conducted by the Alaska Fisheries Science Center between 1977 and 1997. In 1998, the NWFSC assumed responsibility for the survey, and between 1998 and 2001, the survey footprint was between the United States–Canada border to Point Conception, CA, and focused on the continental slope (183–1280 m). In 2002, the survey expanded to the United States–Mexico border, and in 2003, the survey expanded to also cover the shelf and slope. Survey data have been used to observe broadscale changes on the U.S. West Coast, such as recovery of overfished species, decreases in near-seafloor oxygen and associated ecosystem impacts (Keller et al., 2017), trophic shifts during anomalous climatic events, and species collapses with associated ecosystem effects (Harvell et al., 2019).
During the survey, chartered fishing vessels conduct 15-min bottom tows on soft, benthic habitats during daylight hours with a tow speed of 2.2 kts using a standard Aberdeen-style trawl. All fishes and invertebrates from each tow are sorted to species (or the lowest possible taxon) and weighed using an electronic motion-compensated scale. Species covered under fishery management plans are also subsampled, sorted by sex, individually measured, weighed, and otoliths, gonads, stomachs, tissue samples, and fin clips are collected. Additionally, special cruise-specific projects are supported by the survey. Environmental data including near-bottom temperature, oxygen, salinity, irradiance, chlorophyll fluorescence, turbidity, depth, and seabed slope and roughness are collected for each trawl using trawl-mounted sensors. Near-seafloor dissolved oxygen data have been collected since 2007. Additionally, environmental data on wind speed,
surface irradiance, surface temperature, and bottom type (EK 60, EK 80) are continuously collected using sensors on the ship. The survey is considering future opportunities to collect carbonate chemistry measurements using trawl-mounted pH sensors to examine ocean acidification vulnerability of seafloor communities.
The NOAA Shelf Rockfish H&L survey is an industry-scientist research partnership based out of the NWFSC. The survey objective is to develop a time series of abundance and biological data for groundfish species in untrawlable habitats of the Southern California Bight for use in stock assessments. The survey began in 2004 in response to the need for fishery-independent data on rockfish abundance south of Point Conception. In 2004, the survey sampled 74 stations, which grew to 121 stations by 2008. In 2014, coverage was added inside the CCA, and currently the survey samples 201 stations annually at depths between 35 and 230 m. The survey is conducted in partnership with the local sportfishing industry. Survey data are used for numerous stock assessments as indices of relative abundance and have been used to show the effectiveness of the CCA in rockfish and Lingcod (Ophiodon elongatus) recovery (Keller et al., 2019). Survey data can also be used to document broadscale changes on the U.S. West Coast including shifting species distributions and trophic changes.
During the survey, gear is deployed by rod and reel with standardized effort (75 hooks per site; three anglers make five coordinated drops of a 5-hook gangion), and effort (soak time) is tracked with stopwatches. At each station, both environmental and biological data are collected. Environmental data collected include surface temperature, wind speed and direction, and a full water column CTD profile is conducted at each station with temperature, salinity, dissolved oxygen, chlorophyll, and turbidity sensors. Additionally, drift speed and direction, tide height, and lunar conditions are recorded. Visual observations of the seafloor habitat are obtained using a towed underwater video sled. Biological data are collected on the captured groundfishes and include species, fork length, and weight. Biological samples of otoliths, finclips, stomachs, and muscle tissue are taken for studies on aging, genetics, diet, and trophic ecology. Project-specific data may also be collected.
The NOAA RREAS is based out of the SWFSC and samples annually in late spring. The overarching research objectives of the survey are threefold and relate to informing fisheries assessment, fisheries oceanography, and ecosystem oceanography. The survey began in 1983, with the original goal of quantifying and understanding variability in recruitment of rockfishes and other groundfishes. The survey initially focused on central California, but in 2004 expanded to cover most CA waters (Sakuma et al., 2016). The RREAS is also part of a Marine Biodiversity Observation Network (MBON) and works in close collaboration with other research institutions on this. Data from the RREAS have been used to better understand which environmental factors and processes contribute to setting year class strength for rockfishes and other groundfishes (Ralston et al., 2013; Schroeder et al., 2019), and have also been used to examine the effects of changes in the abundance of young of the year rockfishes on predator dynamics (Wells et al., 2017). The RREAS informs the CCIEA, the State of the California Current report, and provides indices of rockfish year class strength that are used for multiple stock assessments. Since 2001, the NWFSC has conducted a comparable survey in the Pacific Northwest off Oregon and Washington, first as a collaborative effort with the Pacific Whiting Conservation Cooperative (2001–2009) and more recently with NOAA research vessels (2011–present), using complementary methods (see the section “National Oceanic and Atmospheric Administration Coastal Cooperative Pre-recruit Survey” below). Data from both the SWFSC and NWFSC surveys are pooled to develop indices of juvenile rockfish abundance to support stock assessments (Field et al., 2021) as well as to support other ecosystem investigations.
The RREAS collects both environmental and biological data. Environmental data include CTD casts at each station with temperature, salinity, and dissolved oxygen sensors. Biological samples of epipelagic micronekton are collected using a Cobb midwater trawl with a 3/8′′ codend liner, typically with a 30 m headrope depth. Tows are conducted at night, and are 15 min in duration, at a speed of 2–2.5 kts. Net and methods are comparable to historic CDFG acoustic trawl surveys (Mais, 1974). Biological data from the midwater trawls include enumeration and lengths of all captured groundfish, otolith removal and age determination for a subset of these species, standardized subsampling and lengths of non-groundfish, identification of most krill and squid to species level, and enumeration of some gelatinous zooplankton, including salps and pyrosomes. Additional biological data are collected using acoustics, which have supported studies of krill relative abundance and distribution (Santora et al., 2011). Seabird and marine mammal observations are made and have been used to support a suite of studies, and recently eDNA samples have been collected and analyzed (Closek et al., 2019).
The JSOES is based out of the NWFSC and was first initiated in 1998. The survey focuses on the northern California Current region (northern Washington to Newport, Oregon). JSOES uses a combination of research, monitoring, and modeling to develop a mechanistic understanding of how conditions and trophic dynamics in the ocean and Columbia River plume affect early marine survival of juvenile salmonids. Survey sampling is over the shelf [1–30 nautical miles (nmi) offshore] and over bottom depths of 30–200 m. The June time series has the most consistent temporal and spatial coverage (1998–present), the May time series is limited to 1999–2012 and 2015–present, and an additional September time series was collected from 1998 to 2012. Survey data have been used to study variability in nekton and recent ecosystem disturbances in the Northern California Current (Morgan et al., 2019) and to develop and test ecosystem models (e.g., Ruzicka et al., 2016). One important output of the survey is the indicator stop light chart, which combines regional and local physical and biological variables that affect juvenile salmonid survival into a simple visual. Survey results are used by tribal groups, state, and federal agencies, and inform the CCIEA, and the State of the California Current Report. Scientists involved with JSOES are also involved with the Newport Hydrographic line (sampled biweekly, 1996–present), and the NOAA coastal cooperative pre-recruit survey (PRS).
The JSOES collects both environmental and biological data. Environmental data collected by JSOES include CTD casts, nutrients, and chlorophyll-a. Biological data are collected using daytime surface trawls with a Nordic trawl net, which fishes in the upper 18 m of the water column. Vertical net plankton tows sample smaller zooplankton, especially copepods, in the upper 100 m of the water column. Oblique bongo tows sample the zooplankton community in the upper 30 m of the water column. The survey collects biological data on surface trawl species composition, zooplankton (including ichthyoplankton) from the plankton tows, and conducts observations of seabirds and marine mammals. Since the survey focuses on survival of juvenile salmonids, additional data on salmonid species are also collected.
The objective of the NOAA coastal cooperative PRS is to quantify the environmental conditions and organisms of the Northern California Current (off Oregon and Washington) and study ecosystem-level processes affecting managed and protected marine resources. The PRS began in 2001 as a collaboration between NOAA and the Pacific Whiting Conservation Cooperative and helped complement survey effort by the RREAS off California (Sakuma et al., 2006; Ralston and Stewart, 2013). Since 2011, it has been operated by the NWFSC and coordinates directly with the RREAS (Brodeur et al., 2019a). Data from these two surveys are pooled to support indices for stock assessments and other investigations (e.g., Friedman et al., 2018; Field et al., 2021). PRS sampling occurs annually in May-July during seasonal ocean upwelling and increased southward transport. Survey data are used to parameterize ecosystem models and forecast changes in species, assemblages, and ecosystems. Survey data have also been used to examine shifts in the assemblage structure due to marine heatwaves (Brodeur et al., 2019a).
Oceanographic and biological samples are collected by the survey at fixed stations along transects over the continental shelf. CTD casts at fixed stations measure temperature, salinity, density, chlorophyll a, turbidity, and dissolved oxygen throughout the water column (to maximum depth of 500 m) (Brodeur et al., 2019a). Underway acoustic data are collected continuously throughout the survey to acoustically characterize the distribution and abundance of macrozooplankton, micronekton, meroplankton, and zooplankton. Biological sampling is conducted using a modified Cobb midwater trawl and bongo and Manta nets at fixed cross-shelf stations along ten 0.5°-latitudinal transects. The midwater trawls have a target headrope depth of 30 m, are ∼15 min in duration, and are conducted at night. Most organisms captured by the trawl are sorted, measured, counted, and identified to the lowest taxonomic level possible. Specimens of certain species are collected for diet analysis, growth, contaminant load, stable isotope analysis, and other studies relating to the ecology and production of commercially and ecologically important taxa and their relationships within the food web. Ichthyo- and zooplankton are collected using a bongo net with a 60-cm diameter mouth opening and 333-μm mesh nets. The bongo is fished at night as a continuous oblique tow from ∼100 m (or within 5 m of the bottom at stations < 100 m) to the surface. Neustonic ichthyo- and zooplankton (especially crab megalopae) were also collected in 2014–2019 using a Manta net (1.0 × 0.4 m mouth; 300-μm mesh) fished at the surface. Marine mammal and bird observations are also collected during the day, and a variety of specialized projects are conducted each year.
The objective of the Hake ATS is to support sustainable fisheries management for Pacific Hake (Merluccius productus), which is the largest (by volume) fishery on the U.S. West Coast and is jointly managed with Canada. The survey began in 1977 and was initially conducted triennially, but since 2001 has been conducted every other year. The survey samples from south (Point Conception) to north (SE Alaska) and takes place in the summer (June–September) with about 90–100 days at sea. The survey has a random start near Point Conception, then transects are spaced 10 nmi apart and are conducted over isobaths of 50–1500 m (or 35 nmi offshore). In addition to informing hake stock assessments, integrated oceanographic, acoustic, and biological data from the survey have been used to develop models for forecasting hake and euphausiid habitat, and to examine trophic linkages. Given the large spatial footprint of the survey, the data can be used to examine broadscale changes in the CCE.
Oceanographic, acoustic, and biological data are collected by the survey. Oceanographic data are collected while underway using an ADCP and a thermosalinograph, as well as at fixed and ad hoc stations using CTD profiles and an underway CTD. Acoustic data are collected using Simrad EK60 and EK80 echosounders at 18, 38, 70, 120, and 200 kHz, run continuously during the day and night. Backscatter data are used to examine the distribution and abundance patterns of hake, euphausiids, and shelf-associated rockfishes in the water column. Regions of hake-like backscatter are sampled during the day using an Aleutian Wing Midwater Trawl with video, stereo cameras, and an SBE-39 temperature and pressure sensor attached to the trawl. On average, 104 trawls have been collected per survey (range between 63 and 141 trawls). Trawl-caught specimens are identified to species, and lengths, weights, age, sex, and maturity are determined for certain species. Samples for genetics, diet, physiology, and toxicology are also collected for certain species. Zooplankton tows with a Methot net are conducted at certain stations. Saildrones have also recently been used as a sampling platform, and there are hopes to add drop cameras in the future. Partner projects on the survey have included harmful algal bloom research, eDNA sampling, testing of the Imaging Flow CytoBot (an in situ automated submersible imaging flow cytometer for analyzing nano- and microplankton; Olson and Sosik, 2007), and collection of marine bird and mammal observations.
The CCFRP is a fishery-independent monitoring program that was started to monitor and evaluate the California Marine Life Protection Act (MLPA)-created Marine Protected Areas (MPAs) in California and provide data for conservation and fisheries management. It began in 2007 following the passage of the MLPA, and initially focused on four Central Coast MPAs (Año Nuevo, Point Lobos, Piedras Blancas, and Point Buchon). In 2017, CCFRP expanded to a statewide program. Sampling focuses on depths between ∼10 and 40 m and is done by paired sampling at an MPA and a nearby reference site with matching benthic substrate and depth characteristics. For each site, four grid cells (500 × 500 m) are randomly selected, and a 15-min drift is conducted at three locations in each grid cell, during which volunteer anglers fish. CCFRP data are used for certain nearshore rockfish stock assessments, where other fishery-independent data are unavailable, and data are used to evaluate MPA effectiveness and assess recovery of certain species (Starr et al., 2015). The data have supported recovery of Lingcod, Blue Rockfish (Sebastes mystinus), and Vermillion Rockfish (Sebastes miniatus) in certain MPAs. By incorporating the fishing community into CCFRP sampling (through contracting Commercial Passenger Fishing Vessels and involving volunteer anglers), this program also works to build trust between the science and fishing communities (Mason et al., 2020).
Both environmental and biological data are collected by the program. Biological sampling is performed by fishing during a 15-min drift. Angler number, species identity, total length (cm), fish condition, tag number, and global positioning system coordinates are recorded for each catch, total time fishing is recorded to provide a precise estimate of effort, and data are standardized to catch per angler hour, as a metric of CPUE (catch-per-unit-effort). Additionally, weather is recorded and a CTD cast is conducted. Between 2007 and 2018, 136,000 fishes from 86 species have been caught by the CCFRP. Over 44,000 fishes have been tagged and released as part of this program, and genetic mark/recapture methods are being explored.
Fisheries surveys collect data on multiple variables that have been deemed as priorities by the ocean observing community. These include essential ocean variables (EOVs), essential climate variables (ECVs), and essential biodiversity variables (EBVs). EOVs have been agreed upon by the Global Ocean Observing Strategy to build better coordination across observing programs (Lindstrom et al., 2012). EOVs that relate to measuring climate change, such as sea surface temperature, oxygen, and inorganic carbon, are also considered ECVs under the global climate observing system (WMO, 2016). ECVs contribute to the characterization of Earth’s climate and support the work of the United Nations Framework Convention on Climate Change and the Intergovernmental Panel on Climate Change. EBVs have been defined by the Group on Earth Observations Biodiversity Observation Network as derived measurements required to study, report, and manage biodiversity change (Pereira et al., 2013). EBVs fall into six classes: genetic composition, species populations, species traits, community composition, ecosystem functioning, and ecosystem structure. To improve coordination with the international ocean observing community, we indicate the EOVs (Table 4), ECVs (Table 5), and EBVs (Table 6) that are collected by U.S. West Coast fisheries surveys.
Overall, we see that certain EOVs and ECVs are very well sampled by fisheries surveys. Since all surveys conduct vertical CTD casts, all collect data on sea surface and subsurface temperature and salinity (Tables 4, 5). Because dissolved oxygen is an important environmental variable for characterizing fish habitat, most surveys also collect subsurface oxygen data with calibrated oxygen sensors, and some collect bottle measurements and conduct Winkler titrations at sea (Tables 4, 5). Since the objective of fisheries surveys is to support sustainable management of fish stocks, all surveys collect data on fish and more than half collect data on zooplankton (Table 4). Phytoplankton and microbe EOVs are only collected by certain surveys (Table 4), and the collection of these EOVs tends to be supported by academic collaborations and partner projects. Similarly, nutrient data are only collected by two of the nine fisheries surveys (Tables 4, 5). Currently, only CalCOFI collects inorganic carbon data, which is an important EOV and ECV since it supports understanding ocean acidification risk (Tables 4, 5). However, carbonate chemistry parameters can be estimated with robust regional empirical relationships (Alin et al., 2012) using variables that are collected by most surveys (i.e., temperature, salinity, oxygen). Thus, even surveys that do not directly collect inorganic carbon data can contribute to understanding regional ocean acidification risk.
Perhaps the greatest contribution of fisheries surveys is to ocean biology and ecosystem variables, and EBVs, which require at-sea, biological data collection. This can be seen by the large number of biology and ecosystem EOVs (Table 4) and EBVs (Table 6) that are supported by U.S. West Coast fisheries survey programs. Specifically, all surveys contribute knowledge on species distributions, species abundances, community abundance, ecosystem disturbances, and ecosystem distribution (Table 6). Surveys that sample in multiple seasons of the year, also contribute knowledge on species and ecosystem phenology (Table 6). Fisheries surveys can also contribute to EBVs that are not explicitly a focus of the survey. For example, genetic composition EBVs could be examined using archived and curated ethanol preserved samples from programs like CalCOFI; and programs like GBTS, H&L Survey, Hake ATS, and JSOES collect fish tissue samples for DNA analysis, which could inform other genetic composition EOVs (Table 6).
In this section, three case studies are provided that show how fisheries survey data contribute to understanding and managing emergent ecosystem challenges on the U.S. West Coast, including marine heatwaves, ocean acidification, and contaminant spills.
Between 2014 and 2016, water temperature along the west coast of North America displayed the highest 3-year average on record (Jacox et al., 2018), and similar “marine heatwave” conditions are likely to become increasingly common in the future (Jacox et al., 2020). Data collected from multiple marine surveys, including fisheries surveys, provided a comprehensive picture of the response of the CCE across multiple trophic levels to the 2014–2016 marine heatwave (visually summarized in Figure 3).

Figure 3. Conceptual diagram of observed marine heatwave effects in the California Current Ecosystem during the 2014–2016 marine heatwave.
Zooplankton data from the NHL, THL, PRS, CalCOFI, and IMECOCAL surveys showed that zooplankton displayed similar, and rather predictable, responses to warm water across regions within the CCE. Specifically, smaller-bodied individuals and species were prevalent in several surveys. In the north, the abundance of relatively large crustacean zooplankton was very low off Oregon (Brodeur et al., 2019a) while small and gelatinous (genus Pyrosoma) invertebrates were abundant in both the ocean and the guts of predators (Brodeur et al., 2019b). In northern California, krill Euphausia pacifica were much smaller than average (McClatchie et al., 2016b). In southern California, CalCOFI surveys demonstrated that the 2014–2015 surface warming induced shifts in the zooplankton assemblage similar to the 1992–1993 El Niño, while the 2015–2016 assemblage was closer to that of the 1997–1998 El Niño (Lilly and Ohman, 2018). Further south, two krill species, E. pacifica and Nematoscelis difficilis, decreased in biomass by 95% relative to the previous decade while several tropical krill species increased significantly off Baja California (Lavaniegos et al., 2019).
Data collected by NHL, PRS, RREAS, CalCOFI and IMECOCAL surveys also provided a look at coast-wide forage fish assemblage responses to the marine heatwave. These were more nuanced than for zooplankton but revealed that strong shifts in fish assemblage structure were synchronous throughout the region even though the particular taxa that drove the changes differed among regions (Thompson et al., 2019a). Overall, larval abundances were very high, and the assemblage was largely southern and offshore species. Species such as Pacific Sardine were observed spawning in the winter for the first time off Oregon (Auth et al., 2018). In central and southern California, abundances of southern, mesopelagic taxa were at record highs both in RREAS (Sakuma et al., 2016; Thompson et al., 2019b) and CalCOFI larval surveys (Thompson et al., 2021), which is consistent with past warm water events (Peabody et al., 2018). Atypically, Northern Anchovy (Thompson et al., 2019b) and multiple rockfishes (Schroeder et al., 2019) that previously flourished under cold conditions had extremely high recruitment from 2014 to 2016, and adult abundances of anchovy rose to record highs in subsequent years (Auth et al., 2018; Thompson et al., 2019b). In the southern CCE, larvae of the same mesopelagic species that increased in southern California decreased in northern Baja California, potentially due to a shift in preferred habitat, while larvae of demersal taxa increased (Uribe-Prado et al., 2021).
Fisheries survey data from RREAS and CalCOFI also contributed to understanding top predator dynamics during the marine heatwave. California sea lions (Zalophus californianus), which had endured unusual mortality events due to scarce prey prior to the heatwave (McClatchie et al., 2016a), fed copiously on the resurgent Northern Anchovy beginning in 2015 and had much enhanced pup condition from 2015 to 2018 (Thompson et al., 2019b). Humpback whales (Megaptera novaeangliae) were closer to shore than usual, likely to feed on anchovy, which caused more whale entanglements in Dungeness crab (Metacarcinus magister) fishing gear, greater whale mortality, and intermittent fishery closures (Santora et al., 2020). Catch of Pacific Bluefin tuna (Thunnus orientalis) by the commercial passenger fleet off California was very high, as tuna associated with warm water and foraged on anchovy (Runcie et al., 2019). Seabird population dynamics differed during and after the marine heatwave depending on prey needs. Species such as the Brandt’s cormorant (Phalacrocorax penicillatus), which are capable of feeding on anchovy and provide regurgitate to nourish chicks, had relative high production (Thompson et al., 2019b). In contrast, species that feed on krill and smaller prey, such as Cassin’s auklet (Ptychoramphus aleuticus), fared poorly (Jones et al., 2018).
At the air-sea interface, the ocean absorbs atmospheric CO2, resulting in a reduction in pH and changes in seawater carbonate chemistry. This process of ocean acidification (OA) leads to a reduction in available carbonate ions (and related saturation states), which are the building blocks for calcifying organisms such as mollusks, crustaceans, and bivalves (Doney et al., 2009). Due to the 47% increase in atmospheric CO2 since the beginning of the Industrial Age, OA is occurring faster than at any other time over the past 50 million years (Hönisch et al., 2012). The U.S. West Coast is particularly vulnerable to OA impacts because the CCE is an Eastern Boundary Upwelling System, and upwelling events bring more acidic waters into shallow and nearshore habitats (Feely et al., 2008). Studies suggest the rapid increase in atmospheric CO2 since the Industrial Age has contributed to the severity of these events (Gruber et al., 2012; Hauri et al., 2013). While fisheries surveys were not initially designed to evaluate or monitor OA vulnerability, they could provide a valuable source of information for the present and future.
Along the U.S. West Coast, oceanographic surveys like the NOAA Pacific Marine Ecosystem Laboratory West Coast Ocean Acidification (WCOA) cruises provide important data that support OA decision-making frameworks for the CCE. Data from these cruises were used to examine habitat suitability in the CCE for different life stages of pteropods, which are planktonic calcifiers (Bednaršek et al., 2014). Pteropods exhibited dissolution damage that scaled in severity with low aragonite saturation state conditions in the survey area, implying that OA will reduce the amount of optimal habitat for pteropods. An individual’s previous exposure history to low aragonite saturation conditions affected future survival in acidic conditions (Bednaršek et al., 2017). Life-stage specific critical thresholds for pteropods were sensitive to warming conditions, OA exposure duration, and other climate change stressors (Bednaršek et al., 2019). The inclusion of warming with OA exposure increased vulnerability to shell dissolution and survival (Bednaršek et al., 2019).
The suite of pteropod studies conducted by Bednaršek et al. (2014, 2017, 2019) is in large part based on data collected during the NOAA WCOA cruises and provides an example of the utility of ecosystem monitoring programs to investigate and ultimately enhance our understanding of emerging issues, like OA. While currently, of the U.S. West Coast fisheries surveys, only the CalCOFI Program collects carbonate chemistry data, fisheries surveys have the potential to add carbonate chemistry monitoring to their data collection with a relatively low investment (i.e., the cost of sensors, onboard flow-through pCO2 measurement systems, or seawater analysis costs for dissolved inorganic carbon and total alkalinity). Integration of these OA measurements would substantially increase spatial coverage of OA information on the West Coast, where the implications of OA are of high priority amongst the scientific and management communities. CalCOFI complements the WCOA data collection because it provides a multidecadal time series of dissolved inorganic carbon measurements starting in 1983 (Gallo et al., 2019) and it collects data during years when there are no WCOA cruises (WCOA cruises were conducted in 2007, 2011, 2012, 2013, 2016, 2017, and 2021).
Ocean acidification mitigation and preparedness strategies are critical for protecting ecosystems and economies and rely on understanding OA risk in a region and species vulnerabilities. As part of the International Alliance to Combat Ocean Acidification, the California Ocean Protection Council in cooperation with the Ocean Science Trust has developed the State of California Ocean Acidification Action Plan, which is the guiding document for the state to engage in strategies to mitigate and prepare for impacts of ocean acidification (OPC, 2018). A specific strategy in this Plan is to invest in monitoring and observation systems that couple environmental and biological monitoring associated with OA. Given the large spatial footprint of fisheries surveys and committed ship time, these surveys could address this Action Plan strategy by providing opportunities to link carbonate chemistry measurements with biological samples to examine ecosystem indicators of OA impacts. Together, oceanographic and experimental data can be used to develop reliable projections of OA impacts to support decision-making frameworks (Link, 2005).
The U.S. West Coast includes numerous important fisheries, ecologically significant areas, a broad diversity of species, and a vibrant tourism industry. At the same time, it also has dense human populations, the busiest marine ports in the nation, 23 offshore oil platforms, and diverse coastal industrial production. In addition, the steady rise in fisheries disasters driven by climate change (e.g., marine heatwaves, extreme weather; Bellquist et al., 2021) reflect the intensifying ecosystem impacts of greenhouse gases. The potential for environmental and economic disaster in the region’s ocean ecosystem, due to chance events and/or the unforeseen consequences of human activity, is therefore, high. When such disasters occur, data from fisheries surveys can provide context for the extent of impacts, and the short- and long-term ecosystem responses.
Ecosystem monitoring programs are perhaps most useful when they provide contextual information for the impacts of disasters. The southern California oil spill of Santa Barbara (1969) was an iconic ocean ecosystem disaster that was at least partially responsible for the modern environmental movement (Teal and Howarth, 1984; Clarke and Hemphill, 2002). The impacts of this unanticipated event was both acute and long lasting (Spezio, 2018). Following the spill, several studies demonstrated high mortality in nearby seabird, marine mammal, and intertidal communities (e.g., Foster et al., 1971). However, the population level impacts on subtidal taxa and fishes were less clear due to a lack of long-term prior baseline information. The value of fisheries surveys as an impact assessment tool was demonstrated in the aftermath of both the Exxon Valdez (1989) and Deepwater Horizon (2010) oil spills. In the former case, Thorne and Thomas (2008) used a decadal database of acoustic surveys of Prince William Sound Pacific Herring to demonstrate that collapse in that population was consistent, in time and duration, with oil spill impacts. In the latter case, Peterson et al. (2017) used catch data from two fishery-independent surveys to demonstrate a lack of spill-related impacts on food-web structure among large coastal fishes. In both cases, fishery survey data collected to inform routine stock assessments were used to examine ecosystem responses to the oil spills.
The frequency of marine ecosystem disasters in the United States has increased significantly during the last 34 years (Smith and Katz, 2013; Bellquist et al., 2021), and prevention of all unforeseen human-induced disasters to California’s coastal ecosystems is unlikely. In the case of a new ecosystem disaster, the rich array of fisheries surveys and ocean monitoring programs along the North American coast can provide detailed baseline data to identify coastal community and marine ecosystem impacts and inform environmental and economic impact assessments. For example, in response to the 2021 discovery of a vast dichloro-diphenyl-trichloroethane (DDT) waste dumping ground near Santa Catalina Island in southern California, a recently funded Moore Foundation project will use preserved CalCOFI ichthyoplankton samples to examine the spatio-temporal extent of DDT penetration in the California Current food web.
The goal of this paper is to demonstrate the value and breadth of ocean observing and ecosystem monitoring data collected by fisheries surveys, using the U.S. West Coast as an example. On the U.S. West Coast, fisheries surveys provide extensive additional spatial ecosystem monitoring coverage. When examining U.S. West Coast coverage of ocean monitoring based on a 0.1 degree resolution grid cell (11.1 km), we find that the combined area sampled by monitoring programs represented at the 2019 CalCOFI Symposium is about 189,000 km2. Of this area, 12% is sampled by both fisheries and non-fisheries surveys, 6% is sampled by only non-fisheries surveys, and 82% is sampled by only fisheries survey programs (Figure 4). Including fisheries surveys as essential components of ocean observing systems increases spatial coverage of ocean ecosystem monitoring on the U.S. West Coast by more than 75%; the increase in coverage is especially pronounced offshore (Figure 4). Additionally, these fisheries surveys have all been sampling from 2010 onward, meeting the IGMETS definition for sustained ocean time series, with four of the nine fisheries surveys having over 30 years of sampling coverage (Figure 2). Thus, fisheries surveys on the U.S. West Coast contribute substantially to sustained ecosystem observing goals. Fisheries surveys conducted by fisheries divisions in other countries (e.g., the Norwegian Institute of Marine Research (IMR), the Marine Institute of Peru (IMARPE), Fisheries and Oceans Canada (DFO), the Chilean Fisheries and Aquaculture Division (SUBPESCA), and the Marine Institute in Ireland) likely also contribute substantially to ocean observing goals. Compiled information about the data collected by fisheries surveys globally would greatly benefit the ocean observing community.
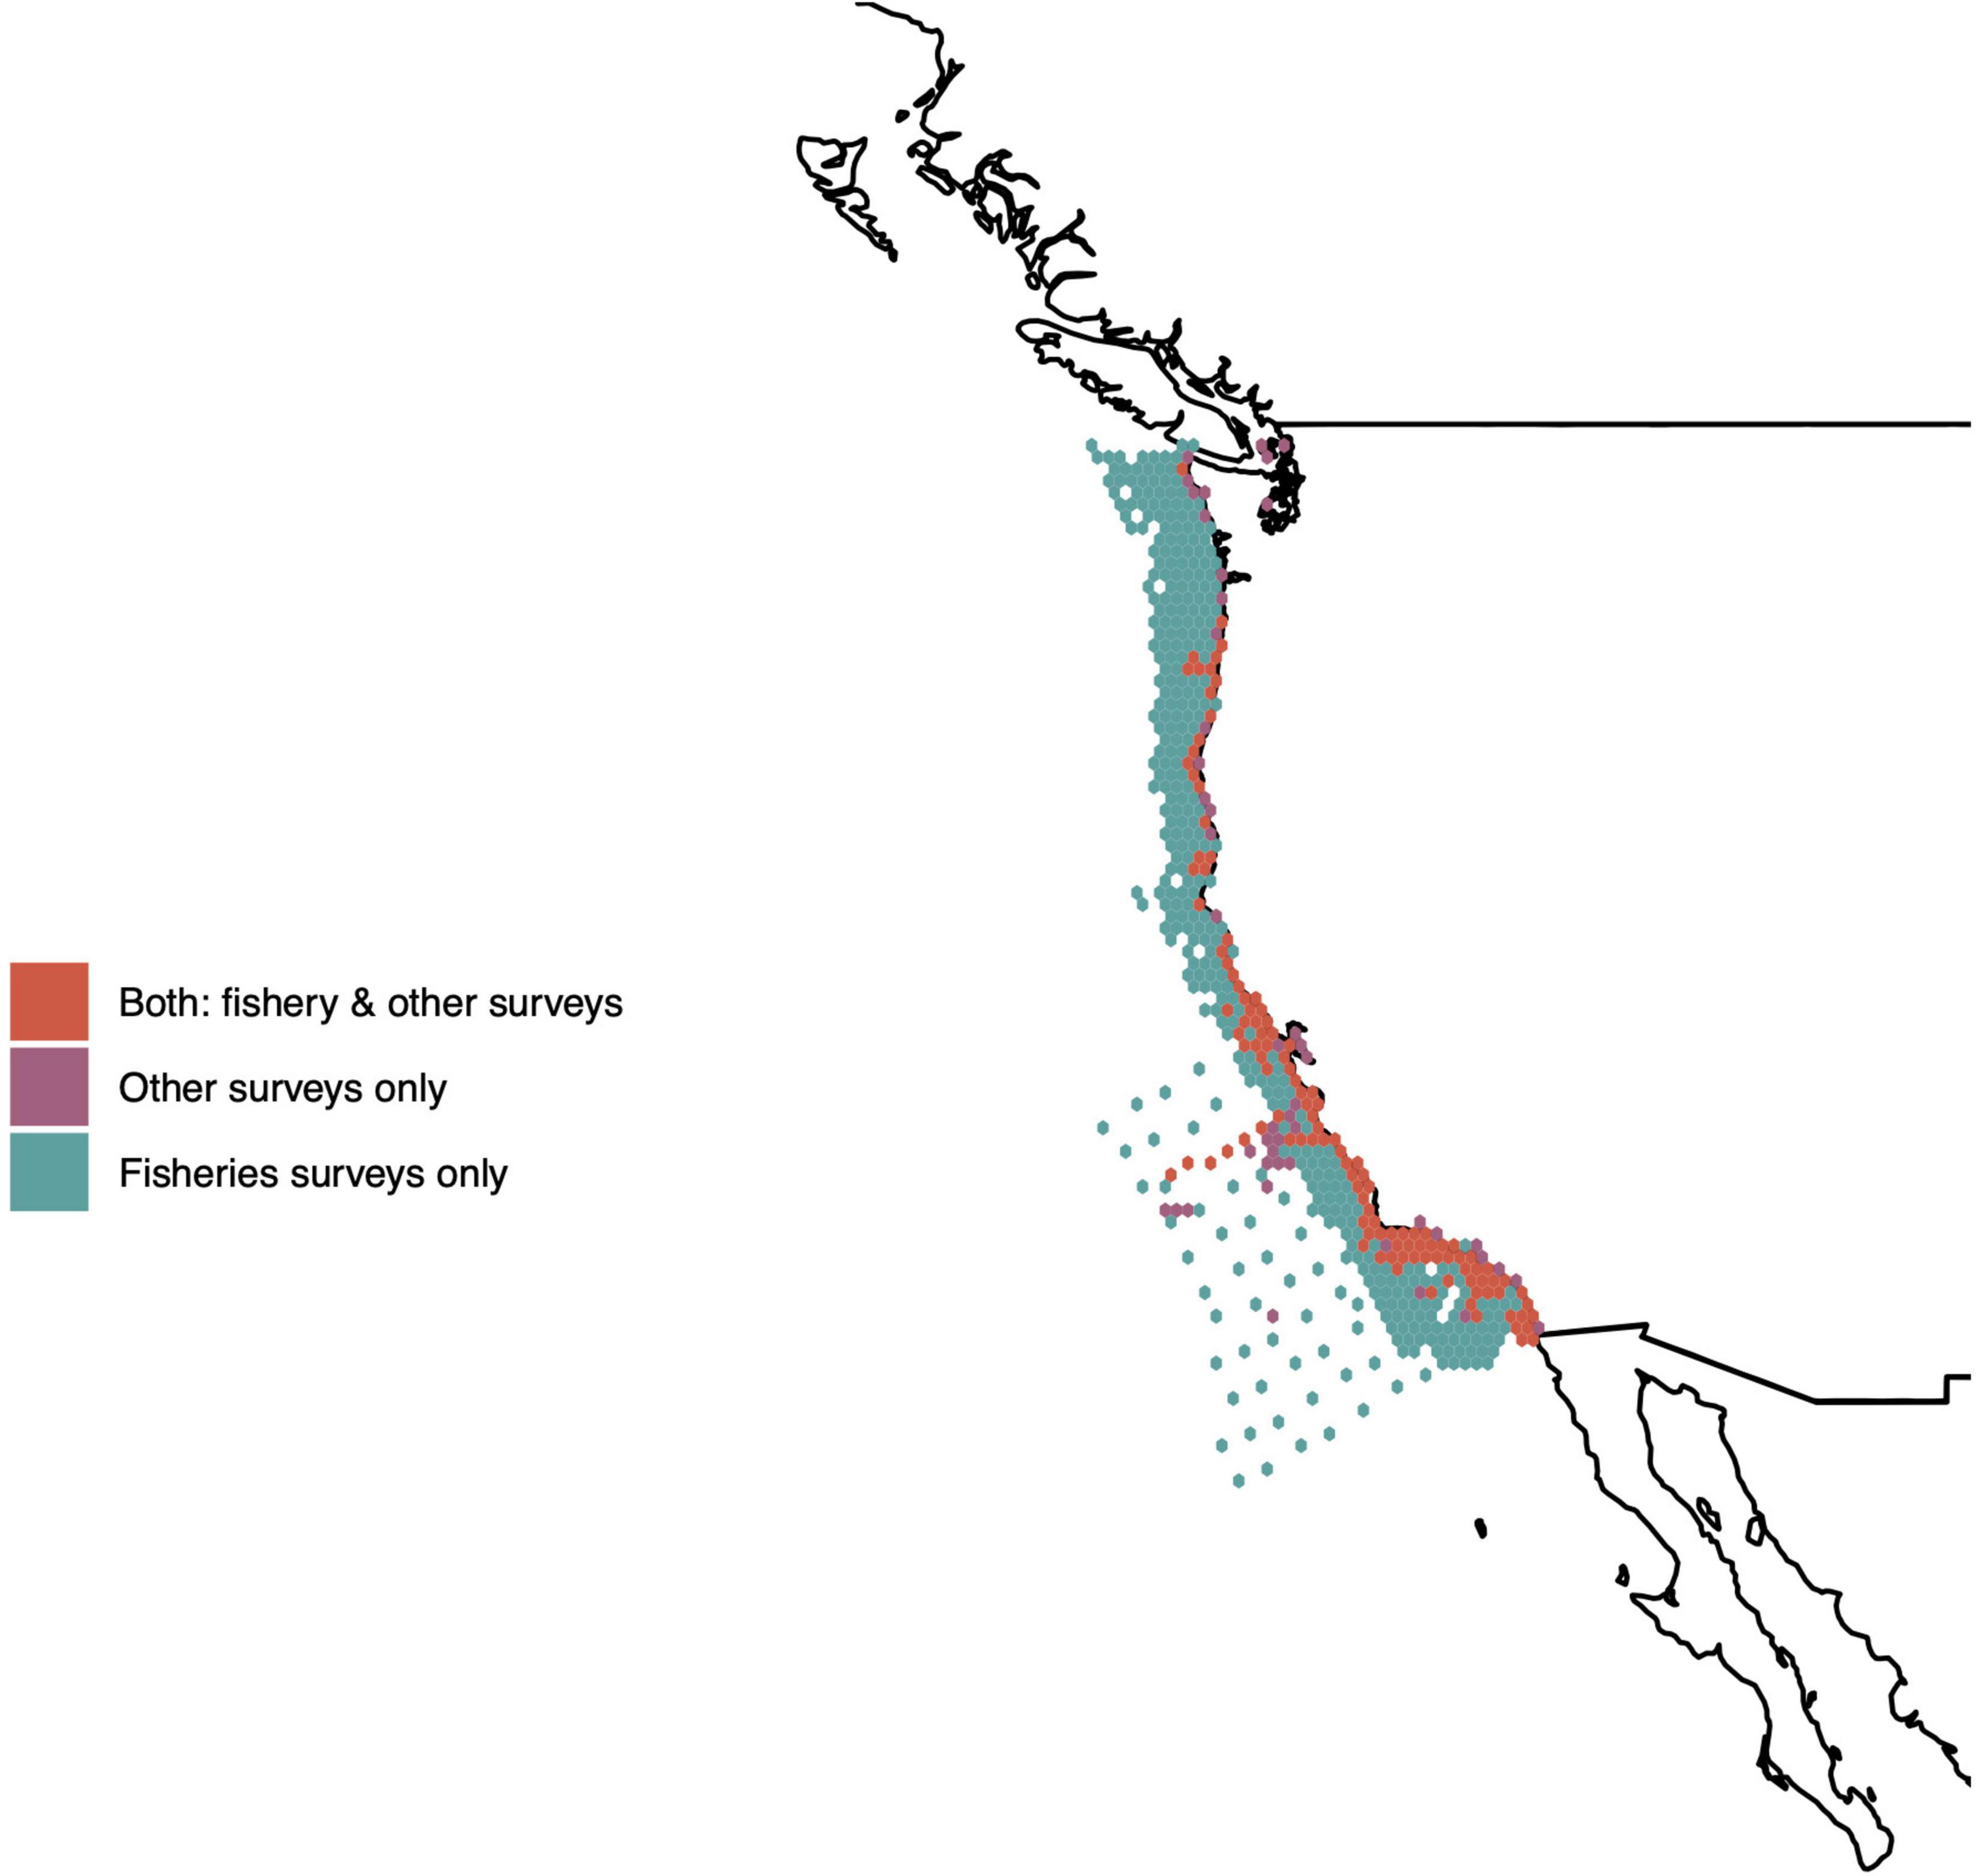
Figure 4. Spatial extent of U.S. West Coast ocean monitoring based on survey type, shown at a 0.1 degree resolution grid cell (11.1 km). Areas sampled only by fisheries surveys are shown in teal, areas sampled only by non-fisheries surveys are shown in purple, and areas sampled by both survey types are shown in red.
While the need for robust ocean time series only increases in the 21st century, both federal and academic monitoring programs struggle with the realities of rising ship time costs, and the challenges of maintaining historic time series while integrating new sampling approaches and revising survey designs. Building tools for new monitoring needs onto the existing blueprint of fisheries surveys can be a cost-effective way to address emerging regional challenges. Effective partnerships between federal fisheries surveys and academic programs give rise to more integrated, thorough regional monitoring by leveraging the strengths of both. For example, the partnerships between CalCOFI and the CCE LTER program, and between the RREAS, PRS, and the SBC MBON, have resulted in a broader breadth of EOVs being measured over a greater area on these surveys (Table 4). Fisheries surveys can offer ship time, a wealth of oceanographic and biological data, and sampling consistency that does not depend on shorter academic grant cycles. Academic partnerships can offer funding avenues for pursuing basic scientific questions, opportunities to test newer technologies such as eDNA or autonomous vehicles, and personnel time and student training opportunities through the university framework. Networks like LTER, MBON, and the United States Integrated Ocean Observing System (IOOS), can help individual programs coordinate across larger spatial scales and connect to national and international efforts.
By raising awareness about the different fisheries surveys and types of data collection, we hope to build more cooperative opportunities for the future. During the 2019 CalCOFI Symposium, it was clear that many fisheries surveys are open to collaboration with both one another and academic institutions and, in some cases, can collect samples for ancillary research projects. In accordance with the OPEN Government Data Act (Public Law, 2019), federal fisheries surveys in the United States are required to make data publicly accessible and have personnel time dedicated to support database upkeep and management. However, open access is not always the case for ocean time series programs, specifically internationally. An IGMETS survey found that 69% of zooplankton time series are controlled or restricted, meaning data are only available by contacting the data collector or institutional data manager, and only 13% had full online access (Benway et al., 2019). Phytoplankton, nutrient/pigment, and temperature/salinity data had slightly higher full online access availability, but controlled or restricted access to those datasets was still more common (Benway et al., 2019). Though United States fisheries survey data are required to be publicly available, there are survey-specific differences in terms of data and metadata structure and ease of use. There is no single data serving tool that houses all NOAA fisheries survey data, and such an effort would need to surmount considerable challenges in integrating survey-specific differences in survey design and sampling, including operations conducted by different regional NOAA offices (Tables 2, 3).
As oceans warm, marine ecosystems may change in unpredictable ways (Checkley et al., 2017; Thompson et al., 2019b). A robust and collaborative network of regional monitoring programs can more rapidly detect early signals of unanticipated changes and changes in species distributions, respond with additional focused sampling as needed, and support more informed and responsive management actions. Due to their large spatial footprints and sustained sampling, fisheries surveys represent a foundational blueprint for regional ecosystem monitoring in a time of global change. On the U.S. West Coast, they provide multi-decade ocean time series, increase the spatial extent of ocean ecosystem monitoring by over 75%, and provide coast to offshore data on multiple oceanographic and ecological variables deemed essential by the ocean observing community. However, even fisheries surveys are not immune to rising ship time costs and eroding agency budgets, and surveys that only indirectly inform fisheries management by providing ecosystem context are often at greater risk of losing funding than those directly informing fisheries stock assessments. Thus, recognizing the contributions of fisheries surveys to the collection of key ocean, climate, and biodiversity data is essential, as is maintaining public support for ocean observing and ecosystem monitoring. As the international community moves toward a global strategy for ocean observing, this program will need to (1) be multidisciplinary and based on best practices, (2) built on existing platforms, and (3) strengthen and expand the current capacities (Miloslavich et al., 2017). Fisheries surveys, both in the United States and globally, should play an important role as data contributors in the global ocean observing strategy.
NG and NB conceptualized and led the writing of the manuscript. NG, AT, and NB compiled information for the review. NG and ES produced manuscript figures and tables. NG, NB, AT, BS, ES, and BB contributed to writing and editing the manuscript. All authors contributed to the article and approved the submitted version.
NG was supported by a NOAA QUEST grant to BS. ES was supported by a California Cooperative Oceanic Fisheries Investigations (CalCOFI) partnership among California Sea Grant, Scripps Institution of Oceanography, National Oceanic and Atmospheric Administration (NOAA) Southwest Fisheries Science Center, and California Department of Fish and Wildlife. The University of Bergen Open Access Publishing agreement supported open access publication.
The authors declare that the research was conducted in the absence of any commercial or financial relationships that could be construed as a potential conflict of interest.
All claims expressed in this article are solely those of the authors and do not necessarily represent those of their affiliated organizations, or those of the publisher, the editors and the reviewers. Any product that may be evaluated in this article, or claim that may be made by its manufacturer, is not guaranteed or endorsed by the publisher.
We would like to thank Toby Auth, Julia Clemons, Julia Coates, John Field, Stephanie Flores, John Harms, Kym Jacobson, Aimee Keller, Kristen Koch, Kirk Lynn, Cheryl Morgan, Ben Ruttenberg, Kevin Stierhoff, William Watson, and Annie Yau who all provided feedback and comments that improved the manuscript. We would also like to thank all the 2019 CalCOFI Symposium presenters whose presentations inspired this manuscript, and all participants who provided survey coordinates. We would also like to thank Erica Mason for providing CCFRP coordinates.
Alin, S. R., Feely, R. A., Dickson, A. G., Hernández-Ayón, J. M., Juranek, L. W., Ohman, M. D., et al. (2012). Robust empirical relationships for estimating the carbonate system in the southern California current system and application to CalCOFI hydrographic cruise data (2005-2011). J. Geophys. Res 117:C05033. doi: 10.1029/2011JC007511
Allen, L. G., Pondella, D. J., and Horn, M. H. (2006). The Ecology of Marine Fishes: California and Adjacent Waters. Berkeley, CA: University of California Press, 670. doi: 10.1525/9780520932470
Auth, T. D., Daly, E. A., Brodeur, R. D., and Fisher, J. L. (2018). Phenological and distributional shifts in ichthyoplankton associated with recent warming in the northeast Pacific Ocean. Glob. Change Biol. 24, 259–272. doi: 10.1111/gcb.13872
Bednaršek, N., Feely, R. A., Howes, E. L., Hunt, B. P., Kessouri, F., León, P., et al. (2019). Systematic review and meta-analysis toward synthesis of thresholds of ocean acidification impacts on calcifying pteropods and interactions with warming. Front. Mar. Sci. 6:227. doi: 10.3389/fmars.2019.00227
Bednaršek, N., Feely, R. A., Reum, J. C. P., Peterson, B., Menkel, J., Alin, S. R., et al. (2014). Limacina helicina shell dissolution as an indicator of declining habitat suitability owing to ocean acidification in the California current ecosystem. Proc. R. Soc. B Biol. Sci. 281, 20140123. doi: 10.1098/rspb.2014.0123
Bednaršek, N., Feely, R. A., Tolimieri, N., Hermann, A. J., Siedlecki, S. A., Waldbusser, G. G., et al. (2017). Exposure history determines pteropod vulnerability to ocean acidification along the U.S. West Coast. Sci. Rep. 7, 1–12. doi: 10.1038/s41598-017-03934-z
Bellquist, L., Saccomanno, V., Semmens, B. X., Gleason, M., and Wilson, J. (2021). The rise in climate change-induced federal fishery disasters in the United States. PeerJ 9:e11186. doi: 10.7717/peerj.11186
Benway, H. M., Lorenzoni, L., White, A. E., Fiedler, B., Levine, N. M., Nicholson, D. P., et al. (2019). Ocean time series observations of changing marine ecosystems: an era of integration, synthesis, and societal applications. Front. Mar. Sci. 6:393. doi: 10.3389/fmars.2019.00393
Brodeur, R. D., Auth, T. D., and Phillips, A. J. (2019a). Major shifts in pelagic micronekton and macrozooplankton community structure in an upwelling ecosystem related to an unprecedented marine heatwave. Front. Mar. Sci. 6:212. doi: 10.3389/fmars.2019.00212
Brodeur, R. D., Hunsicker, M. E., Hann, A., and Miller, T. W. (2019b). Effects of warming ocean conditions on feeding ecology of small pelagic fishes in a coastal upwelling ecosystem: a shift to gelatinous food sources. Mar. Ecol. Prog. Ser. 617, 149–163. doi: 10.3354/meps12497
Checkley, D. M. Jr., Asch, R. G., and Rykaczewski, R. R. (2017). Climate, anchovy, and sardine. Annu. Rev. Mar. Sci. 9, 469–493. doi: 10.1146/annurev-marine-122414-033819
Checkley, D. M. Jr., Ortner, P., Settle, L., and Cummings, S. (1997). A continuous underway fish egg sampler. Fisher. Oceanogr. 6, 58–73. doi: 10.1046/j.1365-2419.1997.00030.x
Clarke, K. C., and Hemphill, J. J. (2002). The santa barbara oil spill, a retrospective. Yearbook Assoc. Pac. Coast Geogr. 64, 157–162. doi: 10.1353/pcg.2002.0014
Closek, C. J., Santora, J. A., Starks, H. A., Schroeder, I. D., Andruszkiewicz, E. A., Sakuma, K. M., et al. (2019). Marine vertebrate biodiversity and distribution within the central California Current using environmental DNA (eDNA) metabarcoding and ecosystem surveys. Front. Mar. Sci. 6:732. doi: 10.3389/fmars.2019.00732
Demer, D. A., Zwolinski, J. P., Byers, K. A., Cutter, G. R., Renfree, J. S., Sessions, T. S., et al. (2012). Prediction and confirmation of seasonal migration of Pacific sardine (Sardinops sagax) in the California current ecosystem. Fish. Bull. 110, 52–70. doi: 10.1093/icesjms/fst116
Denit, K. (2016). NOAA Fisheries Ecosystem-Based Fisheries Management Road Map. Washington, DC: NOAA, 50.
Doney, S. C., Fabry, V. J., Feely, R. A., and Kleypas, J. A. (2009). Ocean acidification: the other CO2 problem. Annu. Rev. Mar. Sci. 1, 169–192. doi: 10.1146/annurev.marine.010908.163834
Feely, R. A., Sabine, C. L., Hernandez-Ayon, J. M., Ianson, D., and Hales, B. (2008). Evidence for upwelling of corrosive” acidified” water onto the continental shelf. Science 320, 1490–1492. doi: 10.1126/science.1155676
Field, J. C., Miller, R. R., Santora, J. A., Tolimieri, N., Haltuch, M. A., Brodeur, R. D., et al. (2021). Spatiotemporal patterns of variability in the abundance and distribution of winter-spawned pelagic juvenile rockfish in the California current. PLoS One 16:e0251638. doi: 10.1371/journal.pone.0251638
Foster, M., Neushul, M., and Zingmark, R. (1971). The Santa Barbara Oil Spill Part 2: initial effects on intertidal and kelp bed organisms. Envirno. Pollut. 2, 115–134. doi: 10.1016/0013-9327(71)90015-2
Friedman, W. R., Santora, J. A., Schroeder, I. D., Huff, D. D., Brodeur, R. D., Field, J. C., et al. (2018). Environmental and geographic relationships among salmon forage assemblages along the continental shelf of the California current. Mar. Ecol. Prog. Ser. 596, 181–198. doi: 10.3354/meps12598
Gallo, N. D., Drenkard, E., Thompson, A. R., Weber, E. D., Wilson-Vandenberg, D., McClatchie, S., et al. (2019). Bridging from monitoring to solutions-based thinking: lessons from CalCOFI for understanding and adapting to marine climate change impacts. Front. Mar. Sci. 6:695. doi: 10.3389/fmars.2019.00695
García-Reyes, M., Sydeman, W. J., Schoeman, D. S., Rykaczewski, R. R., Black, B. A., Smith, A. J., et al. (2015). Under pressure: climate change, upwelling, and eastern boundary upwelling ecosystems. Front. Mar. Sci. 2:109. doi: 10.3389/fmars.2015.00109
Gruber, N., Hauri, C., Lachkar, Z., Loher, D., Frölicher, T. L., and Plattner, G.-K. (2012). Rapid progression of ocean acidification in the California current system. Science 337, 220–223. doi: 10.1126/science.1216773
Harvell, C. D., Montecino-Latorre, D., Caldwell, J. M., Burt, J. M., Bosley, K., Keller, A., et al. (2019). Disease epidemic and a marine heat wave are associated with the continental-scale collapse of a pivotal predator (Pycnopodia helianthoides). Sci. Adv. 5:eaau7042. doi: 10.1126/sciadv.aau7042
Harvey, C. J., Garfield, N., Williams, G. D., and Tolimieri, N. (2021). Ecosystem Status Report of the California Current for 2020–21: A Summary of Ecosystem Indicators Compiled by the California Current Integrated Ecosystem Assessment Team (CCIEA). Washington, DC: U.S. Department of Commerce.
Hauri, C., Gruber, N., Vogt, M., Doney, S. C., Feely, R. A., Lachkar, Z., et al. (2013). Spatiotemporal variability and long-term trends of ocean acidification in the California Current System. Biogeosciences 10, 193–216.
Hewitt, R. P. (1988). Historical review of the oceanographic approach to fishery research. CalCOFI Rep. 29, 27–41.
Holsman, K. K., Haynie, A. C., Hollowed, A. B., Reum, J. C. P., Aydin, K., Hermann, A. J., et al. (2020). Ecosystem-based fisheries management forestalls climate-driven collapse. Nat. Commun. 11:4579. doi: 10.1038/s41467-020-18300-3
Hönisch, B., Ridgwell, A., Schmidt, D. N., Thomas, E., Gibbs, S. J., Sluijs, A., et al. (2012). The geological record of ocean acidification. Science 335, 1058–1063. doi: 10.1126/science.1208277
Jacox, M. G., Alexander, M. A., Bograd, S. J., and Scott, J. D. (2020). Thermal displacement by marine heatwaves. Nature 584, 82–86. doi: 10.1038/s41586-020-2534-z
Jacox, M. G., Alexander, M. A., Mantua, N. J., Scott, J. D., Hervieux, G., Webb, R. S., et al. (2018). Forcing of multiyear extreme ocean temperatures that impacted California Current living marine resources in 2016. [in “explaining extreme events of 2016 from a climate perspective”]. Bull. Am. Meteor. Soc. 99, S27–S33. doi: 10.1175/BAMS-D-17-0119.1
Jones, T., Parrish, J. K., Peterson, W. T., Bjorkstedt, E. P., Bond, N. A., Ballance, L. T., et al. (2018). Massive mortality of a planktivorous seabird in response to a marine heatwave. Geophys. Res. Lett. 45, 3193–3202. doi: 10.1002/2017gl076164
Kämpf, J., and Chapman, P. (2016). “The california current upwelling system,” in Upwelling Systems of the World, eds K. A. Adams and J. A. Barth (Cham: Springer), 97–160. doi: 10.1007/978-3-319-42524-5_4
Karp, M. A., Peterson, J. O., Lynch, P. D., Griffis, R. B., Adams, C. F., Arnold, W. S., et al. (2019). Accounting for shifting distributions and changing productivity in the development of scientific advice for fishery management. ICES J. Mar. Sci. 76, 1305–1315. doi: 10.1093/icesjms/fsz048
Kavanaugh, M. T., Oliver, M. J., Chavez, F. P., Letelier, R. M., Muller-Karger, F. E., and Doney, S. C. (2016). Seascapes as a new vernacular for pelagic ocean monitoring, management, and conservation. ICES J. Mar. Sci. 73, 1839–1850. doi: 10.1093/icesjms/fsw086
Keller, A. A., Ciannelli, L., Wakefield, W. W., Simon, V., Barth, J. A., and Pierce, S. D. (2017). Species-specific responses of demersal fishes to near-bottom oxygen levels within the California current large marine ecosystem. Mar. Ecol. Prog. Ser. 568, 151–173. doi: 10.3354/meps12066
Keller, A. A., Harms, J. H., Wallace, J. R., Jones, C., Benante, J. A., and Chappell, A. (2019). Changes in long-lived rockfishes after more than a decade of protection within California’s largest marine reserve. Mar. Ecol. Prog. Ser. 623, 175–193. doi: 10.3354/meps13019
Lavaniegos, B. E., Jimenez-Herrera, M., and Ambriz-Arreola, I. (2019). Unusually low euphausiid biomass during the warm years of 2014-2016 in the transition zone of the California Current. Deep Sea Res. Part 2-Top. Stud. Oceanogr. 16:104638. doi: 10.1016/j.dsr2.2019.104638
Levin, P. S., Fogarty, M. J., Murawski, S. A., and Fluharty, D. (2009). Integrated ecosystem assessments: developing the scientific basis for ecosystem-based management of the ocean. PLoS Biol. 7:e14. doi: 10.1371/journal.pbio.1000014
Lilly, L. E., and Ohman, M. D. (2018). CCE IV: El Niño-related zooplankton variability in the southern California Current System. Deep Sea Res. Part 1 Oceanogr. Res. Pap. 140, 36–51. doi: 10.1080/15548627.2015.1100356
Lindstrom, E., Gunn, J., Fischer, A., McCurdy, A., and Glover, L. K. (2012). A Framework for Ocean Observing. By the Task Team for an Integrated Framework for Sustained Ocean Observing. Paris: UNESCO, doi: 10.5270/OceanObs09-FOO
Link, J. S. (2005). Translating ecosystem indicators into decision criteria. ICES J. Mar. Sci. 62, 569–576. doi: 10.1016/j.icesjms.2004.12.015
Lynch, P. D., Methot, R. D., and Link, J. S. (eds) (2018). Implementing a Next Generation Stock Assessment Enterprise. An Update to the NOAA Fisheries Stock Assessment Improvement Plan. Silver Spring, MA: NOAA, 137. doi: 10.7755/TMSPO.183
Mason, E. T., Kellum, A. N., Chiu, J. A., Waltz, G. T., Murray, S., Wendt, D. E., et al. (2020). Long-term participation in collaborative fisheries research improves angler opinions on marine protected areas. PeerJ 8:e10146. doi: 10.7717/peerj.10146
McClatchie, S. (2014). Regional Fisheries Oceanography of the California current system and the CalCOFI Program. Berlin: Springer, 235.
McClatchie, S., Goericke, R., Leising, A. L., Auth, T. D., Bjorkstedt, E., Robertson, R. R., et al. (2016b). State of the California current 2015–16: comparisons with the 1997–98 El Niño. CalCOFI Rep. 57, 1–57.
McClatchie, S., Field, J. C., Thompson, A. R., Gerrodette, T., Lowry, M., Fiedler, P. C., et al. (2016a). Food limitation of sea lion pups and the decline of forage off central and southern California. R. Soc. Open Sci. 3:150628. doi: 10.1098/rsos.150628
Miloslavich, P., Bax, N. J., Simmons, S. E., Klein, E., Appeltans, W., Aburto-Oropeza, O., et al. (2017). Essential ocean variables for global sustained observations of biodiversity and ecosystem changes. Glob. Chang. Biol. 24, 2416–2433. doi: 10.1111/gcb.14108
Monaco, M. E., Spooner, E., Oakes, S. A., Harvey, C. J., and Kelble, C. R. (2021). Introduction to the NOAA integrated ecosystem assessment program: advancing ecosystem based management. Coast. Manag. 49, 1–8. doi: 10.1080/08920753.2021.1846109
Morgan, C. A., Beckman, B. R., Weitkamp, L. A., and Fresh, K. L. (2019). Recent ecosystem disturbance in the Northern california current. Fisheries 44, 465–474. doi: 10.1002/fsh.10273
NMFS (2007). Magnuson-Stevens Fishery Conservation and Management Act. Silver Spring, MA: NOAA, 178.
O’Brien, T. D., Lorenzoni, L., Isensee, K., and Valdés, L. (eds) (2017). What are Marine Ecological Time Series Telling us about the Ocean? A Status Report. IOC-UNESCO, IOC Technical Series, No. 129. Paris: IOC-UNESCO, 297.
OPC (2018). State of California Ocean Acidification Action Plan. Sacramento, CA: Ocean Protection Council, 62.
Ohman, M. D., and Lavaniegos, B. E. (2002). Comparative zooplankton sampling efficiency of a ring net and bongo net with comments on pooling of subsamples. CalCOFI Rep. 43, 162–173.
Olson, R. J., and Sosik, H. M. (2007). A submersible imaging-in-flow instrument to analyze nano-and microplankton: Imaging FlowCytobot. L&O Methods 5, 195–203. doi: 10.4319/lom.2007.5.195
Peabody, C. E., Thompson, A. R., Sax, D. F., Morse, R. E., and Perretti, C. T. (2018). Decadal regime shifts in southern California’s ichthyoplankton assemblage. Mar. Ecol. Prog. Ser. 607, 71–83. doi: 10.3354/meps12787
Pereira, H. M., Ferrier, S., Walters, M., Geller, G. N., Jongman, R. H. G., Scholes, R. J., et al. (2013). Essential biodiversity variables. Science 339, 277–278. doi: 10.1126/science.1229931
Peterson, C. T., Grubbs, R. D., and Mickle, A. (2017). An investigation of effects of the deepwater horizon oil spill on coastal fishes in the Florida big bend using fishery-independent surveys and stable isotope analysis. Southeastern Nat. 16, G93–G108. doi: 10.1656/058.016.0101
Pincetich, C., and Drill, S. (2021). California Naturalist Series: Natural History of the California Current. Davis, CA: UC ANR Publication, doi: 10.3733/ucanr.8684
Public Law. (2019). Foundations for Evidence-Based Policymaking Act of 2018. 115th Congress. Washington, DC: U.S. Government Publishing OfficE.
Ralston, S., Field, J. C., and Sakuma, K. M. (2013). Interannual variation in pelagic juvenile rockfish (Sebastes spp.) abundance – going with the flow. Fish. Oceanogr. 22, 288–308. doi: 10.1111/fog.12022
Ralston, S., and Stewart, I. J. (2013). Anomalous distributions of pelagic juvenile rockfish on the US west coast in 2005 and 2006. CalCOFI Rep. 54, 155–166.
Runcie, R. M., Muhling, B., Hazen, E. L., Bograd, S. J., Garfield, T., and DiNardo, G. (2019). Environmental associations of Pacific bluefin tuna (Thunnus orientalis) catch in the California current system. Fish. Oceanogr. 28, 372–388. doi: 10.1111/fog.12418
Ruzicka, J. J., Daly, E. A., and Brodeur, R. D. (2016). Evidence that summer jellyfish blooms impact Pacific Northwest salmon production. Ecosphere 7:e01324. doi: 10.1002/ecs2.1324
Sakuma, K. M., Field, J. C., Mantua, N. J., Ralston, S., Marinovich, B. B., and Carrion, C. N. (2016). Anomalous epipelagic micronekton assemblage patterns in the neritic waters of the California Current in spring 2015 during a period of extreme ocean conditions. CalCOFI Rep. 57, 163–183.
Sakuma, K. M., Ralston, S., and Wespestad, V. G. (2006). Interannual and spatial variation in the distribution of young-of-the-year rockfish (Sebastes spp.): expanding and coordinating a survey sampling frame. Calif. Cooper. Ocean. Fish. Investig. Rep. 47, 127–139.
Santora, J. A., Mantua, N. J., Schroeder, I. D., Field, J. C., Hazen, E. L., Bograd, S. J., et al. (2020). Habitat compression and ecosystem shifts as potential links between marine heatwave and record whale entanglements. Nat. Commun. 11:536. doi: 10.1038/s41467-019-14215-w
Santora, J. A., Sydeman, W. J., Schroeder, I. D., Wells, B. K., and Field, J. C. (2011). Mesoscale structure and oceanographic determinants of krill hotspots in the California current: implications for trophic transfer and conservation. Prog. Oceanogr. 91, 397–409. doi: 10.1016/j.pocean.2011.04.002
Scheiber, H. N. (1990). California marine research and the founding of modern fisheries oceanography: CalCOFI’s early years, 1947-1964. CalCOFI Rep. 31, 63–83.
Schroeder, I. D., Santora, J. A., Bograd, S. J., Hazen, E. L., Sakuma, K. M., Moore, A. M., et al. (2019). Source water variability as a driver of rockfish recruitment in the California current ecosystem: implications for climate change and fisheries management. Can. J. Fish. Aquat. Res. 76, 950–960. doi: 10.1139/cjfas-2017-0480
Smith, A. B., and Katz, R. W. (2013). U.S. billion-dollar weather and climate disasters: data sources, trends, accuracy and biases. Nat. Haz. 67, 387–410. doi: 10.1007/s11069-013-0566-5
Smith, P. E. (1978). Precision of sonar mapping for pelagic fish assessment in the California current. ICES J. Mar. Sci. 38, 33–40. doi: 10.1093/icesjms/38.1.33
Spezio, T. S. (2018). Slick Policy: Environmental and Science Policy in the Aftermath of the Santa Barbara Oil Spill. Pittsburgh, PA: University of Pittsburgh Press, 248. doi: 10.2307/j.ctvqhv2d
Starr, R. M., Wendt, D. E., Barnes, C. L., Marks, C. I., Malone, D., Waltz, G., et al. (2015). Variation in responses of fishes across multiple reserves within a network of marine protected areas in temperate waters. PLoS One 10:e0118502. doi: 10.1371/journal.pone.0118502
Stierhoff, K. L., Zwolinksi, J. P., and Demer, D. A. (2019). Distribution, Biomass, and Demography of Coastal Pelagic Fishes in the California Current Ecosystem During Summer 2018 Based on Acoustic-Trawl Sampling. Washington, DC: U.S. Department of Commerce.
Teal, J. M., and Howarth, R. W. (1984). Oil spill studies: a review of ecological effects. Environ. Manag. 8, 27–43. doi: 10.1007/bf01867871
Thompson, A. R., Ben-Aderet, N., Bowlin, N. M., Kacev, D., Swalethorp, R., and Watson, W. (2021). Putting the great marine heat wave into perspective: the larval fish assemblages off southern California in 2014-2016 relative to the previous 65 years. Glob. Change Biol. Rev. 43, 1241–1248. doi: 10.1111/gcb.16010
Thompson, A. R., Chen, D. C., Guo, L. W., Hyde, J. R., and Watson, W. (2017a). Larval abundances of rockfishes that were historically targeted by fishing increased over 16 years in association with large marine protected area. R. Soc. Open Sci. 4:170639. doi: 10.1098/rsos.170639
Thompson, A. R., Harvey, C. J., Sydeman, W. J., Barceló, C., Bograd, S. J., Brodeur, R. D., et al. (2019a). Indicators of pelagic forage community shifts in the California current large marine ecosystem, 1998–2016. Ecol. Indic. 105, 215–228. doi: 10.1016/j.ecolind.2019.05.057
Thompson, A. R., McClatchie, S., Weber, E. D., Watson, W., and Lennert-Cody, C. E. (2017b). Correcting for bias in CalCOFI ichthyoplankton abundance estimates associated with the 1977 transition from ring to bongo net sampling. CalCOFI Rep. 58, 113–123.
Thompson, A. R., Schroeder, I. D., Bograd, S. J., Hazen, E. L., Jacox, M. G., Leising, A. L., et al. (2019b). State of the California current 2018-19: a novel anchovy regime and a new marine heatwave? CalCOFI Rep. 60, 1–65.
Thorne, R. E., and Thomas, G. L. (2008). Herring and the “Exxon Valdez” oil spill: an investigation into historical data conflicts. ICES J. Mar. Sci. 65, 44–50. doi: 10.1093/icesjms/fsm176
Uribe-Prado, A. G., Aceves-Medina, G., Saldierna-Martinez, R. J., Jimenez-Rosemberg, S. P. A., Durazo, R., Avedaνo-Ibarra, R., et al. (2021). Dynamics of fish larvae assemblages in the Southern california current region off México during a period of strong warm-water anomalies. Fish. Oceanogr. Rev. 2021, 176760.
Weber, E. D., Auth, T. D., Baumann-Pickering, S., Baumgartner, T. R., Bjorkstedt, E. P., Bograd, S. J., et al. (2021). State of the California current 2019–2020: back to the future with marine heatwaves? Front. Mar. Sci. 8:709454. doi: 10.3389/fmars.2021.709454
Wells, B. K., Santora, J. A., Henderson, M. J., Warzybok, P., Jahncke, J., Bradley, R. W., et al. (2017). Environmental conditions and prey-switching by a seabird predator impact juvenile salmon survival. J. Mar. Sys. 174, 54–63. doi: 10.1016/j.jmarsys.2017.05.008
WMO (2016). The Global Observing System for Climate: Implementation Needs. Geneva: World Meteorological Organization, 325.
Zwolinski, J. P., Demer, D. A., Byers, K. A., Cutter, G. R., Renfree, J. S., Sessions, T. S., et al. (2012). Distributions and abundances of Pacific sardine (Sardinops sagax) and other pelagic fishes in the California current ecosystem during spring 2006, 2008, and 2010, estimated from acoustic–trawl surveys. Fish. Bull. 110, 110–122.
Keywords: ocean observing, ecological time series, fisheries survey, essential biodiversity variable, essential ocean variable, ecosystem management, ocean acidification, marine heatwave
Citation: Gallo ND, Bowlin NM, Thompson AR, Satterthwaite EV, Brady B and Semmens BX (2022) Fisheries Surveys Are Essential Ocean Observing Programs in a Time of Global Change: A Synthesis of Oceanographic and Ecological Data From U.S. West Coast Fisheries Surveys. Front. Mar. Sci. 9:757124. doi: 10.3389/fmars.2022.757124
Received: 11 August 2021; Accepted: 05 January 2022;
Published: 02 March 2022.
Edited by:
Atsushi Matsuoka, University of New Hampshire, United StatesReviewed by:
Keita Suzuki, Kyoto University, JapanCopyright © 2022 Gallo, Bowlin, Thompson, Satterthwaite, Brady and Semmens. This is an open-access article distributed under the terms of the Creative Commons Attribution License (CC BY). The use, distribution or reproduction in other forums is permitted, provided the original author(s) and the copyright owner(s) are credited and that the original publication in this journal is cited, in accordance with accepted academic practice. No use, distribution or reproduction is permitted which does not comply with these terms.
*Correspondence: Natalya D. Gallo, bmF0YWx5YS5nYWxsb0B1aWIubm8=
Disclaimer: All claims expressed in this article are solely those of the authors and do not necessarily represent those of their affiliated organizations, or those of the publisher, the editors and the reviewers. Any product that may be evaluated in this article or claim that may be made by its manufacturer is not guaranteed or endorsed by the publisher.
Research integrity at Frontiers
Learn more about the work of our research integrity team to safeguard the quality of each article we publish.