 D.D.N Wimalarathne1,2,3†
 Weiwei Ruan1,2†
 Xun Sun1,2
 Fang Liu1,2
 Yongkang Gai1,2Qingyao Liu1,2
 Fan Hu1,2
 Xiaoli Lan1,2*
- 1Department of Nuclear Medicine, Union Hospital, Tongji Medical College, Huazhong University of Science and Technology, Wuhan, China
- 2Hubei Province Key Laboratory of Molecular Imaging, Union Hospital, Tongji Medical College, Huazhong University of Science and Technology, Wuhan, China
- 3Department of Radiography and Radiotherapy, Faculty of Allied Health Sciences, General Sir John Kotelawala Defence University, Rathmalana, Sri Lanka
Objective: To explore the impact of the time-of-flight (TOF) reconstruction on brain PET with short-lived 11C-labeled tracers in PET magnetic resonance (PET/MR) brain images among suspected patients with Alzheimer's and Parkinson's disease (AD/PD).
Methods: Patients who underwent 11C-2-ß-carbomethoxy-3-b-(4-fluorophenyl) tropane (11C-CFT) and 2-(4-N-[11C] methylaminophenyl)-6-hydroxybenzothiazole (11C-PiB) PET/MRI were retrospectively included in the study. Each PET LIST mode data were reconstructed with and without the TOF reconstruction algorithm. Standard uptake values (SUVs) of Caudate Nucleus (CN), Putamen (PU), and Whole-brain (WB) were measured. TOF and non-TOF SUVs were assessed by using paired t-test. Standard formulas were applied to measure contrast, signal-to-noise ratio (SNR), and percentage relative average difference of SUVs (%RAD-SUVs).
Results: Total 75 patients were included with the median age (years) and body mass index (BMI-kg/m2) of 60.2 ± 10.9 years and 23.9 ± 3.7 kg/m2 in 11C-CFT (n = 41) and 62.2 ± 6.8 years and 24.7 ± 2.9 kg/m2 in 11C-PiB (n = 34), respectively. Higher average SUVs and positive %RAD-SUVs were observed in CN and PU in TOF compared with non-TOF reconstructions for the two 11C-labeled radiotracers. Differences of SUVmean were significant (p < 0.05) in CN and PU for both 11C-labeled radiotracers. SUVmax was enhanced significantly in CN and PU for 11C-CFT and CN for 11C-PiB, but not in PU. Significant contrast enhancement was observed in PU for both 11C-labeled radiotracers, whereas SNR gain was significant in PU, only for 11C-PiB in TOF reconstruction.
Conclusion: Time-of-flight leads to a better signal vs. noise trade-off than non-TOF in 11C-labeled tracers between CN and PU, improving the SUVs, contrast, and SNR, which were valuable for reducing injected radiation dose. Improved timing resolution aided the rapid decay rate of short-lived 11C-labeled tracers, and it shortened the scan time, increasing the patient comfort, and reducing the motion artifact among patients with AD/PD. However, one should adopt the combined TOF algorithm with caution for the quantitative analysis because it has different effects on the SUVmax, contrast, and SNR of different brain regions.
Introduction
Alzheimer's disease (AD) and Parkinson's disease (PD) are the most common neurodegenerative diseases in the elderly. AD is caused due to abnormal build-up of amyloid and tau proteins in and around the neurons which disrupt the function of the neurons by triggering the neuronal damage or eventually dead cells, particularly in the cortex and hippocampus, whereas PD affects predominantly dopaminergic neurons in a specific area in the brain called substantia nigra (1, 2). In the diagnosis of AD/PD or differentiation of mild cognitive impairment (MCI) and AD from normal aging, it is essential to investigate the variations of metabolic activity and characteristic patterns of radiotracers with PET in key brain regions (3–7).
In recent years, the hybrid PET/MRI was developed successfully and has entered clinical practice. The hybrid PET/MRI, like two high-end technologies, can simultaneously obtain images of PET and MRI, which provide excellent anatomic information and functional MRI parameters with the metabolic and molecular information as a one-stop-shop. Therefore, the hybrid PET/MRI has always been used for neurodegenerative diseases, especially showing great potential for differential diagnosis of early AD/PD with some specific PET tracer (8–10). Among a tracer targeted dopamine transporters (DATs) level for early diagnosis of PD is 11C labeled cocaine derivative, i.e., 11C-2-ß-carbomethoxy-3-b-(4-fluorophenyl) tropane (11C-CFT) (8). In the patients with PD, the DATs level will change, and the PET images with 11C-CFT will show the asymmetrical reduction in the caudate nucleus (CN) or putamen (PU). The Pittsburgh compound B, i.e., 2-(4-N-[11C] methylaminophenyl)-6-hydroxybenzothiazole (11C-PiB) is a benzothiazole derivative of thioflavin T that is used to image beta-amyloid deposits in AD (9), and the corresponding PET images with 11C-PiB will show the diffuse uptake in the brain. However, the synthesis and quality control of 11C-CFT and 11C-PiB are complicated processes which are followed by high-performance liquid chromatography (HPLC) purification (9, 10). As well, 11C radioisotope tends to decay fast within a half-life (T1/2) of 20.38 min. In theory T1/2 = 0.693/λ where λ is the decaying constant and radioactivity (A) at a “t” time measured by A = A0eλt where A0is the radioactivity at time zero (t = 0). Accordingly, shorten T1/2 tends to decrease the A at a given time elapsed. Hence, improvising the PET image acquisition and reconstruction became more important for brain PET with short-lived radiotracers. Uptake time of said 11C-labeled tracers is ~40–60 min as mentioned in Table 1, where after consecutive 2T1/2 to 3T1/2 it remains A0/4 to A0/8 of original radioactivity within the body. Thus, it is found challenging to image under a low count field with existing conventional PET scanners (11).
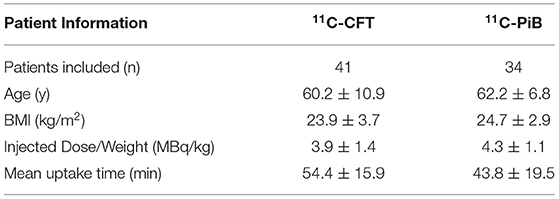
Table 1. Basic information of the patient.
Clinical PET image quality has drastically improved by utilizing several advanced reconstruction techniques, i.e., time-of-flight (TOF) reconstruction technology (12). The TOF system measures and records the time difference of two coincident photons and improves the activity localization by more accurately identifying an annihilation event along a line of response (LOR) (13). Thus, TOF effects on the gain in signal-to-noise ratio (SNR) (14) further, TOF results in a faster and more uniform convergence with three-dimensional (3D) iterative reconstruction (15).
In the past decade, it was proved that larger patients (BMI ≥ 25.0 kg/m2) are benefitted from the TOF technique (16). Since, TOF reconstruction acts as a weight equalizer, gaining consistent image quality among patients, regardless of weight and size (17). Improved small lesion detection is reported among several TOF PET/MRI studies (18–22). Further improved TOF contributes in the reduction of injected radiation dose to the patient, so as lowering the radiation dose to the medical and general public (23). Budinger et al. elaborated that the TOF sensitivity gain equal to D/Δx (D is the object diameter and Δx =(C*Δt/2) where C is the speed of the light and Δt is the full-width at half-maximum (FWHM) of the timing resolution of the scanner (24). Accordingly, it is proven that TOF gain is inversely proportionate with the time resolution of the PET detector system. The time resolution was significantly improved by the invention of newer embedded semiconductor detectors (e.g., SiPM) for PET by featuring TOF in PET/MR systems (15, 25, 26). Since scan time is reduced while keeping the same image quality (11). Subsequently, TOF vs. brain PET clinical studies were conducted in recent years (27, 28). Yet, to our knowledge, few studies have been conducted to assess the TOF reconstruction techniques for brain PET with short-lived 11C-labeled tracers (29).
This study explored the effects of the TOF reconstruction technique on brain PET quantification with short-lived 11C-CFT and 11C-PiB in hybrid PET/MR brain imaging among suspected patients with AD/PD. Since 11C-PiB showed a diffuse uptake throughout the whole-brain, the quantification evaluation for PET with TOF reconstruction was carried for the whole brain. The 11C-CFT uptake was mainly focused on CN and PU regions. Hence, we evaluated the effect of TOF reconstruction on CN and PU volume of interests (VOIs) for 11C-CFT brain PET, and the effects on CN and PU VOIs for 11C-PiB brain PET were also further evaluated for comparing with the results from 11C-CFT to investigate whether the effects of TOF technique were related with different tracer. The key purpose of this study was to determine if quantification differences are present in TOF compared with the non-TOF technique among short-lived 11C- labeled radiopharmaceuticals in PET/MRI brain imaging.
Methods
Ethical Statement
This retrospective experimental study of exploring the effects of the TOF reconstruction technique on brain PET quantification with 11C-CFT and 11C-PiB in hybrid PET/MR brain imaging among suspected patients with AD/PD performed at our institute, which has been approved by the Institutional Review Board of Union Hospital, Tongji Medical College, Huazhong University of Science and Technology. The need for written informed consent was waived.
Subjects
Patients' studies of suspected AD/PD referred for 11C-CFT and 11C-PiB PET/MRI (n = 75) were retrieved by an independent data analyst prior to automated standard uptake value (SUV) analysis by using the PNEURO module of PMOD 3.906 software. The corresponding detailed information for the subjects is shown in Table 1.
PET/MRI
All acquisitions of patients were performed on a SIGNA TOF-PET/MRI (GE Healthcare, Waukesha, WI, USA) with subsequent specifications: 130 cm × 60 cm × 60 cm bore dimension, 3.0 Tesla superconductive magnet, gradient coils: 44 mT/m peak amplitude, and 200 T/m/s peak slew rate, Detector type: SiPM, TOF (timing resolution for fast TOF performance <400 ps), Cryogen Type: Liquid Helium. The mean injected radiation dose (MBq/kg) and uptake time (minutes) for the two radiotracers are mentioned in Table 1. All patients were asked to void before scanning began. Prior to PET/MRI, patients were given an instruction sheet and an informed consent form to fill and to be submitted. Claustrophobic patients, patients with metal implants, and uncooperative patients were excluded from the investigations. The PET/MR 8-channel brain coil with a mirror was placed on the table on top of the adaptor. Patients were instructed verbally to keep the body aligned 90 degrees to the midsagittal plane in the supine position, hands alongside the trunk, and stay still 10 and 20 min for 11C-CFT and 11C-PiB, respectively. MRI was performed with T1-weighted imaging (3D gradient-echo sequence, flip angle = 12 degrees, time of echo [TE]/time of repetition [TR] = 2.6/6.9 ms, bandwidth = 50 KHz, field of view (FOV) = 24 cm × 24 cm, matrix = 384 × 384) during the 11C-CFT and 11C-PiB PET scanning.
PET Reconstruction
The PET images were reconstructed by using the ordered subsets expectation maximum (OSEM) algorithm with the TOF technique and non-TOF technique, respectively. The other parameters were same as followed: FOV = 30 cm × 30 cm, matrix = 192 × 192, filter cutoff = 3.0 mm, subsets = 28, iterations = 3. Gaussian post-reconstruction filtering with a 3.0 mm full width of half maximum (FWHM) was used to improve the image SNR. In all cases, the PET attenuation correction was atlas-based MRI attenuation correction, combined with Dixon water-fat separation methods (30). The additional corrections to scatter, random events, and dead-time were applied accordingly.
Image Analysis Semi-Quantitative Analysis
Reconstructed images were transferred from the scanner workstation to a data analysis PMOD workstation (PMOD version 3.906 Software, Zurich, Switzerland) for biomedical image quantification in different VOIs in the brain. PMOD-PNEURO Brain VOIs based on the maximum probability atlas (Hammers-N30R83) (31) was used in segmenting brain regions. Figure 1 gives an analysis example. T1 weighted images were employed for outlining anatomical structures. The selected VOIs of the brain for this study are the CN and PU. Statistics associated with standard uptake value, such as maximum SUV (SUVmax), mean SUV (SUVmean), and SD SUV (SUVSD), of each above VOIs with Cerebellar cortex (CC) were calculated in all the 11C-CFT and 11C-PiB brain images.
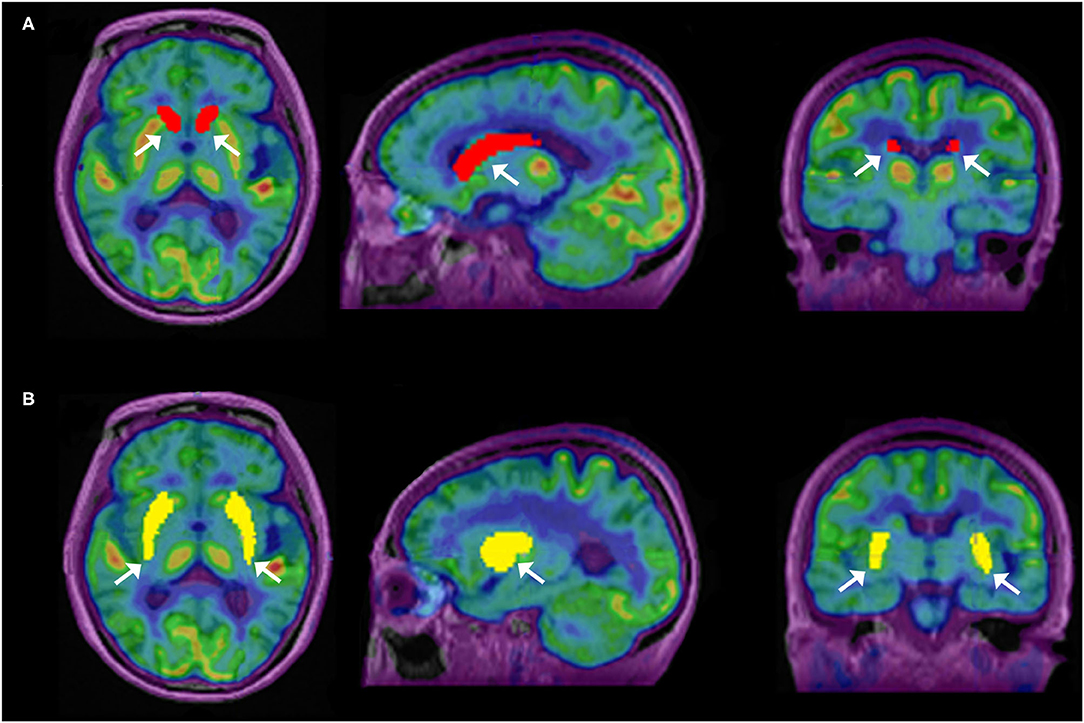
Figure 1. Segmentation of caudate nuclei (CN) and putamen (PU) by using N30R83 atlas in PMOD; (A) shows the outlining of CN in sagittal, axial, and coronal planes; (B) shows the outlining of PU in sagittal, axial, and coronal planes.
For the evaluation of image quality among segmented VOIs between reconstruction methods, two metrics were used on each VOI, that is, SNR and contrast. SNR of the segmented VOI was calculated as the difference between the VOI and background compared with the background noise shown in Equation 1.
Where the signal is defined as the SUVmean value in the segmented VOI, the background is defined as the SUVmean value of the cerebellum cortex VOI and the σB (noise) in this formula is defined as the SUVSD value of the background VOI. The use of cerebellum cortex VOI as the background is due to its homogeneous uptake patterns relative to other VOIs in the brain (17, 32–34).
In this work, contrast is defined as a ratio of signal to background.
Further, to calculate the percentage difference, the TOF values were expressed as a percentage difference from non-TOF values (Equation 3), according to the previous literature (35).
Statistical Analysis
The IBM SPSS version 23.0 software was used to compare the TOF vs. non-TOF measurements. The comparisons among the SUVs of different brain regions of TOF vs. non-TOF reconstruction methods, TOF-contrast vs. non-TOF-contrast, and TOF-SNR vs. non-TOF-SNR were analyzed using the paired t-test. Before the t-test, the data had been tested and the distribution was normality and variance was homogeneous. The value of p < 0.05 was considered statistically significant. Box-plots were generated to display the distribution of data.
Results
SUVmax and SUVmean
Overall higher average SUVmax and SUVmean values were observed among CN, PU regions, and whole brain in TOF compared with non-TOF reconstructions in 11C-CFT, and 11C-PiB brain images (Figures 2A,B, 3A,B). A statistically significant difference (p ≈ 0.000) was seen only in the CN region for SUVmax in TOF (1.293 ± 0.39) compared with non-TOF (1.192 ± 0.34) reconstruction in 11C-PiB, the similar impact was observed for whole-brain p ≈ 0.003 (1.966 ± 0.47, 1.869 ± 0.51). Statistically significant differences (p < 0.05) among both CN: p ≈ 0.000 (8.339 ± 2.31, 7.533 ± 2.16) and PU: p ≈ 0.004 (8.341 ± 2.28, 7.742 ± 2.13) regions for SUVmax in 11C-CFT were observed. Statistically significant differences (p < 0.05) were seen for all the VOIs segmented for SUVmean in TOF compared with non-TOF reconstruction for both 11C-PiB and 11C-CFT (Table 2). Though few potential outliers were found for TOF and non-TOF reconstruction in both CN and PU regions for 11C-PiB (Figure 2B).
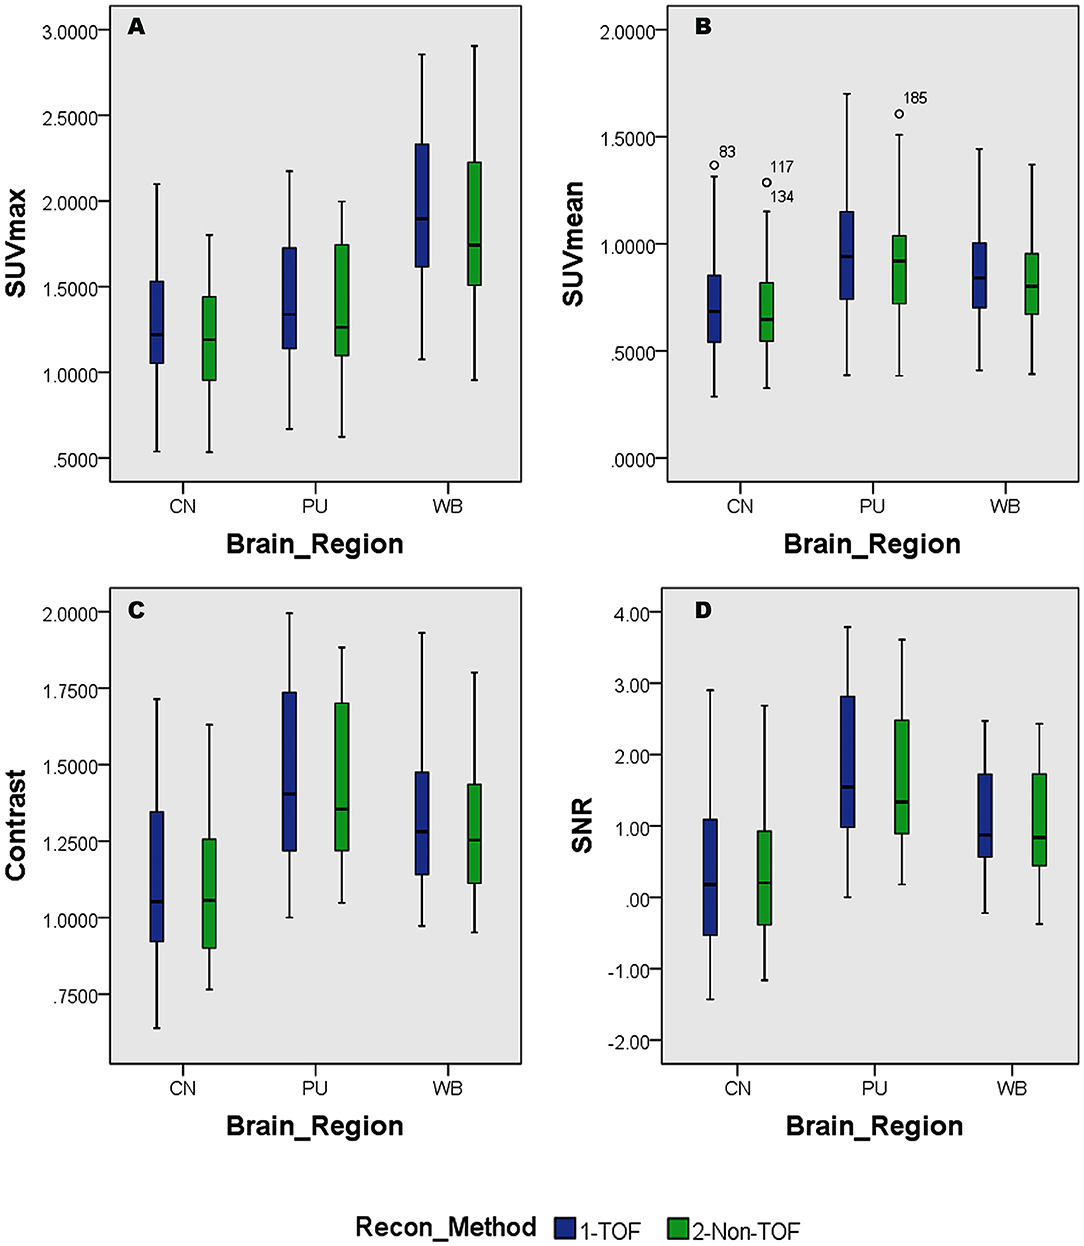
Figure 2. Distribution of the standard uptake values (SUVs) and quantitative parameters with reconstruction methods per each brain regions of 11C-PiB brain PET; (A) shows the distribution of individual subject's SUVmax values per segmented brain VOIs; (B) shows the distribution of individual subject's SUVmean values per segmented brain VOIs; (C) shows the distribution of individual subject's SNR values per segmented brain VOIs; (D) shows the distribution of individual subject's Contrast values per segmented brain VOIs; WB, Whole brain; CN, Caudate Nuclei; PU, Putamen.
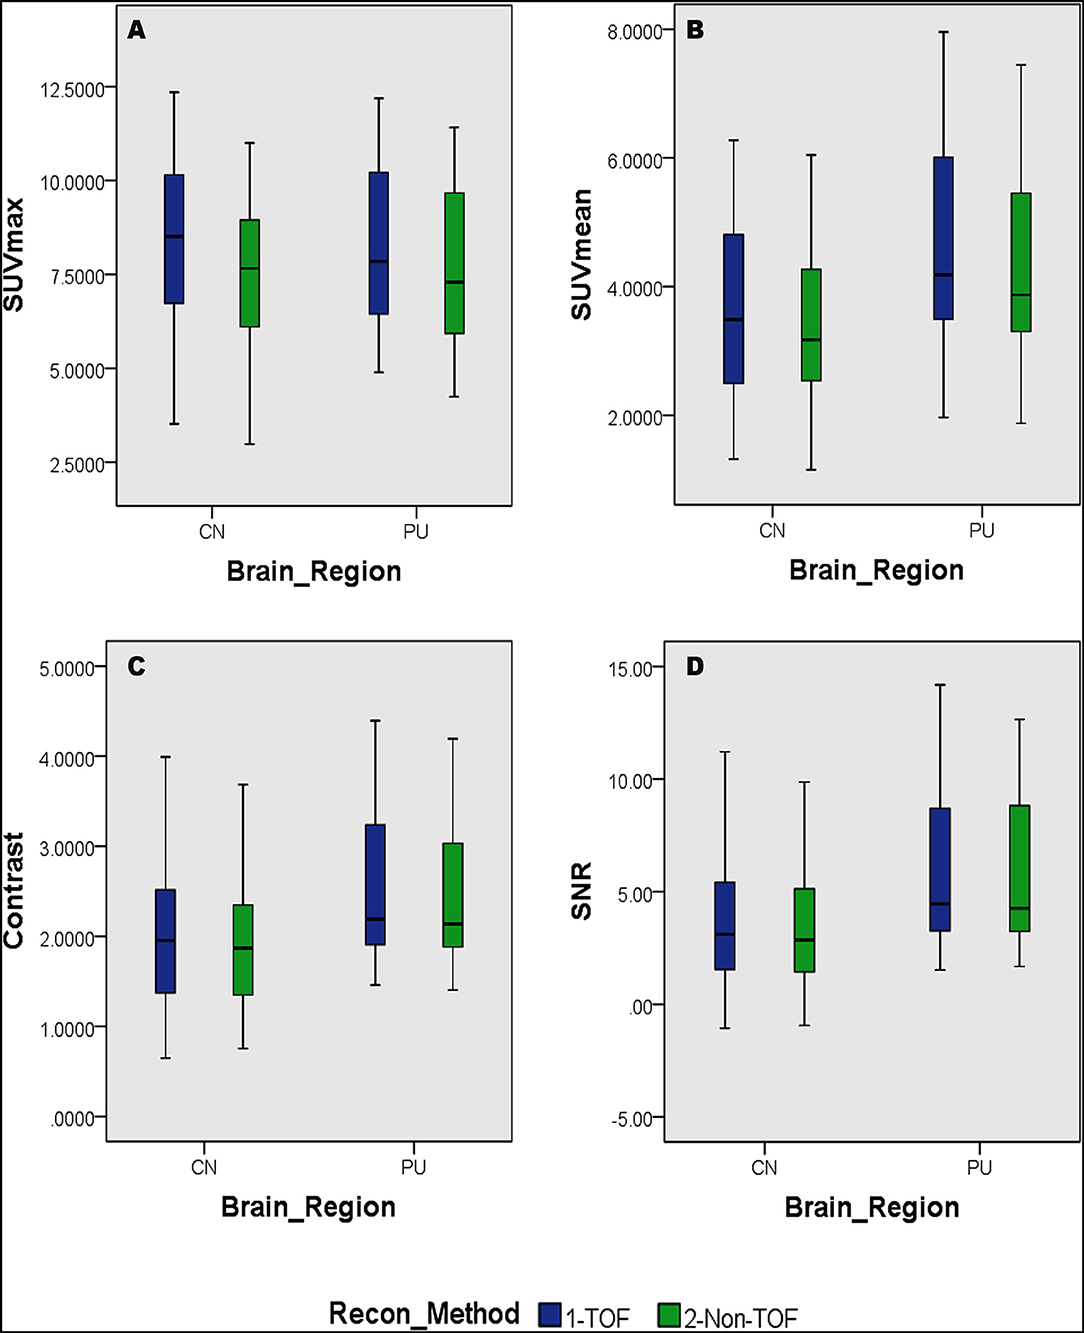
Figure 3. Distribution of the SUVs and quantitative parameters with reconstruction methods per each brain regions of 11C-PFT brain PET; (A) shows the distribution of individual subject's SUVmax values per segmented brain volume of interests (VOIs); (B) shows the distribution of individual subject's SUVmean values per segmented brain VOIs; (C) shows the distribution of individual subject's signal-to-noise ratio (SNR) values per segmented brain VOIs; (D) shows the distribution of individual subject's contrast values per segmented brain VOIs; WB, whole brain; CN, caudate Nuclei; PU, putamen.
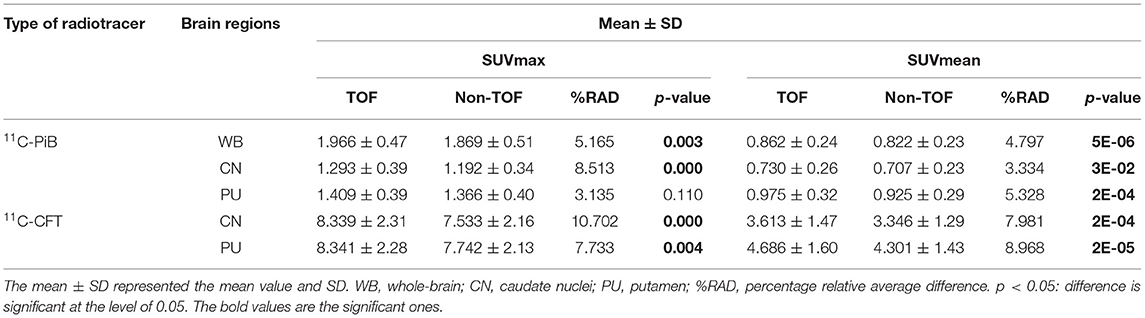
Table 2. The lists of maximum standard uptake value (SUVmax) and mean standard uptake value (SUVmean) for 11C-PiB and 11C-CFT with the time-of-flight (TOF) and non-TOF reconstruction, respectively.
SNR and Contrast
The SNR gain was measured in TOF and non-TOF by Equation 1. Overall all the VOIs with whole-brain showed higher SNR gain in TOF compared with non-TOF reconstruction in 11C-PiB (Figure 2D), significant SNR enhancement was observed in PU (p ≈ 0.034; 1.782 ± 1.08, 1.630 ± 0.99) and whole-brain (p ≈ 0.018; 1.129 ± 0.73, 1.028 ± 0.71); however, a significant difference in the result for the CN region is found. Similarly, for 11C-CFT, CN and PU, both regions showed higher SNR gain in TOF compared with non-TOF reconstruction (Figure 3D), yet significant improvement was not found in results as shown in Table 3.
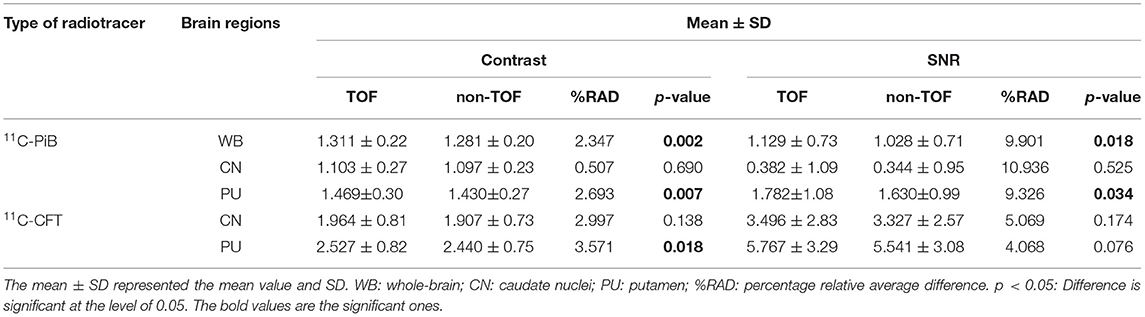
Table 3. The quantitative parameters, such as the contrast and SNR were listed for the evaluation of image quality with TOF and non-TOF reconstruction, respectively.
Image contrast of all brain VOIs was measured in TOF and non-TOF by Equation 2. CN and PU regions and whole-brain showed average higher contrast in TOF compared with non-TOF for 11C-PiB (Figure 2C). Nevertheless, significant contrast (p < 0.05) improvement was observed only in PU (p ≈ 0.007; 1.469 ± 0.30, 1.430 ± 0.27) region. However, the whole-brain showed a similar impact (p ≈ 0.002; 1.311 ± 0.22, 1.281 ± 0.20) with significantly improved contrast in TOF reconstruction. In 11C-CFT, CN and PU showed higher contrast in TOF compared with non-TOF (Figure 3C), still significant contrast (p < 0.05) enhancement was observed only for PU region (p ≈ 0.018; 2.527 ± 0.82, 2.440 ± 0.75) in TOF compared with non-TOF reconstruction.
Percentage of Relative Average Difference of SUVmax, SUVmean, and Quantitative Parameters—(% RAD)
The percentage of relative average difference (%RAD) of SUVmax and SUVmean among segmented brain VOIs for both 11C-PiB and 11C-CFT was measured in TOF compared with non-TOF by Equation 3. The %RAD-SUVmax and SUVmean difference for all segmented brain VOIs were positive, and %TOF SUV gain of 11C-CFT and 11C-PiB are illustrated in Table 2. The %RAD of SNR and contrast was positive for CN and PU regions for both 11C-CFT and 11C-PiB (Table 3).
Discussion
In the study, we evaluated the magnitude of quantitative difference produced by TOF reconstructions on CN and PU VOIs for short-lived 11C-CFT brain PET and further compared with the same VOIs with 11C-PiB for any correlation of TOF effect with a different short-lived tracer. Apparently, varying uptake properties of different VOIs caused a considerable impact on the TOF effect; however, the TOF effect has a consistent association with SUVmean rather than SUVmax values in both VOIs between 11C-CFT and 11C-PiB. Significantly enhanced SUVmean among segmented VOIs of both radiotracers confirmed that TOF facilitates short-lived radiotracers over non-TOF reconstruction. Moreover, the whole-brain, which is investigated due to its diffuse 11C-PiB uptake qualities, spotted significantly enhanced SUVmax, SUVmean, contrast, and SNR. It is observed that quantitative differences of image quality parameters vary among CN and PU with their uptake characteristics relative to the selected reference region. To the best of our knowledge, it is the first time that different tracers of short-lived 11C for brain quantitation imaging were performed with TOF and non-TOF PET/MRI. Overall, the experiment revealed that TOF reconstructions significantly affect SUVs compared with non-TOF and further improved the image contrast and SNR for a considerable extent, which proposed the TOF technique with higher time resolution (lesser than 400 ps) that contributes in achieving the optimal performance reconstruction of brain PET images with short-lived 11C-labeled tracers (Figure 4). Thus, it is recommended to consider the quantitative difference caused by TOF PET/MR modalities while diagnosing AD/PD.
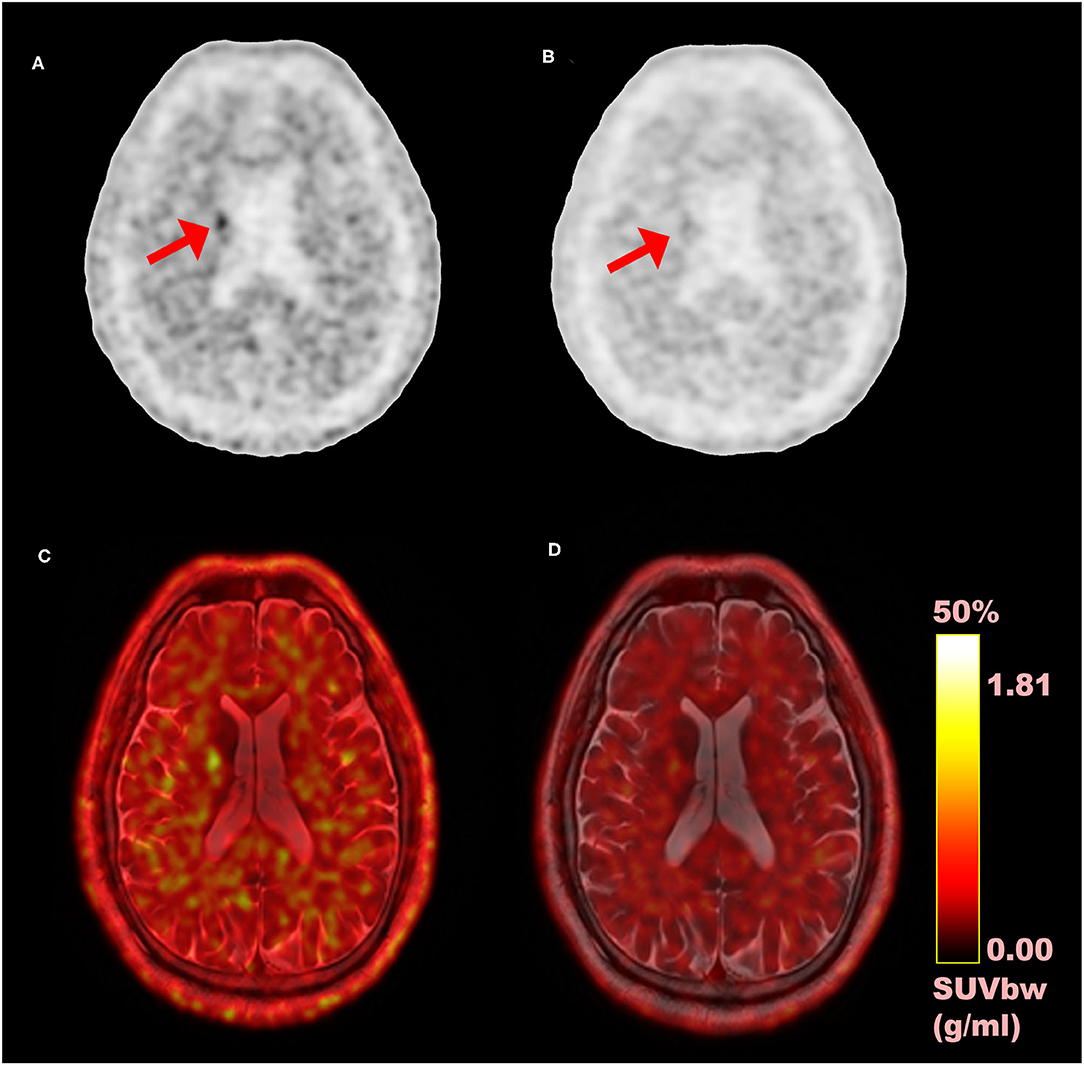
Figure 4. Comparison of time-of-flight (TOF) vs. non-TOF 11C-PiB PET images; (A) TOF reconstructed PET image (axial plane); (B) non-TOF reconstructed PET image (axial plane); (C) fusion image of TOF PET and MRI; (D) fusion image of non-TOF PET and MRI; red arrows: shows the signal enhancement difference in TOF and non-TOF PET images in 11C-PiB PET images.
The quantitative effect (SUVs) has benefitted in modern TOF PET for diagnosing neurodegenerative diseases by improving the spatial resolution and SNR (14). Further, Surti S et al. proved that the TOF reconstruction improves small lesion uptake measurement accuracy and precision by reducing normalized uptake values' (NUV) variability (22, 36). So as, the precision and accuracy of SUV are improved by TOF reconstruction. Oldan, J.D. et al. stated that SUV measurements of 18F-NaF PET/CT fluctuate within the brain like soft tissue regions between TOF and non-TOF reconstructions due to their lower uptake characteristics (35). Experimenting, the point spread function (PSF) and TOF algorithms on brain regions, Shao, X. et al., evidenced different effects on the SUVs among different brain regions for 18F-FDG (27). Since consistent significant enhancement of SUVmean among segmented brain VOIs in TOF reconstruction for short-lived 11C-labeled tracers were seen, it is evidenced that TOF PET systems can be used as sensitivity amplifiers for short half-life radiopharmaceuticals, such as 11C-labeled tracers with low count rate after an adequate uptake time. Injected radiation dose can be optimized by considering enhanced SUVs while maintaining the same image quality. So the patient radiation dose, as well as occupational and general public exposure to ionizing radiation, can be minimized (23). Motion artifacts are often complained while scanning patients with AD/PD for longer time, however, improved timing resolution considerably reduce the scan time which comfort patients with less time inside the PET/MR gantry.
Caudate nuclei showed significant enhancement in SUVmax and SUVmean for TOF reconstruction in 11C-CFT though a significant difference was not found in the results of the SNR and contrast. Similarly, 11C-PiB showed identical results for both the VOIs. These results were caused due to a relatively improved signal in the reference region, which is the cerebellum cortex, compared with the CN region in TOF reconstruction. PU region with 11C-PiB showed significant enhancement in contrast, SNR and SUVmean for TOF compared with non-TOF reconstruction, which is consistent with previous literature using 18F tracers for small lesion enhancement (16, 18, 19). However, PU did not show significant improvement in SUVmax in TOF reconstructed images compared with non-TOF, which probably was due to diffuse low uptake properties of 11C-PiB tracer within the PU. A similar effect was observed in SUVmax, SUVmean, and contrast for 11C-CFT due to its higher uptake characteristics within the PU, (Figures 5, 6) still SNR did not find significant development. The cause would be the incomparable noise produced in the background region, which is the cerebellum cortex (15), was relatively higher in TOF compared with non-TOF images due to 11C-CFT uptake properties. In Figure 2, the box-plot illustrated overall whole-brain enhanced SUVmean, SUVmax, and quantitative parameters with TOF reconstruction in 11C-PiB.
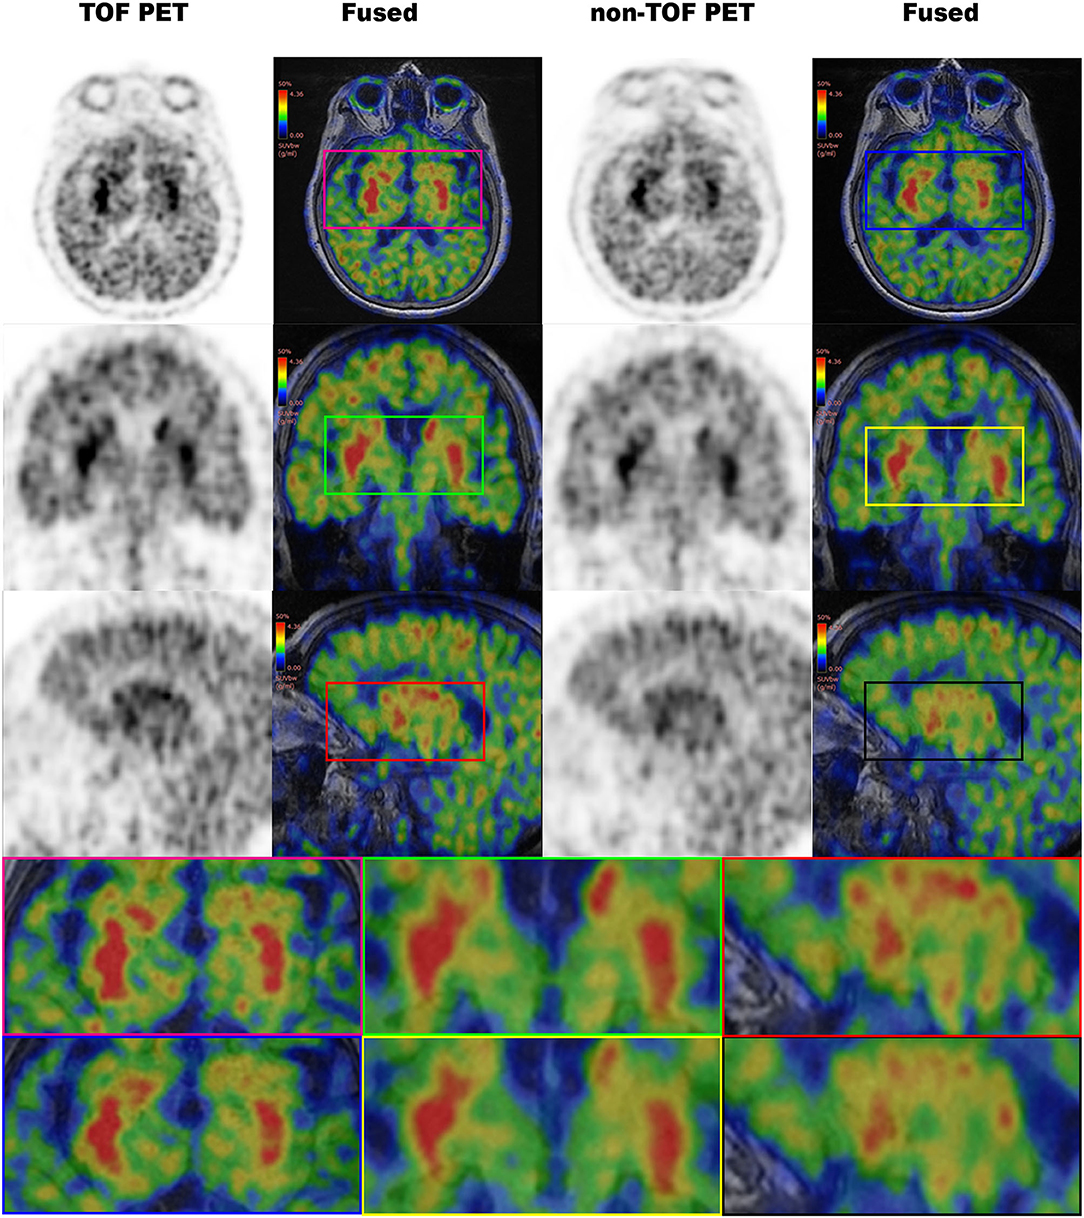
Figure 5. The 11C-CFT PET images demonstrating enhanced CN and PU with TOF and non-TOF reconstruction. First column demonstrating the enhanced CN and PU in TOF reconstruction; second column demonstrating the fused 11C-CFT with T1W MRI in TOF reconstruction; third column demonstrating the enhanced CN and PU in non-TOF reconstruction; fourth column demonstrating the fused 11C-CFT with T1W MRI in non-TOF reconstruction (axial, sagittal, and coronal planes are provided for comparisons).
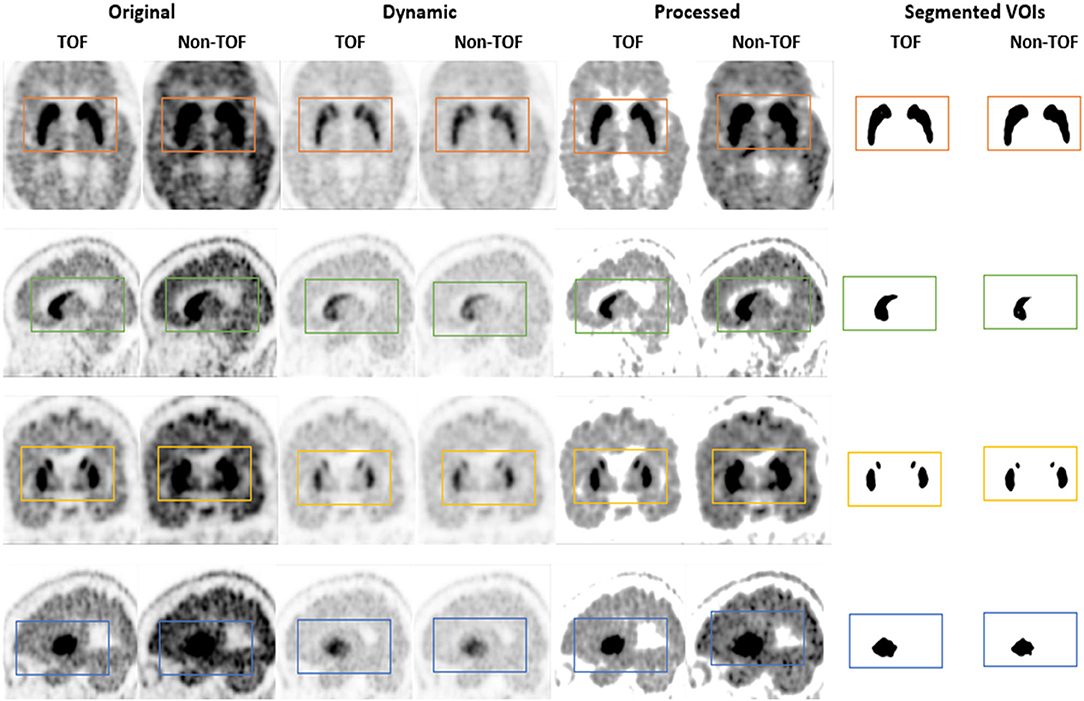
Figure 6. The 11C-CFT PET images demonstrating enhanced CN and PU with TOF and non-TOF reconstruction in original and processed images.
Our study has several limitations. The number of cases are still limited due to the time limitation for data collection of 11C-CFT and 11C-PiB scans of suspected patients with AD/PD, which were archived in the Picture Archive and Communication System (PACS). A larger sample would possibly be needed to generalize these findings to a considerable population (e.g., a wider range of patient BMI and a wider range of age). Then, for outlining most of the cortical structures in the brain VOIs, PET-based Maximum Probability Atlas (MPA) was used to avoid slowness or interruption of the segmentation process of the PNEURO module in PMOD 3.9 software. Though T1 MR based parcellation is preferred over VOI outlining in deep nuclei region by the PMOD team, thus the quality of the VOI definition in the areas mentioned above is reduced. For the effective use of PNEURO with high-resolution data, a high-end workstation (e.g., 8 core, 16GB, or more RAM) is required.
Conclusion
Time-of-flight reconstruction improves SUVs and image quality parameters, which is an advantage of the TOF PET/MRI system with short-lived 11C-labeled tracers for offering higher sensitivity. The improved temporal resolution supports the rapid decay rate of short-lived 11C-labeled tracers and shortens scan time while increasing the patient comfort and reducing the motion artifacts in patients with AD/PD. However, the combined TOF algorithm should be used with caution for quantitative analysis because it has different effects on SUVmax, contrast, and SNR of different brain regions.
Data Availability Statement
The original contributions presented in the study are included in the article/supplementary material, further inquiries can be directed to the corresponding author.
Ethics Statement
The studies involving human participants were reviewed and approved by Institutional Review Board of Union Hospital, Tongji Medical College, Huazhong University of Science and Technology. Written informed consent for participation was not required for this study in accordance with the national legislation and the institutional requirements.
Author Contributions
XL and WR substantially contributed to the conception and design, analyzed and interpreted the data, and revised the manuscript critically for important intellectual content. DW analyzed and interpreted the data and drafted the article. DW, WR, and FH acquired the PET images. YG and QL prepared the compounds of 11C-CFT and 11C-PiB. XS and FL analyzed and interpreted the images. All authors read and approved the final manuscript, contributed to the article, and approved the submitted version.
Funding
This work was supported by the National Natural Science Foundation of China (Nos. 81701759 and 81901735), the Key Project of Hubei Province Technical Innovation (2017ACA182), and the Clinical Research Physician Program of Tongji Medical College, Huazhong University of Science and Technology (No. 5001530008).
Conflict of Interest
The authors declare that the research was conducted in the absence of any commercial or financial relationships that could be construed as a potential conflict of interest.
Publisher's Note
All claims expressed in this article are solely those of the authors and do not necessarily represent those of their affiliated organizations, or those of the publisher, the editors and the reviewers. Any product that may be evaluated in this article, or claim that may be made by its manufacturer, is not guaranteed or endorsed by the publisher.
Acknowledgments
We would like to thank all the members in the PET Center, Union Hospital, Tongji Medical College, Huazhong University of Science and Technology.
References
1. Nussbaum RL, Ellis CE. Alzheimer's disease and Parkinson's disease. N Engl J Med. (2003) 348:1356–64. doi: 10.1056/NEJM2003ra020003
2. McKhann G, Drachman D, Folstein M, Katzman R, Price D, Stadlan EM. Clinical diagnosis of Alzheimer's disease: Report of the NINCDS-ADRDA Work Group* under the auspices of Department of Health and Human Services Task Force on Alzheimer's Disease. Neurology. (1984) 34:939. doi: 10.1212/WNL.34.7.939
3. Silverman DH, Small GW, Chang CY, Lu CS, de Aburto MAK, Chen W, et al. Positron emission tomography in evaluation of dementia: regional brain metabolism and long-term outcome. JAMA. (2001) 286:2120–7. doi: 10.1001/jama.286.17.2120
4. Okello A, Koivunen J, Edison P, Archer H, Turkheimer F, Någren Ku, et al. Conversion of amyloid positive and negative MCI to AD over 3 years: an 11C-PIB PET study. Neurology. (2009) 73:754–60. doi: 10.1212/WNL.0b013e3181b23564
5. Faria DdP, Duran FL, Squarzoni P, Coutinho AM, Garcez AT, Santos PP, et al. Topography of 11C-Pittsburgh compound B uptake in Alzheimer's disease: a voxel-based investigation of cortical and white matter regions. Braz J Psychiatry. (2018) 41:101–11. doi: 10.1590/1516-4446-2017-0002
6. Nagasawa H, Tanji H, Nomura H, Saito H, Itoyama Y, Kimura I, et al. PET study of cerebral glucose metabolism and fluorodopa uptake in patients with corticobasal degeneration. J Neurol Sci. (1996) 139:210–7. doi: 10.1016/0022-510X(96)00057-3
7. Drzezga A. Diagnosis of Alzheimer's disease with [18F] PET in mild and asymptomatic stages. Behav Neurol. (2009) 21:101–15. doi: 10.1155/2009/276026
8. Poewe W, Wenning G. The differential diagnosis of Parkinson's disease. Eur J Neurol. (2002) 9 Suppl 3:23–30. doi: 10.1046/j.1468-1331.9.s3.3.x
9. Clemente G, Alves V, Abrunhosa A, editors. Synthesis optimization of pittsburgh compound B by the captive solvent method. In: 2012 IEEE 2nd Portuguese Meeting in Bioengineering (ENBENG); 2012: IEEE. Coimbra.
10. Huang T, Wang H, Tang G, Liang X, Shi X, Zhang X. The influence of residual nor-β-CFT in 11C CFT injection on the Parkinson disease diagnosis: a 11C CFT PET study. Clin Nucl Med. (2012) 37:743–7. doi: 10.1097/RLU.0b013e31824c5fae
11. Conti M, Bendriem B. The new opportunities for high time resolution clinical TOF PET. Clin Transl Imaging. (2019) 7:139–47. doi: 10.1007/s40336-019-00316-5
12. Surti S, Karp JS. Advances in time-of-flight PET. Phys Medica. (2016) 32:12–22. doi: 10.1016/j.ejmp.2015.12.007
13. Lewellen T. Time-of-flight PET. Semin Nucl Med. (1998) 28:268–75. doi: 10.1016/S0001-2998(98)80031-7
14. Lindstrom E, Danfors T, Lindsjo L, Lubberink M. Brain-PET image reconstruction methods affect software-aided diagnosis in patients with neurodegenerative diseases. J Nucl Med. (2018) 59(suppl 1):1780. doi: 10.1016/j.nicl.2020.102386
15. Karp JS, Surti S, Daube-Witherspoon ME, Muehllehner G. Benefit of time-of-flight in PET: experimental and clinical results. J Nucl Med. (2008) 49:462–70. doi: 10.2967/jnumed.107.044834
16. Surti S, Scheuermann J, El Fakhri G, Daube-Witherspoon ME, Lim R, Abi-Hatem N, et al. Impact of time-of-flight PET on whole-body oncologic studies: a human observer lesion detection and localization study. J Nucl Med. (2011) 52:712–9. doi: 10.2967/jnumed.110.086678
17. Lois C, Jakoby BW, Long MJ, Hubner KF, Barker DW, Casey ME, et al. An assessment of the impact of incorporating time-of-flight information into clinical PET/CT imaging. J Nucl Med. (2010) 51:237–45. doi: 10.2967/jnumed.109.068098
18. Muehlematter UJ, Nagel HW, Becker A, Mueller J, Vokinger KN, de Galiza Barbosa F, et al. Impact of time-of-flight PET on quantification accuracy and lesion detection in simultaneous 18F-choline PET/MRI for prostate cancer. EJNMMI Res. (2018) 8:41. doi: 10.1186/s13550-018-0390-8
19. van der Vos CS, Koopman D, Rijnsdorp S, Arends AJ, Boellaard R, van Dalen JA, et al. Quantification, improvement, and harmonization of small lesion detection with state-of-the-art PET. Eur J Nucl Med Mol Imaging. (2017) 44:4–16. doi: 10.1007/s00259-017-3727-z
20. Shang K, Cui B, Ma J, Shuai D, Liang Z, Jansen F, et al. Clinical evaluation of whole-body oncologic PET with time-of-flight and point-spread function for the hybrid PET/MR system. Eur J Radiol. (2017) 93:70–5. doi: 10.1016/j.ejrad.2017.05.029
21. Surti S. Update on time-of-flight PET imaging. J Nucl Med. (2015) 56:98–105. doi: 10.2967/jnumed.114.145029
22. Daube-Witherspoon ME, Surti S, Perkins AE, Karp JS. Determination of accuracy and precision of lesion uptake measurements in human subjects with time-of-flight PET. J Nucl Med. (2014) 55:602–7. doi: 10.2967/jnumed.113.127035
23. Murray I, Kalemis A, Glennon J, Hasan S, Quraishi S, Beyer T, et al. Time-of-flight PET/CT using low-activity protocols: potential implications for cancer therapy monitoring. Eur J Nucl Med Mol Imaging. (2010) 37:1643–53. doi: 10.1007/s00259-010-1466-5
24. Budinger TF. Time-of-flight positron emission tomography: status relative to conventional PET. J Nucl Med. (1983) 24:73.
25. Surti S, Karp S, Popescu LM, Daube-Witherspoon E, Werner M. Investigation of time-of-flight benefit for fully 3-DPET. IEEE Trans Med Imaging. (2006) 25:529–38. doi: 10.1109/TMI.2006.871419
26. Surti S, Karp J, Muehllehner G, Raby P, editors. Investigation of lanthanum scintillators for 3D PET. In: 2002 IEEE Nuclear Science Symposium Conference Record; 2002: IEEE. Norfolk, VA.
27. Shao X, Shao X, Wang X, Wang Y. Applications of both time of flight and point spread function in brain PET image reconstruction. Nucl Med Commun. (2016) 37:422–7. doi: 10.1097/MNM.0000000000000459
28. Nagaki A, Onoguchi M, Matsutomo N. Clinical validation of high-resolution image reconstruction algorithms in brain 18F-FDG-PET: effect of incorporating Gaussian filter, point spread function, and time-of-flight. Nucl Med Commun. (2014) 35:1224–32. doi: 10.1097/MNM.0000000000000187
29. Prieto E, Martí-Climent JM, Morán V, Sancho L, Barbés B, Arbizu J, et al. Brain PET imaging optimization with time of flight and point spread function modelling. Phys Med. (2015) 31:948–55. doi: 10.1016/j.ejmp.2015.07.001
30. Leynes AP, Yang J, Shanbhag DD, Kaushik SS, Seo Y, Hope TA, et al. Hybrid ZTE/Dixon MR-based attenuation correction for quantitative uptake estimation of pelvic lesions in PET/MRI. Med Phys. (2017) 44:902–13. doi: 10.1002/mp.12122
31. Hammers A, Allom R, Koepp MJ, Free SL, Myers R, Lemieux L, et al. Three-dimensional maximum probability atlas of the human brain, with particular reference to the temporal lobe. Hum Brain Mapp. (2003) 19:224–47. doi: 10.1002/hbm.10123
32. Le Meunier L, Slomka PJ, Dey D, Ramesh A, Thomson LE, Hayes SW, et al. Enhanced definition PET for cardiac imaging. J Nucl Cardiol. (2010) 17:414–26. doi: 10.1007/s12350-010-9193-7
33. Tada T, Hasegawa C, Odagawa T, Abe S, Kato K. Comparative examination of the cerebellum and pons as reference regions for quantitative evaluation in PET imaging for Alzheimer's disease using 11C-Pittsburgh Compound-B. In: 2019 Society of Nuclear Medicine and Molecular Imaging. Anaheim, CA (2019).
34. Marcus C, Mena E, Subramaniam RM. Brain PET in the diagnosis of Alzheimer's disease. Clin Nucl Med. (2014) 39:e413. doi: 10.1097/RLU.0000000000000547
Keywords: time-of-flight, PET/MRI, quantification, SUV, reconstruction, 11C-labeled tracers
Citation: Wimalarathne DDN, Ruan W, Sun X, Liu F, Gai Y, Liu Q, Hu F and Lan X (2022) Impact of TOF on Brain PET With Short-Lived 11C-Labeled Tracers Among Suspected Patients With AD/PD: Using Hybrid PET/MRI. Front. Med. 9:823292. doi: 10.3389/fmed.2022.823292
Received: 27 November 2021; Accepted: 12 January 2022;
Published: 02 March 2022.
Edited by:
Désirée Deandreis, University of Turin, ItalyReviewed by:
Maria Mathew D'Souza, Institute of Nuclear Medicine & Allied Sciences (DRDO), IndiaKun Zheng, Peking Union Medical College Hospital (CAMS), China
Copyright © 2022 Wimalarathne, Ruan, Sun, Liu, Gai, Liu, Hu and Lan. This is an open-access article distributed under the terms of the Creative Commons Attribution License (CC BY). The use, distribution or reproduction in other forums is permitted, provided the original author(s) and the copyright owner(s) are credited and that the original publication in this journal is cited, in accordance with accepted academic practice. No use, distribution or reproduction is permitted which does not comply with these terms.
*Correspondence: Xiaoli Lan, eGlhb2xpX2xhbkBodXN0LmVkdS5jbg==
†These authors have contributed equally to this work