- 1Department of Neurosurgery, Second Affiliated Hospital of Harbin Medical University, Harbin, China
- 2Translational Medicine Research and Cooperation Center of Northern China, Heilongjiang Academy of Medical Sciences, Harbin, China
Background: Gliomas represent the most common and aggressive brain malignancy. Interferon-gamma (IFNG) is a potent inducer of immune response, developing IFNG-related gene signature may promote the diagnosis and treatment of this disease.
Methods: Bulk tumor and single-cell mRNA-seq datasets of glioma ranging from WHO grade II to IV with corresponding demographics were included. Multiple bioinformatics and machine learning algorithms were performed to develop an IFNG-related prognostic signature and evaluate immune checkpoint blockade (ICB) therapy response.
Results: IFNGR1 and IFNGR2 were used as concise IFNG-related gene signature based on which the IFNGR score well-characterized the IFNG response in the glioma microenvironment. Increased IFNGR score was associated with clinicopathological parameters relating to tumor malignancy and prevailing molecular pathological markers. Notably, K-M and Cox regression analysis found that the IFNGR score was an effective prognostic biomarker, and was associated with tumor relapse for a subset of patients. Notably, IFNGR1 and IFNGR2 were preferentially expressed by the Mono/Macro cells in the glioma microenvironment and were significantly correlated with M2 macrophage. Thus, the IFNGR score-high group had increased expression of immune checkpoints and had the potential to predict ICB responsiveness.
Conclusion: In conclusion, we have developed a concise IFNG-related gene signature of clinical significance, which may improve the current diagnosis and treatment of glioma.
Introduction
Glioma is the most common and lethal primary brain malignancy worldwide, accounting for 31.1% of primary brain tumors in people aged 20–59 years (1, 2). The overall survival (OS) of gliomas varies widely, from 78.1 months for low-grade glioma (WHO grade II) to 14.4 months for glioblastoma (GBM) (WHO grade IV), with 5-year survival rates ranging from 67% for low-grade glioma to 9% for GBM. Despite currently standard treatment, malignant progression and tumor relapse inevitably occur and lead to tolerance to conventional treatments (1–3). Therefore, novel biomarkers are in urgent need to assist in the accurate diagnosis and improve the currently limited treatment efficacy.
Accumulative evidence has demonstrated the paramount role of the IFNG response in tumors (4, 5). On the one hand, IFNG is a potent inducer of the adaptive immune response, promoting antigen presentation and effector T cell activity, and catalyzing immune-mediated tumor clearance (6, 7). On the other hand, IFNG participants in immune editing and upregulates immune checkpoints to facilitate tumor cells evade immune attacks (7, 8). Notably, substantial evidence has suggested that gene signatures associated with the IFNG response reliably predict prognosis and responsiveness to ICB of tumor sufferers (4, 9), while developing IFNG-related gene signature for both GBM and lower-grade glioma (LGG) was less addressed. As the portal of the IFNG signaling pathway, IFNGR1 and IFNGR2 are of biological and pathophysiological significance. Biologically active IFNGR-IFNG complex needs two IFNGR1 and two IFNGR2, with one of each receptor subunit binding to each end of the IFNG homolog, thereby activating the downstream JAK and STAT families and enabling the biological effects of IFNG (7, 10). The dysregulation of IFNGR1 and IFNGR2 results in immune-related disorders (11–14). Therefore, IFNGR1 and IFNGR2 may also constitute a genetic metric of clinical implications in glioma.
From this perspective, we integrated IFNGR1 and IFNGR2 as an IFNG related 2-gene signature and developed the IFNGR score to probe their clinical significance. We thoroughly explored the association between the IFNGR score and glioma clinicopathological and molecular features, as well as the underlining molecular mechanism. Notably, the IFNGR score effectively predicted the OS and progression-free interval (PFI) of glioma and may act as a potential predictor of ICB therapy. On this basis, our results provide an efficient classifier for determining glioma prognosis and may contribute to optimizing conventional treatment of the desperate disease.
Materials and Methods
Data Collection and Pre-procession
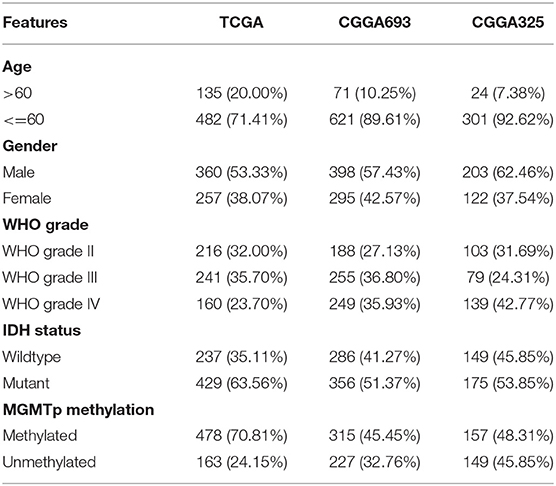
mRNA-seq datasets of a total of 1,693 glioma samples from WHO grade II to grade IV and corresponding demographics were retrieved (Table 1). Of these, 675 glioma samples of the Cancer Genomic Atlas (TCGA) project were retrieved from the USCS Xena data portal (https://xenabrowser.net/datapages/) and were defined as the exploration dataset. The remaining samples were from the Chinese Glioma Genome Atlas (CGGA, http://www.cgga.org.cn/index.jsp) were defined as the validation datasets (CGGA693, n = 693; CGGA325, n = 325) (15–18). Samples with no follow-up information or follow-up time of <1 day were excluded. Genes with 0 (not detected) expression in more than half of the samples were removed. For mRNA-seq data sets, the gene expression profile was TPM normalized and log-transformed for downstream analysis. The scRNA-seq dataset was retrieved from the TISCH database (http://tisch.comp-genomics.org/home/) (19). GSE 131928 10X dataset was included in our study (20).
Development of the Gene Signature and Functional Analysis
The IFNGR score was defined as the ssGSEA score of IFNGR1 and IFNGR2 based on the ssGSEA algorithm (21). Samples were then split into the IFNGR score-high and -low groups by the median value. To demonstrate the efficacy of the IFNGR score in characterizing the IFNG response in gliomas, we collected genesets previously developed associated with IFNG response, including IFNG.1 (GBP5, ICAM1, CAMK2D, IRF1, SOCS3, CD44, and CCL2) (4), IFNG.2 (IDO1, CXCL10, CXCL9, HLA-DRA, STAT1, and IFNG) (9), and IFNG.ex (CD3D, IDO1, CIITA, CD3E, CCL5, GZMK, CD2, HLA-DRA, CXCL13, IL2RG, NKG7, HLA-E, CXCR6, LAG3, TAGAP, CXCL10, STAT1, and GZMB) (9). Samples were split into the IFNG.1 score-high and -low groups, IFNG.2 score-high and -low groups, and IFNG.ex score-high and -low groups following the methods described before (4, 9). Gene set enrichment analysis (GSEA, v4.1.0) was conducted to calculate the normalized enrichment score (NES) of the IFNG signaling pathway, and biological processes relating to IFNG response (22). Differentially expressed genes (DEGs) between the IFNGR score-high and -low groups were calculated using the R packages “limma” and “edgeR.” Functional enrichment analysis was further employed to exhibit the function of DEGs based on the webtool DAVID (https://david.ncifcrf.gov/) (23–26). Tumor purity was estimated using the ABSOLUTE algorithm (27).
To examine the expression of IFNGR1 and IFNGR2 at the cellular level, scRNA-seq expression profile was analyzed using the R package “Seurat” (28). In brief, the sample was sequentially normalized, dimensionality reduced, and clustered. A total of 22 clusters were identified and cell type identification was based on differentially expressed genes defined by Neftel et al. and the CellMarker database (http://bio-bigdata.hrbmu.edu.cn/CellMarker/) (29). We defined subgroups expressing multiple cellular markers as “Unclassified.” Thereafter, the expression profile of the Mono/Macro subcluster was extracted and the ssGSEA score of IFNGR1 and IFNGR2 was calculated using the ssGSEA algorithm. DEGs between the score-high and -low groups were evaluated using “Seurat.” Transcription factor enrichment analysis was performed using the web tool Metascape (https://metascape.org/gp/index.html) based on the TRRUST dataset (30, 31). The fraction of 22 immune infiltrations was estimated by the CIBERSORT algorithm (32).
Validation of Clinical Significance
The Kaplan-Meier (K-M) plots were used to exhibit the survival differences and univariate Cox regression analysis was conducted to assess the independent prognostic significance based on the R packages “survival” and “survminer.” The receiver operating curves (ROC) and corresponding area under the curve (AUC) were employed to evaluate the time-dependent predictive power. TIDE is a computational framework for modeling the induction of T cell dysfunction in tumors with high infiltration of cytotoxic T lymphocytes and the prevention of T cell infiltration in tumors with low cytotoxic T lymphocyte infiltration level (http://tide.dfci.harvard.edu/login/). We employed the webtool TIDE to predict the responsiveness of samples to ICB therapies with default parameters, and the predicted results were further corrected by a machine learning algorithm, SubMap, as the expression profile and corresponding response to ICI of melanoma being the reference (33–35).
Statistics
All the statistics were performed in R (version 4.0.2). The IFNGR score between groups was compared using the two-tailed Wilcox test. K-M analysis and log-rank test were used to assess survival differences. ROC curves and corresponding AUCs were used to assess the time-dependent predictive power. Univariate Cox regression analysis was employed to describe the independent prognostic value. p < 0.05 was considered statistically significant. For GO and GSEA analysis, a false discovery rate (FDR)-q value < 0.1 was considered significant. For the predicted results of ICB responsiveness, Bonferroni corrected p < 0.1 was considered significant. We marked * for p < 0.05, ** for p < 0.01, *** for p < 0.001.
Results
IFNGR1 and IFNGR2 Make Up a Concise Gene Signature Characterizing IFNG Response
We first explored the efficacy of IFNGR1 and IFNGR2 as a genetic metric to characterize the IFNG response. The IFNGR score was calculated based on the expression of IFNGR1 and IFNGR2 and samples were split into the IFNGR score-high and -low groups by the median value. Meanwhile, samples were split into the IFNG.ex score-high and -low groups, IFNG.1 score-high and -low groups, and IFNG.2 score-high and -low groups based on previously constructed IFNG-related gene signatures. The activity of the IFNG signaling pathway (Hallmark IFNG response, Reactome IFNG signaling, and WP type II IFNG signaling) and IFNG-related process (GOBP IFNG signaling, IFNG production, and positive regulation of IFNG production) in the two groups were compared. As a result, the IFNGR score-high group had the highest average NES scores in IFNG-related BP (mean NES = 3.26), while the lowest NES scores in the IFNG signaling pathway (mean NES = 1.93) (Figure 1A). Instead, IFNG.2-based group best characterized the IFNG signaling pathway well (mean NES = 3.44), while scored lower in IFNG-related biological processes (mean NES = 2.16), and the IFNG.1-based group was balanced in characterizing the IFNG signaling pathway (mean NES = 2.97) and related biological processes (mean NES = 3.00). Moreover, DEGs (IFNGR score-high vs. score-low) were calculated, and GO analysis found that interferon-gamma-mediated signaling pathway (BP) and interferon-gamma signaling (Reactome) were top enriched terms in the IFNGR score-high group (Figures 1B,C). Notably, inflammatory response, immune response, leukocyte migration (BP), and signaling pathways regulating the activity of immune cells including integrin cell surface interaction (Reactome), immunoregulatory interaction between a lymphoid and a non-lymphoid cell (Reactome), B lymphocyte, and T helper cell surface molecule (Biocarta), and CTL-mediate immune response against target cell (Biocarta) were also highly enriched terms of the IFNGR score-high group, indicating a pro-inflammatory microenvironment which corroborates the function of IFNG. Therefore, IFNGR1 and IFNGR2 comprised of a concise gene signature effectively characterize the IFNG response.
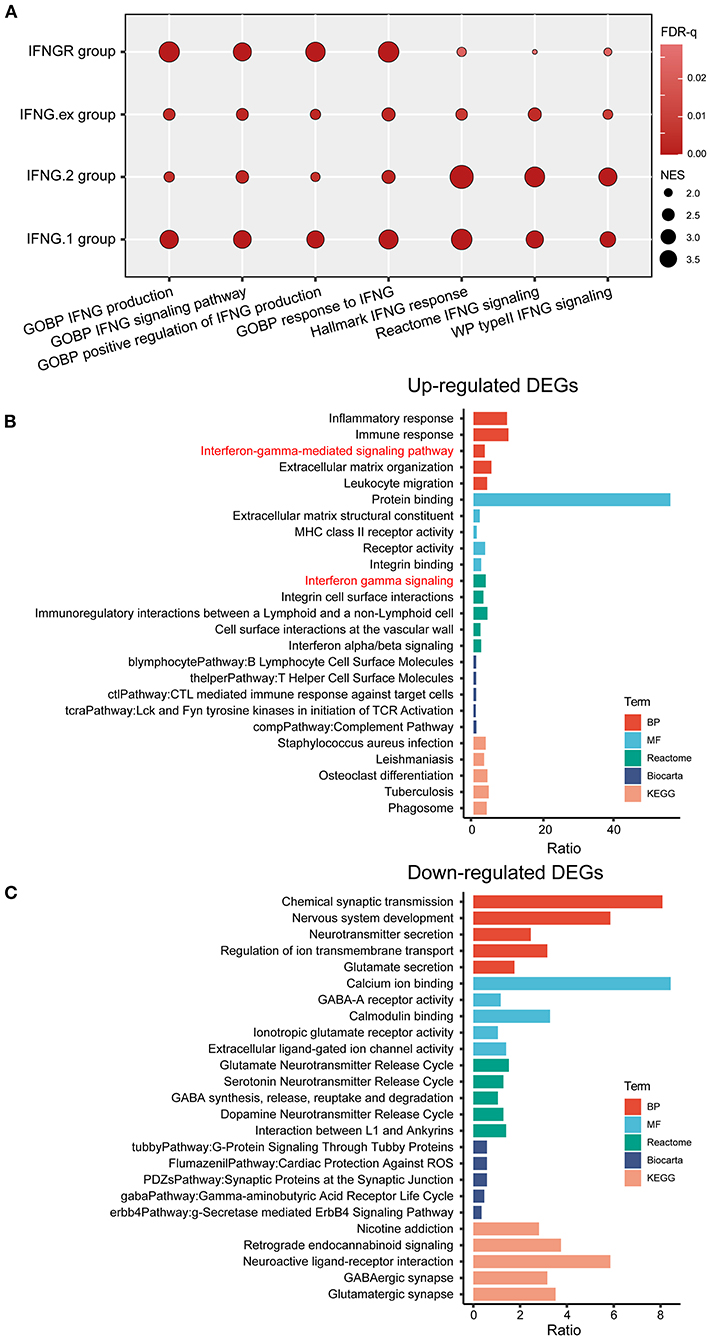
Figure 1. The IFNGR1 and IFNGR2-based gene signature in characterizing the IFNG response in gliomas. (A) GSEA analysis of the IFNGR, IFNG.1, IFNG.2, and IFNG.ex-based group in characterizing the IFNG signaling pathway and related biological processes. The size of the bubble was proportional to the NES score and color was proportional to the FDR-q value of each term. GO analysis of the (B) up-regulated and (C) down-regulated DEGs between the IFNGR score-high and -low groups based on the TCGA cohort. The top 5 terms in each category were exhibited.
The IFNGR Score Was Associated With the Function State of Glioma-Associated Macrophages
Next, we explored the expression of IFNGR1 and IFNGR2 at single-cell resolution. Twenty two 22 clusters of cells were identified and 8 types of cells were annotated. A cluster of cells expressing a mixture of markers of malignant cell, MES-like malignant cell, and monocyte/macrophage was defined as unclassified and excluded from further analysis. IFNGR1 was expressed by Mono/Macro, unclassified cell, MES-like malignant cell, AC-like malignant cell, and CD8 T cell. Mono/Macro subcluster had the highest expression level (Figure 2A). On the other hand, Mono/Macro and MES-like malignant cells express IFNGR2 and the former had remarkably increased value. Moreover, we extracted the expression profile of the Mono/Macro subcluster and calculated the ssGSEA score of IFNGR1 and IFNGR2, and split the Mono/Macro cells into score-high and -low groups by the median value. DEGs were calculated and transcription factor enrichment analysis based on the TRRUST database found that NF-κB and STAT3 were preferentially activated transcription activators in the score-high group (Figure 2B), possibly indicating that increased IFNGR1 and IFNGR2 expression was associated with an alternative activation state of macrophages in the glioma microenvironment. In turn, STAT1 was activated at a higher level in the score-low group (Figure 2C), which may indicate a classical activation state of the macrophages.
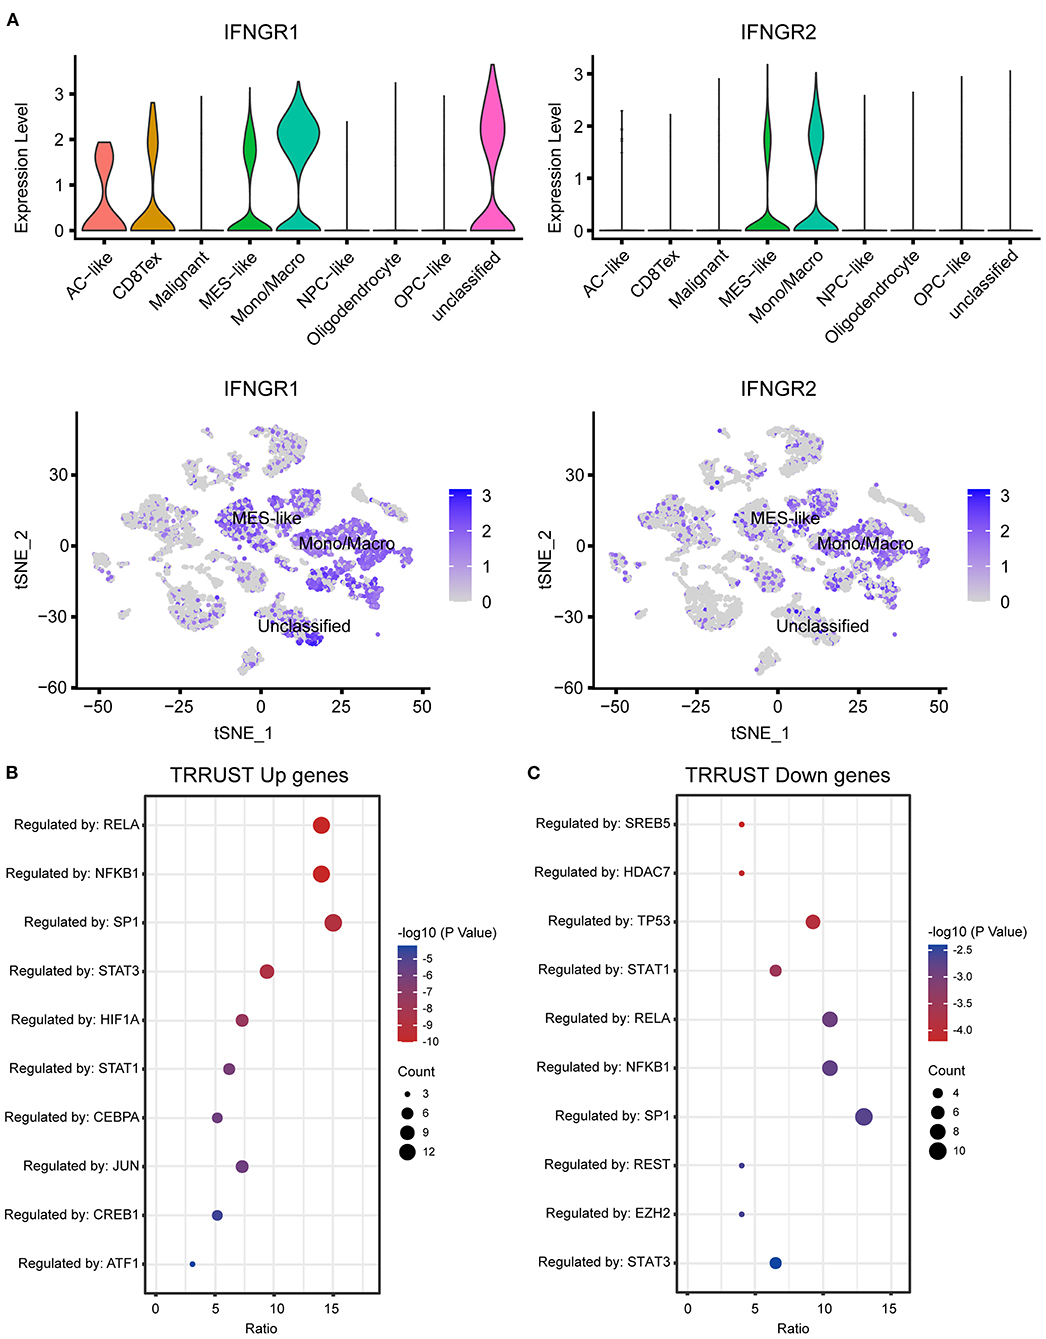
Figure 2. Association of IFNGR1 and IFNGR2 expression with glioma-associated macrophages. (A) The expression of IFNGR1 and IFNGR2 in each cell type. Enrichment analysis of transcription factors between IFNGR1 and IFNGR2 ssGSEA score-high and -low groups, (B) upregulated DEGs (logFC > 0.5) were subscribed to the translational regulation of preferentially NF-κB and STAT3, and (C) downregulated DEGs were subscribed preferentially to STAT1.
The IFNGR Score Was Indicative of a Malignant Phenotype of Glioma
Then we explored the association between the IFNGR score and prevalent clinicopathological features of glioma. In terms of histology, the IFNGR score was lowest in oligodendroglioma and sequentially increased in oligoastrocytoma, astrocytoma, and glioblastoma (Figure 3A). Likewise, the IFNGR score increased with the WHO tumor grade, with WHO grade IV having the highest IFNGR scores (Figure 3B). Among the transcriptome subtype of glioma, the IFNGR score was lower in the neural and proneural subtypes and highest in the mesenchymal subtype (Figure 3C). In terms of molecular pathology biomarkers, samples of IDH1 wildtype tended to have increased IFNGR scores (Figure 3D). Patients with 1p19q co-deletion had decreased IFNGR score, possibly because 1p19q co-deletion was associated with oligodendroglial histology of glioma (Figure 3E). Besides, samples with unmethylated MGMT promoters had higher IFNGR scores (Figure 3F). Moreover, samples with increased IFNGR scores had decreased tumor purity, in line with the putative pro-inflammatory microenvironment of the IFNGR score-high group (Figure 3G). Together, these results demonstrated that increased IFNGR scores were likely to indicate a high degree of malignancy in gliomas.
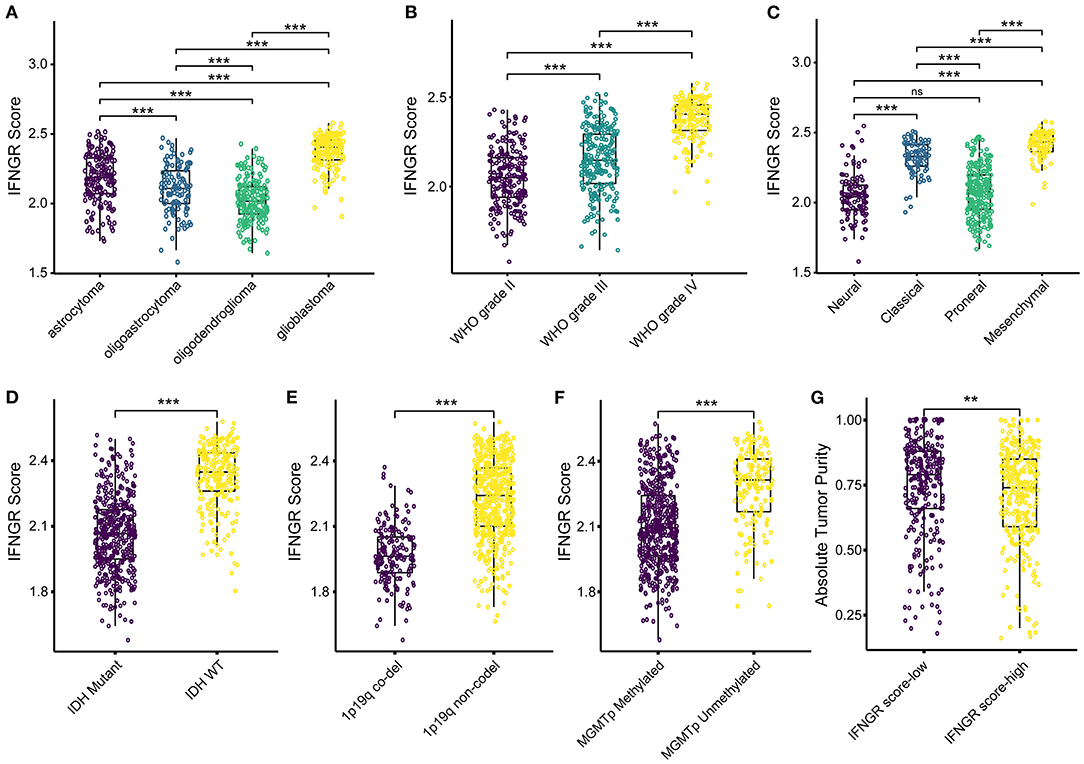
Figure 3. The association between the IFNGR score and clinicopathological parameters of glioma. The distribution of the IFNGR score in (A) histology class, (B) WHO grade, and (C) transcriptome subtype. The association between the IFNGR score and molecular pathology biomarkers, including (D) IDH mutation status, (E) 1p19q co-deletion status, and (F) MGMT promoter methylation status. (G) Tumor purity estimated using ABSOLUTE algorithm between the IFNGR score-high and -low groups. ** represents p < 0.01, *** represents p < 0.001.
An Increased IFNGR Score Was Indicative of Poor Prognosis and Short-Term Glioma Relapse
Next, we investigated the prognostic significance of the IFNGR score. In the TCGA cohort, an increased IFNGR score strongly suggested a poor prognosis (p < 0.0001, median survival of 722 days in the IFNGR score-high group), along with a significantly decreased progression-free interval (PFI) (p < 0.0001, median PFI of 402 days in the IFNGR score-high group) (Figure 4A). Similar results were yielded in the CGGA325 and CGGA693 cohorts (p < 0.0001, the median survival of 423 and 640 days in the IFNGR score-high group, respectively), as well as in the WHO grade III-IV gliomas. Besides, univariate Cox regression analysis showed that the IFNGR-based group had independent risk prognostic significance, with an HR of 2.95 (with the IFNGR score-low group being the reference), suggesting a nearly 3-fold increase in mortality of patients in the IFNGR score-high (Figure 4B). Notably, the IFNGR-based group held up as an independent risk prognostic factor in multiple datasets with HRs ranging from 2.95 (TCGA) to 1.24 (CGGA301) (Figure 4C). Moreover, time-dependent ROC analysis exhibited 1- to 5-year AUC values of 76, 78, 80, 80, and 81% for the IFNGR-based group, second to age, WHO grade, and IDH mutation-based groups, and superior to MGMT promoter (Figure 4D). Given the significantly improved PFI in the IFNGR score-low group, the association between the IFNGR score and tumor relapse was further explored. Samples were divided into short-term relapse group (PFI < 6 months, n = 177) and delayed relapse group (PFI > 12 months, n = 389). For patients who suffered from WHO grade III glioma, the IFNGR score was significantly higher in the early relapse group (p < 0.001) (Figure 4E). In terms of transcriptome subtypes, samples of NE and PN subtypes with increased IFNGR scores tended to have short-term tumor recurrence (p < 0.05) (Figure 4F).
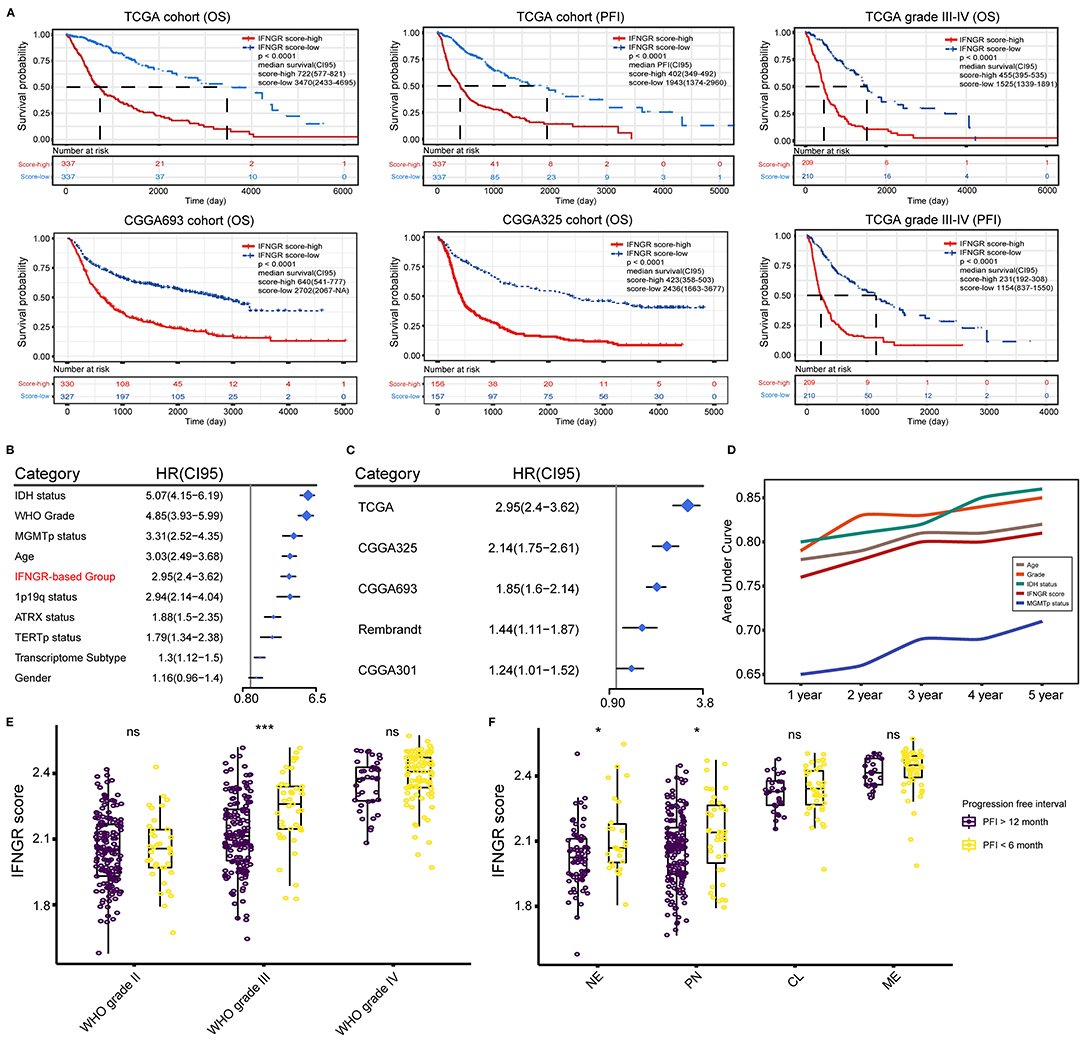
Figure 4. Prognostic significance of the IFNGR-based group. (A) K-M analysis of the IFNGR-based group in terms of OS and PFI based on TCGA, CGGA693, and CGGA325 cohorts. The prognostic value of IFNGR-based group in WHO grade III and IV gliomas was also exhibited. (B) Univariate Cox regression of the independent prognostic significance of the IFNGR-based group and other clinicopathological parameters based on the TCGA cohort. (C) Univariate Cox regression analysis of the independent prognostic significance of the IFNGR-based group based on TCGA, CGGA693, and CGGA325 group, as well as two external validation data sets (Rembrandt, n = 476, and CGGA301, n = 301). (D) Time-dependent ROC and corresponding AUCs of age, WHO tumor grade, IDH mutation status, IFNGR score, and MGMT promoter methylation status. The association between the IFNGR score and tumor early (PFI < 6 months) and delayed (PFI > 12 months) relapse in different tumor classifications including (E) WHO tumor grade, and (F) transcriptome subtype. * represents p < 0.05.
The IFNGR-Based Group Predicts the ICB Responsiveness of Glioma
Lastly, we interrogated whether the IFNGR score had the potential to predict the ICB responsiveness of glioma. The fraction of M2 macrophages was inferred using CIBERSORT. Correlation analysis found that the IFNGR score was positively correlated with the fraction of M2 (Figure 5A), in line with the results of transcription factor enrichment analysis. Besides, we found that the IFNGR score-high group had increased expression of immune checkpoints, including PD-L1, PD-L2, TIM3, and CTLA-4 (Figure 5B), consistent with the finding thatM2 macrophages express substantial immune checkpoint (36). Then, sample responsiveness to ICB therapy was evaluated. We employed TIDE and Submap algorithm to predict the responsiveness of samples to ICB and compared the results of the IFNGR-based groups with previously validated IFNG-related gene signatures-based groups. Based on the TCGA cohort, the IFNGR score-high group tended to respond to anti-PD-1 therapy (Bonferroni corrected p = 0.016), similar to the previously established IFNG-related gene signatures which have been validated by experiments (Figure 5C). Similar results were yielded using the CGGA325 cohort, with the IFNGR score-high group being more likely to respond to the anti-PD1 therapy (Bonferroni corrected p = 0.001) (Figure 5D). Therefore, these results indicated that an increased IFNGR score was associated with sample sensitivity to ICB treatment.
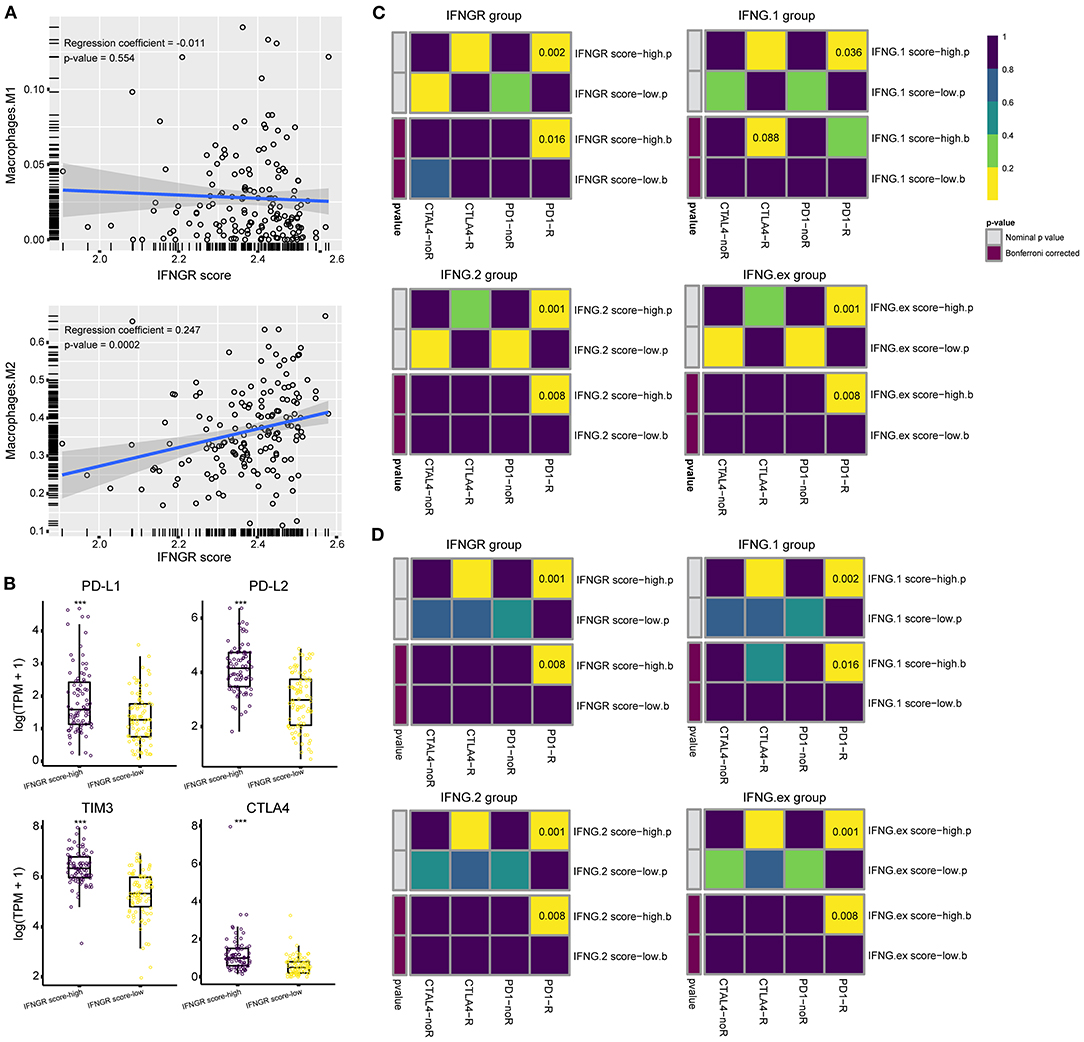
Figure 5. The IFNGR-based group predicts ICB responsiveness of glioma. (A) Correlation analysis between the IFNGR score and M2 fraction inferred by CIBERSORT. (B) The expression of immune checkpoints between the IFNGR score-high and -low groups. TIDE algorithm estimates the ICB responsiveness of the IFNGR score, IFNG.1, IFNG.2, and IFNG.ex-based group using the (C) TCGA and (D) CGGA325 cohort. The predicted results were further corrected by a machine learning algorithm, SubMap. *** represents p < 0.001.
Discussion
Gliomas include LGG and GBM, and their accurate diagnosis and effective treatment remain a challenge. In this study, we have developed a concise IFNG-related gene signature to characterize the prognosis of gliomas based on the expression of IFNGR1 and IFNGR2. As expected, the IFNGR score well represents the IFNG-related biological processes and extensively correlates with clinicopathological parameters that indicate a poor prognosis of glioma. Notably, we found that the IFNGR score was a robust prognostic biomarker of glioma (as well as high-grade glioma), and had the potential to screen ICB responders. Together, our work provides valuable information for the diagnosis, prognosis, and classification of gliomas and may help to optimize immunotherapy.
To our knowledge, we have for the first time explored the role of IFNGR1 and IFNGR2 in gliomas. IFNGR1 and IFNGR2 comprise the heterodimeric receptor for IFNG and their dysfunction is involved in various immune-related pathologies (7). One clinical study containing 213 patients and 733 controls has shown a correlation between IFNGR1−56C/T polymorphism and early onset of gastric carcinoma (11). A possible explanation is that individuals carrying the IFNGR1−56*T allele produce more IFNGR1, which renders cells more sensitive to IFNG, resulting in a more pro-inflammatory microenvironment upon H pylori infection. Besides, loss of tumor-suppressive transcription factor Elf5 promotes the growth and metastasis of triple-negative breast cancer through stabilizing IFNGR1 (14). On the other hand, the IFNGR2 is involved in the regulation of Th1 and Th17 homeostasis, and the lack of which is associated with mycobacterial disease (12, 13). In line with these findings, we found that the IFNGR score was positively correlated with the malignant biomarkers of gliomas in terms of histology, WHO grade, and transcriptome subtype. In addition, GO analysis corroborates the pro-inflammatory microenvironment of the IFNGR score-high group, suggesting that the upregulation of IFNGR1 and IFNGR2 was associated with enhanced inflammatory and immune response in gliomas. Nevertheless, an active immune response does not necessarily benefit glioma patients. For instance, the immune cytolytic activity measuring the function of CD8+ T cell, and the IFNG response genes indicating activation of adaptive immune responses were negatively correlated with the overall survival of glioma patients (4, 37), which is in line with our findings. Therefore, manipulation of the immune response for long-term control of glioma growth requires a deeper understanding of the composition of the immune response and the specific tumor microenvironment of gliomas.
IFNG is a double-edged sword immune-modulator and its role in glioma remains controversial. On the one hand, IFNG involves in the differentiation of Th1 cells, maintains the Th1-type immune response, as well as enhances the cytotoxicity of T lymphocytes, making the IFNG gene signatures effective biomarkers of an activated anti-tumor immune response (9, 38–40). Nevertheless, studies revealed that IFNG promotes tumor immune evasion by upregulating PD-L1 in a JAK-STAT pathway-dependent manner, implying that tumors characterized by increased IFNG response may be sensitive to immune checkpoint blockade therapy (4, 8, 9, 41). Given that IFNGR1 and IFNGR2 are receptors indispensable in the IFNG-mediated activation of the JAK and STAT families (7, 10), it was plausible that the 2-gene signature characterizes the upregulation of the IFNG signaling pathway well, and that patients in the IFNGR score-high group were potential responders to ICB therapy. However, multiple mechanisms are involved in the formation of glioma immunosuppressive microenvironment. For example, TGF-beta is involved in the inhibition of antigen presentation, the function of antigen-presenting cells, and the activation of T cells (42), COX-2 and PGE2 participate in tumor growth and angiogenesis (43), as well as CCL2, recruits immunosuppressive cells such as regulatory T cells and MDSC (44, 45). Therefore, it is necessary to take into account the role of other immunosuppressive mechanisms while applying ICB in the treatment of gliomas.
Another interesting issue is about the polarization of macrophages in the glioma microenvironment. Tremendous studies have demonstrated that macrophages tend to acquire pro-inflammatory M1 phenotype when stimulated by IFNG (46, 47), and LPS, TNF, and IFN-β also drive macrophage polarizing to a pro-inflammatory phenotype (46). Instead, IL-4, IL-13, and glucocorticoid induce alternative activation of macrophages (46, 48). Although various IFNG-related inflammatory responses may be active in the glioma microenvironment with elevated IFNGR scores, macrophages with increased expression of IFNGR1 and IFNGR2 were preferentially subject to transcriptional regulation by NF-κB and STAT3. Wenjing Xuan et al. summarized that NF-κB and STAT3 skewing microglia in the glioma microenvironment to an alternative activation phenotype (49), indicating that macrophages with increased IFNGR1 and IFNGR2 were probably pro-tumoral M2. Recently, we have reported that in the glioma microenvironment, levels of IL4, IL13, IL10, and TGFβ are increased by the IFNG response, which constitute a regulatory network of inflammatory responses and ultimately drives macrophages toward M2-type polarization (50). Therefore, we presumed that more effort is needed to clarify the association between the type of inflammation in the glioma microenvironment and the functional state of macrophages.
Conclusions
In conclusion, we have constructed a clinical valuable IFNG-related gene signature for gliomas based on large-size and multi-cohort samples. These findings were based on general bioinformatics analysis and reliable statistical methodologies, but further basic and clinical studies are needed to verify their validity as well as molecular mechanisms.
Data Availability Statement
The datasets presented in this study can be found in online repositories. The names of the repository/repositories and accession number(s) can be found in the article/supplementary material.
Author Contributions
YL and HJ conceived and designed the study. HJ provided analytical technical support and drafted the manuscript. YL participated in the production of charts and pictures and supervised the study. YL and XG revised the manuscript. All authors have read and approved the final manuscript.
Conflict of Interest
The authors declare that the research was conducted in the absence of any commercial or financial relationships that could be construed as a potential conflict of interest.
Publisher's Note
All claims expressed in this article are solely those of the authors and do not necessarily represent those of their affiliated organizations, or those of the publisher, the editors and the reviewers. Any product that may be evaluated in this article, or claim that may be made by its manufacturer, is not guaranteed or endorsed by the publisher.
Acknowledgments
We thank the TCGA, CGGA, GlioVis, and other databases for their contributions to the progress of scientific research, the developers of the R package for their efforts in data analysis.
References
1. Jiang T, Mao Y, Ma W, Mao Q, You Y, Yang X, et al. CGCG clinical practice guidelines for the management of adult diffuse gliomas. Cancer Lett. (2016) 375:263–273. doi: 10.1016/j.canlet.2016.01.024
2. Tan AC, Ashley DM, Lopez GY, Malinzak M, Friedman HS, Khasraw M. Management of glioblastoma: state of the art and future directions. CA Cancer J Clin. (2020) 70:299–312. doi: 10.3322/caac.21613
3. Siegelin MD, Schneider E, Westhoff MA, Wirtz CR, Karpel-Massler G. Current state and future perspective of drug repurposing in malignant glioma. Semin Cancer Biol. (2019) 68:92–104. doi: 10.1016/j.semcancer.2019.10.018
4. Qian J, Wang C, Wang B, Yang J, Wang Y, Luo F, et al. The IFN-γ/PD-L1 axis between T cells and tumor microenvironment: hints for glioma anti-PD-1/PD-L1 therapy. J Neuroinflammation. (2018) 15:290. doi: 10.1186/s12974-018-1330-2
5. Gocher A, Workman C, Vignali D. Interferon-γ: teammate or opponent in the tumour microenvironment? Nat Rev Immunol. (2021) 22:158–172. doi: 10.1038/s41577-021-00566-3
6. Nezu N, Ryu K, Koide Y, Yoshida TO. Regulation of HLA class II molecule expressions by IFN-gamma. The signal transduction mechanism in glioblastoma cell lines. J Immunol. (1990) 145:3126–35.
7. Alspach E, Lussier DM, Schreiber RD. Interferon gamma and its important roles in promoting and inhibiting spontaneous and therapeutic cancer immunity. Cold Spring Harb Perspect Biol. (2019) 11:a028480. doi: 10.1101/cshperspect.a028480
8. Zhao T, Li Y, Zhang J, Zhang B. PD-L1 expression increased by IFN-γ via JAK2-STAT1 signaling and predicts a poor survival in colorectal cancer. Oncol Lett. (2020) 20:1127–34. doi: 10.3892/ol.2020.11647
9. Ayers M, Lunceford J, Nebozhyn M, Murphy E, Loboda A, Kaufman D, et al. IFN-γ-related mRNA profile predicts clinical response to PD-1 blockade. J Clin Investig. (2017) 127:2930–40. doi: 10.1172/JCI91190
10. Castro F, Cardoso A, Gonçalves R, Serre K, Oliveira M. Interferon-Gamma at the crossroads of tumor immune surveillance or evasion. Front Immunol. (2018) 9:847. doi: 10.3389/fimmu.2018.00847
11. Canedo P, Corso G, Pereira F, Lunet N, Suriano G, Figueiredo C, et al. The interferon gamma receptor 1 (IFNGR1) 56C/T gene polymorphism is associated with increased risk of early gastric carcinoma. Gut. (2008) 57:1504–8. doi: 10.1136/gut.2007.143578
12. Holzer U, Reinhardt K, Lang P, Handgretinger R, Fischer N. Influence of a mutation in IFN-c receptor 2 (IFNGR2) in human cells on the generation of Th17 cells in memory T cells. Hum Immunol. (2013) 74:693–700. doi: 10.1016/j.humimm.2013.02.002
13. Kong X, Vogt G, Itan Y, Macura-Biegun A, Szaflarska A, Kowalczyk D, et al. Haploinsufficiency at the human IFNGR2 locus contributes to mycobacterial disease. Hum Mol Genet. (2013) 22:769–81. doi: 10.1093/hmg/dds484
14. Singh S, Kumar S, Srivastava R, Nandi A, Thacker G, Murali H, et al. Loss of ELF5–FBXW7 stabilizes IFNGR1 to promote the growth and metastasis of triple-negative breast cancer through interferon-γ signalling. Nat Cell Biol. (2020) 22:591–602. doi: 10.1038/s41556-020-0495-y
15. Bao ZS, Chen HM, Yang MY, Zhang CB, Yu K, Ye WL, et al. RNA-seq of 272 gliomas revealed a novel, recurrent PTPRZ1-MET fusion transcript in secondary glioblastomas. Genome Res. (2014) 24:1765–73. doi: 10.1101/gr.165126.113
16. Wang Y, Qian T, You G, Peng X, Chen C, You Y, et al. Localizing seizure-susceptible brain regions associated with low-grade gliomas using voxel-based lesion-symptom mapping. Neuro Oncol. (2015) 17:282–8. doi: 10.1093/neuonc/nou130
17. Zhao Z, Meng F, Wang W, Wang Z, Zhang C, Jiang T. Comprehensive RNA-seq transcriptomic profiling in the malignant progression of gliomas. Sci Data. (2017) 4:170024. doi: 10.1038/sdata.2017.24
18. Liu X, Li Y, Qian Z, Sun Z, Xu K, Wang K, et al. A radiomic signature as a non-invasive predictor of progression-free survival in patients with lower-grade gliomas. Neuroimage. Clin. (2018) 20:1070–7. doi: 10.1016/j.nicl.2018.10.014
19. Sun D, Wang J, Han Y, Dong X, Ge J, Zheng R, et al. TISCH: a comprehensive web resource enabling interactive single-cell transcriptome visualization of tumor microenvironment. Nucleic Acids Res. (2020) 49:D1420–30. doi: 10.1101/2020.08.15.251959
20. Neftel C, Laffy J, Filbin MG, Hara T, Shore ME, Rahme GJ, et al. An integrative model of cellular states, plasticity, and genetics for glioblastoma. Cell. (2019) 178:835–849 e821. doi: 10.1016/j.cell.2019.06.024
21. Hanzelmann S, Castelo R, Guinney J. GSVA: gene set variation analysis for microarray and RNA-seq data. BMC Bioinformatics. (2013) 14:7. doi: 10.1186/1471-2105-14-7
22. Subramanian A, Tamayo P, Mootha VK, Mukherjee S, Ebert BL, Gillette MA, et al. Gene set enrichment analysis: a knowledge-based approach for interpreting genome-wide expression profiles. Proc Natl Acad Sci USA. (2005) 102:15545–50. doi: 10.1073/pnas.0506580102
23. Huang da W, Sherman BT, Lempicki RA. Bioinformatics enrichment tools: paths toward the comprehensive functional analysis of large gene lists. Nucleic Acids Res. (2009) 37:1–13. doi: 10.1093/nar/gkn923
24. Huang dW, Sherman B, Lempicki R. Systematic and integrative analysis of large gene lists using DAVID bioinformatics resources. Nat Protoc. (2009) 4:44–57. doi: 10.1038/nprot.2008.211
25. Robinson MD, McCarthy DJ, Smyth GK. edgeR: a Bioconductor package for differential expression analysis of digital gene expression data. Bioinformatics. (2010) 26:139–40. doi: 10.1093/bioinformatics/btp616
26. Ritchie ME, Phipson B, Wu D, Hu Y, Law CW, Shi W, et al. limma powers differential expression analyses for RNA-sequencing and microarray studies. Nucleic Acids Res. (2015) 43:e47. doi: 10.1093/nar/gkv007
27. Carter SL, Cibulskis K, Helman E, McKenna A, Shen H, Zack T, et al. Absolute quantification of somatic DNA alterations in human cancer. Nat Biotechnol. (2012) 30:413–21. doi: 10.1038/nbt.2203
28. Hao Y, Hao S, Andersen-Nissen E, Mauck WM III, Zheng S, Butler A, et al. Integrated analysis of multimodal single-cell data. Cell. (2021) 184:3573–3587 e3529. doi: 10.1016/j.cell.2021.04.048
29. Zhang X, Lan Y, Xu J, Quan F, Zhao E, Deng C, et al. CellMarker: a manually curated resource of cell markers in human and mouse. Nucleic Acids Res. (2019) 47:D721–D728. doi: 10.1093/nar/gky900
30. Han H, Cho JW, Lee S, Yun A, Kim H, Bae D, et al. TRRUST v2: an expanded reference database of human and mouse transcriptional regulatory interactions. Nucleic Acids Res. (2018) 46:D380–D386. doi: 10.1093/nar/gkx1013
31. Zhou Y, Zhou B, Pache L, Chang M, Khodabakhshi AH, Tanaseichuk O, et al. Metascape provides a biologist-oriented resource for the analysis of systems-level datasets. Nat Commun. (2019) 10:1523. doi: 10.1038/s41467-019-09234-6
32. Newman AM, Liu CL, Green MR, Gentles AJ, Feng W, Xu Y, et al. Robust enumeration of cell subsets from tissue expression profiles. Nat Methods. (2015) 12:453–7. doi: 10.1038/nmeth.3337
33. Hoshida Y, Brunet JP, Tamayo P, Golub TR, Mesirov JP. Subclass mapping: identifying common subtypes in independent disease data sets. PLoS ONE. (2007) 2:e1195. doi: 10.1371/journal.pone.0001195
34. Roh W, Chen PL, Reuben A, Spencer CN, Prieto PA, Miller JP, et al. Integrated molecular analysis of tumor biopsies on sequential CTLA-4 and PD-1 blockade reveals markers of response and resistance. Sci Transl Med. (2017) 9:eaah3560. doi: 10.1126/scitranslmed.aah3560
35. Jiang P, Gu S, Pan D, Fu J, Sahu A, Hu X, et al. Signatures of T cell dysfunction and exclusion predict cancer immunotherapy response. Nat Med. (2018) 24:1550–8. doi: 10.1038/s41591-018-0136-1
36. Dancsok AR, Gao D, Lee AF, Steigen SE, Blay JY, Thomas DM, et al. Tumor-associated macrophages and macrophage-related immune checkpoint expression in sarcomas. Oncoimmunology. (2020) 9:1747340. doi: 10.1080/2162402X.2020.1747340
37. Wang Z, Wang Z, Li G, Wang Q, Bao Z, Zhang C, et al. Immune cytolytic activity is associated with genetic and clinical properties of glioma. Front Immunol. (2019) 10:1756. doi: 10.3389/fimmu.2019.01756
38. Bradley LM, Dalton DK, Croft M. A direct role for IFN-gamma in regulation of Th1 cell development. J Immunol. (1996) 157:1350–8.
39. Shankaran V, Ikeda H, Bruce AT, White JM, Swanson PE, Old LJ, et al. IFNgamma and lymphocytes prevent primary tumour development and shape tumour immunogenicity. Nature. (2001) 410:1107–11. doi: 10.1038/35074122
40. Shao S, Risch E, Burner D, Lu L, Minev B, Ma W. IFNgamma enhances cytotoxic efficiency of the cytotoxic T lymphocytes against human glioma cells. Int Immunopharmacol. (2017) 47:159–65. doi: 10.1016/j.intimp.2017.04.003
41. Moon JW, Kong SK, Kim BS, Kim HJ, Lim H, Noh K, et al. IFNgamma induces PD-L1 overexpression by JAK2/STAT1/IRF-1 signaling in EBV-positive gastric carcinoma. Sci Rep. (2017) 7:17810. doi: 10.1038/s41598-017-18132-0
42. Gorelik L, Flavell RA. Transforming growth factor-beta in T-cell biology. Nat Rev Immunol. (2002) 2:46–53. doi: 10.1038/nri704
43. Onguru O, Gamsizkan M, Ulutin C, Gunhan O. Cyclooxygenase-2. (Cox-2) expression and angiogenesis in glioblastoma. Neuropathology. (2008) 28:29–34. doi: 10.1111/j.1440-1789.2007.00828.x
44. Huang B, Lei Z, Zhao J, Gong W, Liu J, Chen Z, et al. CCL2/CCR2 pathway mediates recruitment of myeloid suppressor cells to cancers. Cancer Lett. (2007) 252:86–92. doi: 10.1016/j.canlet.2006.12.012
45. Ahn BJ, Pollack IF, Okada H. Immune-checkpoint blockade and active immunotherapy for glioma. Cancers. (2013) 5:1379–412. doi: 10.3390/cancers5041379
46. Xue J, Schmidt SV, Sander J, Draffehn A, Krebs W, Quester I, et al. Transcriptome-based network analysis reveals a spectrum model of human macrophage activation. Immunity. (2014) 40:274–88. doi: 10.1016/j.immuni.2014.01.006
47. Hambardzumyan D, Gutmann DH, Kettenmann H. The role of microglia and macrophages in glioma maintenance and progression. Nat Neurosci. (2016) 19:20–7. doi: 10.1038/nn.4185
48. Martinez FO, Helming L, Gordon S. Alternative activation of macrophages: an immunologic functional perspective. Annu Rev Immunol. (2009) 27:451–83. doi: 10.36198/9783838531748
49. Xuan W, Lesniak MS, James CD, Heimberger AB, Chen P. Context-dependent glioblastoma-macrophage/microglia symbiosis and associated mechanisms. Trends Immunol. (2021) 42:280–92. doi: 10.1016/j.it.2021.02.004
Keywords: glioma, IFNGR1, IFNGR2, prognostic, tumor relapse, immune checkpoint blockade therapy
Citation: Li Y, Ji H and Gao X (2022) A 2-Gene Signature Related to Interferon-Gamma Predicts Prognosis and Responsiveness to Immune Checkpoint Blockade of Glioma. Front. Med. 9:846847. doi: 10.3389/fmed.2022.846847
Received: 31 December 2021; Accepted: 25 March 2022;
Published: 15 April 2022.
Edited by:
Sebastien Jaillon, Humanitas University, ItalyReviewed by:
Ryuya Yamanaka, Kyoto Prefectural University of Medicine, JapanYves Delneste, Institut National de la Santé et de la Recherche Médicale (INSERM), France
Copyright © 2022 Li, Ji and Gao. This is an open-access article distributed under the terms of the Creative Commons Attribution License (CC BY). The use, distribution or reproduction in other forums is permitted, provided the original author(s) and the copyright owner(s) are credited and that the original publication in this journal is cited, in accordance with accepted academic practice. No use, distribution or reproduction is permitted which does not comply with these terms.
*Correspondence: Yongzhe Li, bGl5b25nemhlMThAMTYzLmNvbQ==
 Yongzhe Li
 Hang Ji
 Xin Gao1