 Rong Dai
 Chuyi Peng
 Tian Sang
 Meng Cheng
 Yiping Wang
 Lei Zhang
- 1Department of Chinese Medicine, Anhui University of Chinese Medicine, Hefei, China
- 2Graduate School, Anhui University of Chinese Medicine, Hefei, China
- 3Department of Nephrology, The First Affiliated Hospital of Anhui University of Chinese Medicine, Hefei, China
Aim: To construct and validate a risk prediction model for the development of peritoneal dialysis-associated peritonitis (PDAP) in patients undergoing peritoneal dialysis (PD).
Methods: This retrospective analysis included patients undergoing PD at the Department of Nephrology, the First Affiliated Hospital of Anhui University of Chinese Medicine, between January 2016 and January 2021. Baseline data were collected. The primary study endpoint was PDAP occurrence. Patients were divided into a training cohort (n = 264) and a validation cohort (n = 112) for model building and validation. Least Absolute Shrinkage and Selection Operator (LASSO) regression was applied to optimize the screening variables. Predictive models were developed using multifactorial logistic regression analysis with column line plots. Receiver operating characteristic (ROC) curves, calibration curves, and Hosmer-Lemeshow goodness-of-fit tests were used to verify and evaluate the discrimination and calibration of the prediction models. Decision curve analysis (DCA) was used to assess the clinical validity of the prediction models.
Results: Five potential predictors of PDAP after PD catheterization were screened using LASSO regression analysis, including neutrophil-to-lymphocyte ratio (NLR), serum ALBumin (ALB), uric acid (UA), high sensitivity C-reactive protein (hsCRP), and diabetes mellitus (DM). Predictive models were developed by multi-factor logistic regression analysis and plotted in columns. The area under the ROC curve (AUC) values were 0.891 (95% confidence interval [CI]: 0.829–0.844) and 0.882 (95% CI: 0.722–0.957) for the training and validation cohorts, respectively. The Hosmer-Lemeshow test showed a good fit (p = 0.829 for the training cohort; p = 0.602 for the validation cohort). The DCA curves indicated that the threshold probabilities for the training and validation cohorts were 4–64% and 3–90%, respectively, predicting a good net gain for the clinical model.
Conclusion: NLR, ALB, UA, hsCRP, and DM are independent predictors of PDAP after PD catheterization. The column line graph model constructed based on the abovementioned factors has good discriminatory and calibrating ability and helps to predict the risk of PDAP after PD catheterization.
Introduction
Chronic kidney disease (CKD) has become a public health problem, affecting more than 10% of the global population (1). Peritoneal dialysis (PD) is an effective treatment for CKD (2). Peritoneal dialysis-associated peritonitis (PDAP) in patients with end-stage renal disease (ESRD) is one of the major complications of PD and can significantly increase the hospitalization and mortality rates of PD patients. Severe and prolonged PDAP may lead to peritoneal membrane failure and even death (3, 4). The incidence of PDAP in PD patients has been reported to vary widely by region, ranging from 11 to 73% (5).
Several risk factors of PDAP infection are present after PD catheterization in patients with CKD stage 5; however, the magnitude of the risk associated with each factor is unknown. A prediction model may be developed to determine the 1-year risk of PDAP before the insertion of the PD catheter. Such a model may be used to determine a measure of early treatment response that can improve the prognosis. Several investigators, including those from China and abroad, have explored the treatment outcomes for PDAP patients and have built visual prediction models (6–8). However, some factors in the aforementioned prediction models cannot be determined preoperatively, limiting their clinical application. Because of the possible associated adverse outcomes with PDAP, early detection of the PDAP risk is needed in clinical practice. Therefore, preoperative exploration of PDAP risk factors and targeted strategies to reduce the PDAP risk are essential for PD patients.
The aims of this study were to construct a clinical prediction model, visualize the model using column line plots, and finally validate it externally to provide individualized treatment plans for patients based on their 1-year PDAP risk.
Materials and methods
Study population
In this study, 376 patients admitted to Department of Nephrology, the First Affiliated Hospital of Anhui University of Chinese Medicine, with CKD stage 5 who underwent PD catheterization between January 2016 and January 2021 were selected. The study population was randomly split into a training cohort (n = 264) and a validation cohort (n = 112) at a ratio of 7:3 to establish and validate the prediction model. PDAP was diagnosed using the 2016 International Society of Peritoneal Dialysis (ISPD) guidelines for the treatment of peritonitis. The diagnosis of PDAP requires at least two of the following three items, confirmed by two physicians independently: abdominal pain or cloudy peritoneal fluid with or without fever; peritoneal fluid leukocyte count >0.1 × 10⁹/L and percentage of polymorphonuclear cells >50% (duration of abdominal stay ≥2 h); and positive microbiological culture of the permeate (9). The following patients were excluded from the study: (1) those with incomplete medical records, (2) those under the age of 18, (3) those whose dialysis effluent was not cultured, (4) those on immunosuppressant therapy, and (5) those with fungal or tuberculous peritonitis. The study was conducted in accordance with the principles contained in the Declaration of Helsinki and its subsequent amendments, and was approved by the ethics committee of the First Affiliated Hospital of Anhui University of Traditional Chinese Medicine (approval no.: 2021AH-73). All patients have signed the informed consent.
Data collection
We recorded the clinical information (sex, age, education, and comorbidities) and laboratory parameters, including serum white blood cell (WBC) count, red blood cell (RBC) count, hemoglobin (Hb), platelet (PLA), neutrophil-lymphocyte ratio (NLR), RBC distribution width (RDW), alanine transaminase (ALT), aspartate transaminase (AST), serum preALBumin (PA), serum total protein (TP), serum ALBumin (ALB), blood urea nitrogen (BUN), serum creatinine (Scr), uric acid (UA), cystatin C (CysC), glucose, triglycerides (TG), total cholesterol (TC), high-sensitivity C-reactive protein (hsCRP), serum sodium, serum potassium, ALBumin-corrected serum calcium, serum phosphorus, blood magnesium, blood total carbon dioxide (TCO2), ALBumin-to-creatinine ratio (ACR), urinary total protein-to-creatinine ratio (TCR), and 24-h urine protein. All data were collected at admission. The study outcomes included the development of PDAP within 1 year of initiation of PD and was assigned a value of 0 (no PDAP) or 1 (PDAP).
Sample size
The effective sample size in a prediction study is determined on the basis of the number of outcome events, i.e., at least 10 outcome events per variable (EPV) to ensure accuracy (10). To allow for five or fewer predictors in the final multivariate logistic regression model, a predicted training cohort of ≥250 patients was required. Our sample size and the number of outcome events exceeded those determined by the EPV method, suggesting that our predictions are reliable.
Statistical analysis
In this study, missing data with a deletion rate greater than 20% were excluded. Imputation for missing data was considered if missing data were less than 20% (11, 12). Continuous variables conforming to normal distribution were expressed using ±SD and compared between two groups using independent samples t-test. Non-normally distributed data were expressed using median with interquartile range (IQR) and were compared between groups using Wilcoxon test. Categorical data were expressed using composition ratio and compared between groups using χ2 test. Least Absolute Shrinkage and Selection Operator (LASSO) regression was used to screen for the risk factors. Variables included in the model were screened using the Akaike information criterion minimum principle (13). The optimal parameter (λ) in the LASSO model was selected based on the minimum criteria using 10-fold cross-validation with partial likelihood deviation on the Y-axis, log(λ) on the X-axis, Lambda.min and lambda1SE plotted as dashed vertical lines at the optimal values, and lambda1SE as the model optimal value. Based on the individualized prediction model of PD outcomes, a nomogram was constructed. According to the importance of the influence of the prediction variable on the outcome variable, different values were assigned to each of the pre-measured variables, and then the values of each prediction variable were summed, and then the probability of the outcome event was calculated by the function transformation between the summation value and the probability of the outcome event.
In this study, the prediction model was evaluated in terms of three main aspects: discrimination, calibration, and net clinical benefit. The area under curve (AUC) of the receiver operating characteristic (ROC) curve was used to assess discrimination. The discrimination of the prediction model refers to its ability to distinguish between patients receiving PD who did and did not experience PDAP. Calibration curves and Hosmer-Lemeshow goodness-of-fit tests were used to assess calibration. The calibration of the prediction model was defined as the agreement between the predicted and observed probabilities. Decision curve analysis (DCA) was used to assess the clinical utility. DCA is a method for evaluating the clinical usefulness of a prediction model by comparing the net benefit of making clinical decisions based on the model with the net benefit of making decisions based on other strategies. In our study, we performed DCA to evaluate the clinical applicability of the nomogram we developed for predicting the risk of developing PDAP in PD patients. Bootstrap method was used to repeatedly sample 1,000 times for internal validation of the model. Continuous variables were interpolated with mean for data with normal distribution, median for data with skewed distribution, and plural for categorical variables.
Statistical analysis was performed using SPSS (version 26.0; IBM Corp., Armonk, NY, USA) and R (version 4.1.3; R Foundation for Statistical Computing) software. Two-tailed p < 0.05 indicated that the differences were statistically significant.
Results
Comparison of basic characteristics of patients in the training and validation cohorts
In total, 421 patients with CKD who underwent their first PD catheterization between January 2016 and January 2022 were identified. Of them, 376 PD patients with 1-year follow-up were screened and included in the final analysis: 264 (70.2%) patients were assigned to the training cohort and 112 (29.8%) to the validation cohort (Figure 1). There was no statistically significant difference in between the training and validation cohorts in terms of demographic characteristics, laboratory parameters, and comorbidities (all p > 0.05). Age, WBC, RBC, Hb, PLA, NLR, RDW, ALT, AST, PA, TP, BUN, Scr, UA, CysC, glucose, TG, TC, hsCRP, serum sodium, serum potassium, ALBumin-corrected serum calcium, serum phosphorus, serum magnesium, TCO2, ACR, TCR, and 24-h urine protein values were not distributed normally. Therefore, the median values of the aforementioned parameters were used as the cut-off to transform them into dichotomous variables. ALB level was grouped according to professional significance. The other independent variables were defined as categorical variables for analysis (Table 1).
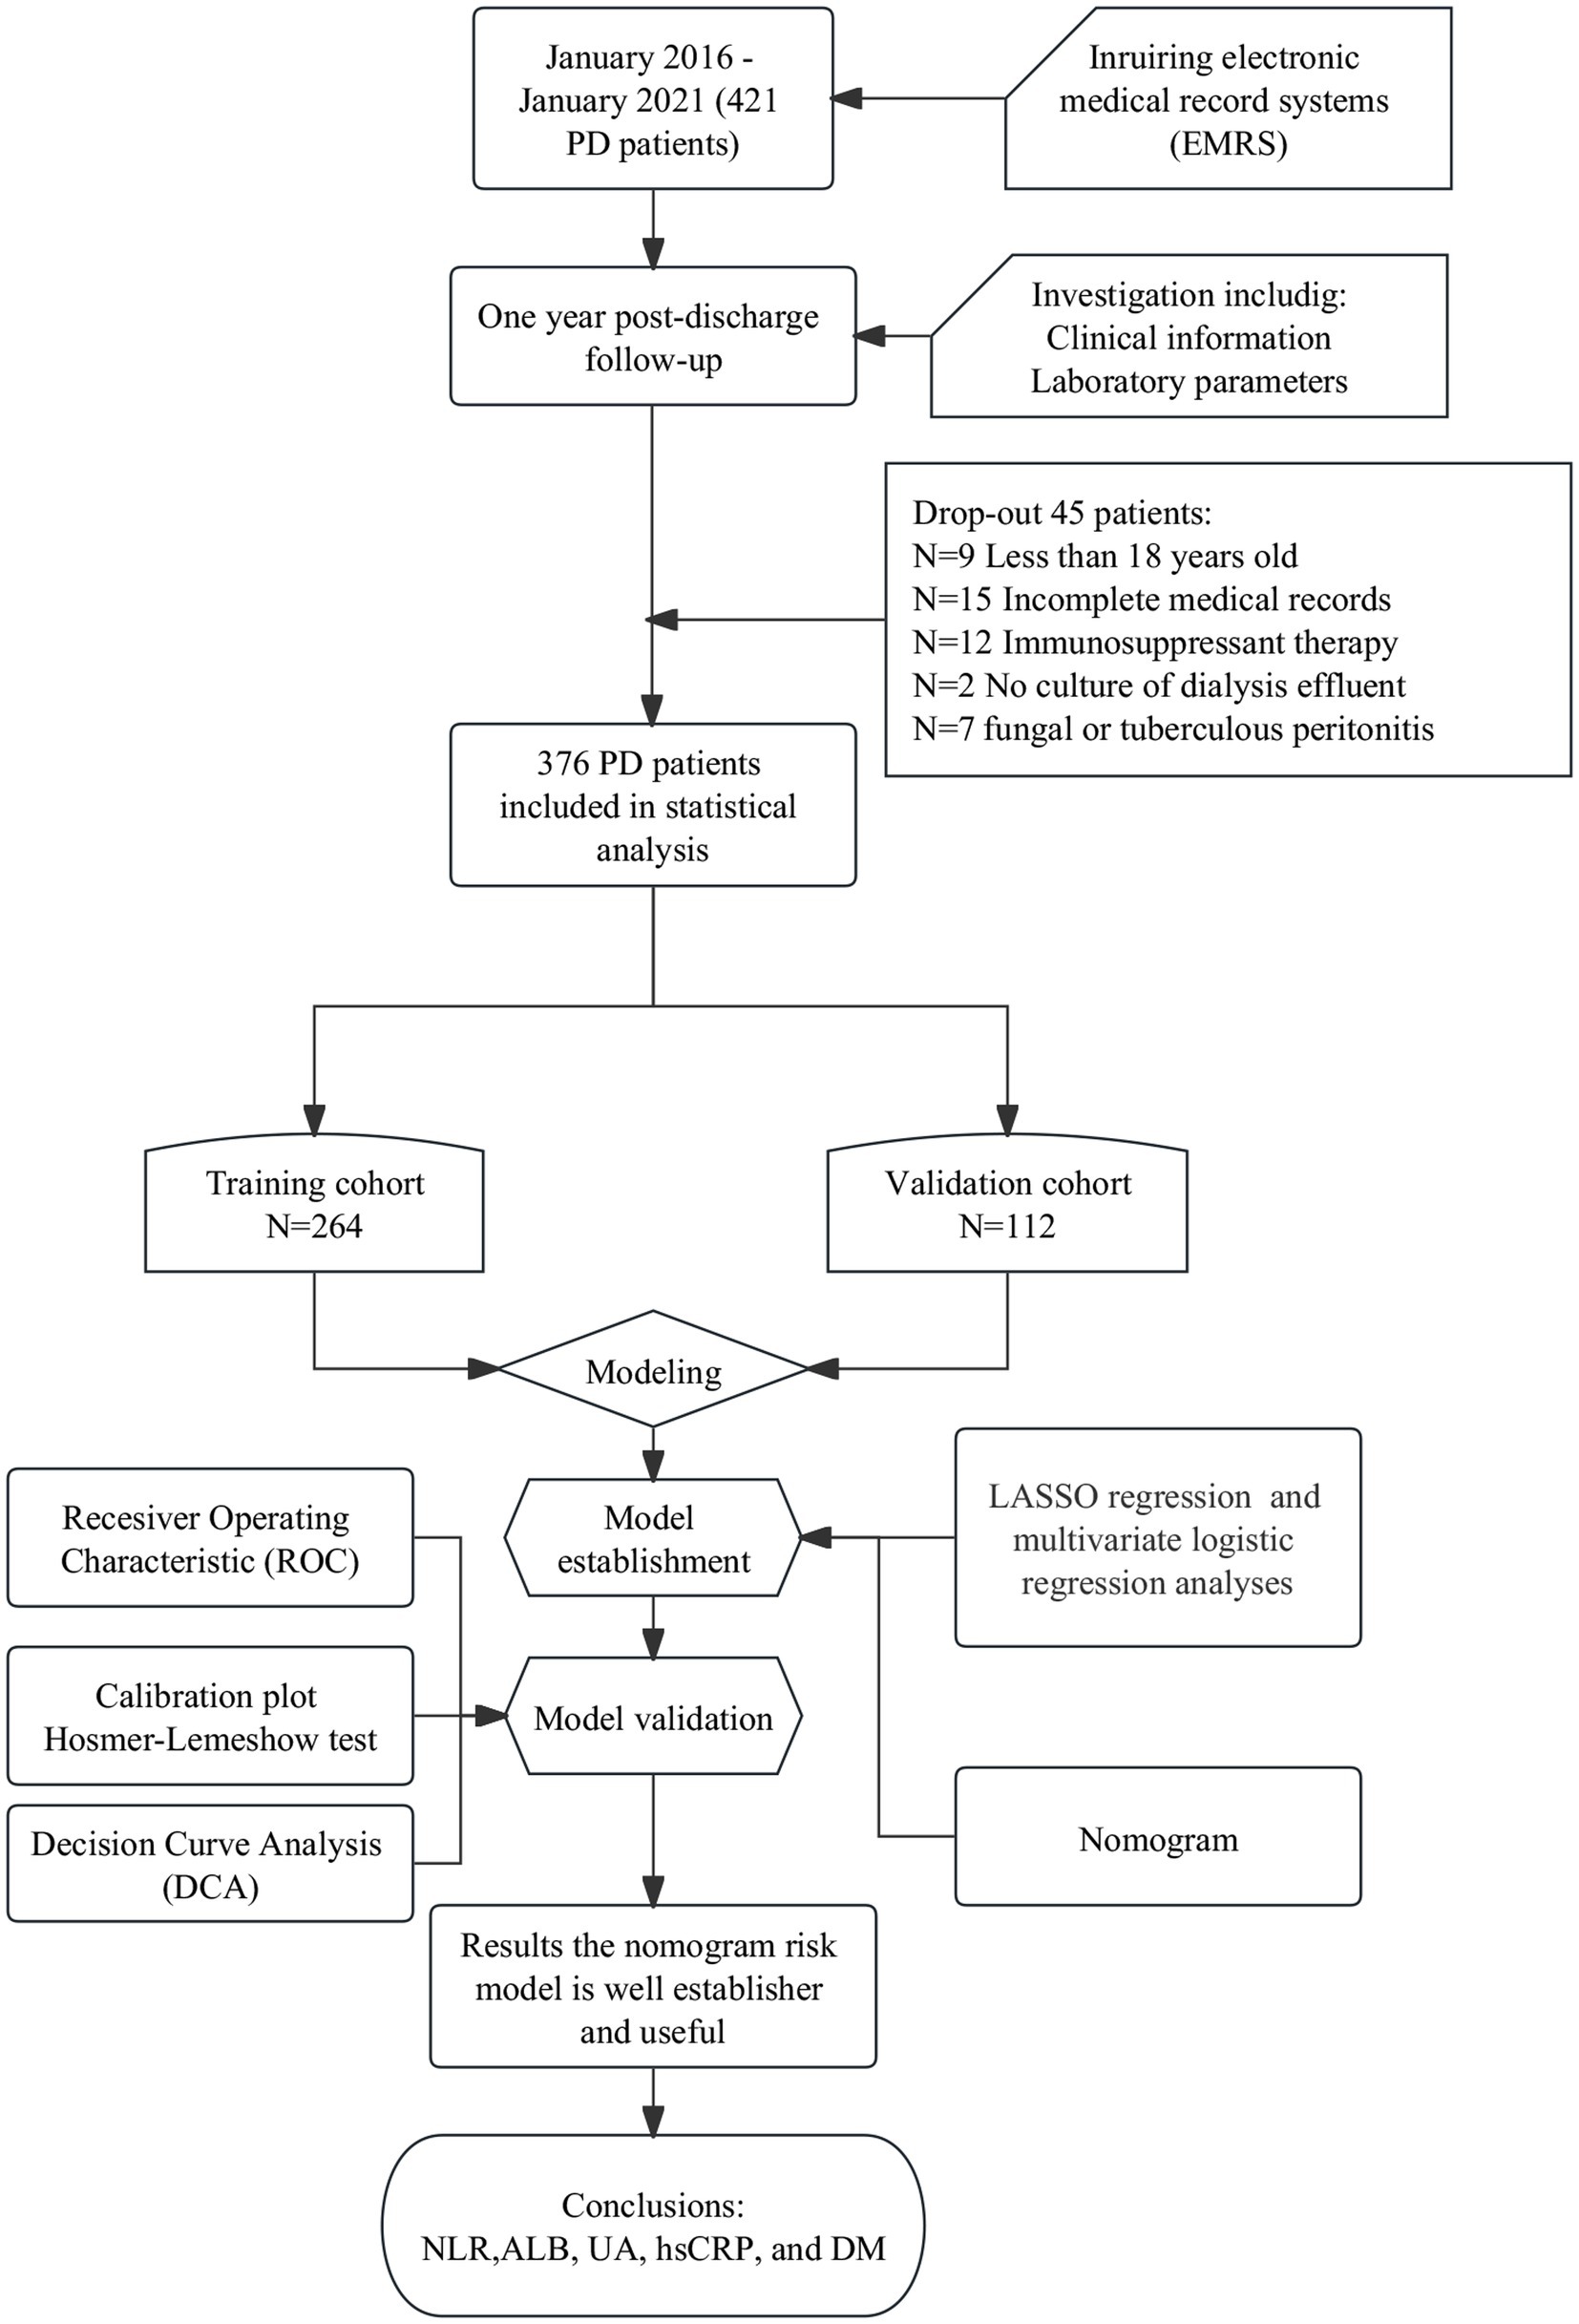
Figure 1. Flow chart of patient inclusion.
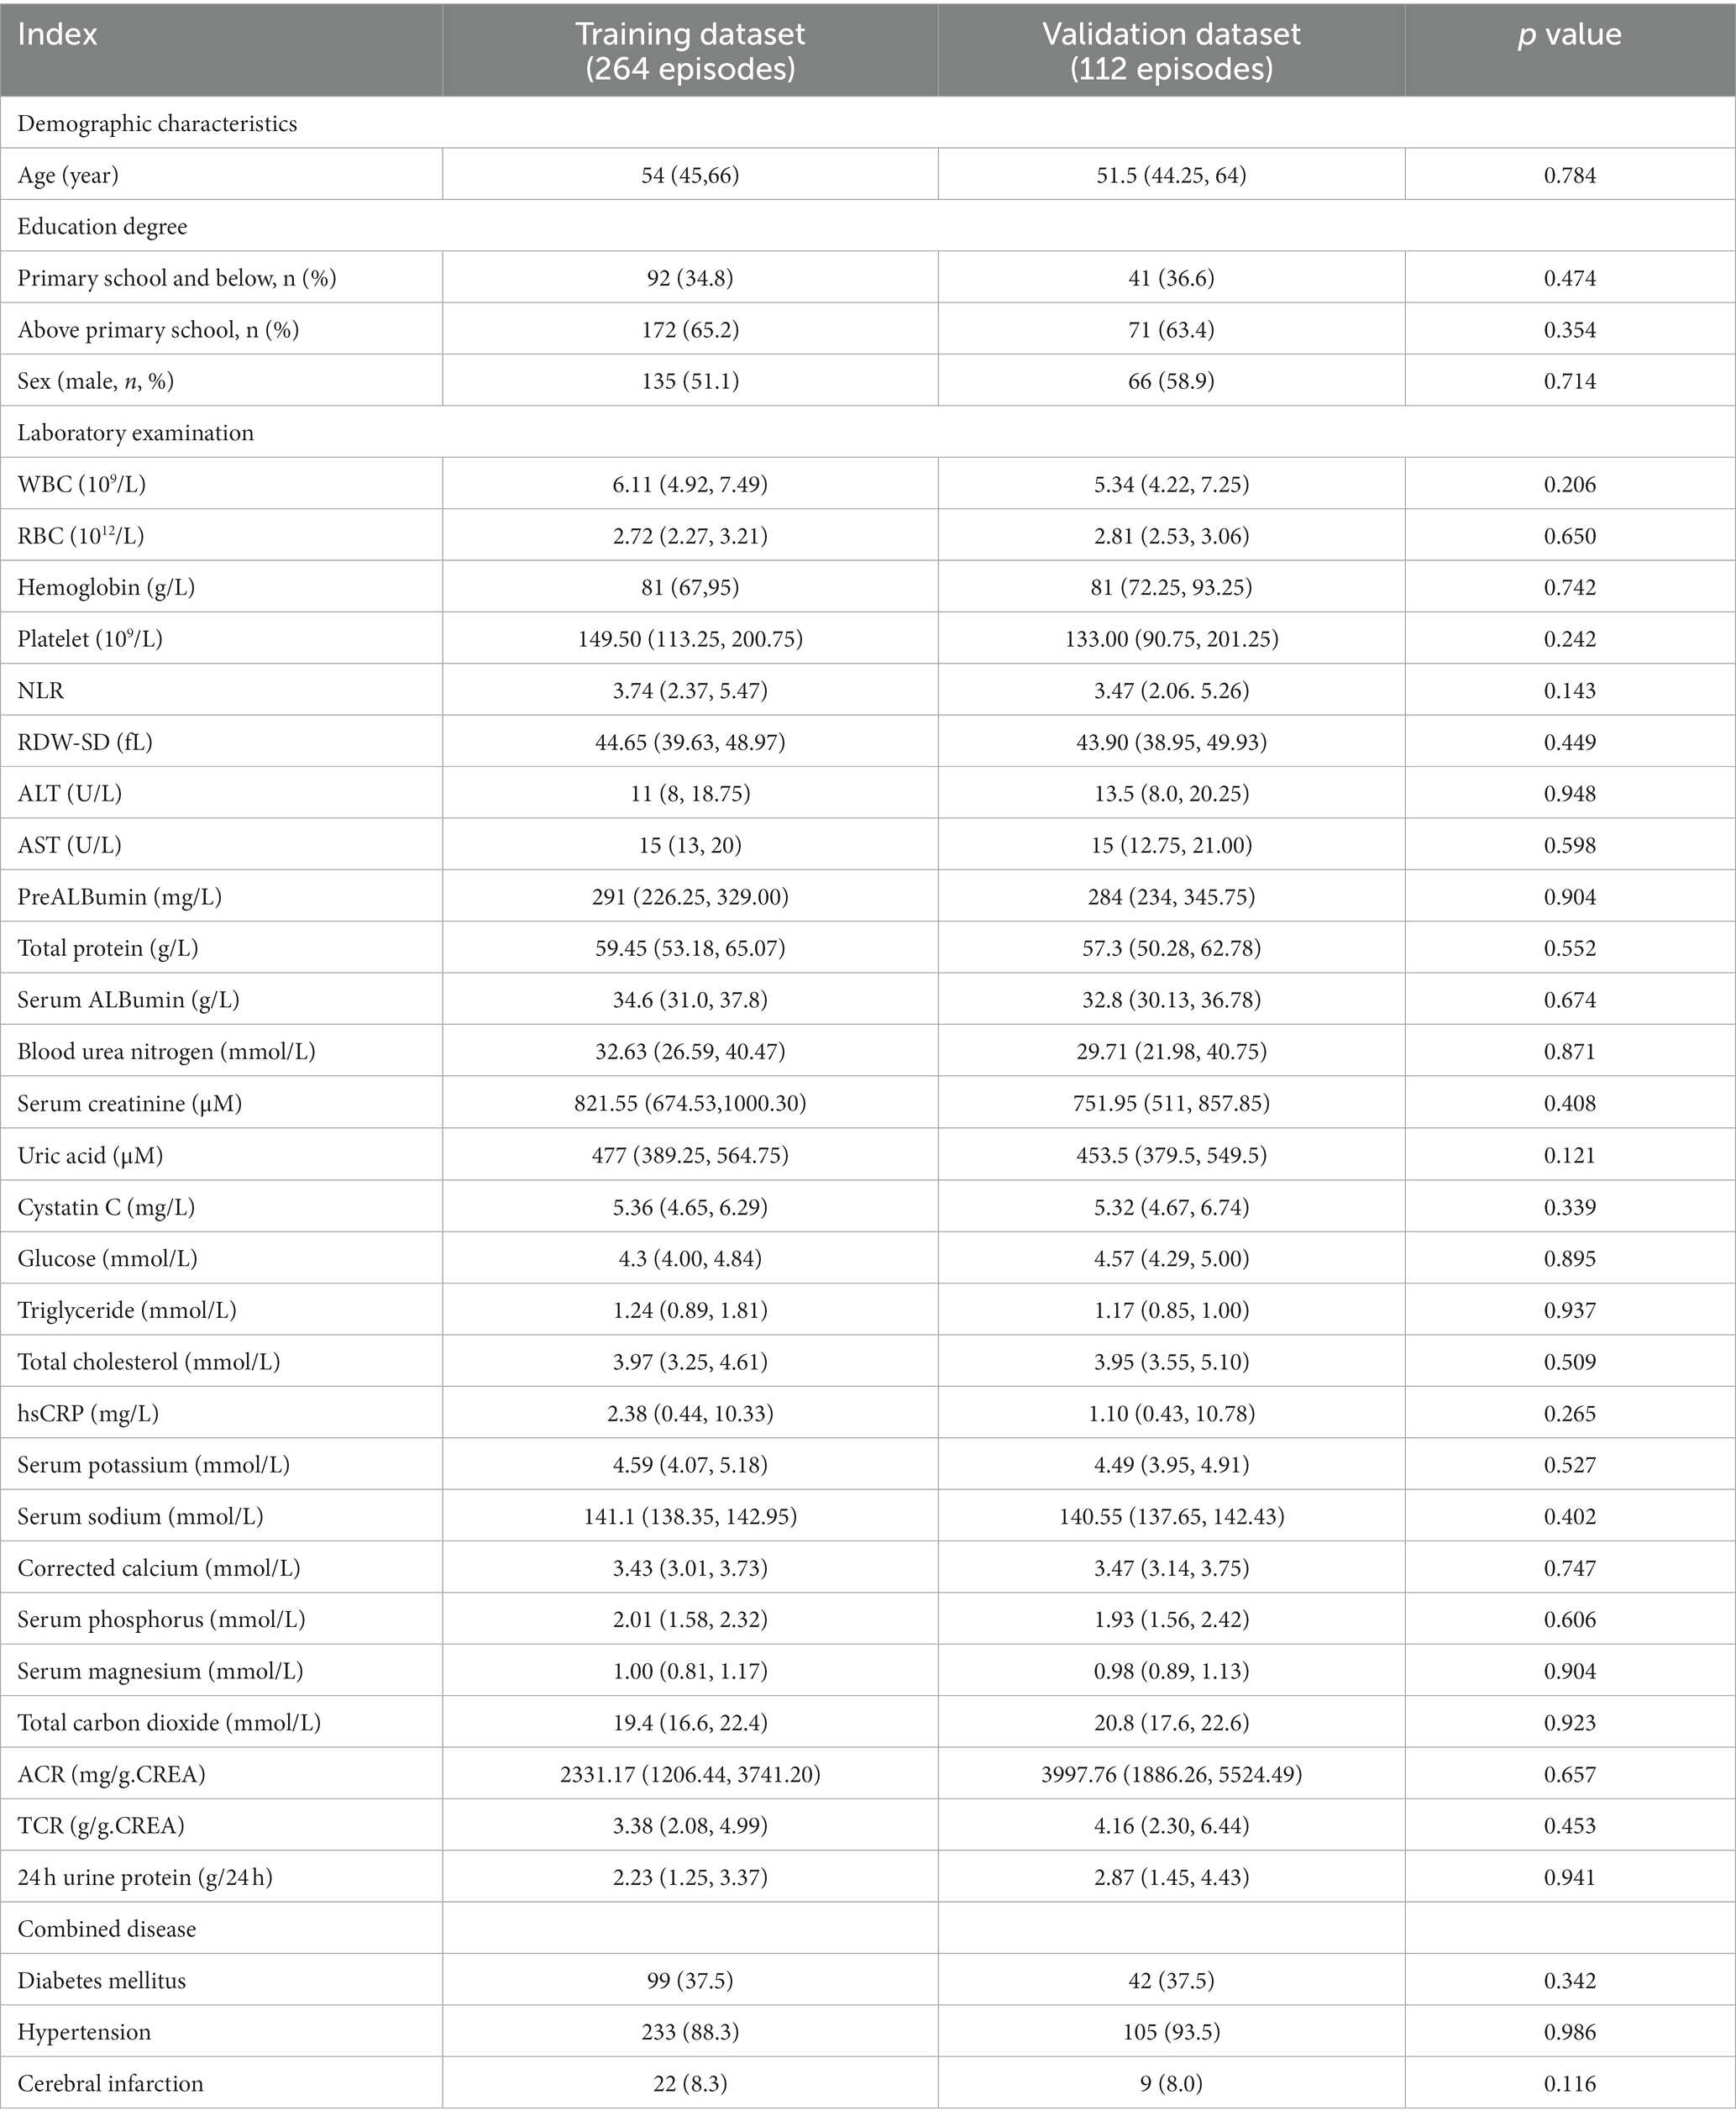
Table 1. Clinical characteristics of the study population.
LASSO regression for screening variables
Based on the clinical information, laboratory parameters, and prognosis of patients in the training cohort, dimensionality reduction was performed for the 34 variables by LASSO regression. Thus, the five most representative predictor variables were identified (Figure 2). The screened predictors included NLR, ALB, UA, hsCRP, and diabetes mellitus (DM).
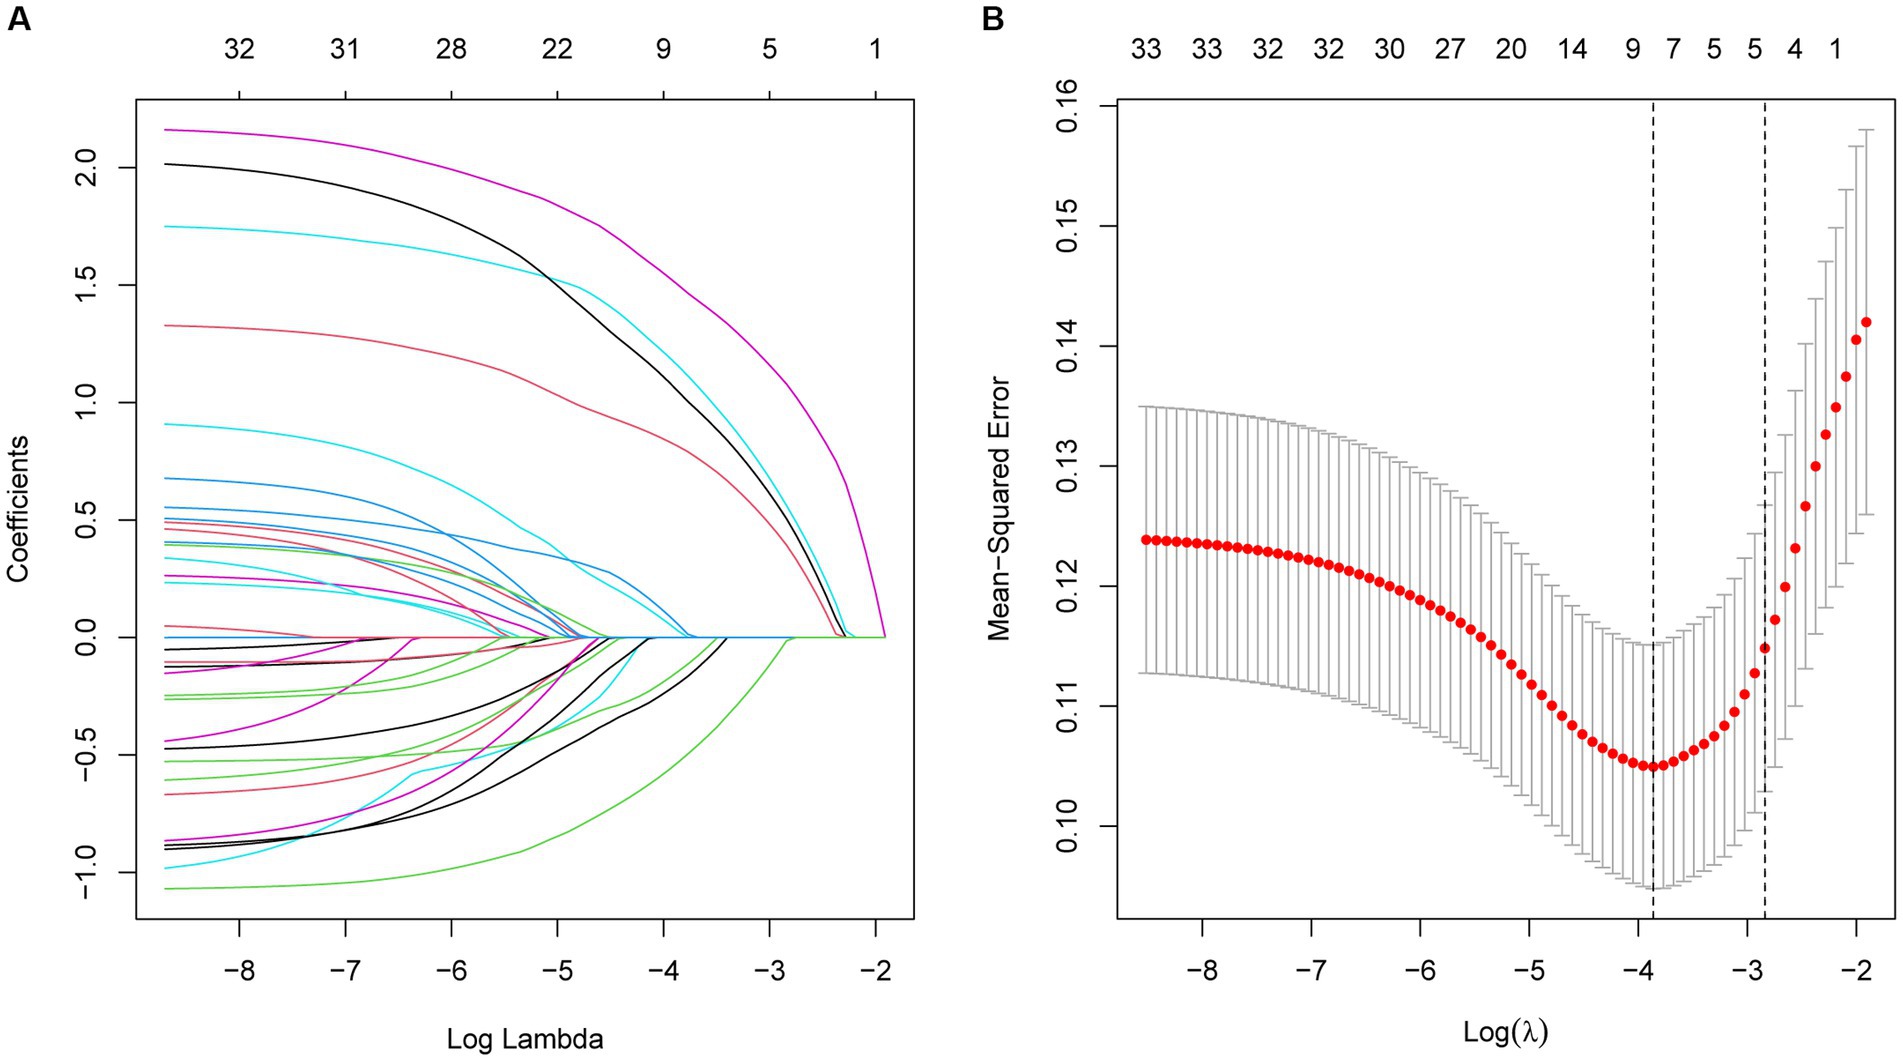
Figure 2. (A) Optimal parameter (λ) selection in the LASSO model, with the optimal tuning parameter logλ in the horizontal coordinate and the regression coefficient in the vertical coordinate. (B) Distribution of LASSO coefficients for the five factors, with the optimal tuning parameter logλ in the horizontal coordinate and the binomial deviance in the vertical coordinate.
Construction of a clinical prediction model and column line plot
A multifactorial logistic regression prediction model was constructed using the development of PDAP in PD patients in the hospital and within 1 year after discharge as the dependent variable (not having PDAP = 0; having PDAP = 1). Five predictor variables were screened using LASSO regression analysis as independent variables (assigned values shown in Figure 2). The results showed that NLR, ALB, UA, hsCRP, and DM were risk factors of PDAP (Table 2). A column line graph, nomogram, was drawn using the predictor variables (Figure 3). The column line plot allows visualization of the corresponding numerical score for each variable. By adding the numerical scores and calculating the total score on all scales, a vertical straight line can be drawn to determine the probability of PDAP in a particular patient. Based on the predicted probabilities, the patient is at low risk of having PDAP. This calculated value can be used for treatment planning and patient counseling.
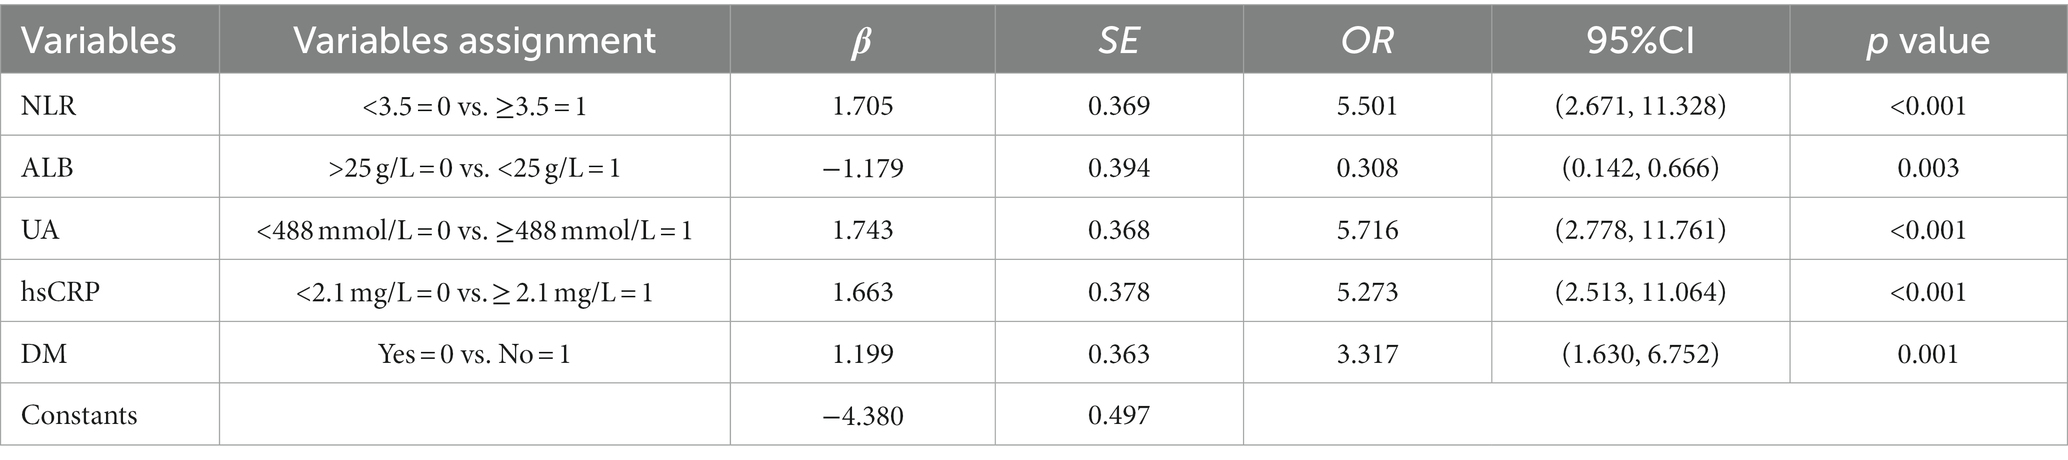
Table 2. Multifactorial logistic regression analysis of factors influencing the occurrence of PDAP after PD catheterization.
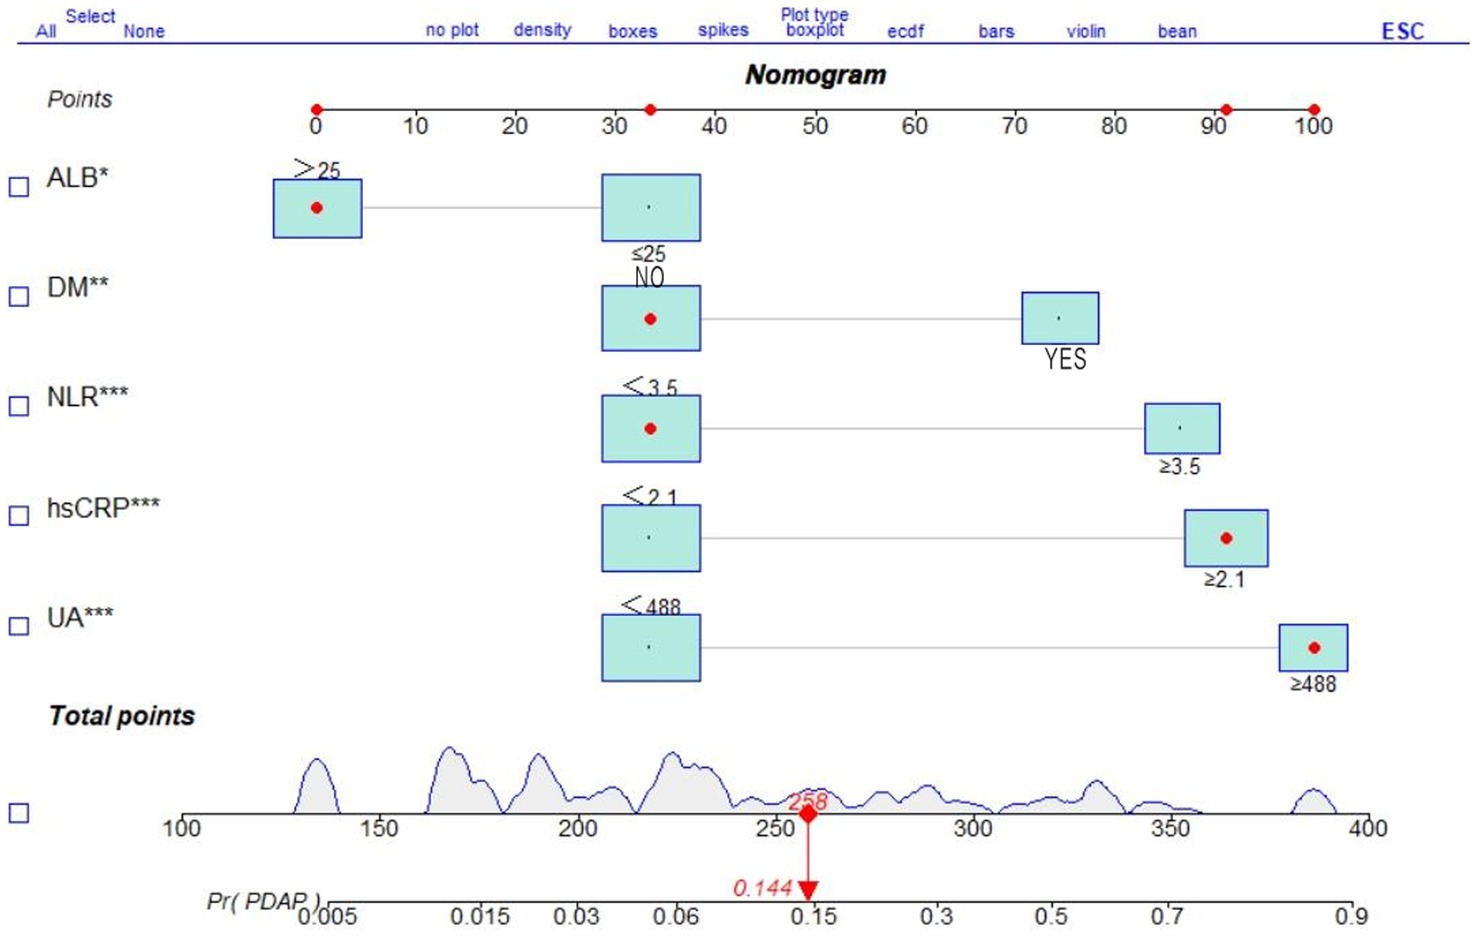
Figure 3. Nomogram of a clinical prediction model for the occurrence of PDAP after PD catheterization.
Internal validation of the nomogram
After 1,000 internal validation calibrations by Bootstrap method, its predicted risk profile of PDAP occurrence and the actual clinical risk profile of PDAP occurrence are still in good agreement (Figure 4).
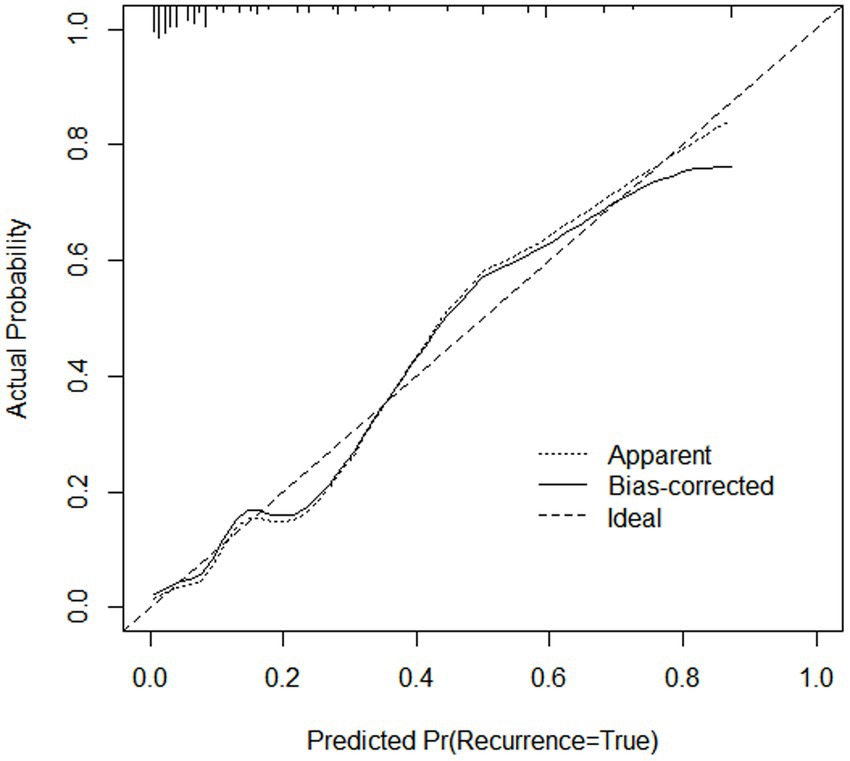
Figure 4. Internal calibration of the nomogram to predict the occurrence of PDAP after PD catheterization.
Validation and clinical utility of predictive models
This study evaluated the prediction model in terms of discrimination, calibration, and net clinical benefit, which showed good accuracy for the prediction of the probability of having PDAP in PD patients with a C-index of 0.891 (95% confidence interval [CI]: 0. 0.829–0.844) for the training cohort and 0.882 (95% CI: 0.722–0.957) for the validation cohort (Figures 5A,B). Meanwhile, the Hosmer-Lemeshow test chi-square statistic showed that the calibration ability of the model was 5.06 (p = 0.829) for the training cohort and 7.34 (p = 0.602) for the validation cohort. The calibration curves showed a good fit for the training and validation cohorts, indicating that the predicted probability of PDAP within 1 year of PD initiation and the actual rate showed a good agreement (Figures 5C,D). The clinical decision curves for the training and validation cohorts showed a good net benefit (Figures 6A,B). The threshold probabilities, plotted on the x-axis, represent the range of appropriate risk probabilities (identified beforehand) at which a model could guide treatment when compared to the default strategies of “treatment for all” and “treatment for no-one.” When the 1-year PDAP risk was predicted using the column line plot, the net benefit of using the column line plot was significantly higher than those for “no intervention” and “full intervention” cohorts when the threshold probabilities for the training and validation cohorts were 4–64% and 3–90%, respectively, suggesting the clinical applicability of the lineage map. For our study, we aimed to determine appropriate thresholds that could be used to determine preventive treatment for PDAP. Treatment can refer to a variety of measures, including further examination or the initiation of targeted therapy. These data suggest that our line graphs are useful for clinical decision making.
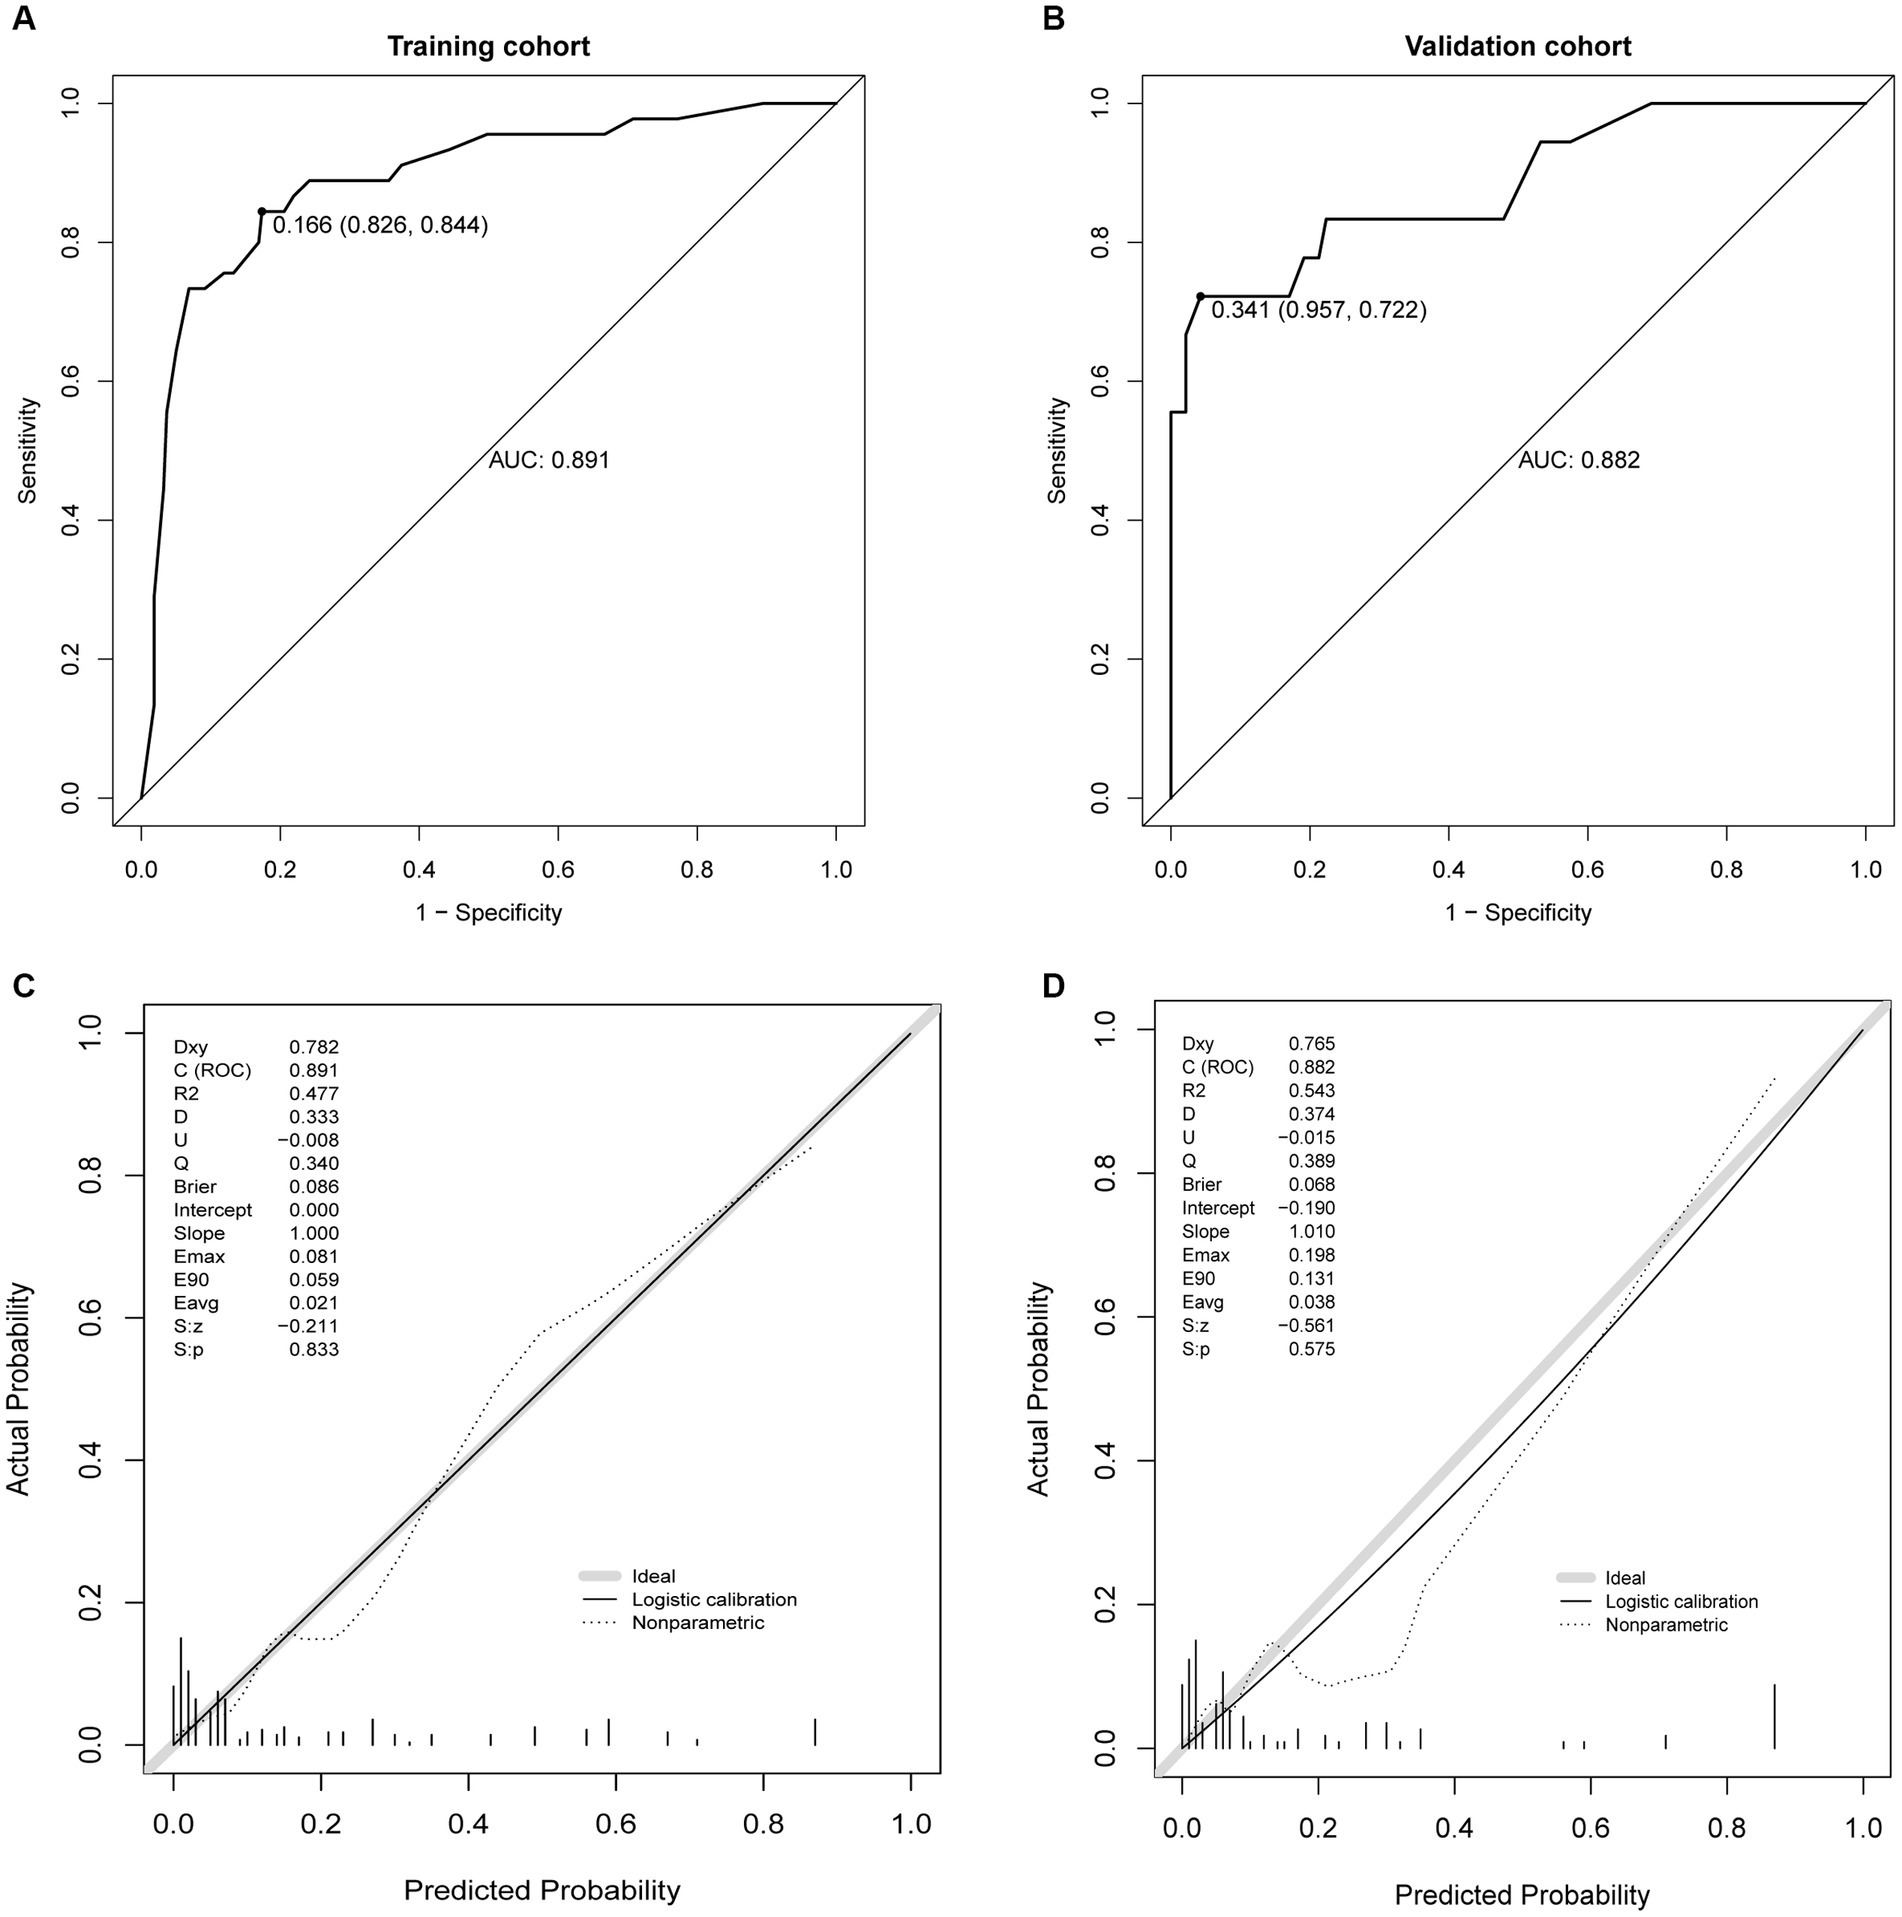
Figure 5. Receiver operating characteristic (ROC) curves. (A) ROC curve in the training cohort, (B) ROC curve in the validation cohort, (C) calibration plots in the training cohort, and (D) calibration plots in the validation.
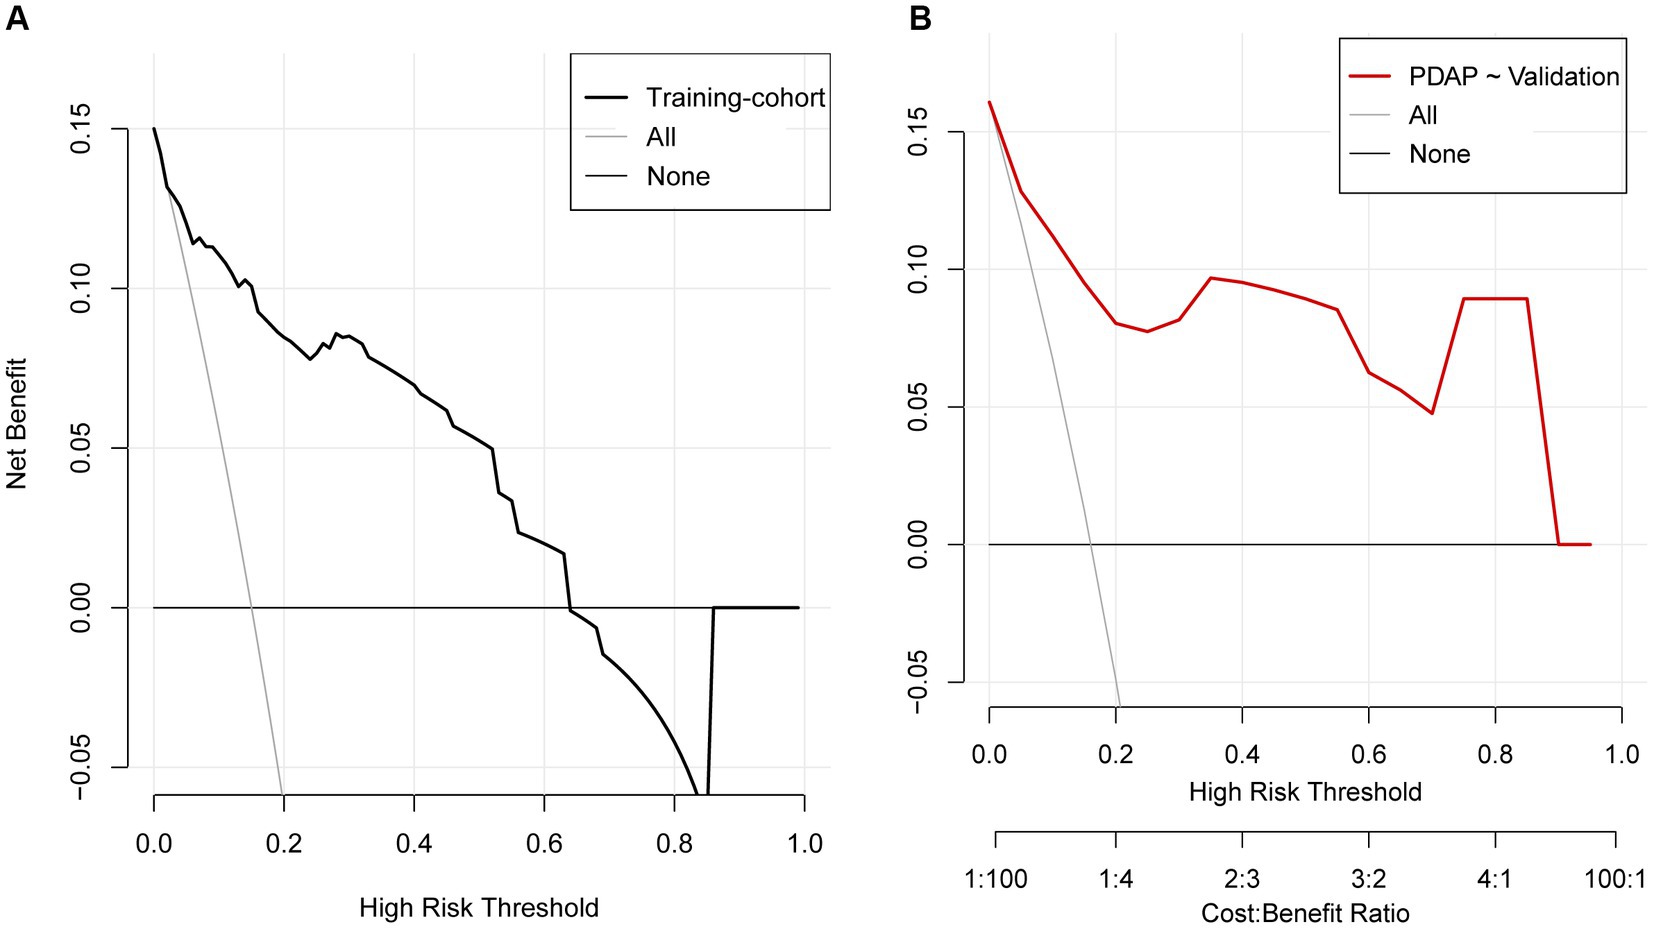
Figure 6. Decision curve analysis for the prediction model. (A) Training cohort, (B) validation cohort.
Discussion
Previous studies have mainly focused on disease etiology and treatment rather than on the development of prognostic methods, such as clinical prediction models. Many studies have explored whether a single variable (such as a biomarker or a new clinical biochemical parameter) can predict or correlate with certain outcomes, whereas building clinical prediction models by incorporating multiple variables is relatively complex. Nevertheless, clinical predictive models have been developed in recent years for various diseases (14, 15) including kidney disease (16). Clinical prediction models can inform patients and their physicians or other healthcare providers about the likelihood of disease development or progression in a patient, which can facilitate treatment decisions. The main risk factors included in previous PDAP clinical prediction models are age, UA, serum C-reactive protein (CRP)-to-Albumin ratio (CAR), NLR, RDW, DM, and cardiovascular disease (6, 17–21). The results of some previous studies are consistent with those of the current paper. However, most previous studies evaluated individual factors or postoperative indicators, whereas we identified preoperative indicators that are useful for clinical decision-making.
PDAP is the most serious complication of PD and leads to an increased risk of mortality and morbidity (22). Despite a significant decrease in the incidence of peritonitis, it still accounts for 41.3% of deaths and 20% of technical failures in PD patients (23, 24). This study retrospectively analyzed the clinical data of patients who developed PDAP over a 6-year period. For the first time, a prediction model based on the combination of NLR, ALB, UA, DM, and hsCRP was established to determine the 1-year PDAP risk of PD patients. The differentiation, accuracy, and clinical utility were validated in the validation set. Using the column line graph model, the individual risk of PDAP can be predicted preoperatively; this information may assist clinicians in making rational treatment decisions for PD patients.
A significant association was found between low serum ALB level at the time of initiation of continuous ambulatory peritoneal dialysis (CAPD) and the development of peritonitis (25). ALB is a major serum protein with important physiological functions, including maintenance of colloid osmotic pressure, binding to multiple compounds, and plasma antioxidant activity (26). Hypoalbuminemia is very common in patients with ESRD (27, 28). Notably, hypoalbuminemia is associated with increased morbidity and mortality in patients with PD (29). PD results in a significant loss of ALBumin, with protein leakage of up to 4.04 g/day during PD (30). In addition, low levels of serum ALB may result due to inflammatory response and malnutrition; it also increases the susceptibility of patients to infection (31). Ma et al. reported that hypoalbuminemia before the start of PD is a predictor of peritonitis (32). Therefore, hypoalbuminemia can be used as a warning sign for the development of peritonitis in patients undergoing CAPD and immediate intervention is needed to prevent peritonitis when serum albumin levels fall.
CRP is a marker of inflammation, and elevated serum levels are associated with an increased risk of cardiovascular events and mortality in the general population as well as in patients with kidney disease. Both CRP and ALB are useful prognostic markers for assessing mortality in patients with PD (33, 34). CRP levels reflect the severity of inflammation and ALB can be used as a nutritional marker in critically ill patients (35). CRP is an acute phase reactant mainly produced by the liver in acute and chronic inflammation. Previous studies have shown that CRP is an important risk factor for increased cardiovascular mortality in patients with PD (36). Chen et al. found that CRP was an independent predictor of increased all-cause mortality and risk of major adverse cardiovascular events in PD patients (37). Serum CAR, a composite indicator of inflammation and nutritional status, has recently been identified as an independent prognostic indicator for patients receiving treatment (35, 38). Some studies have found advantages of using CAR alone instead of CRP or ALB: the levels of inflammatory markers (e.g., CRP and ALB) vary depending on the inflammation severity. In addition, CAR can be used to assess both inflammation and nutrition. The use of this method is expected to improve the accuracy of prognostic prediction compared to CRP or ALB alone (21).
NLR is obtained by dividing the peripheral blood absolute neutrophil count with the peripheral blood absolute lymphocyte count. NLR has recently been reported to be associated with inflammation in ESRD, including HD and PD patients. The survival rate of patients with ESRD has been estimated using NLR (39–41). In PD, inflammation may result from several underlying causes, including uremic microenvironment, infection, reduced clearance of pro-inflammatory cytokines, volume overload, oxidative stress, and other dialysis-related factors (42, 43). NLR is a readily available parameter obtained from complete blood counts that is closely associated with inflammation and was originally considered as a prognostic indicator for tumors (44). Several recent studies of PD patients have shown that NLR is moderately associated with inflammatory marker levels (e.g., CRP, IL6, and TNF-α); higher NLR is associated with a higher mortality rate (40, 45, 46). In PDAP, increased NLR is independently associated with increased risks of treatment failure and catheter removal. NLR is a convenient and inexpensive parameter that may be indicate a poor outcome in patients with peritonitis (6).
UA is the end product of purine metabolism in humans and has antioxidant and pro-inflammatory properties. It is associated with the development of oxidative stress-related diseases, such as CKD and cardiovascular risk (47). Hyperuricemia is a risk factor for kidney disease, DM, and hypertension. High levels of UA are associated with a pro-oxidant and pro-inflammatory state. In patients receiving PD, a positive relationship was shown between UA levels and mortality (48, 49). High UA levels were associated with an increased risk of all-cause mortality in patients with PD compared to moderate UA levels (50). UA may induce oxidative stress by activating NADPH oxidase, stimulating the renin-angiotensin system, and interfering with mitochondrial function (51). Second, UA may regulate the inflammatory response through a variety of cytokines (52). Finally, high UA levels may reduce residual renal function in PD patients, leading to increased all-cause mortality (53, 54). Higher UA levels are associated with an increased risk of clinical manifestations of diabetic nephropathy in patients with DM. In addition, UA is a strong predictor of diabetic nephropathy progression (55).
The prevalence of DM is increasing in the general population and diabetic nephropathy is now the leading cause of ESRD worldwide (56, 57). Challenges to the overall health of ESRD patients with DM who are receiving renal replacement therapy (e.g., dialysis) (58). In ESRD patients with DM, adequate vascular access for hemodialysis is often problematic. As a result, many patients may select PD for renal replacement therapy. There are concerns that diabetic patients may develop PDAP because of their immunocompromised status (59). Inflammation plays a critical role in the development of diabetes, and higher CRP level is a risk factor for developing DM (60, 61). Although several studies have evaluated the risk factors of peritonitis in diabetic non-PD patients (62), they have also reported that DM is a risk factor for PDAP, and poor glycemic control is a risk factor for catheter tunnel and exit site infection in diabetic patients at the time of initiation of PD therapy (63–65). DM is associated with higher all-cause mortality in PDAP patients (66).
To the best of our knowledge, this is the first line graph model that allows risk assessment for the development of PDAP in PD patients. Our study has several advantages: first, our findings provide a valuable reference for physicians who manage patients with PD. Second, the column line graph prediction model is intuitive and practical because all included variables are obtained routinely.
Our study also has some limitations: first, the study had a retrospective design, which may have introduced selection bias. Non-random selection of participants and incomplete data may impact the representativeness of the study population, thus limiting the generalizability of findings to broader populations. Additionally, the lack of consideration for potential changes in predictor variables during treatment is noteworthy. Treatment interventions could influence variables, potentially introducing bias into our results. Second, we did not consider the effects of changes in variables during treatment on outcomes. Finally, we included 264 cases in the training cohort and 112 cases in the validation cohort; however, prospective studies with larger sample sizes are required.
In conclusion, we constructed an intuitive and practical column line diagram, which can predict the risk of PDAP in PD patients and provide a reference for the individualized treatment of PDAP patients.
Data availability statement
The original contributions presented in the study are included in the article/supplementary materials, further inquiries can be directed to the corresponding authors.
Ethics statement
The studies involving humans were approved by the ethics committee of the First Affiliated Hospital of Anhui University of Traditional Chinese Medicine (approval no.: 2021AH-73). The studies were conducted in accordance with the local legislation and institutional requirements. The participants provided their written informed consent to participate in this study.
Author contributions
RD and LZ: research idea, study design, manuscript writing, and visualization. CP and TS: data collection. RD and CP: data analysis. RD and MC: statistical analysis. YW and LZ: supervision or mentorship. All authors have read and agreed to the published version of the manuscript.
Funding
This study was funded by grants of the National Natural Science Foundation of China (82004165, 81673931, and 82274307), Natural Science Research Project of Anhui Higher Education Institution (KJ2021A0546), and Collaborative public relations project plan of Chinese and Western medicine for major and difficult diseases in Anhui Province (Approval number: 2021–70).
Acknowledgments
We appreciate the efforts of all patients enrolled in this study. We thank LetPub (www.letpub.com) for linguistic assistance and pre-submission expert review.
Conflict of interest
The authors declare that the research was conducted in the absence of any commercial or financial relationships that could be construed as a potential conflict of interest.
Publisher’s note
All claims expressed in this article are solely those of the authors and do not necessarily represent those of their affiliated organizations, or those of the publisher, the editors and the reviewers. Any product that may be evaluated in this article, or claim that may be made by its manufacturer, is not guaranteed or endorsed by the publisher.
References
1. See, EJ, Johnson, DW, Hawley, CM, Pascoe, EM, Badve, SV, Boudville, N, et al. Risk predictors and causes of technique failure within the first year of peritoneal dialysis: an Australia and New Zealand dialysis and transplant registry (ANZDATA) study. Am J Kidney Dis. (2018) 72:188–97. doi: 10.1053/j.ajkd.2017.10.019
2. Sachdeva, B, Zulfiqar, H, and Aeddula, NR. Peritoneal Dialysis. Treasure Island, FL: Stat Pearls Publishing (2022).
3. Perl, J, Fuller, DS, Bieber, BA, Boudville, N, Kanjanabuch, T, Ito, Y, et al. Peritoneal dialysis-related infection rates and outcomes: results from the peritoneal dialysis outcomes and practice patterns study (PDOPPS). Am J Kidney Dis. (2020) 76:42–53. doi: 10.1053/j.ajkd.2019.09.016
4. Aroeira, LS, Aguilera, A, Sánchez-Tomero, JA, Bajo, MA, del Peso, G, Jiménez-Heffernan, JA, et al. Epithelial to mesenchymal transition and peritoneal membrane failure in peritoneal Dialysis patients: pathologic significance and potential therapeutic interventions. J Am Soc Nephrol. (2007) 18:2004–13. doi: 10.1681/asn.2006111292
5. Li, PK, Chow, KM, van de Luijtgaarden, MWM, Johnson, DW, Jager, KJ, Mehrotra, R, et al. Changes in the worldwide epidemiology of peritoneal dialysis. Nat Rev Nephrol. (2017) 13:90–103. doi: 10.1038/nrneph.2016.181
6. He, P, He, LJ, Huang, C, Hu, JP, and Sun, SR. Neutrophil-to-lymphocyte ratio and treatment failure in peritoneal dialysis-associated peritonitis. Front Med. (2021) 8:699502. doi: 10.3389/fmed.2021.699502
7. Meng, L, Yang, L, Zhu, X, Zhang, X, Li, X, Cheng, S, et al. Development and validation of a prediction model for the cure of peritoneal dialysis-associated peritonitis: a multicenter observational study. Front Med. (2022) 9:875154. doi: 10.3389/fmed.2022.875154
8. Kofteridis, DP, Valachis, A, Perakis, K, Maraki, S, Daphnis, E, and Samonis, G. Peritoneal dialysis-associated peritonitis: clinical features and predictors of outcome. Int J Infect Dis. (2010) 14:e489–93. doi: 10.1016/j.ijid.2009.07.016
9. Li, PK, Szeto, CC, Piraino, B, de Arteaga, J, Fan, S, Figueiredo, AE, et al. ISPD peritonitis recommendations: 2016 update on prevention and treatment. Perit Dial Int. (2016) 36:481–508. doi: 10.3747/pdi.2016.00078
10. Riley, RD, Ensor, J, Snell, KIE, Harrell, FE Jr, Martin, GP, Reitsma, JB, et al. Calculating the sample size required for developing a clinical prediction model. BMJ. (2020) 368:m441. doi: 10.1136/bmj.m441
11. Martin, S, Fuentes, S, Sanchez, C, Jimenez, M, Navarro, C, Perez, H, et al. Development and validation of a laboratory-based risk score to predict the occurrence of critical illness in hospitalized patients with COVID-19. Scand J Clin Lab Investig. (2021) 81:282–9. doi: 10.1080/00365513.2020.1847313
12. van Buuren, S, and Groothuis-Oudshoorn, K. Mice: multivariate imputation by chained equations in R. J Stat Softw. (2011) 45:1–67. doi: 10.18637/jss.v045.i03
13. Huang, S, and Cai, L. Improving standard error estimates in multistage estimation: a multiple imputation (Mi) based approach. Multivar Behav Res. (2019) 54:154. doi: 10.1080/00273171.2018.1557034
14. Balachandran, VP, Gonen, M, Smith, JJ, and DeMatteo, RP. Nomograms in oncology: more than meets the eye. Lancet Oncol. (2015) 16:e173–80. doi: 10.1016/s1470-2045(14)71116-7
15. Ceci, F, Bianchi, L, Borghesi, M, Polverari, G, Farolfi, A, Briganti, A, et al. Prediction nomogram for (68) Ga-Psma-11 PET/CT in different clinical settings of PSA failure after radical treatment for prostate cancer. Eur J Nucl Med Mol Imaging. (2020) 47:136–46. doi: 10.1007/s00259-019-04505-2
16. Sun, F, Wang, H, Zhang, D, Han, F, and Ye, S. One-year renal outcome in lupus nephritis patients with acute kidney injury: a nomogram model. Rheumatology (Oxford). (2022) 61:2886–93. doi: 10.1093/rheumatology/keab818
17. Wang, CC, Tsai, CC, Hsu, CC, and Chen, KT. Effects of age on the outcome of peritoneal dialysis-associated peritonitis. Am J Emerg Med. (2017) 35:176–7. doi: 10.1016/j.ajem.2016.10.013
18. He, P, Hu, JP, Li, H, Tian, XJ, He, LJ, Sun, SR, et al. Red blood cell distribution width and peritoneal dialysis-associated peritonitis prognosis. Ren Fail. (2020) 42:613–21. doi: 10.1080/0886022x.2020.1786401
19. Liu, X, Qin, A, Zhou, H, He, X, Cader, S, Wang, S, et al. Novel predictors and risk score of treatment failure in peritoneal dialysis-related peritonitis. Front Med. (2021) 8:639744. doi: 10.3389/fmed.2021.639744
20. Ueda, R, Nakao, M, Maruyama, Y, Nakashima, A, Yamamoto, I, Matsuo, N, et al. Effect of diabetes on incidence of peritoneal dialysis-associated peritonitis. PLoS One. (2019) 14:e0225316. doi: 10.1371/journal.pone.0225316
21. Liu, S, Qiu, P, Luo, L, Jiang, L, Chen, Y, Yan, C, et al. Serum C-reactive protein to albumin ratio and mortality associated with peritoneal dialysis. Ren Fail. (2020) 42:600–6. doi: 10.1080/0886022x.2020.1783680
22. Afolalu, B, Troidle, L, Osayimwen, O, Bhargava, J, Kitsen, J, and Finkelstein, FO. Technique failure and center size in a large cohort of peritoneal dialysis patients in a defined geographic area. Perit Dial Int. (2009) 29:292–6. doi: 10.1177/089686080902900313
23. Ye, H, Zhou, Q, Fan, L, Guo, Q, Mao, H, Huang, F, et al. The impact of peritoneal dialysis-related peritonitis on mortality in peritoneal dialysis patients. BMC Nephrol. (2017) 18:186. doi: 10.1186/s12882-017-0588-4
24. Cho, Y, and Johnson, DW. Peritoneal Dialysis-related peritonitis: towards improving evidence, practices, and outcomes. Am J Kidney Dis. (2014) 64:278–89. doi: 10.1053/j.ajkd.2014.02.025
25. Alharbi, MA. Low serum albumin a predictor sign of the incidence of peritoneal Dialysis-associated peritonitis? A quasi-systematic review. Saudi J Kidney Dis Transpl. (2020) 31:320–34. doi: 10.4103/1319-2442.284006
26. Levitt, DG, and Levitt, MD. Human serum albumin homeostasis: a new look at the roles of synthesis, catabolism, renal and gastrointestinal excretion, and the clinical value of serum albumin measurements. Int J Gen Med. (2016) 9:229–55. doi: 10.2147/ijgm.S102819
27. Alves, FC, Sun, J, Qureshi, AR, Dai, L, Snaedal, S, Bárány, P, et al. The higher mortality associated with low serum albumin is dependent on systemic inflammation in end-stage kidney disease. PLoS One. (2018) 13:e0190410. doi: 10.1371/journal.pone.0190410
28. Amdur, RL, Feldman, HI, Gupta, J, Yang, W, Kanetsky, P, Shlipak, M, et al. Inflammation and progression of CKD: the CRIC study. Clin J Am Soc Nephrol. (2016) 11:1546–56. doi: 10.2215/cjn.13121215
30. Yu, GQ, Chen, J, and Li, JX. The association between peritoneal charge barrier dysfunction and protein lost during continuous ambulatory peritoneal Dialysis. Kidney Blood Press Res. (2013) 37:252–8. doi: 10.1159/000350150
31. Wang, Q, Bernardini, J, Piraino, B, and Fried, L. Albumin at the start of peritoneal dialysis predicts the development of peritonitis. Am J Kidney Dis. (2003) 41:664–9. doi: 10.1053/ajkd.2003.50128
32. Ma, TK, Chow, KM, Kwan, BC, Pang, WF, Leung, CB, Li, PK, et al. Peritonitis before peritoneal dialysis training: analysis of causative organisms, clinical outcomes, risk factors, and long-term consequences. Clin J Am Soc Nephrol. (2016) 11:1219–26. doi: 10.2215/cjn.00830116
33. Zhang, W, He, J, Zhang, F, Huang, C, Wu, Y, Han, Y, et al. Prognostic role of C-reactive protein and interleukin-6 in dialysis patients: a systematic review and meta-analysis. J Nephrol. (2013) 26:243–53. doi: 10.5301/jn.5000169
34. Lee, KH, Cho, JH, Kwon, O, Kim, SU, Kim, RH, Cho, YW, et al. Low prealbumin levels are independently associated with higher mortality in patients on peritoneal dialysis. Kidney Res Clin Pract. (2016) 35:169–75. doi: 10.1016/j.krcp.2016.06.002
35. Oh, TK, Song, IA, and Lee, JH. Clinical usefulness of C-reactive protein to albumin ratio in predicting 30-day mortality in critically ill patients: a retrospective analysis. Sci Rep. (2018) 8:14977. doi: 10.1038/s41598-018-33361-7
36. Cafka, M, Rroji, M, Seferi, S, Barbullushi, M, Burazeri, G, Spahia, N, et al. Inflammation, left ventricular hypertrophy, and mortality in end-stage renal disease. Iran J Kidney Dis. (2016) 10:217–23.
37. Chen, T, Hassan, HC, Qian, P, Vu, M, and Makris, A. High-sensitivity troponin T and C-reactive protein have different prognostic values in hemo- and peritoneal dialysis populations: a cohort study. J Am Heart Assoc. (2018) 7:e007876. doi: 10.1161/jaha.117.007876
38. Llop-Talaveron, J, Badia-Tahull, MB, and Leiva-Badosa, E. An inflammation-based prognostic score, the C-reactive protein/albumin ratio predicts the morbidity and mortality of patients on parenteral nutrition. Clin Nutr. (2018) 37:1575–83. doi: 10.1016/j.clnu.2017.08.013
39. Li, P, Xia, C, Liu, P, Peng, Z, Huang, H, Wu, J, et al. Neutrophil-to-lymphocyte ratio and platelet-to-lymphocyte ratio in evaluation of inflammation in non-dialysis patients with end-stage renal disease (ESRD). BMC Nephrol. (2020) 21:511. doi: 10.1186/s12882-020-02174-0
40. Yuan, Q, Wang, J, Peng, Z, Zhou, Q, Xiao, X, Xie, Y, et al. Neutrophil-to-lymphocyte ratio and incident end-stage renal disease in Chinese patients with chronic kidney disease: results from the Chinese cohort study of chronic kidney disease (C-Stride). J Transl Med. (2019) 17:86. doi: 10.1186/s12967-019-1808-4
41. Catabay, C, Obi, Y, Streja, E, Soohoo, M, Park, C, Rhee, CM, et al. Lymphocyte cell ratios and mortality among incident hemodialysis patients. Am J Nephrol. (2017) 46:408–16. doi: 10.1159/000484177
42. Hung, SC, Lai, YS, Kuo, KL, and Tarng, DC. Volume overload and adverse outcomes in chronic kidney disease: clinical observational and animal studies. J Am Heart Assoc. (2015) 4:e001918. doi: 10.1161/jaha.115.001918
43. Kalantar-Zadeh, K, Ikizler, TA, Block, G, Avram, MM, and Kopple, JD. Malnutrition-inflammation complex syndrome in Dialysis patients: causes and consequences. Am J Kidney Dis. (2003) 42:864–81. doi: 10.1016/j.ajkd.2003.07.016
44. Zhao, N, Xu, H, Zhou, D, Xu, X, Ge, W, and Cao, D. The prognostic role of neutrophil-to-lymphocyte ratio and C-reactive protein in metastatic colorectal cancer using regorafenib: a systematic review and meta-analysis. J Gastrointest Oncol. (2022) 13:1772–81. doi: 10.21037/jgo-22-683
45. Okyay, GU, İnal, S, Öneç, K, Er, RE, Paşaoğlu, O, Paşaoğlu, H, et al. Neutrophil to lymphocyte ratio in evaluation of inflammation in patients with chronic kidney disease. Ren Fail. (2013) 35:29–36. doi: 10.3109/0886022x.2012.734429
46. Lu, X, Wang, S, Zhang, G, Xiong, R, and Li, H. High neutrophil-to-lymphocyte ratio is a significant predictor of cardiovascular and all-cause mortality in patients undergoing peritoneal dialysis. Kidney Blood Press Res. (2018) 43:490–9. doi: 10.1159/000488696
47. Gaubert, M, Bardin, T, Cohen-Solal, A, Diévart, F, Fauvel, JP, Guieu, R, et al. Hyperuricemia and hypertension, coronary artery disease, kidney disease: from concept to practice. Int J Mol Sci. (2020) 21:4066. doi: 10.3390/ijms21114066
48. Gherghina, ME, Peride, I, Tiglis, M, Neagu, TP, Niculae, A, and Checherita, IA. Uric acid and oxidative stress-relationship with cardiovascular, metabolic, and renal impairment. Int J Mol Sci. (2022) 23:3188. doi: 10.3390/ijms23063188
49. Xiao, X, Ye, H, Yi, C, Lin, J, Peng, Y, Huang, X, et al. Roles of peritoneal clearance and residual kidney removal in control of uric acid in patients on peritoneal Dialysis. BMC Nephrol. (2020) 21:148. doi: 10.1186/s12882-020-01800-1
50. Liu, ZQ, Huang, ZW, Kang, SL, Hu, CC, Chen, F, He, F, et al. Serum uric acid and cardiovascular or all-cause mortality in peritoneal dialysis patients: a systematic review and meta-analysis. Front Cardiovasc Med. (2021) 8:751182. doi: 10.3389/fcvm.2021.751182
51. Kim, SM, Lee, SH, Kim, YG, Kim, SY, Seo, JW, Choi, YW, et al. Hyperuricemia-induced Nlrp3 activation of macrophages contributes to the progression of diabetic nephropathy. Am J Physiol Renal Physiol. (2015) 308:F993–f1003. doi: 10.1152/ajprenal.00637.2014
52. XIAO, J, ZHANG, XL, FU, C, HAN, R, CHEN, W, LU, Y, et al. Soluble uric acid increases NALP3 inflammasome and interleukin-1β expression in human primary renal proximal tubule epithelial cells through the Toll-like receptor 4-mediated pathway. Int J Mol Med. (2015) 35:1347–54. doi: 10.3892/ijmm.2015.2148
53. Hsieh, YP, Yang, Y, Chang, CC, Kor, CT, Wen, YK, Chiu, PF, et al. U-shaped relationship between uric acid and residual renal function decline in continuous ambulatory peritoneal Dialysis patients. Nephrology (Carlton). (2017) 22:427–35. doi: 10.1111/nep.12613
54. Yang, C, Ma, X, Zhao, W, Chen, Y, Lin, H, Luo, D, et al. A longitudinal analysis of the relationship between serum uric acid and residual renal function loss in peritoneal Dialysis patients. Ren Fail. (2020) 42:447–54. doi: 10.1080/0886022x.2020.1761387
55. Mauer, M, and Doria, A. Uric acid and diabetic nephropathy risk. Contrib Nephrol. (2018) 192:103–9. doi: 10.1159/000484284
56. Alicic, RZ, Rooney, MT, and Tuttle, KR. Diabetic kidney disease: challenges, progress, and possibilities. Clin J Am Soc Nephrol. (2017) 12:2032–45. doi: 10.2215/cjn.11491116
57. Tang, SCW, Yu, X, Chen, HC, Kashihara, N, Park, HC, Liew, A, et al. Dialysis care and dialysis funding in Asia. Am J Kidney Dis. (2020) 75:772–81. doi: 10.1053/j.ajkd.2019.08.005
58. Coimbra, S, Reis, F, Nunes, S, Viana, S, Valente, MJ, Rocha, S, et al. The protective role of adiponectin for lipoproteins in end-stage renal disease patients: relationship with diabetes and body mass index. Oxidative Med Cell Longev. (2019) 2019:3021785–11. doi: 10.1155/2019/3021785
59. Shah, BR, and Hux, JE. Quantifying the risk of infectious diseases for people with diabetes. Diabetes Care. (2003) 26:510–3. doi: 10.2337/diacare.26.2.510
60. Yang, X, Tao, S, Peng, J, Zhao, J, Li, S, Wu, N, et al. High-sensitivity C-reactive protein and risk of type 2 diabetes: a nationwide cohort study and updated meta-analysis. Diabetes Metab Res Rev. (2021) 37:e3446. doi: 10.1002/dmrr.3446
61. Peper, KM, Guo, B, Leann Long, D, Howard, G, Carson, AP, Howard, VJ, et al. C-reactive protein and racial differences in type 2 diabetes incidence: the regards study. J Clin Endocrinol Metab. (2022) 107:e2523–31. doi: 10.1210/clinem/dgac074
62. Martin, LC, Caramori, JC, Fernandes, N, Divino-Filho, JC, Pecoits-Filho, R, and Barretti, P. Geographic and educational factors and risk of the first peritonitis episode in Brazilian peritoneal dialysis study (BRAZPD) patients. Clin J Am Soc Nephrol. (2011) 6:1944–51. doi: 10.2215/cjn.11431210
63. Nessim, SJ, Bargman, JM, Austin, PC, Nisenbaum, R, and Jassal, SV. Predictors of peritonitis in patients on peritoneal dialysis: results of a large, prospective Canadian database. Clin J Am Soc Nephrol. (2009) 4:1195–200. doi: 10.2215/cjn.00910209
64. Tsai, CC, Lee, JJ, Liu, TP, Ko, WC, Wu, CJ, Pan, CF, et al. Effects of age and diabetes mellitus on clinical outcomes in patients with peritoneal dialysis-related peritonitis. Surg Infect. (2013) 14:540–6. doi: 10.1089/sur.2012.195
65. Nishina, M, Yanagi, H, Kakuta, T, Endoh, M, Fukagawa, M, and Takagi, A. A 10-year retrospective cohort study on the risk factors for peritoneal dialysis-related peritonitis: a single-center study at Tokai University Hospital. Clin Exp Nephrol. (2014) 18:649–54. doi: 10.1007/s10157-013-0872-y
66. Meng, LF, Yang, LM, Zhu, XY, Zhang, XX, Li, XY, Zhao, J, et al. Comparison of clinical features and outcomes in peritoneal dialysis-associated peritonitis patients with and without diabetes: a multicenter retrospective cohort study. World J Diabetes. (2020) 11:435–46. doi: 10.4239/wjd.v11.i10.435
Keywords: peritoneal dialysis, peritoneal dialysis-associated peritonitis, peritoneal dialysis catheterization, nomogram, predictive model
Citation: Dai R, Peng C, Sang T, Cheng M, Wang Y and Zhang L (2023) Construction and validation of a predictive model for the risk of peritoneal dialysis-associated peritonitis after peritoneal dialysis catheterization. Front. Med. 10:1193754. doi: 10.3389/fmed.2023.1193754
Edited by:
Hitoshi Suzuki, Juntendo University Urayasu Hospital, JapanReviewed by:
Jinwei Wang, Peking University, ChinaPankaj N. Maheshwari, Fortis Hospital, India
Tapas Ranjan Behera, Cleveland Clinic, United States
Copyright © 2023 Dai, Peng, Sang, Cheng, Wang and Zhang. This is an open-access article distributed under the terms of the Creative Commons Attribution License (CC BY). The use, distribution or reproduction in other forums is permitted, provided the original author(s) and the copyright owner(s) are credited and that the original publication in this journal is cited, in accordance with accepted academic practice. No use, distribution or reproduction is permitted which does not comply with these terms.
*Correspondence: Yiping Wang, d3lwd3lwNTRAYWxpeXVuLmNvbQ==; Lei Zhang, emhhbmcwNTUxbGVpQDE2My5jb20=