 Fernanda Stábile da Silva1Lívia Pimenta Bonifácio2
 Fernando Bellissimo-Rodrigues2Luis Fernando Joaquim3
 Daniel Penteado Martins Dias3Minna Moreira Dias Romano4
 André Schmidt4
 Júlio César Crescêncio4Tereza C. Buzinari1
 Rubens Fazan Jr.1
 Helio Cesar Salgado1*
- 1Department of Physiology, Ribeirão Preto Medical School, University of São Paulo, Ribeirão Preto, Brazil
- 2Department of Social Medicine, Ribeirão Preto Medical School, University of São Paulo, Ribeirão Preto, Brazil
- 3Centro Universitário Barão de Mauá, Ribeirão Preto, Brazil
- 4Department of Internal Medicine, Ribeirão Preto Medical School, University of São Paulo, Ribeirão Preto, Brazil
Heart Rate Variability (HRV) and arterial pressure (AP) variability and their responses to head-up tilt test (HUTT) were investigated in Post-COVID-19 syndrome (PCS) patients reporting tachycardia and/or postural hypotension. Besides tachycardia, PCS patients also showed attenuation of the following HRV parameters: RMSSD [square root of the mean of the sum of the squares of differences between adjacent normal-to-normal (NN) intervals] from statistical measures; the power of RR (beat-to-beat interval) spectra at HF (high frequency) from the linear method spectral analysis; occurrence of 2UV (two unlike variation) pattern of RR from the nonlinear method symbolic analysis; and the new family of statistics named sample entropy, when compared to control subjects. Basal AP and LF (low frequency) power of systolic AP were similar between PCS patients and control subjects, while 0 V (zero variation) patterns of AP from the nonlinear method symbolic analysis were exacerbated in PCS patients. Despite tachycardia and a decrease in RMSSD, no parameter of HRV changed during HUTT in PCS patients compared to control subjects. PCS patients reassessed after 6 months showed higher HF power of RR spectra and a higher percentage of 2UV pattern of RR. Moreover, the reassessed PCS patients showed a lower occurrence of 0 V patterns of AP, while the HUTT elicited HR (heart rate) and AP responses identical to control subjects. The HRV and AP variability suggest an autonomic dysfunction with sympathetic predominance in PCS patients. In contrast, the lack of responses of HRV and AP variability indices during HUTT indicates a marked impairment of autonomic control. Of note, the reassessment of PCS patients showed that the noxious effect of COVID-19 on autonomic control tended to fade over time.
Introduction
Heart rate variability (HRV) has been thoroughly investigated as a way to evaluate changes in the neural control of the heart in patients with post-COVID-19 syndrome (PCS) (1–3). However, it is worth mentioning that most of the studies that have evaluated HRV in COVID-19 focused on the severity of the outcomes of this illness. Moreover, beat-to-beat blood pressure variability, which is also a valuable tool to investigate cardiovascular regulation, is poorly investigated in COVID-19 syndrome (4). On top of that, few studies have evaluated cardiovascular variability responses to challenging maneuvers such as the head-up tilt test (HUTT) in patients with PCS. Of note, Faria et al. (5) have already demonstrated that COVID-19 survivors exhibit reduced exercise capacity, while the neurovascular response to sympathoexcitatory challenges determined by the handgrip exercise was preserved (6). We hypothesize that patients with PCS will show changes in HR and AP variability at either basal conditions or during HUTT, when compared to control healthy subjects. Moreover, we expect that the lower HRV and higher APV indicating an autonomic dysfunction with sympathetic predominance in PCS patients, and the attenuated responses of HRV and AP variability indices during HUTT indicating a marked impairment of autonomic control, will return to normal after 6 months of follow up.
Furthermore, we highlight that the most commonly used HRV approach to evaluate autonomic function is the spectral analysis of the RR series. However, the symbolic analysis proposed by Guzzetti et al. (7) and used in the present study has been shown to be more sensitive to detecting cardiac autonomic changes at either clinical (8, 9) or experimental levels (10).
It is well known that the SARS-CoV-2 emerged in the city of Wuhan (China), causing the occurrence of unusual viral pneumonia, leading to the coronavirus disease 2019 (COVID-19) (11). Besides significant pulmonary damage, SARS-CoV-2 infection also leads to cardiocirculatory abnormalities, for instance, myocarditis, pericarditis, arrhythmia, heart failure, cardiogenic shock, and abnormalities of coagulation (12). It is well known that the infection with SARS-Cov-2 may lead to marked cardiac autonomic dysfunction (13). Soliński et al. (1) highlighted that probably due to the prolonged inflammatory process induced by the infection with SARS-CoV-2, autonomic dysfunction might persist long after viral shedding. Apropos, it is not really known what is behind the post-COVID condition. Central nervous system inflammation is one of the hypotheses of long-term complications in patients who have been infected with SARS-Cov-2 (14). Previous studies showed significant changes in HRV parameters in severe (including fatal) infections with SARS-CoV-2 (1). However, few studies have comprehensively examined the autonomic cardiovascular control in previously asymptomatic, or mildly symptomatic individuals exposed to SARS-Cov-2 (1). In this regard, the results obtained by Soliński et al. (1) suggested an increase in the parasympathetic function, contrasting with the results obtained by Stute et al. (2), who found an increase in sympathetic activity by measuring the muscle sympathetic nerve activity (MSNA) in young adults recovering from SARS-CoV-2 infection.
On the other hand, Barizien et al. (3) reported that increasing numbers of COVID-19 patients, continue to show symptoms months after recovering. Moreover, they have also expressed that autonomic dysfunction, which can aggregate all neurological symptoms, has yet to be prominently reported (3). Nevertheless, their study concluded that patients with long COVID-19 might exhibit dysautonomia characterized by marked changes in HRV indices.
Notable studies dealing with blood pressure variability and COVID-19 suggested that hypertension itself, and its target organ damage and complications, might be a high risk and the cause of fatality for patients with PCS (15, 16). In a retrospective analysis, Li et al. (17) investigated day-by-day blood pressure variability and its association with clinical outcomes (critical vs. severe and discharged) in hospitalized patients with COVID-19. Thus, these authors reached the conclusion that in patients with COVID-19 the blood pressure variability was exacerbated and associated with worse clinical outcomes (17). However, regardless of whether the assessed blood pressure variability is a risk indicator, it may serve as an important biological marker for clinical outcomes of COVID-19 (17). Nandadeva et al. (18) reported that neither ambulatory AP nor laboratory AP were different between control and COVID-19 patients; however, they found a significant inverse relationship with time since COVID-19 diagnosis was established, i.e., greater AP was related to more recent infection.
Until now, few reports have assessed the relationship between day-to-day blood pressure variability and mortality in COVID-19 (4, 16). In addition to strict blood pressure control, it might be important to minimize day-to-day blood pressure variability to reduce mortality in COVID-19 patients (19).
On the other hand, it should be emphasized that the literature is remarkably poor concerning the investigation of cardiovascular responses to challenges, such as the head-up tilt test (HUTT), in patients with PCS. It is quite curious that Eldokla and Ali (20) reported that in their case series, most patients with long-COVID presenting to their laboratory with orthostatic intolerance had no significant HUTT abnormalities; while only 3 patients met the criteria for Postural Orthostatic Tachycardia Syndrome (POTS). Despite this, Seeley et al. (21) showed that the prevalence of autonomic symptomatology for POTS was high in those patients with post-acute sequelae of COVID-19, leading to poor health-related quality of life. What is more, these authors Eldokla and Ali (20) reported that when they calculated the Composite Autonomic Severity Score (CASS) of patients with long-COVID presenting with orthostatic intolerance, which is a validated tool to access the quantification of the severity and distribution of autonomic dysfunction (22), they observed that these long-COVID patients had a low CASS, indicating mild or minimal autonomic dysfunction. Nevertheless, it is worth noting that Luck et al. (23) demonstrated that the most significant autonomic abnormality was the incapacity of three collegiate athletes, who tested positive for COVID-19, to complete a 10-min orthostatic challenge. However, Raj et al. (24) reported that while most people with COVID-19 illness recover completely, others continue to experience chronic and diverse symptoms, including autonomic manifestations. Besides, Stute et al. (2) observed that resting sympathetic activity, but not heart rate or blood pressure, may be elevated following SARS-CoV-2 infection. In addition, they stated that cardiovascular and perceptual responses to physiological stress in PCS might be altered.
Thus, the present study investigated the HRV and AP (arterial pressure) variability at rest and during the HUTT in patients with PCS who reported remnant cardiovascular symptoms, such as tachycardia and postural hypotension, persisting for at least three months. In addition, a group of patients with PCS was reassessed after 6.2 ± 1 months, i.e., from 159 to 224 days after the first evaluation. HRV and AP variability results suggest an autonomic dysfunction with sympathetic predominance in PCS patients. As well as this, the HRV and AP variability indices during HUTT indicate a marked impairment of autonomic control. Of note, similar to the findings from spectral analysis, the symbolic analysis – a reliable tool for the assessment of rapid changes of cardiac autonomic modulation induced by a graded HUTT (8) – showed that the occurrence of the percentage of 2UV (two unlike variation) pattern of RR (beat-to-beat interval) – a parameter that reflects changes in vagal modulation – decreased during the HUTT in control subjects, but not in patients with PCS. However, in the reassessed PCS patients, a decrease in the percentage of 2UV was also observed during the HUTT.
Methods
Participants
The study was performed among patients attending a post-COVID-19 outpatient clinic at the University Hospital from the Ribeirão Preto Medical School – University of São Paulo (HCFMRP/USP), Ribeirão Preto, SP, Brazil. Adult patients (N = 16) with PCR confirmed COVID-19 with symptom onset during February 1st – December 31st, 2021, of both sexes, aged between 32 and 61, were eligible for the study. All patients required hospitalization during the acute phase of COVID-19, and exhibited after recovering from COVID-19 residual cardiovascular symptoms, such as tachycardia and postural hypotension, i.e., patients with the PCS exhibited cardiovascular symptoms. This was a subsample of the RECOVIDA Project (25), a cohort study aiming to comprehensively describe the long-term symptoms observed among patients surviving the acute phase of COVID-19 and to investigate the physical, emotional, and social impact associated with them. Patients were consecutively recruited in an outpatient clinic named Post-COVID-19 Ambulatory. Most patients were referred to the clinic after being discharged from a hospital admission due to severe or critical COVID-19 (7, 25). A group of 10 out of the 16 patients with PCS were reassessed after approximately 6 months. To build a control group for this study, we selected exams (N = 22) that were stored in a database of the Division of Cardiology of the Department of Internal Medicine from the Ribeirão Preto Medical School – University of São Paulo and performed at the HCFMRP/USP, following the same protocol applied to the patients with PCS. These exams were performed before the COVID-19 pandemic in adult patients of both sexes, aged between 31 and 69 years old, opting for exams of healthy patients with fewer comorbidities and use of medications. The patients were submitted to the HUTT to evaluate for a possible neurocardiogenic syncope. These patients were considered robust after clinical investigation, displaying normal responses to the HUTT.
Control patients were randomly selected, with preference given to healthy individuals with fewer comorbidities, using medications with low influence on HRV, and age similar to the PCS patients. No race/ethnicity was taken into account when selecting the Control and PCS patients. Concerning the female participants of both groups (PCS and Control), the menopause factor and period of the menstrual cycle were not taken into account when performing the HUTT and selecting the exams in the database.
The data collection and the analysis protocols were conducted following The Code of Ethics of the World Medical Association (Declaration of Helsinki) and authorized by the Research Ethics Committee of HCFMRP/USP (CAAE:31172720.9.0000.5440).
Data collection
Participants were recruited from a post-COVID-19 outpatient clinic at the University Hospital of the Ribeirão Preto Medical School – University of São Paulo, Ribeirão Preto, SP, Brazil.
The data collection was performed in a controlled temperature and humidity room, with emergency support, located at the Division of Cardiology of the HCFMRP/USP. All tests were performed on the same day to avoid circadian rhythm influences.
For participants who used drugs that affect the autonomic nervous system, such as β blockers, discontinuation of the medication was recommended 24 h before the examination.
Participants were positioned securely on a tilt test table and attached to electrocardiogram (ECG) electrodes (lead II) and a finger cuff for non-invasive AP monitoring (Finometer PRO, Finapres Medical Systems, Amsterdam, Netherlands). ECG signal was filtered (0.5–100 Hz), amplified (8811A, Hewlett Packard, Palo Alto, California, USA), and sampled (1 kHz) in an IBM/PC equipped with an analog-to-digital interface (DI720, DATAQ, Akron, Ohio, USA). The signal from the Finometer PRO system was sampled simultaneously with ECG. Patients were breathing spontaneously during data collection, without pacing.
The subjects were instructed to remain relaxed with minimal movement and no talking for 10 min for baseline (rest) ECG and AP recordings. Subsequently, the HUTT was performed by carefully angling the table to 70° and keeping it in this position for the next 10 min while ECG and AP were continuously recorded. Finally, the table was returned to rest, where the subjects were allowed to recover.
Participants’ recruitment and data collection covered February 1st, 2021, and June 31st, 2022.
Data processing and analysis
ECG and AP recordings were processed using the computer software LabChart (ADInstruments, Dunedin, New Zealand), capable of generating beat-to-beat time series with values of RR intervals as well as systolic, diastolic, or mean AP. Series of successive values of RR intervals and systolic AP were generated for the basal period and during HUTT.
Spurious values from recording artifacts or ectopic beats were removed from the time series using the following procedure: a moving average window of 10 to 50 values was used to calculate the series baseline. Next, upper and lower thresholds were defined as the baseline shifted up and down by a rate of 0.1 to 0.2 times the mean. All PI (Pulse Interval) values above the upper or below the lower threshold were replaced using linear interpolation. The study did not use a series in which removals exceeded 1% of the total number of PI values.
Linear and non-linear indices of HRV and systolic AP variability were calculated using the customized freely available computer software PyBios (26) as follows:
Time domain: Standard deviation of successive cardiac intervals (SDNN) and root mean square of the successive differences (RMSSD) from beat-to-beat RR intervals were calculated. The standard deviation of systolic AP values was calculated as an index of overall AP variability.
Frequency domain (spectral analysis): Both RR intervals and systolic AP time series were resampled at 4 Hz using cubic spline interpolation and divided into half-overlapping segments of 512 points. After Hanning windowing, each segment had its spectrum calculated using the Fast Fourier Transform, and the spectra of RR intervals were integrated into low- (LF: 0.04–0.15 Hz) and high-frequency (HF: 0.15–0.5 Hz) bands. In contrast, the spectra of systolic AP were integrated only at LF. The median of the LF and HF powers from all segments were considered for each patient and expressed in absolute or normalized units.
Symbolic analysis: Non-linear analysis of symbolic dynamics (8, 27) was performed as follows. Series of RR intervals (or systolic AP values) were split into segments of 500 values overlapped by half. For each segment, the full range of values was divided into six uniform distributed levels, and symbols were assigned to each value according to the level it belonged to. Sequences of three consecutive symbols were analyzed and classified into one of the four following families according to their variation pattern: zero variation (0 V), where symbols are all the same; one variation (1 V), where two consecutive symbols are equal, and the remaining is different; two like variations (2LV), where variations between symbols are in the same direction, creating an ascending or descending ramp; and two unlike variations (2UV), where the variations between symbols are opposite, forming a peak or valley. The percentage of occurrence of each family was computed for each segment, and the median values of the segments were taken to represent the whole series of RR intervals (or systolic PA).
Sample entropy (SampEn): SampEn measures the irregularity of the time series, where the higher the SampEn, the more irregular (unpredictable) the time series is. SampEn parameters were set to m = 2 and r = 15% of time series standard deviation, where m is the length of the sequences (number of RR intervals) considered to calculate the predictability of the time series and r is the tolerance factor (28).
Statistical analysis
Data are presented as mean ± SEM. The Kolmogorov–Smirnov test was applied to test the normality of data distribution. Two-way analysis of variance (2-way ANOVA) was used to compare groups and HUTT when the data set was normally distributed; otherwise, an analysis of variance on ranks (Kruskal-Wallis test) was applied, whenever the data set deviated from the normal population. When differences were found, the data were compared by the post hoc parametric Tukey or non-parametric Mann–Whitney U-test depending on the proximity to the normal population of the data set. Intragroup comparisons, before and during HUTT, were performed by paired Student t-test or Wilcoxon rank test when appropriate. The significance level was set at p < 0.05.
Results
Description of the study population sample
A total of 22 individuals were evaluated as Control, and 16 patients were the PCS group. In addition, 10 out of 16 post-COVID-19 syndrome (PCS) patients were reassessed approximately 6 months later. The demographic and clinical characteristics of the participants are described on Table 1, while the echocardiographic characteristics are described on Table 2. Patients with PCS and the reassessed PCS patients showed significant tachycardia compared to the Control individuals. The echocardiographic analysis did not show any significant differences among all groups studied.
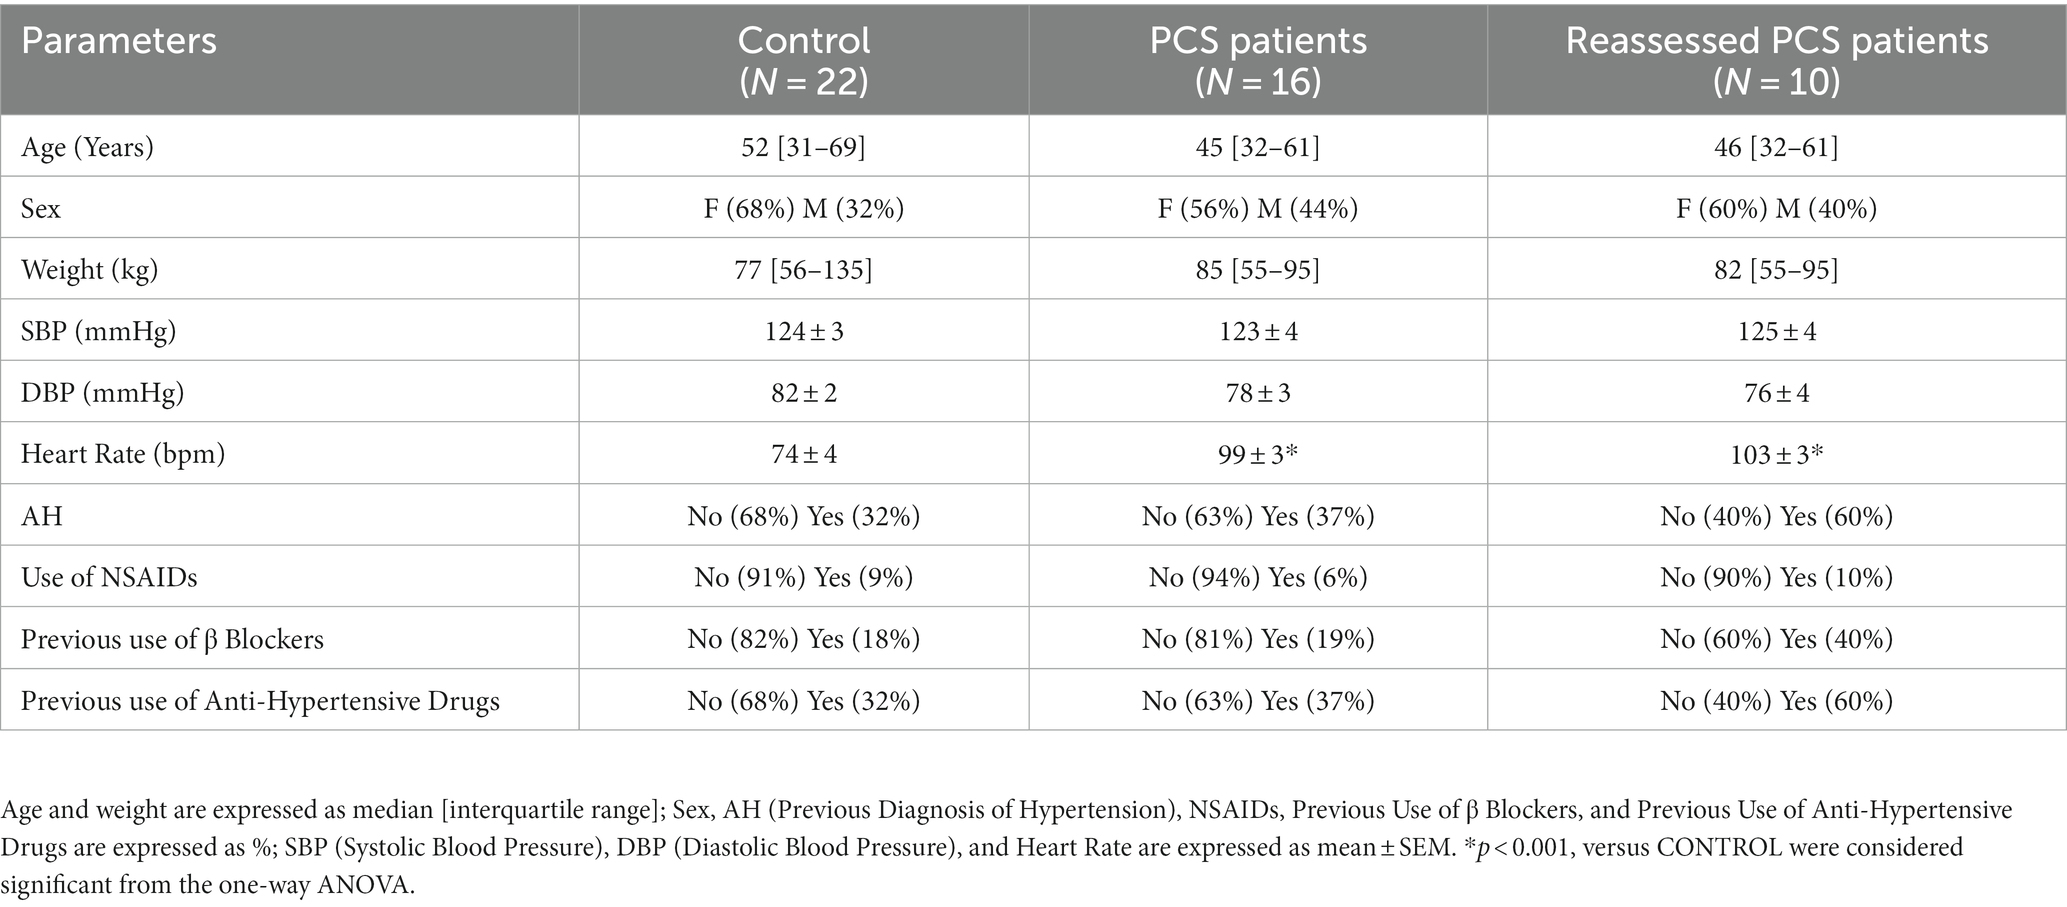
Table 1. Demographic and clinical characteristics of post-COVID-19 syndrome (PCS) patients, Reassessed PCS patients, and their matched Control.
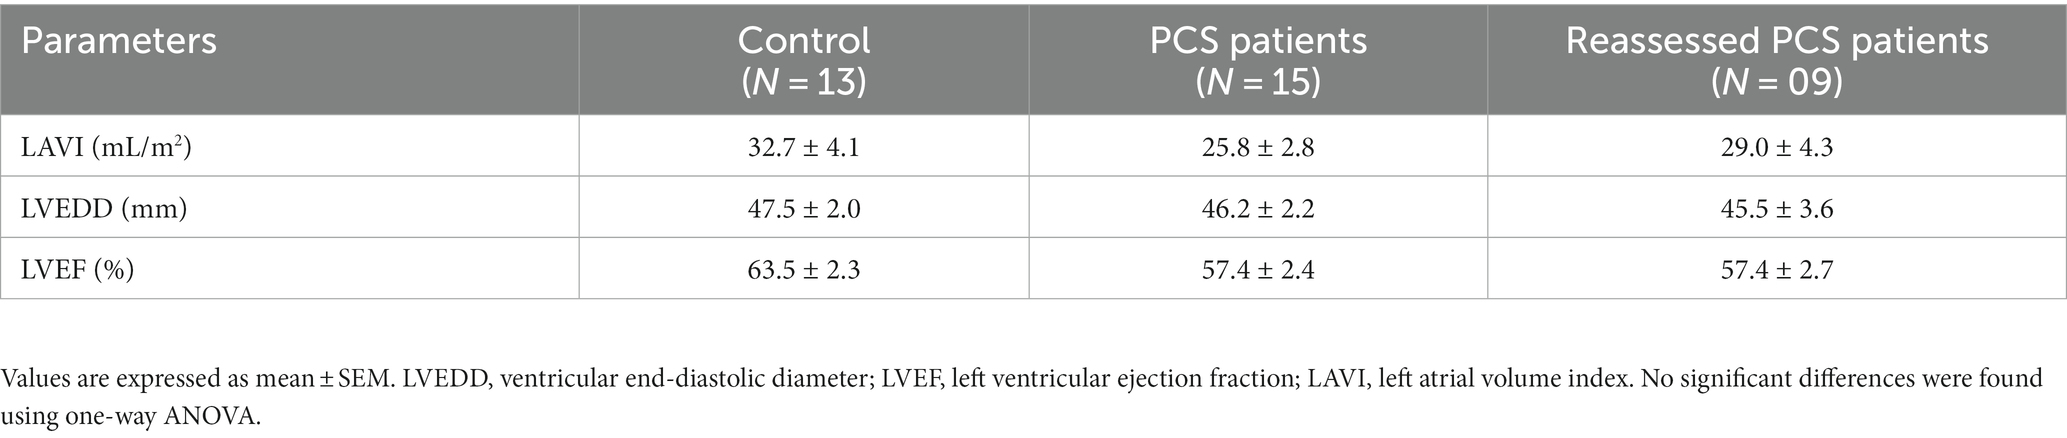
Table 2. Echocardiographic characteristics of post-COVID-19 syndrome (PCS) patients, Reassessed PCS patients and their matched Control.
Heart rate variability indices at rest: first recording and reassessment
At their first assessment, patients with PCS showed higher basal HR than the control subjects (84 ± 4 vs. 71 ± 3 bpm, p = 0.004). The patients reassessed after 6 months remained with higher basal HR (79 ± 3 bpm vs. 87 ± 4 bpm, p = 0.002, at first recording and reassessment, respectively).
The data of HRV examined in the time and frequency domain (spectral analysis), and through non-linear analysis (8, 10) are displayed in Figures 1, 2. Values of Sample Entropy from the RR series of the two groups studied are shown in Figure 3.
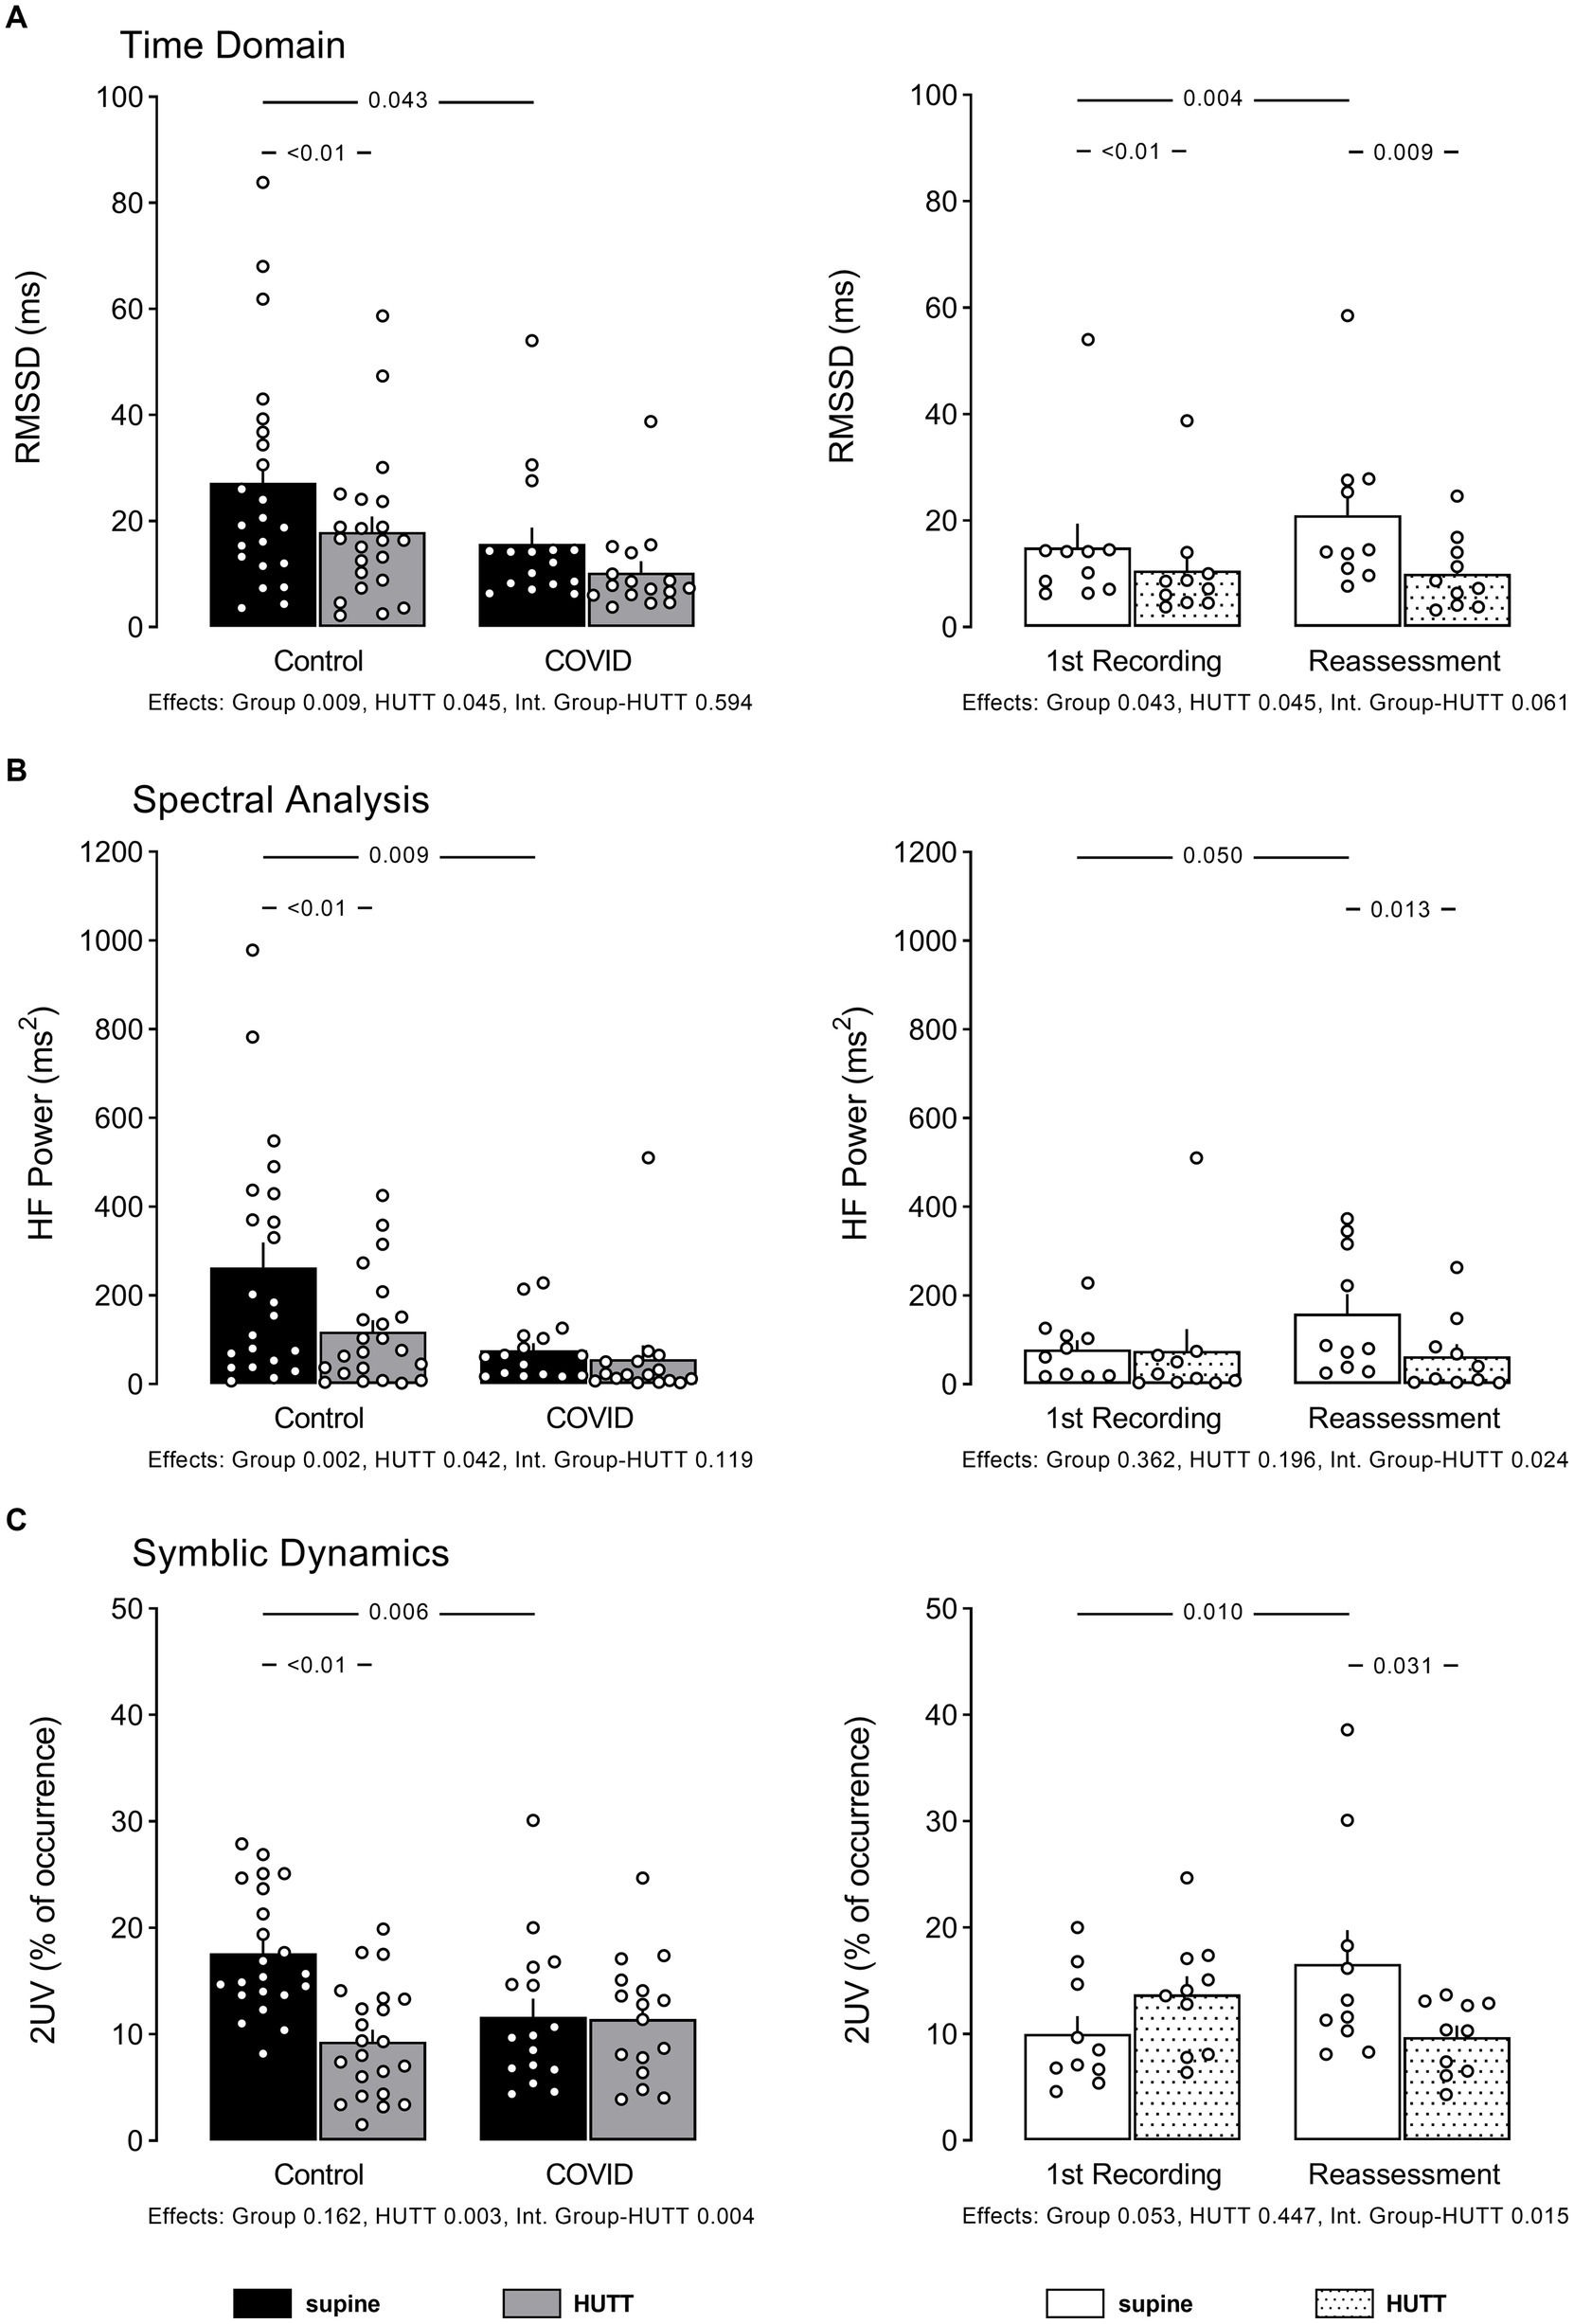
Figure 1. Individual data and mean ± EPM values of RR interval variability indices linked to vagal modulation of the heart at supine and head up tilt. (A) Shows root mean square of successive differences squared of RR intervals (time domain), (B) shows high-frequency power of RR intervals spectra (spectral analysis), and (C) shows percentage of occurrence of sequences with 2 variations according symbolic analysis as described by Porta et al. Left column brings the comparison between control (N = 22) and patients recovered from COVID-19 (N = 16). Right column brings the comparison between patients recovered from COVID-19 at their 1st recording and reassessment after 6 months (N = 10). Numbers between bars show p value obtained by Tukey or Mann Whitney U test, accordingly. Numbers below bar graphs show p values obtained by 2-Way ANOVA for effect of group (control vs. COVID), effect of HUTT (supine vs. orthostatic position) and interaction group-HUTT.
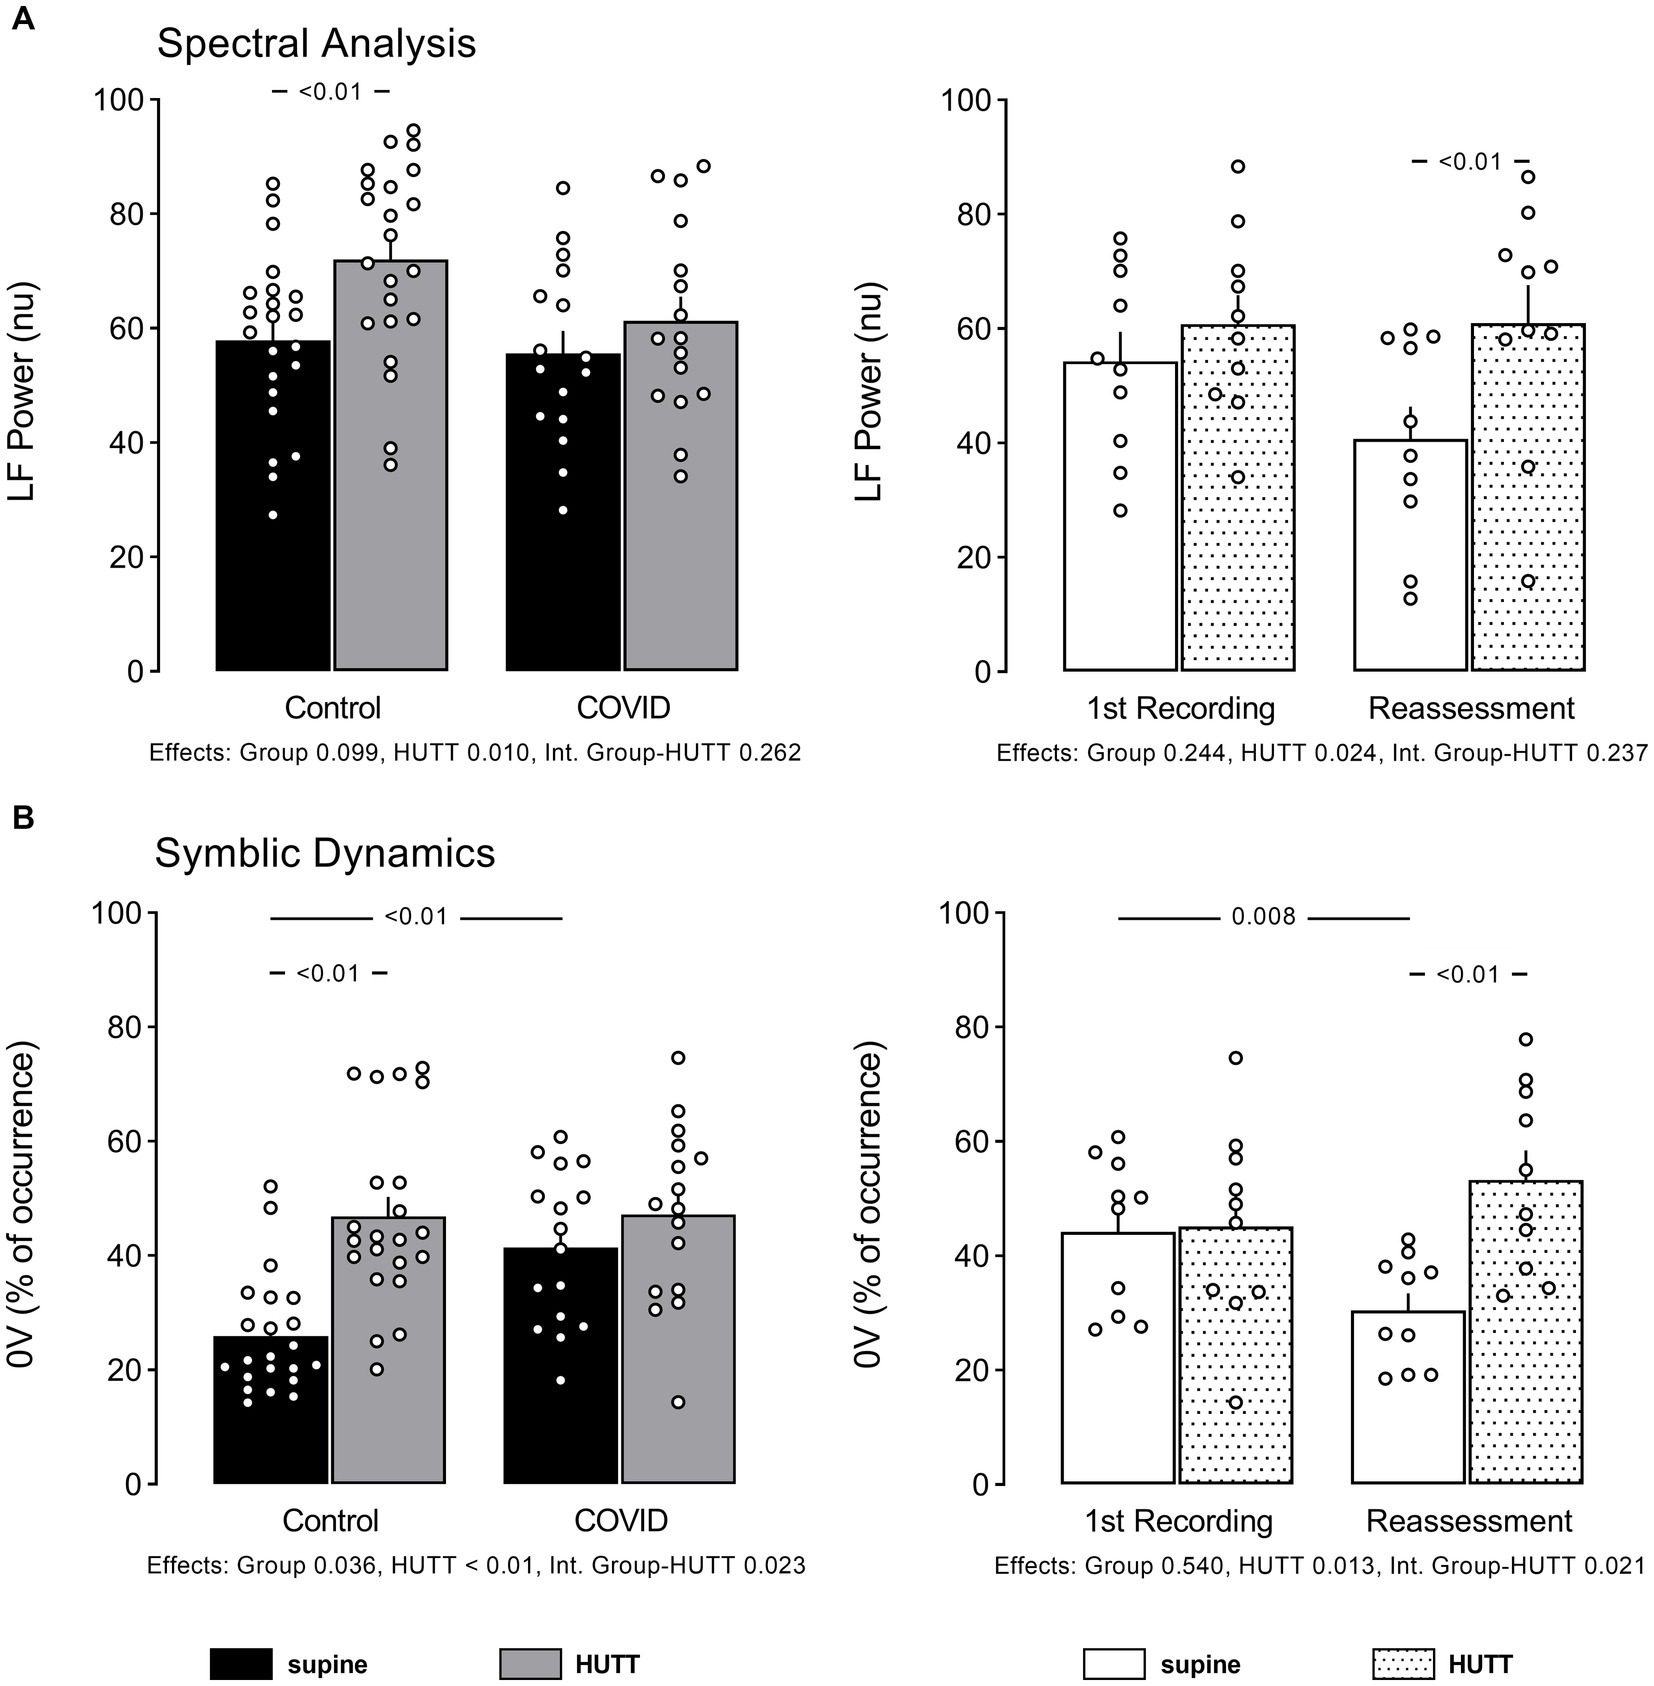
Figure 2. Individual data and mean ± EPM values of RR interval variability indices linked to sympathetic modulation of the heart at supine and head up tilt. (A) Shows high-frequency power of RR intervals spectra (spectral analysis) and (B) shows percentage of occurrence of sequences with no variation according symbolic analysis as described by Porta et al. Left column brings the comparison between control (N = 22) and patients recovered from COVID-19 (N = 16). Right column brings the comparison between patients recovered from COVID-19 at their 1st recording and reassessment after 6 months (N = 10). Numbers below bar graphs show p values obtained by 2-Way ANOVA for effect of group (control vs. COVID), effect of HUTT (supine vs. orthostatic position) and interaction group-HUTT.
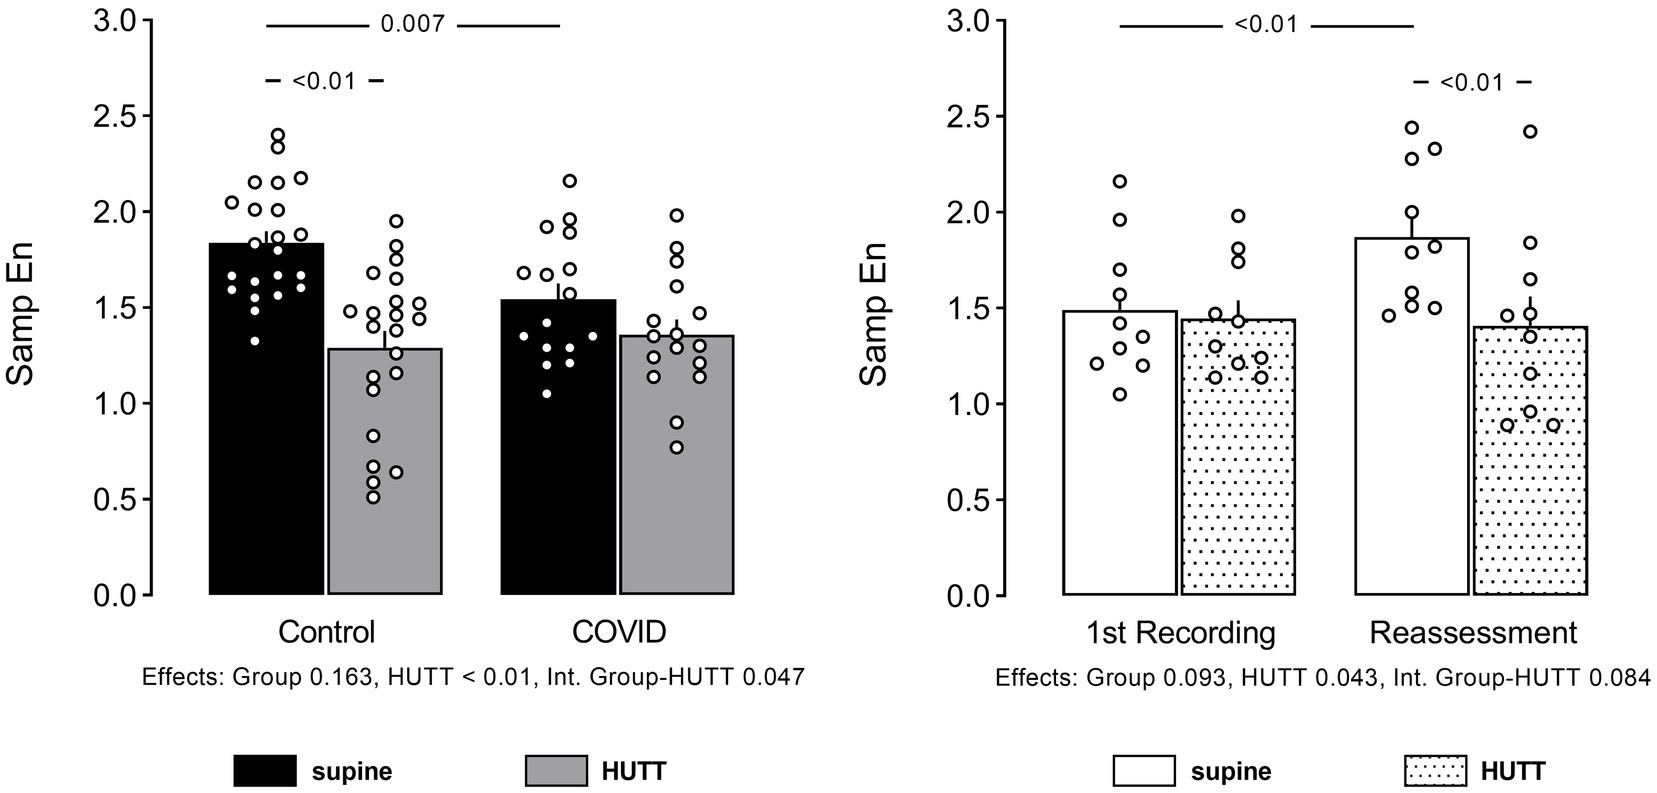
Figure 3. Individual data and mean ± EPM values of Sample Entropy (SampEn) of RR interval series at supine and head up tilt. Left column brings the comparison between control (N = 22) and patients recovered from COVID-19 (N = 16). Right column brings the comparison between patients recovered from COVID-19 at their 1st recording and reassessment after 6 months (N = 10). Numbers below bar graphs show p values obtained by 2-Way ANOVA for effect of group (control vs. COVID), effect of HUTT (supine vs. orthostatic position) and interaction group HUTT.
Patients with PCS showed lower RMSSD, remarkably lower power of RR spectra at HF, and lower occurrence of 2UV patterns from the symbolic analysis, compared to their control counterparts. Of note, the patients reassessed 6 months later recovered the HF power of RR spectra and occurrences of 2UV pattern of symbols, but not the RMSSD.
The power of RR spectra at the LF band was not different between the two groups, contrasting with the higher incidence of 0 V pattern from the symbolic analysis shown by patients with PCS. At reassessment, the LF power of RR spectra remained similar to the first evaluation, contrasting with the occurrence of 0 V pattern of symbols that decreased with time.
Sample entropy was smaller in patients with PCS at their first assessment. However, SampEn from PCS patients reassessed after 6 months was back to normal, compared to their first recording.
Heart rate variability indices during the head-up tilt test: first recording and reassessment
HUTT elicited a tachycardia response in both groups, i.e., control subjects (71 ± 3 to 80 ± 4 bpm, p < 0.001) and patients with PCS (84 ± 3 to 94 ± 3 bpm, p < 0.001). At reassessment, patients with PCS also displayed significantly increased HR during the HUTT (79 ± 3 vs. 89 ± 4 bpm, p < 0.010, at first recording and reassessment, respectively).
In addition to showing baseline (rest) values, Figures 1, 3 also show HRV indices in response to HUTT in control subjects and patients with PCS.
As expected, the results in the time domain demonstrated a reduction of the RMSSD during the HUTT in both, control subjects and patients with PCS, even though patients with PCS showed a smaller change of RMSSD elicited by the HUTT than their control counterparts. However, the HUTT applied to the patients with PCS reassessed after 6 months, determined a RMSSD response similar to that observed during the first recording.
Looking at the spectral analysis of HRV, the power of RR spectra at HF was, as expected, markedly reduced by HUTT in control subjects. However, HUTT did not affect the HF power of RR spectra in patients with PCS. Nevertheless, in patients reassessed after 6 months, the HF power of RR spectra was reduced by HUTT.
The power of RR spectra at the LF band was increased by HUTT only in control subjects, and not in patients with PCS at their first evaluation. However, when reassessed after 6 months, HUTT elicited a significant increase in LF power of RR spectra in patients with PCS.
Similar to the findings from spectral analysis, the symbolic analysis showed that the occurrence of 2UV decreased with HUTT in control subjects, but not in patients with PCS. Nevertheless, in the reassessed patients, HUTT decreased the percentage of 2UV.
Also, similarly to the LF power of RR spectra, the occurrence of patterns with 0 V increased with HUTT only in the control subjects at first recording; but, in the reassessed patients, HUTT elicited an increase in this index.
In line with the other findings, SampEn decreased with HUTT only in control subjects at their first evaluation. However, HUTT significantly reduced SampEn in patients with PCS during their reassessment.
Arterial pressure and its variability at rest: first recording and reassessment
No significant difference was found concerning the systolic AP at rest between control subjects and patients with PCS (129 ± 3 vs. 137 ± 3 mmHg, p = 0.079). Similarly, the reassessed patients also showed similar systolic AP values (141 ± 5 vs. 131 ± 5 mmHg, p = 0,052, at first recording and after 6 months, respectively).
The data of systolic AP variability examined in the time and frequency domain, as well as by the non-linear symbolic dynamics approach, are displayed in Figure 4.
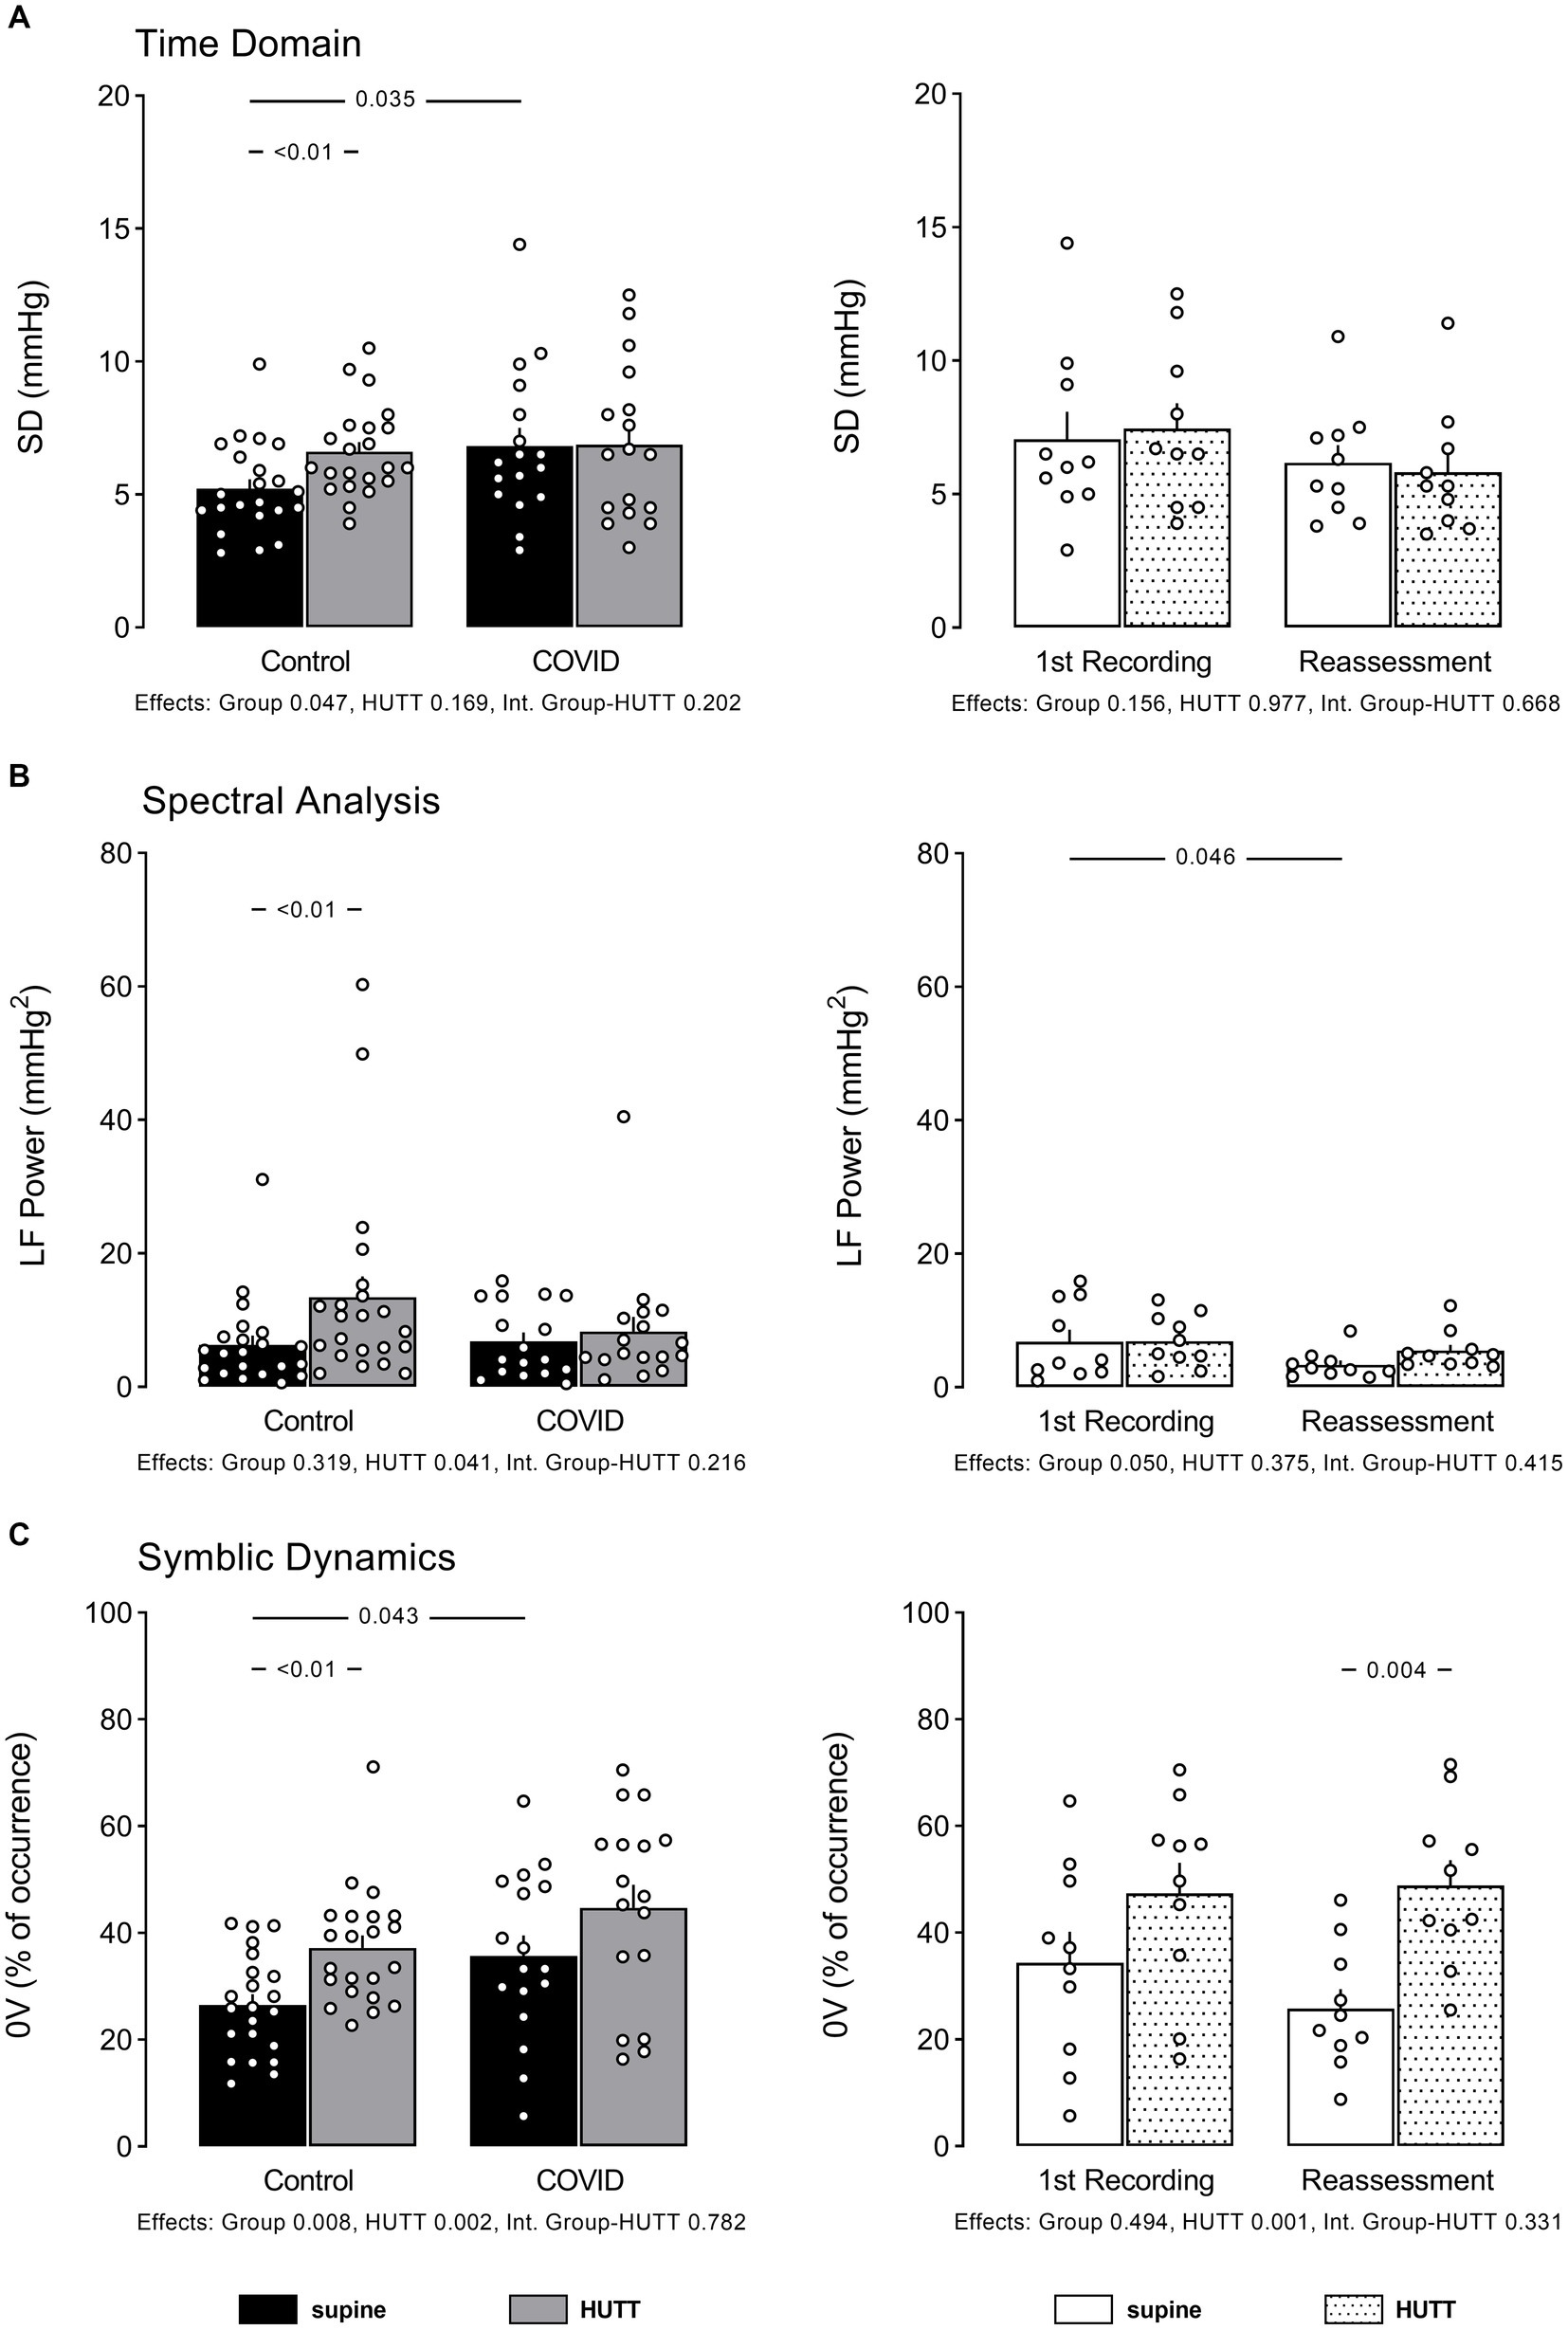
Figure 4. Individual data and mean ± EPM values of systolic arterial pressure variability indices at supine and head up tilt. (A) Shows standard deviation of pressure values (time domain), (B) shows low frequency power of systolic pressure spectra (spectral analysis), and (C) shows percentage of occurrence of sequences with no variations according symbolic analysis as described by Porta et al. Left column brings the comparison between control (N = 22) and patients recovered from COVID-19 (N = 16). Right column brings the comparison between patients recovered from COVID-19 at their 1st recording and reassessment after 6 months (N = 10). Numbers between bars show p value obtained by Tukey or Mann Whitney U test, accordingly. Numbers below bar graphs show p values obtained by 2-Way ANOVA for effect of group (control vs. COVID), effect of HUTT (supine vs. orthostatic position) and interaction group-HUTT.
Patients with PCS exhibited significantly higher overall pressure variability, as shown by the high SD of systolic AP at rest, compared to their control counterparts. The systolic pressure variability examined by spectral analysis showed similar values of LF power of pressure spectra in both groups studied. When the systolic AP variability was examined by symbolic analysis, a high occurrence of the pattern 0 V was observed in patients with PCS.
The patients reassessed after 6 months showed similar SD of systolic AP, similar LF power of AP spectra, and lower occurrence of 0 V compared to their first assessment.
Arterial pressure variability responses to head-up tilt test: first recording and reassessment
HUTT did not change systolic AP in either control subjects (129 ± 3 vs. 131 ± 3 mmHg, p = 0.363) or patients with PCS (137 ± 3 vs. 138 ± 3 mmHg, p = 0.430).
Figure 4 also shows systolic AP variability indices in response to HUTT in control subjects and patients with PCS.
While the control subjects displayed increased systolic pressure SD during the HUTT, the patients with PCS did not exhibit any pressure response with this maneuver. At reassessment, no change of systolic pressure SD was observed between groups in response to HUTT.
As expected, HUTT elicited a marked increase in the LF power of pressure spectra in control subjects, while patients with PCS did not show any change in this parameter during HUTT. Nevertheless, in the reassessed patients, the LF power of AP spectra increased with HUTT.
Moreover, while the control individuals exhibited an increase of 0 V% during the HUTT, the patients with PCS showed no change of this parameter elicited by this maneuver. However, in both the first assessment and 6 months after, patients with PCS showed a normal response concerning 0 V% during the HUTT.
Discussion
The present study investigated HR and AP variability in patients with PCS with symptoms of cardiovascular disorders compared to control subjects evaluated before the COVID-19 pandemic. In addition, 10 out of 16 patients with PCS were reassessed after six months. Besides the cardiovascular variability at rest, the subjects of the present study were also evaluated during HUTT, a challenge to the cardiovascular system.
Impairment of parasympathetic function
The analysis of HRV of patients with PCS at rest demonstrated an attenuation of the RMSSD and HF power of RR spectra, combined with a significant reduction of the occurrence of the 2UV pattern from the symbolic analysis. Therefore, these findings suggest that patients with PCS exhibit reduced vagal – parasympathetic – modulation of the heart at rest. Apropos, the patients with PCS on their first recording, as expected, showed higher basal HR compared to control subjects.
These findings align with previous observations from the literature (29, 30), suggesting that long COVID-19 has led to an impairment of parasympathetic function. Furthermore, it was also observed in the current study lower SampEn of RR Intervals in the patients with PCS. This observation also aligns with those published by Aliani et al. (31), who showed a decrease in entropy related to the severity of COVID-19. Aranyó et al. (30) stated that the imbalance of the cardiac autonomic modulation might explain, for instance, the inappropriate sinus tachycardia (IST) in patients with PCS, an outcome also observed in some patients from the current study exhibiting PCS.
Imbalance of the autonomic nervous system
Moreover, Leitzke et al. (32) have pointed out that patients with an increased risk of a more severe COVID-19 showed a disturbed balance of the autonomic nervous system, particularly with impairment of vagal function (33). In contrast, Latchman et al. (34) observed no difference in parasympathetic modulation, sympathetic modulation, and BRS between young adults who had COVID-19 versus young adults who never had COVID-19. These findings suggest a preserved autonomic nervous system function and baroreflex sensitivity in young adults after COVID-19. Additionally, looking at identifying a cut-off point value for HRV associated with elevated risk across a range of known risk factors, Leitzke et al. (32) provided the first evidence that changes in RMSSD may be related to high risk across a range of established cardiovascular risk factors.
However, the findings from the current study contrast with the observations from other studies in patients with a history of COVID-19, who found an increased RMSSD (13, 35) consistent with a parasympathetic overactivation (1). Asarcikli et al. (13) have also found an LF/HF ratio increase, which is compatible with sympathetic overactivity. On the other hand, when Salem et al. (36) investigated the post-acute effect of SARSCoV-2 infection on cardiovascular autonomic activity in patients with PCS, who were exposed to the infection at least three months before, they concluded that despite several parameters of HRV being numerically reduced in these patients with PCS, they were not statistically significant.
Sympathetic modulation of the heart was not altered at rest
It was also observed in the current study that the patients with PCS exhibited an LF power of HRV, indicating that the sympathetic modulation of the heart was not altered at rest; however, the increase in the occurrence of 0 V contradicts this observation, indicating an increased sympathetic modulation of the heart in these patients. Notably, Asarcikli et al. (13) found an LF/HF ratio increase, which is also consistent with sympathetic overactivity. Finally, Stute et al. (2) observed a rise in resting sympathetic activity in young adults who tested positive for SARS-CoV-2 when measuring muscle sympathetic nerve activity (MSNA). However, Skow et al. (37) suggested the incidence of a transient impact of COVID-19 on cardiac autonomic function, which appears mild and unrelated to persistent symptoms in young adults. Furthermore, Stute et al. (38) have demonstrated that sympathetic activation prior to sympathoexcitatory challenges determined by the HUTT indicate that resting sympathetic activity, evaluated through the MSNA may be reduced during the recovery from SARS-CoV-infection.
Analysis of arterial pressure variability
The analysis of AP variability showed higher overall pressure variability, confirmed by the higher values of SD of systolic AP in patients with PCS. In addition, these patients also showed higher LF Power of AP spectra and higher occurrence of 0 V patterns compared to their control counterparts. These findings strongly indicate an overactivity of vascular sympathetic modulation at rest in these patients (8, 39–41).
It is worthy of note that the literature displays few studies of blood pressure variability in COVID-19. Nevertheless, an autonomic nervous system imbalance has been suggested to determine the severity of COVID-19 (32, 42). Moreover, the data from the study of He et al. (43) provided an essential contribution to this notion; they are considered within the context of the precise pathophysiology underlying the relationship between COVID-19 infection and day-to-day BP variability (19). In line with this understanding, Li et al. (17) observed more significant systolic arterial pressure variability in critically ill patients when compared with their severe and discharged counterparts. This conclusion came from investigating day-by-day blood pressure variability and its association with clinical outcomes (critical vs. severe and discharged) in hospitalized patients with COVID-19 (17).
Head-up tilt test and COVID-19
It should be emphasized that the literature is remarkably poor concerning investigating challenging maneuvers to the cardiovascular system, such as the HUTT with COVID-19. It is quite curious that Eldokla and Ali (20) reported that most patients presenting long-COVID in their laboratory with orthostatic intolerance had no significant HUTT abnormalities. Only three patients met the criteria for Postural Orthostatic Tachycardia Syndrome (POTS).
It is well known that passive HUTT promotes graded changes in the sympathovagal balance (44). Thus, the HUTT was used in the current study to characterize the derangement of the sympathovagal balance response of the heart and blood vessels in patients with PCS.
As expected, the time domain results demonstrated a significant reduction of the RMSSD during the HUTT in both control subjects and patients with PCS. In contrast, patients with PCS displayed a noticeable attenuation of this response compared to their control counterparts. As well as this, an expected decrease was also observed concerning the HF power of RR interval spectra and a reduction of the 2UV pattern in control individuals but not in patients with PCS. Likewise, an expected increase of the LF power of RR intervals was observed with an increase in the occurrence of 0 V pattern in the control subjects but not in patients with PCS during HUTT. These findings indicate a noxious effect of SARS-CoV-2, which probably affected the response of the sympathovagal balance elicited by HUTT in patients with PCS.
SampEn is a non-linear index of heart rate dynamics, which describes the complexity and unpredictability of RR interval behavior. It is linked to the vulnerability of the development of detrimental conditions such as atrial fibrillation and/or life-threatening ventricular arrhythmias (45). Likewise, other non-linear indices of HRV, such as the role of the autonomic modulation of the heart in the genesis of HRV entropy, are not defined. Nevertheless, when Silva et al. (46) examined the SampEn at multiple time scales with pharmacological blockade of cardiac autonomic receptors in rats, they found that entropy at short scales reflects vagal modulation of HR. In contrast, it would be associated with both sympathetic and parasympathetic cardiac modulation at a long time scales (46). Of note, another study in the literature corroborates this interpretation (47).
In line with the other findings of the present study, SampEn was lower in patients with PCS compared to control subjects and was not reduced during HUTT in these patients. Therefore, the results of SampEn strongly suggest a derangement in cardiovascular modulation in patients with PCS with cardiovascular symptoms.
Taking into account that the LF power of pressure spectra, as well as the occurrence of 0 V from symbolic analysis, did not increase during HUTT in patients with PCS, as it did in control subjects, this strongly suggests that the noxious effect of SARS-CoV-2 on cardiac control also affects the modulation of vascular smooth muscle in patients with PCS.
HRV and sympathovagal modulation during the reassessment period
The results of HRV regarding the sympathovagal modulation of the heart from patients with PCS at the reassessment period, i.e., six months after the first recording, demonstrated that the RMSSD did not return to the values shown by the control subjects, contrasting with the data obtained in the frequency domain as well as the symbolic analysis. These last indices indicate that the imbalance of the sympathovagal cardiac modulation was normalized over six months.
However, these findings contrast with the observations from other studies (13, 29, 30, 35), which indicated that long COVID-19 exhibits an attenuation of the parasympathetic function.
Moreover, it was observed in the current study that the LF Power of HRV was similar in patients with PCS and control subjects at either the first recording or reassessment. These findings contrast with 0 V – symbolic analysis – which was exacerbated during the first recording but returned to normal during the reassessment period. Together, these findings indicate a normal sympathetic modulation of the heart within six months in patients with PCS. These findings align with the observations from Salem et al. (36), who investigated the post-acute effect of SARSCoV-2 infection on cardiovascular autonomic activity, reactivity, and sensitivity, in patients who had the infection at least three months before. These authors observed that these patients displayed several parameters of HRV without significant changes.
It was also detected in the current study that the patients with PCS exhibited an increased occurrence of 0 V – symbolic analysis – at the 1st recording, which is coherent with the notion of an increased sympathetic modulation of the heart in these patients. Of note, this parameter was back to normal by the reassessment period, indicating a recovery of the sympathetic modulation of the heart under the circumstances.
AP variability and sympathovagal modulation during the reassessment period
The AP variability from patients with PCS demonstrated that the SD and the occurrence of 0 V patterns of systolic AP – symbolic analysis – recovered to normal levels by the reassessment period. These findings indicate that the sympathetic modulation of the blood vessels in patients with PCS was back to normal when the three indices, i.e., SD (Time Domain), LF Power of AP spectra (Spectral Analysis), and the occurrence of 0 V patterns – Symbolic Analysis – were taken into account at the time of reassessment.
Thus, the results from the current study suggest a recovery of the sympathetic modulation of the vessels after six months.
The PSC patients exhibited a normal response, i.e., similar to their Control counterparts during the HUTT when reassessed after six months. Moreover, when the LF Power and the 0 V% were considered, the patients with PSC exhibited a similar response when reassessed after six months compared to their control counterparts. These data not only indicate that during the HUTT, there has been an increase in the sympathetic modulation of the blood vessels, but they also indicate that the sympathovagal balance of the vessels was back to normal within a 6-month time frame.
Conclusion
In conclusion, the changes found in the HR and BP variability indices in patients with PCS suggest an autonomic dysfunction, with sympathetic predominance, in these individuals. The marked impairment of the autonomic control of the heart and vessels could lead to a higher risk of life-threatening cardiovascular events. However, one of the major findings of the present study was that the patients with PCS, who underwent the reassessment of the parameters studied, demonstrated that the noxious effect of the Post-COVID Condition related to these findings tends to fade away over time.
Limitation of the current study
Not all PCS patients submitted to the First Recording returned for the Reassessment investigation, i.e., 10 out of 16 PCS patients returned for the Reassessment investigation.
The current study exclusively assessed the variability of systolic AP. Nonetheless, compelling evidence suggests that the variability in diastolic pressure values imparts complementary insights into vascular autonomic regulation, both in physiological and pathological contexts (48). Additionally, it is pertinent to acknowledge that modulations driven by shifts in central volume distribution, akin to those observed in the HUTT, impact the fluctuation of pulse pressure values.
Data availability statement
The datasets presented in this study can be found in online repositories. The names of the repository/repositories and accession number(s) can be found at: The data sets gathered and/or analyzed during the current study are available from the corresponding author on reasonable request.
Ethics statement
The studies involving humans were approved by Research Ethics Committee of HCFMRP/USP (CAAE:31172720.9.0000.5440). The studies were conducted in accordance with the local legislation and institutional requirements. The participants provided their written informed consent to participate in this study.
Author contributions
HS contributed to the conception, supervision, and writing the manuscript. FS, MD, and AS contributed to the data collection and editing of the manuscript. LB and JC contributed to data collection. FB-R contributed to data collection, editing, and revising the manuscript. LJ and DM contributed to revising the manuscript for intellectual content. TB contributed to editing and revising the manuscript. RF contributed to data analysis and editing the manuscript. All authors read and approved the final manuscript.
Funding
This research was supported by The São Paulo Research Foundation (FAPESP), process #2020/06043-7 and #2021/03764-8; National Council for Scientific and Technological Development (CNPq), process #423999/2021-4; Coordenação de Aperfeiçoamento de Pessoal de Nível Superior (CAPES); and Foundation to Support Teaching, Research, and Assistance (FAEPA).
Conflict of interest
The authors declare that the research was conducted in the absence of any commercial or financial relationships that could be construed as a potential conflict of interest.
Publisher’s note
All claims expressed in this article are solely those of the authors and do not necessarily represent those of their affiliated organizations, or those of the publisher, the editors and the reviewers. Any product that may be evaluated in this article, or claim that may be made by its manufacturer, is not guaranteed or endorsed by the publisher.
References
1. Soliński, M, Pawlak, A, Petelczyc, M, Buchner, T, Aftyka, J, Gil, R, et al. Heart rate variability comparison between young males after 4-6 weeks from the end of SARS-CoV-2 infection and controls. Sci Rep. (2022) 12:8832. doi: 10.1038/s41598-022-12844-8
2. Stute, NL, Stickford, JL, Province, VM, Augenreich, MA, Ratchford, SM, and Stickford, ASL. COVID-19 is getting on our nerves: sympathetic neural activity and hemodynamics in young adults recovering from SARS-CoV-2. J Physiol. (2021) 599:4269–85. doi: 10.1113/JP281888
3. Barizien, N, le Guen, M, Russel, S, Touche, P, Huang, F, and Vallée, A. Clinical characterization of dysautonomia in long COVID-19 patients. Sci Rep. (2021) 11:14042. doi: 10.1038/s41598-021-93546-5
4. Nam, JH, Park, JI, Kim, BJ, Kim, HT, Lee, JH, Lee, CH, et al. Clinical impact of blood pressure variability in patients with COVID-19 and hypertension. Blood Press Monit. (2021) 26:348–56. doi: 10.1097/MBP.0000000000000544
5. Faria, D, Moll-Bernardes, RJ, Testa, L, Moniz, CMV, Rodrigues, EC, Rodrigues, AG, et al. Sympathetic neural overdrive, aortic stiffening, endothelial dysfunction, and impaired exercise capacity in severe COVID-19 survivors: a mid-term study of cardiovascular sequelae. Hypertension. (2023) 80:470–81. doi: 10.1161/HYPERTENSIONAHA.122.19958
6. Faria, D, Moll-Bernardes, R, Testa, L, Moniz, CMV, Rodrigues, EC, Mota, JM, et al. Neurovascular and hemodynamic responses to mental stress and exercise in severe COVID-19 survivors. Am J Physiol Regul Integr Comp Physiol. (2023) 325:R269–79. doi: 10.1152/ajpregu.00111.2023
7. Costa, IF, Bonifácio, LP, Bellissimo-Rodrigues, F, Rocha, EM, Jorge, R, Bollela, VR, et al. Ocular findings among patients surviving COVID-19. Sci Rep. (2021) 11:11085. doi: 10.1038/s41598-021-90482-2
8. Porta, A, Tobaldini, E, Guzzetti, S, Furlan, R, Montano, N, and Gnecchi-Ruscone, T. Assessment of cardiac autonomic modulation during graded head-up tilt by symbolic analysis of heart rate variability. AJP Heart Circulat Physiol. (2007) 293:H702–8. doi: 10.1152/ajpheart.00006.2007
9. Tobaldini, E, Porta, A, Wei, SG, Zhang, ZH, Francis, J, Casali, KR, et al. Symbolic analysis detects alterations of cardiac autonomic modulation in congestive heart failure rats. Auton Neurosci. (2009) 150:21–6. doi: 10.1016/j.autneu.2009.03.009
10. Silva, LEV, Silva, CAA, Salgado, HC, and Fazan, R Jr. The role of sympathetic and vagal cardiac control on complexity of heart rate dynamics. Am J Physiol Heart Circ Physiol. (2017) 312:H469–77. doi: 10.1152/ajpheart.00507.2016
11. Hu, B, Guo, H, Zhou, P, and Shi, ZL. Characteristics of SARS-CoV-2 and COVID-19. Nat Rev Microbiol. (2021) 19:141–54. doi: 10.1038/s41579-020-00459-7
12. Wu, L, O'Kane, AM, Peng, H, Bi, Y, Motriuk-Smith, D, and Ren, J. SARS-CoV-2 and cardiovascular complications: from molecular mechanisms to pharmaceutical management. Biochem Pharmacol. (2020) 178:114114. doi: 10.1016/j.bcp.2020.114114
13. Asarcikli, LD, Hayiroglu, Mİ, Osken, A, Keskin, K, Kolak, Z, and Aksu, T. Heart rate variability and cardiac autonomic functions in post-COVID period. J Interv Card Electrophysiol. (2022) 63:715–21. doi: 10.1007/s10840-022-01138-8
14. Reiss, AB, Greene, C, Dayaramani, C, Rauchman, SH, Stecker, MM, de Leon, J, et al. Long COVID, the brain, nerves, and cognitive function. Neurol Int. (2023) 15:821–41. doi: 10.3390/neurolint15030052
15. Barrera, FJ, Shekhar, S, Wurth, R, Moreno-Pena, PJ, Ponce, OJ, Hajdenberg, M, et al. Prevalence of diabetes and hypertension and their associated risks for poor outcomes in COVID-19 patients. J Endocr Soc. (2020) 4:1–16. doi: 10.1210/jendso/bvaa102
16. Jagannatha, GNP, Yasmin, AAADA, Pradnyana, IWAS, Kamardi, S, Pradnyaandara, IGBMA, Pangkahila, EE, et al. Therapeutic target and clinical impact of day-to-day blood pressure variability in hypertensive patients with COVID-19. Hypertens Res. (2023) 46:165–74. doi: 10.1038/s41440-022-01077-x
17. Li, FK, An, DW, Guo, QH, Zhang, YQ, Qian, JY, Hu, WG, et al. Day-by-day blood pressure variability in hospitalized patients with COVID-19. J Clin Hypertens. (2021) 23:1675–80. doi: 10.1111/jch.14338
18. Nandadeva, D, Skow, RJ, Grotle, AK, Stephens, BY, Young, BE, and Fadel, PJ. Impact of COVID-19 on ambulatory blood pressure in young adults: a cross-sectional analysis investigating time since diagnosis. J Appl Physiol. (2022) 133:183–90. doi: 10.1152/japplphysiol.00216.2022
19. Nagai, M, and Förster, YC. Day-to-day blood pressure variability in COVID-19: a biomarker of disrupted central autonomic network. J Clin Hypertens. (2022) 24:234–6. doi: 10.1111/jch.14438
20. Eldokla, AM, and Ali, ST. Autonomic function testing in long-COVID syndrome patients with orthostatic intolerance. Auton Neurosci. (2022) 241:102997. doi: 10.1016/j.autneu.2022.102997
21. Seeley, MC, Gallagher, C, Ong, E, Langdon, A, Chieng, J, Bailey, D, et al. High incidence of autonomic dysfunction and postural orthostatic tachycardia syndrome in patients with long COVID: implications for management and health care planning. Am J Med. (2023) 23:00402–3. doi: 10.1016/j.amjmed.2023.06.010
22. Low, PA. Composite autonomic scoring scale for laboratory quantification of generalized autonomic failure. Mayo Clin Proc. (1993) 68:748–52. doi: 10.1016/s0025-6196(12)60631-4
23. Luck, JC, Blaha, C, Cauffman, A, Gao, Z, Arnold, AC, Cui, J, et al. Autonomic and vascular function testing in collegiate athletes following SARS-CoV-2 infection: an exploratory study. Front Physiol. (2023) 14:1225814. doi: 10.3389/fphys.2023.1225814
24. Raj, SR, Arnold, AC, Barboi, A, Claydon, VE, Limberg, JK, Lucci, VEM, et al. Long-COVID postural tachycardia syndrome: an American autonomic society statement. Clin Auton Res. (2021) 31:365–8. doi: 10.1007/s10286-021-00798-2
25. Bonifácio, LF, Csizmar, VNF, Barbosa-Júnior, F, Pereira, APS, Koenigkam-Santos, M, Wada, DT, et al. Long-term symptoms among COVID-19 survivors in prospective cohort study, Brazil. Emerg Infect Dis. (2022) 28:730–3. doi: 10.3201/eid2803.212020
26. Silva, LEV, Fazan, R Jr, and Marin-Neto, JA. PyBioS: a freeware computer software for analysis of cardiovascular signals. Comput Methods Prog Biomed. (2020) 197:105718. doi: 10.1016/j.cmpb.2020.105718
27. Guzzetti, S, Borroni, E, Garbelli, PE, Ceriani, E, Bella, PD, Montano, N, et al. Symbolic dynamics of heart rate variability. Circulation. (2005) 112:465–70. doi: 10.1161/CIRCULATIONAHA.104.518449
28. Porta, A, Bari, V, de Maria, B, Cairo, B, Vaini, E, Malacarne, M, et al. On the relevance of computing a local version of sample entropy in cardiovascular control analysis. IEEE Trans Biomed Eng. (2019) 66:623–31. doi: 10.1109/TBME.2018.2852713
29. Marques, KC, Silva, CC, Trindade, SS, Santos, MCS, Rocha, RSB, Vasconcelos, PFC, et al. Reduction of cardiac autonomic modulation and increased sympathetic activity by heart rate variability in patients with long COVID. Front Cardiovasc Med. (2022) 9:862001. doi: 10.3389/fcvm.2022.862001
30. Aranyó, J, Bazan, V, Lladós, G, Dominguez, MJ, Bisbal, F, Massanella, M, et al. Inappropriate sinus tachycardia in post-COVID-19 syndrome. Sci Rep. (2022) 12:298. doi: 10.1038/s41598-021-03831-6
31. Aliani, C, Rossi, E, Luchini, M, Calamai, I, Deodati, R, Spina, R, et al. Cardiovascular dynamics in COVID-19: a heart rate variability investigation. Med Biol. (2022) 2022:2278–81. doi: 10.1109/EMBC48229.2022.9871265
32. Leitzke, M, Stefanovic, D, Meyer, JJ, Schimpf, S, and Schönknecht, P. Autonomic balance determines the severity of COVID-19 courses. Bioelect Med. (2020) 6:22. doi: 10.1186/s42234-020-00058-0
33. Jarczok, MN, Koenig, J, Wittling, A, Fischer, JE, and Thayer, JF. First evaluation of an index of low vagally-mediated heart rate variability as a marker of health risks in human adults: proof of concept. J Clin Med. (2019) 8:1940. doi: 10.3390/jcm8111940
34. Latchman, PL, Yang, Q, Morgenthaler, D, Kong, L, Sebagisha, J, Melendez, L, et al. Autonomic modulation, spontaneous baroreflex sensitivity and fatigue in young men after COVID-19. Physiol Res. (2023) 72:329–36. doi: 10.33549/physiolres.935051
35. Kaliyaperumal, D, RK, K, Alagesan, M, and Ramalingam, S. Characterization of cardiac autonomic function in COVID-19 using heart rate variability: a hospital based preliminary observational study. J Basic Clin Physiol Pharmacol. (2021) 32:247–53. doi: 10.1515/jbcpp-2020-0378
36. Salem, AM, Yar, T, al Eid, M, Almahfoudh, H, Alsaffar, M, al Ibrahim, A, et al. Post-acute effect of SARS-CoV-2 infection on the cardiac autonomic function. Int J Gen Med. (2022) 15:7593–603. doi: 10.2147/IJGM.S382331
37. Skow, RJ, Garza, NA, Nandadeva, D, Stephens, BY, Wright, AN, Grotle, AK, et al. Impact of COVID-19 on cardiac autonomic function in healthy young adults: potential role of symptomatology and time since diagnosis. Am J Physiol Heart Circ Physiol. (2022) 323:H1206–11. doi: 10.1152/ajpheart.00520.2022
38. Stute, NL, Szeghy, RE, Stickford, JL, Province, VP, Augenreich, MA, Ratchford, SM, et al. Longitudinal observations of sympathetic neural activity and hemodynamics during 6 months recovery from SARS-CoV-2 infection. Physiol Rep. (2022) 10:e15423. doi: 10.14814/phy2.15423
39. Pagani, M, Lombardi, F, Guzzetti, S, Rimoldi, O, Furlan, R, Pizzinelli, P, et al. Power spectral analysis of heart rate and arterial pressure variabilities as a marker of sympatho-vagal interaction in man and conscious dog. Circ Res. (1986) 59:178–93. doi: 10.1161/01.res.59.2.178
40. Malliani, A, Pagani, M, Lombardi, F, and Cerutti, S. Cardiovascular neural regulation explored in the frequency domain. Circulation. (1991) 84:482–1492. doi: 10.1161/01.cir.84.2.482
41. Sucharita, S, Bantwal, G, Idiculla, J, Ayyar, V, and Vaz, M. Autonomic nervous system function in type 2 diabetes using conventional clinical autonomic tests, heart rate and blood pressure variability measures. Indian J Endocrinol Metab. (2011) 15:198–203. doi: 10.4103/2230-8210.83406
42. Nagai, M, Fujiwara, T, and Kario, K. Day-to-day blood pressure variability and severity of COVID-19: is sympathetic overdrive a potential link? J Clin Hypertens. (2021) 23:1681–3. doi: 10.1111/jch.14337
43. He, C, Liu, C, Yang, J, Tan, H, Ding, X, Gao, X, et al. Prognostic significance of day‐by‐day in‐hospital blood pressure variability in COVID‐19 patients with hypertension. J Clin Hypertens. (2022) 24:224–33. doi: 10.1111/jch.14437
44. Montano, N, Ruscone, TG, Porta, A, Lombardi, F, Pagani, M, and Malliani, A. Power spectrum analysis of heart rate variability to assess the changes in sympathovagal balance during graded orthostatic tilt. Circulation. (1994) 90:1826–31. doi: 10.1161/01.cir.90.4.1826
45. Huikuri, HV. Heart rate dynamics as a marker of vulnerability to atrial fibrillation. J Cardiovasc Electrophysiol. (2008) 19:913–4. doi: 10.1111/j.1540-8167.2008.01197.x
46. Silva, LE, Lataro, RM, Castania, JA, da Silva, CAA, Valencia, JF, Murta, LO Jr, et al. Multiscale entropy analysis of heart rate variability in heart failure, hypertensive, and sinoaortic denervated rats: classical and refined approaches. Am J Physiol Regul Integr Comp Physiol. (2016) 311:R150–6. doi: 10.1152/ajpregu.00076.2016
47. Silva, LEV, Geraldini, VR, de Oliveira, BP, Silva, CAA, Porta, A, and Fazan, R. Comparison between spectral analysis and symbolic dynamics for heart rate variability analysis in the rat. Sci Rep. (2017) 7:8428. doi: 10.1038/s41598-017-08888-w
Keywords: heart rate variability, blood pressure variability, COVID-19, post-COVID-19 syndrome, head-up tilt test
Citation: da Silva FS, Bonifácio LP, Bellissimo-Rodrigues F, Joaquim LF, Martins Dias DP, Dias Romano MM, Schmidt A, Crescêncio JC, Buzinari TC, Fazan R Jr and Salgado HC (2023) Investigating autonomic nervous system dysfunction among patients with post-COVID condition and prolonged cardiovascular symptoms. Front. Med. 10:1216452. doi: 10.3389/fmed.2023.1216452
Edited by:
César Fernández-de-las-Peñas, Rey Juan Carlos University, SpainReviewed by:
Federico Aletti, Universidade Federal de São Paulo, BrazilAlberto Porta, University of Milan, Italy
J. Derek Kingsley, Kent State University, United States
André L. Teixeira, University of Guelph, Canada
Copyright © 2023 da Silva, Bonifácio, Bellissimo-Rodrigues, Joaquim, Martins Dias, Dias Romano, Schmidt, Crescêncio, Buzinari, Fazan and Salgado. This is an open-access article distributed under the terms of the Creative Commons Attribution License (CC BY). The use, distribution or reproduction in other forums is permitted, provided the original author(s) and the copyright owner(s) are credited and that the original publication in this journal is cited, in accordance with accepted academic practice. No use, distribution or reproduction is permitted which does not comply with these terms.
*Correspondence: Helio Cesar Salgado, aGNzYWxnYWRvQGZtcnAudXNwLmJy