 Michael Mallin
 Jane Hall
 Maria Herlihy1
 Eduard J. Gelman
 Michael B. Stone
- 1Wild Health, Inc., Lexington, KY, United States
- 2Jane Hall Biomed, LLC., Seattle, WA, United States
Precision lifestyle medicine is a relatively new field in primary care, based on the hypothesis that genetic predispositions influence an individual’s response to specific interventions such as diet, exercise, and prescription medications. Despite the increase in commercially available genomic testing, few studies have investigated effects of a physician-directed program to optimize chronic disease using genomics-based precision medicine. We performed an pilot, observational cohort study to evaluate effects of the Wild Health program, a physician and health coach service offering genomics-based lifestyle and medical interventions, on biomarkers indicative of chronic disease. 871 patients underwent genomic testing, biomarker testing, and ongoing health coaching after initial medical consultation by a physician. Improvements in several clinically relevant out-of-range biomarkers at baseline were identified in a large proportion of patients treated through lifestyle intervention without the use of prescription medication. Notably, normalization of several biomarkers associated with chronic disease occurred in 47.5% (hemoglobin A1c [HbA1c]), 33.3% (low density lipoprotein particle number [LDL-P]), and 33.2% (C-reactive protein [CRP]). However, due to the inherent limitations of our observational study design and use of retrospective data, ongoing work will be crucial for continuing to shed light on the effectiveness of physician-led, genomics-based lifestyle coaching programs. Future studies would benefit from implementing a randomized controlled study design, tracking specific interventions, and evaluating physiological data, such as BMI.
1. Introduction
Every individual has different and unique risk factors for the development of chronic diseases such as cardiovascular disease, insulin resistance, and inflammation. This risk is determined by a complex interplay between both modifiable and nonmodifiable factors such as genomics, epigenetics, and lifestyle factors. Although there is significant scientific interest in utilizing these factors in understanding disease processes, to date, few opportunities exist for consumers to engage with healthcare in this method of risk modulation. While the American College of Medical Genetics states “the application of exome and genome sequencing screening tests for apparently healthy individuals is in its infancy,” it also highlights that “the public’s interest in obtaining their own genomic information is likely to increase along with demands on health-care providers to assist patients in accessing testing, interpreting results, and using results in medical care (1).” While there has been considerable interest in expanding health-care provider assistance to the public (2, 3), currently, most consumers engage with direct-to-consumer programs and products which offer genetic and laboratory testing in the absence of a doctor-patient relationship. These user-directed methods fail to provide the benefit of clinically relevant interpretations and subsequent recommendations.
Since the mapping of the human genome in 2008, precision medicine research has skyrocketed with an extraordinary number of new genome wide association studies. Although this has led to ample “clickbait” news articles, very little research has been focused on clinical healthcare delivery. Despite this, there is evidence that genetic predispositions do have a significant effect on clinical response to lifestyle interventions in the general populations (1–3) and, furthermore, that lifestyle interventions can modify risk of disease (4–6). At the heart of this knowledge is the hypothesis that since humans respond differently to specific interventions based on their genetic predispositions, prior knowledge of those predispositions may improve behavior change and thus the success of the interventions. Although this has been preliminarily studied in lifestyle coaching, few studies have evaluated the effect of a lifestyle program implemented by both physicians and health coaches using a multi-omic approach consisting of genomics, epigenetics, laboratory, lifestyle, and microbiome analysis (7).
The Wild Health program encompasses genomic testing, biomarker analysis, physician consultation and health coaching, with a focus on lifestyle intervention to prevent and/or treat common chronic diseases such as pre-diabetes, diabetes, and hyperlipidemia. Physician recommendations for specific lifestyle interventions were discussed with patients, who subsequently received health coaching support through motivational interviewing and structured behavior change. Patients received lIfestyle and behavioral recommendations based on their genetic and laboratory data, as well as their specific goals and pre-existing conditions. Recommendations were comprehensive and covered key pillars of health including nutrition, training, sleep optimization, stress reduction, and supplement use as needed for vitamin or micronutrient deficiencies.
The purpose of this study was to pilot the analytic arm of the Wild Health program, explore trends in patient health during the program, and identify areas of focus for future study (i.e., promising targets for intervention in a more data-rich and controlled study environment). Specifically, we retrospectively examined laboratory biomarkers for patients enrolled with Wild Health over a 2-year time frame resulting in 871 participants with repeat laboratory testing. Our primary goal was to investigate whether participation in the Wild Health program could be associated with improvement of key biomarkers indicative of chronic illness, by comparing pre-intervention values (baseline values at enrollment) vs. post-intervention values (follow-up measurements taken at least 30 days after enrollment). Our secondary goal was to describe pre-intervention and post-intervention values across all biomarkers for which data was available in this cohort.
2. Methods
2.1. Study setting
Wild Health is a precision lifestyle medicine program that encompasses genomic testing, biomarker analysis, and health coaching for patients across the U.S. provided by a multidisciplinary team of clinicians and health coaches. Patients enter the program most commonly through self-referral and receive follow-up for at least 12 months. Although the number of follow up visits with clinicians and health coaches is variable and based on clinical necessity and patient availability, all patients have an initial consultation including genomic testing, laboratory baseline analysis, and background data collection. All patients included in this study also had at least one additional visit with repeat laboratory testing.
The patient journey is such that after sign-up the patient completes an at-home genetics test and obtains baseline labs at a local blood draw site. The precision medicine and health coaching is then delivered via a series of telemedicine consultations with clinicians and health coaches. Patients start with a 30-min initial coaching consultation to identify current lifestyle patterns and health and wellness goals. Subsequently, a 60-min medical consultation is conducted, including providers and health coaches trained in precision medicine. Wild Health Clarity is a data aggregation tool designed to help physicians interpret large datasets with multiple inputs. The tool uses a combination of single gene and polygenetic analysis combined with patient history and lifestyle as well as laboratory findings to highlight possible disease risk as well as identify more precise lifestyle interventions. This data aggregation allows the care team to interpret complex datasets with efficiency and consistency, consider a larger volume of available evidence regarding patients’ health, and to better inform decision making in cooperation with their patients.
To better demonstrate the design, consider the example of cardiovascular disease risk: Clarity would simultaneously aggregate and display for the clinician the patient’s personal and family history of cardiovascular disease, relevant risk factors, laboratory analysis of lipids, insulin resistance, inflammation, calculated MESA score, genetic cardiovascular risk as assigned by Mega, et al., as well as a genomic-based predisposition to response to a dietary intervention (8–12). The clinician could then use this data to help direct care as they deemed necessary. Similar processes are undertaken for lifestyle pillars including nutrition, exercise, and sleep, and chronic diseases and including dementia, insulin resistance, and inflammation.
Recommended interventions are primarily focused on lifestyle changes including dietary, exercise, sleep, and neurobehavioral interventions. Supplements are recommended when medically appropriate, and prescriptions are rarely used in the event that lifestyle change is deemed unsuccessful or medically necessary. After the initial medical consultation, coaching is provided via telemedicine as needed, with follow up laboratory testing and medical visits with clinicians as clinically necessary.
2.2. Study design
The study was a pilot, retrospective observational cohort study of adult patients, aged 18 years and above, who agreed to participate in research and enrolled in the team-based precision medicine program, with index (baseline) visits to Wild Health clinicians between July 2019 and September 2021 for plasma biomarker testing as part of initial health screening. To be included in the study, participants had to have at least one follow-up visit for plasma biomarker collection between 1 and 12 months post-baseline. The study was reviewed and approved by the Institutional Review Board of the Institute of Regenerative and Cellular Medicine. Written informed consent for participation was not required for this study in accordance with the national legislation and the institutional requirements.
2.3. Genomic and laboratory testing
After study enrollment, participants were sent a home genomic collection kit which was performed at LabCorp using a specifically designed Illumina SNP chip. The SNP chip used in this study was designed in house on a standard GSA array adding approximately 6,000 additional SNPs to meet requirements supporting multiple validated polygenomic scores along with clinically relevant individual SNPs. Polygenic risk scores were taken from the available clinical literature and include cardiovascular, dementia, exercise, and nutrition, among others (13–17). Individual SNPs were chosen based on literature review and had to meet internal requirements for clinical quality including: (1) the SNP has had consistent and significant odds ratio or positive likelihood ratio with a specific disease process, and (2) has been proven in multiple studies of adequate power and applicability to the patient population.
In addition to the initial laboratory screening panel, epigenetic testing and microbiome testing were performed on an as-needed or desired basis. Initial testing results were entered into a proprietary software program, Wild Health Clarity™ which functions as a data aggregation tool and analyzes genomic, laboratory, lifestyle, biometric, and microbiome data. Biomarker ranges were evaluated via expert review (MD authors) for face validity. No outliers were removed from analysis.
2.4. Data analysis
Unadjusted biomarker concentrations at baseline and follow-up were summarized using median and quartile values, along with frequencies and percentages of laboratory values out of range among the cohort. Where multiple repeat measurements were available, one follow-up laboratory value was randomly selected per patient to prevent overcounting patients with more frequent follow up. No tests of hypotheses regarding pre-/post-biomarker measurements were performed at this stage due to lack of a priori assumptions and in order to prevent mis-interpretation (Type 1 error) from excessive multiple hypothesis testing. Comparison testing for number of follow up tests in patients in the top quintile of responders to the Wild Health program vs. patients in the bottom quintile was performed via Student’s t-test.
For key biomarkers related to chronic illness, all laboratory values, including repeat measurements, were analyzed via covariate-adjusted mixed effects regression modeling, using a pre/post design. The outcome was defined as continuous biomarker at follow up. Model covariates were defined as age, sex, and days since baseline measurement, and pre-intervention (baseline measurement) vs. post-intervention (at least 30 days after baseline measurement). Post-estimation marginal analyses were performed to provide a sample of model-predicted baseline and follow-up laboratory values for illustrative purposes. All analyses were performed in Stata IC 15.1 (College Station, TX).
3. Results
3.1. Study cohort
During the enrollment period, 2,230 consecutive participants received plasma biomarker testing through Wild Health. Of these, 871 participants had at least one instance of follow-up testing between 1 to 12 months after their baseline test and were included in the study. Repeat testing was performed at the physicians’ discretion and based on medical and clinical utility. The resulting cohort was 49.7% female with a mean age of 48 years (Table 1). Out-of-range [OOR] baseline testing of biomarkers associated with chronic disease demonstrated hyperlipidemia (low density lipoprotein [LDL-C] > 100 mg/dL) in 78.1% of patients tested, diabetes (hemoglobin A1c [HbA1c] ≥ 6.5%) in 30.9% of patients tested, and pre-diabetes (HbA1c 5.7–6.4%) in 9.4% of patients tested. Baseline and follow-up testing generally captured a subset of the 47 available biomarkers with a median of 19 biomarkers (IQR = 5,29). The five most commonly tested biomarkers were Total Cholesterol, LDL-C, HDL-C, Triglycerides, and Protein, and were captured in over 60% of participants (Table 2). At baseline measurement, 826 (94.8%) patients had at least one biomarker out of range (OOR). The median number of OOR biomarkers at baseline was 12 (IQR = 7, 25; Supplementary Figure). The five biomarkers most commonly reported as OOR at baseline were Apolipoprotein B, Homocysteine, Neutrophils, Creatinine, and LDL size.
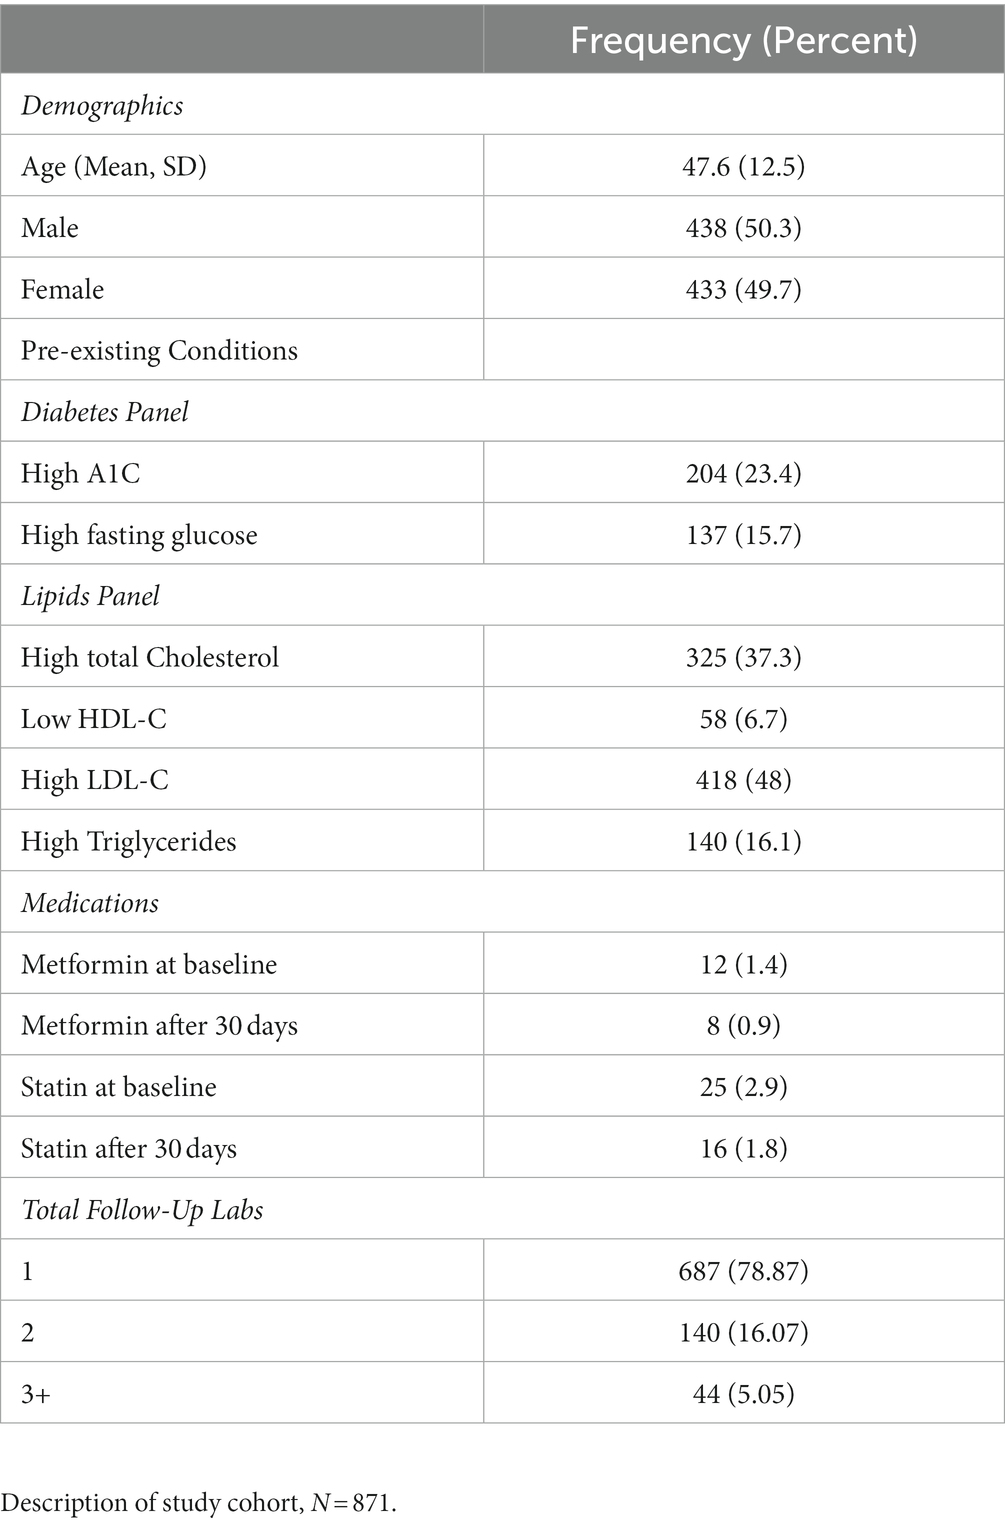
Table 1. Cohort description.
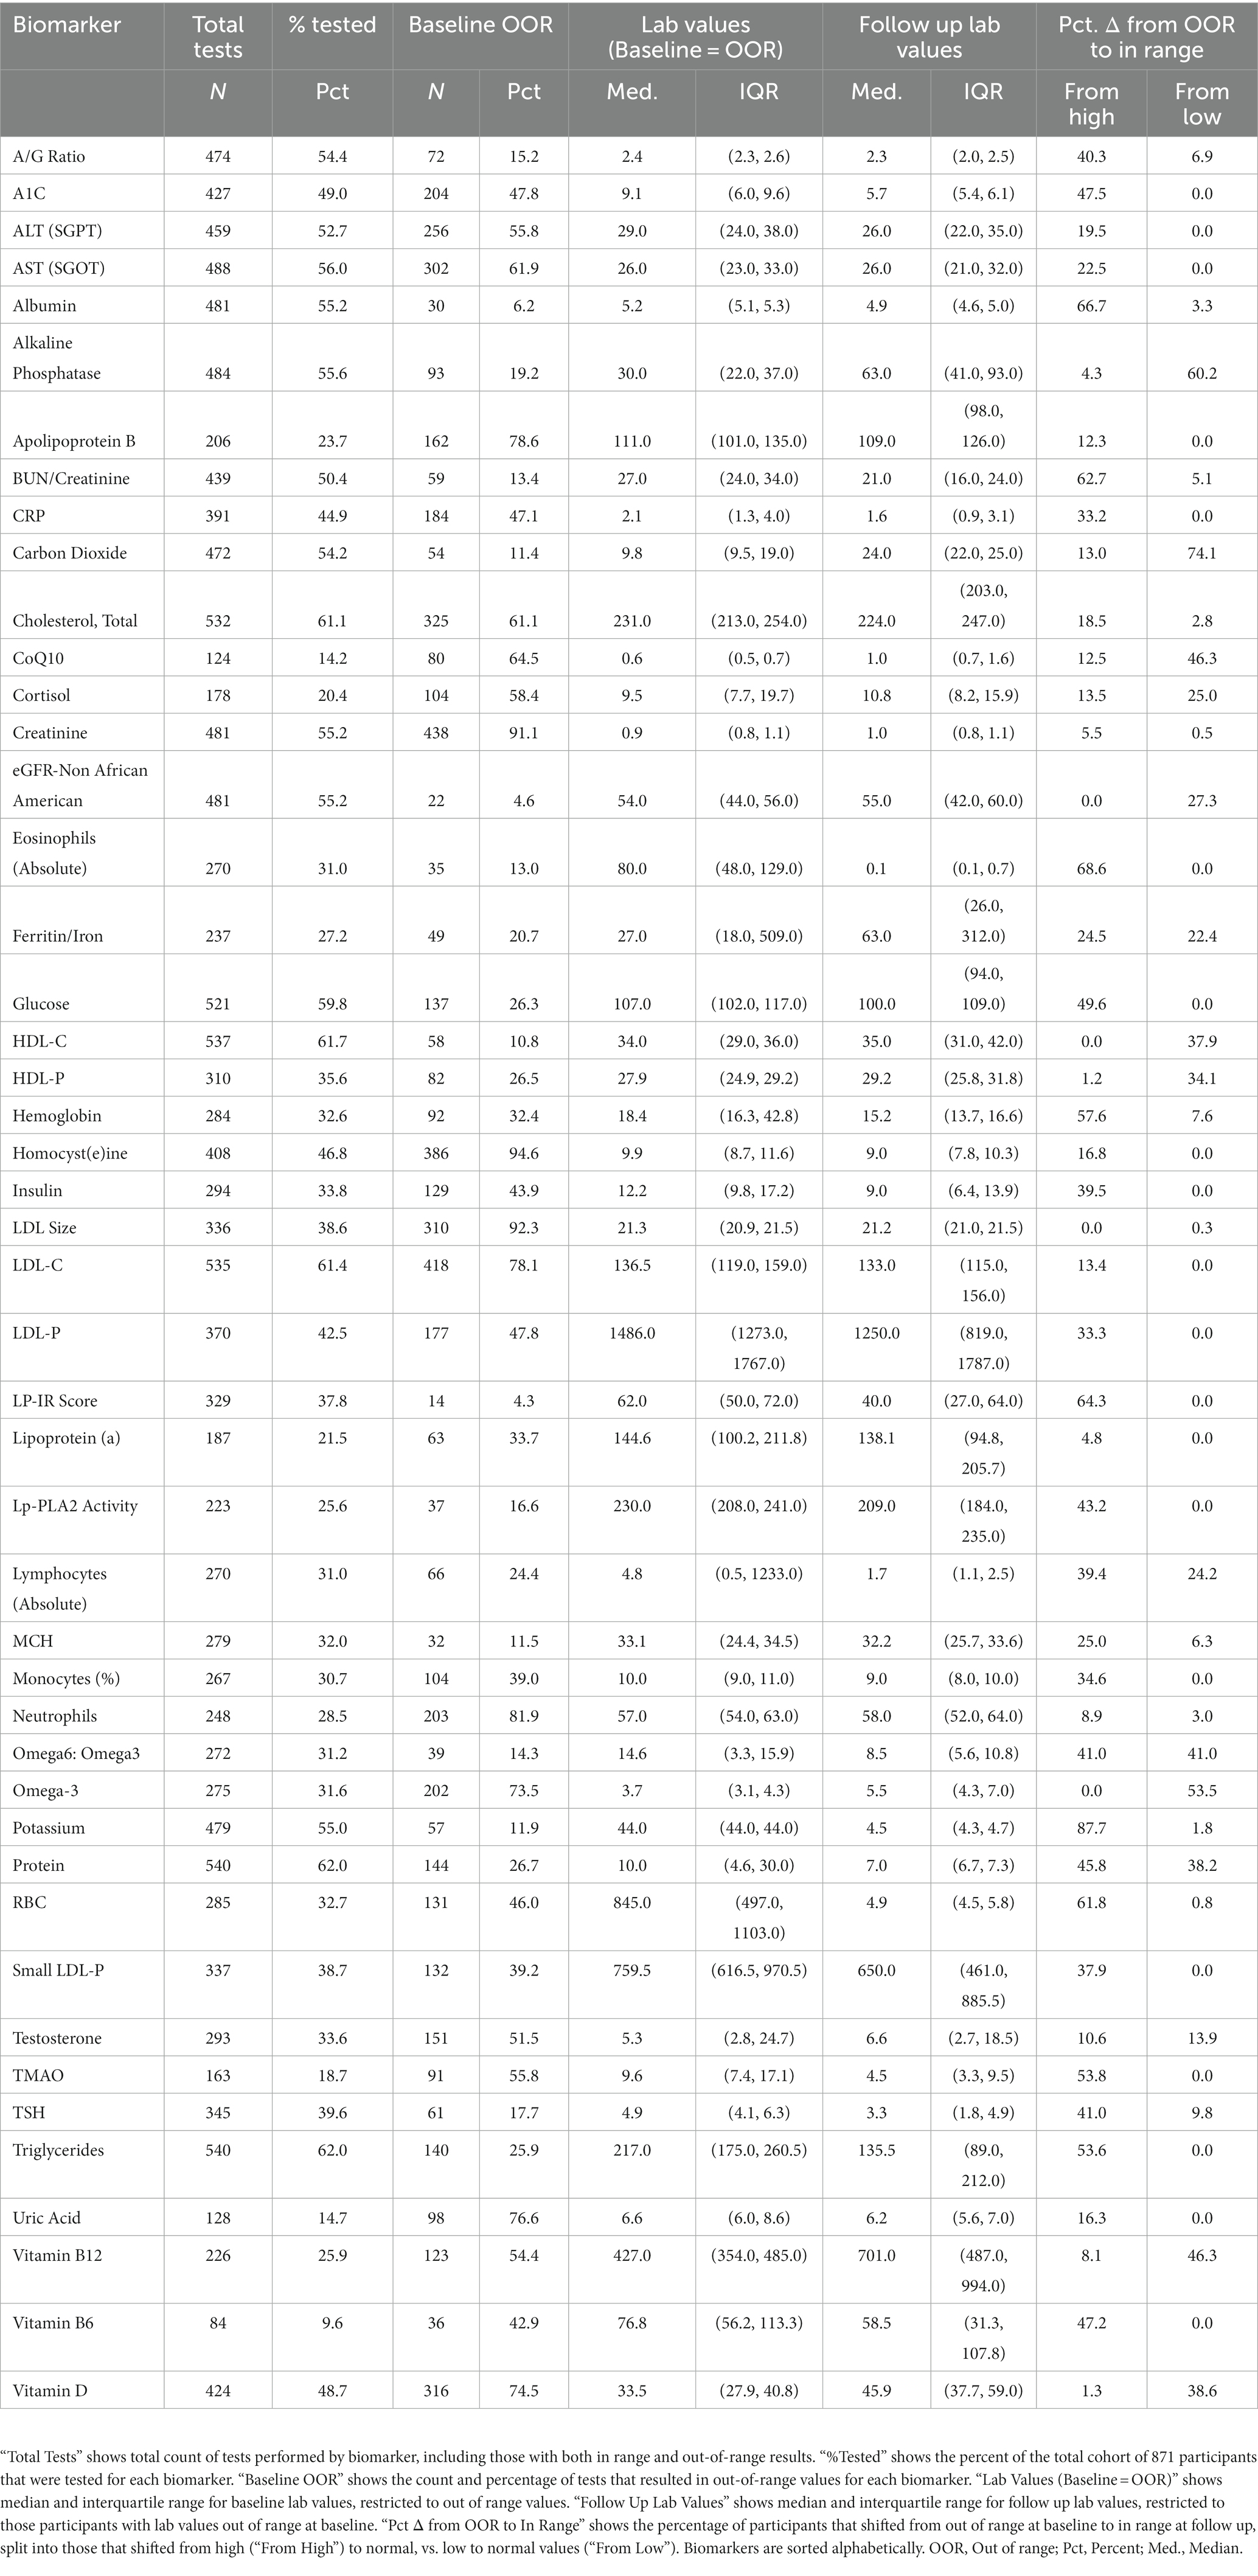
Table 2. Change in out-of-range biomarkers at follow-up.
3.2. A majority of biomarkers out-of-range at baseline demonstrated improvement at follow-up timepoint
To explore changes in biomarkers over time, we focused on the subset of participants and labs that were abnormal at baseline and examined the proportion that shifted to in range. For 34 of the biomarkers tested, 30% or more of participant labs shifted to normal range at a randomly selected follow-up timepoint. For 18 biomarkers, 50% or more participant labs shifted to normal range (Table 2).
3.3. Key biomarkers of chronic disease demonstrated improvement at follow-up timepoint
A large percentage of patients demonstrated normalization of key biomarkers associated with metabolic disease at a randomly selected follow-up timepoint, including Hemoglobin A1c (47.5%), fasting glucose (49.6%), LP-IR (64.3%), and fasting insulin (39.5%). Similarly, patients demonstrated normalization of key biomarkers associated with cardiovascular disease including LDL-P (33.3%), LDL-C (13.4%), HDL-C (37.9%), CRP (33.2%), Apo-B (12.3%), Triglycerides (53.6%), and LP-PLA2 (43.2%). We examined medication as a factor and found that improvement at follow-up was not due to metformin or diabetic medication use (in the case of metabolic biomarkers) nor due to statin or other lipoprotein modulating medication use (in the case of cardiovascular biomarkers), with only one patient (or in many cases none of the patients) receiving a new prescription during the treatment period, per biomarker, as noted in Table 1.
3.4. Several key biomarkers demonstrated consistent improvement throughout the study period via time- and covariate-adjusted analyses
To continue investigating the biomarkers that were associated with normalization at a single, randomly selected follow-up timepoint in the previous analyses, more in depth analyses were applied. In these analyses, all follow-up laboratory measurements were included in analyses, and time- and demographics-based adjustments were applied, testing for statistically significant differences between pre-intervention (baseline) and post-intervention (at least 30 days post baseline) laboratory values. Based on these models, A1C, insulin, LDL-C, LDL-P, LPIR, and trigylceride levels exhibited significant decreases associated with the intervention. HDL-C exhibited significant increases associated with the intervention (Table 3). For illustrative purposes, we also display the results of post-estimation marginal analysis, which estimates biomarkers values pre- and post-intervention (under the condition that all other covariates are held at their means). This type of model output often allows more intuitive comparisons on the scale of biomarker concentrations, over model coefficients alone.
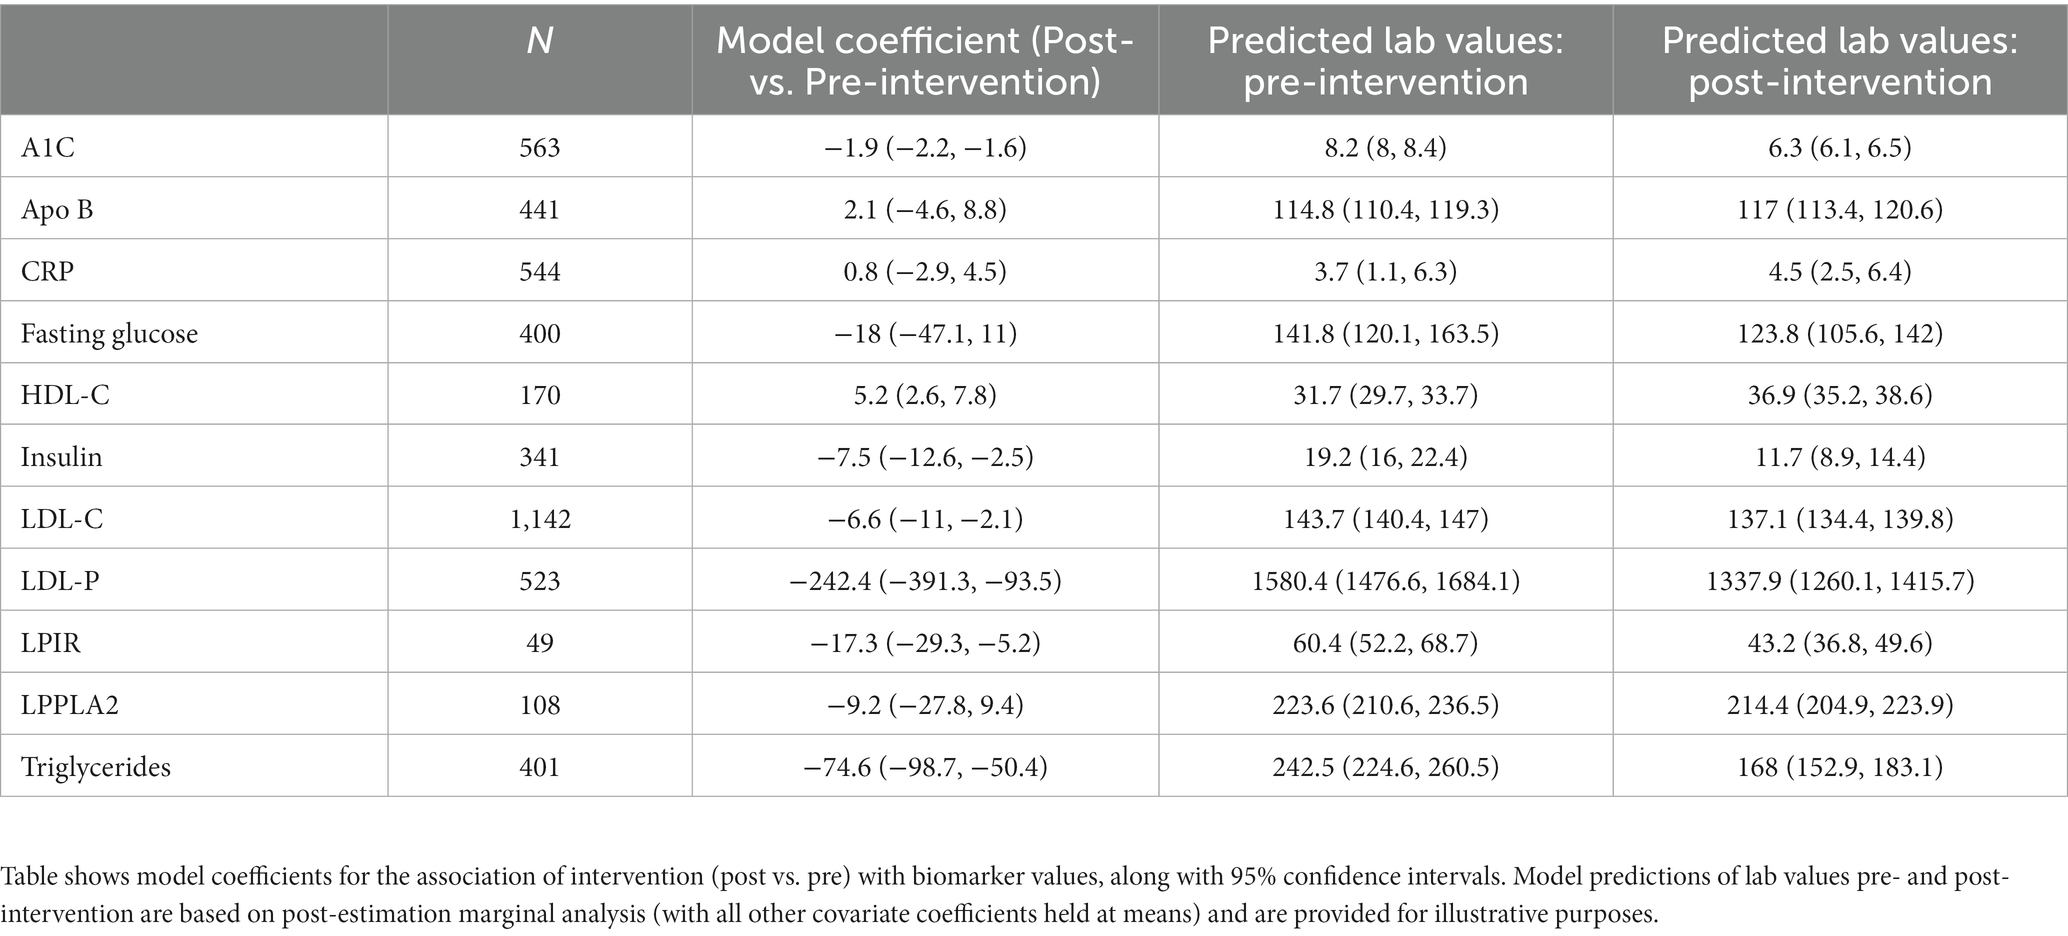
Table 3. Model results from comparison of pre-intervention and post-intervention biomarker levels.
3.5. Spectrum of response in key biomarkers
The highest quintile (top 20%) of responders to the Wild Health program had large reductions from their baseline biomarker measurements. For biomarkers associated with metabolic disease, median Hemoglobin A1c in this group fell by 45.0%, fasting insulin by 72%, glucose by 28%, and LP-IR by 59%, on average. For biomarkers associated with cardiovascular disease, CRP fell by 78%, LDL-P by 76%, Triglycerides by 70%, and HDL-C rose by 44% (Table 4). In contrast, the lowest quintile (bottom 20%) of responders generally had increases from their baseline biomarker measurements (and decrease in HDL-C; Table 4). Patients in the top quintile did not have a significantly different number of follow up tests (Mean = 1.4; 95% CI = 1.3–1.4) than those in the bottom quintile of responders (Mean = 1.3; 95% CI = 1.3–1.4).
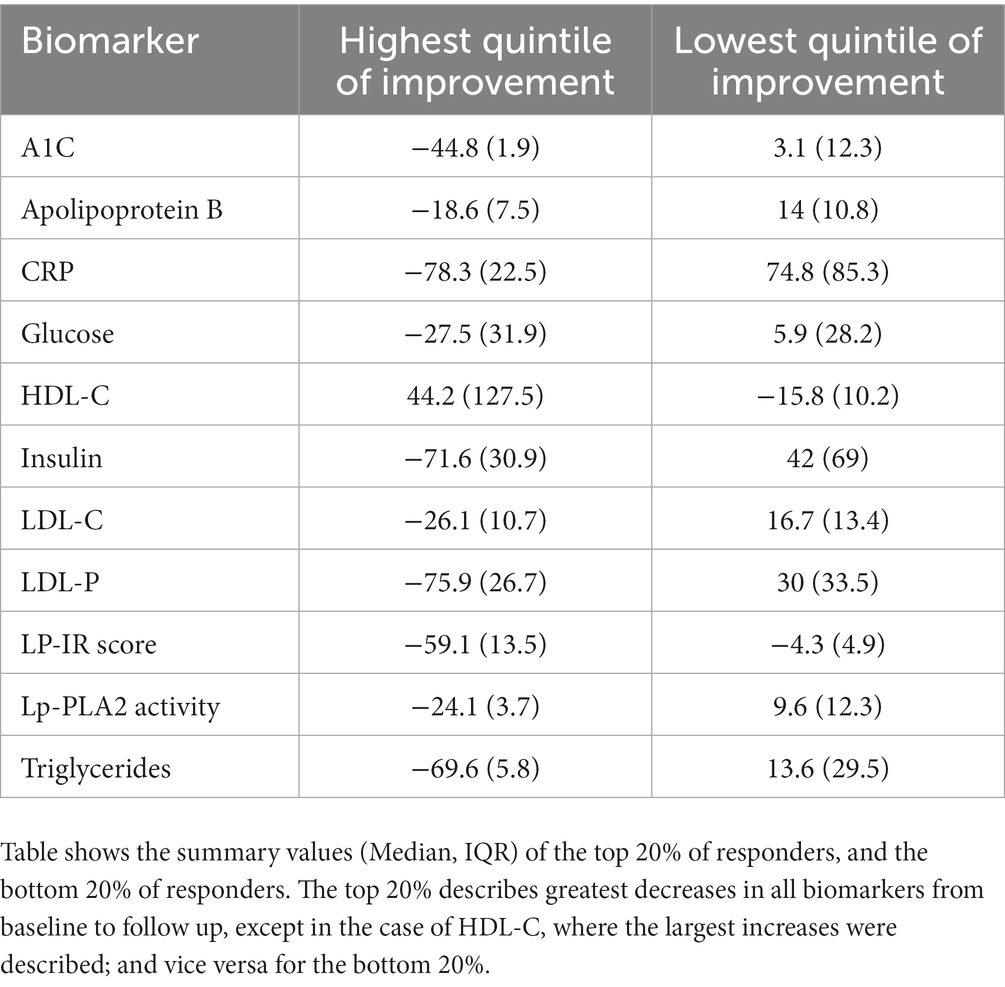
Table 4. Percent biomarker improvement in highest and lowest quintile of responders.
4. Discussion
We present an analysis of the Wild Health clinical platform consisting of longitudinal biomarker data among participants in the Wild Health program who were exposed to a lifestyle-focused approach encompassing optimization of nutrition, exercise, sleep, stress reduction and supplementation.
While prior research (18–20) has indicated a trend towards normalization of out-of-range biomarkers in patients participating in automated personalized nutrition and lifestyle platforms, to our knowledge, this is the first study evaluating a precision medicine care model (incorporating a physician and health coach team), and demonstrates a trend towards normalization of out-of-range biomarkers indicative of chronic disease.
The effect of the Wild Health program on HbA1c is particularly notable, with substantial improvements as compared to traditional pharmacologic intervention, as well as coaching interventions in the absence of a physician/coach care team (21, 22). Mean HbA1c levels decreased by 1.9% from baseline, as compared to established mean reduction in HbA1c of 1.1% with metformin use (23). Furthermore, 23.0% of patients with initial HbA1c ≥ 6.5% normalized their HbA1c on subsequent testing, effectively inducing remission of diabetes. This is compared to a 3.3% remission rate in those patients receiving standard primary care in the National Diabetes Audit (24).
Significant improvements were noted in patients lipids at follow up, including resolution of elevated LDL-P in 33.3% and resolution of LDL-C in 13.4% of patients. The median reduction in LDL-P was 15.8% and disproportionate to LDL-C reduction of 3.3%. This finding suggests an alteration of LDL particle size and a reduction of small, atherogenic LDL particles consistent with a 19.4% median reduction of small-LDL particles and a 34.7% median reduction in the lipoprotein insulin resistance score from Labcorp (25). Statin therapy has been shown to decrease LDL-P by 30%, suggesting that this precision lifestyle intervention is comparable to statin therapy (26).
Otherwise healthy individuals with elevated C-Reactive Protein (CRP) levels are at up to a 4x higher risk for atherosclerotic cardiovascular disease (27, 28). Lowering of CRP through pharmacologic intervention such as statin therapy is associated with lower incidence of adverse cardiovascular events (29). In our dataset, significant improvements in CRP were noted without the need for statin therapy, including resolution of elevated CRP levels in 33% of patients, suggesting the potential for a marked cardiovascular risk reduction in this patient population. Our results in CRP reduction through lifestyle intervention are similar to the CANTOS trial using 150 mg canakinumab which noted a 17% overall reduction in the risk of MACE (30).
Importantly, the non-randomized observational nature of this study introduced multiple sources of bias that would tend to overestimate the effect size from our study sample if attempting to extrapolate to the general population. “Sufficient data bias” encompasses several biases, and refers to including only patients who have sufficient data for analysis in the study (31). Here, only patients with at least one follow up biomarker measurement were analyzed, which may indicate a more dedicated clinician, a sicker patient, or a more adherent patient, all of which would bias toward positive results; although we did not find that patients in the top quintile of responders had significantly more follow up measurements than those in the bottom quintile. “Healthy user bias” refers to the likelihood that patients that enrolled in the program, or adhered to the program long enough for one follow up biomarker measurement, may have other healthy habits or socioeconomic resources that contributed to their successful normalization of biomarkers associated with chronic disease (32). “Spectrum bias” refers to a focused sampling bias, which precludes the description of intervention effect on the full spectrum of patients with different severity of illness (33). In this study, intentionally focused on patients with out of range biomarkers at baseline for two reasons. Clinically, these are the patients that would be targeted by the Wild Health program for meaningful health interventions. And analytically, this group could be more sensitive to intervention, and allow us to generate hypotheses for follow up in more rigorous future studies. The current study is not meant to show definitive evidence of improvement in biomarkers due to the Wild Health program across all-comers in the population.
We also note that not all patients responded equally to the Wild Health Program. At the time of this study, our ability to delve into the reasons for these differences are limited due to the incomplete nature of our retrospective data source. Specific lifestyle intervention and medical recommendations were not analyzed, and therefore we are unable at this time to identify the level of impact associated with any specific intervention, as opposed to the overall approach provided by the Wild Health program. In addition, adherence to interventions was not tracked.
While this observational study was not designed to evaluate the economic impact of lifestyle-based precision medicine, a discussion of the potential health savings impact is warranted given the costs associated with the treatment of chronic disease. According to the American Diabetes Association, the cost of diabetes in the United States in 2017 was 327 billion dollars with annual direct costs of $9,600 per patient (34). When extrapolated to our patient population in this dataset, of which 30.9% patients met criteria for diabetes on initial labs, the 98 patients with normalization of HbA1c on follow up labs has the potential to save $940,800 dollars annually. Further research is necessary to establish the total cost savings associated with this method of care delivery.
Similarly to diabetes, cardiovascular disease represents a significant cost burden to the American economy with costs estimated as high as 229 billion in 2017 (35). Prior research has found that statin based reduction of LDL cholesterol to normal levels could account for a total annual cost savings of 430 million or $9,900 per patient in 2011 (36). Given that we have shown LDL normalization in 33.3% of patients, comparable as those seen with statins, we would expect an even greater cost savings given the lack of need for statin-based prescription therapy and the associated cost.
Data availability statement
The raw data supporting the conclusions of this article will be made available by the authors, without undue reservation.
Ethics statement
The studies involving humans were approved by Institutional Review Board of the Institute of Regenerative and Cellular Medicine. The studies were conducted in accordance with the local legislation and institutional requirements. The ethics committee/institutional review board waived the requirement of written informed consent for participation from the participants or the participants’ legal guardians/next of kin because the studies used de-identified medical records data with no more than minimal risk to the subjects.
Author contributions
MM and JH conceived the work and wrote the main manuscript text. EG and JH acquired and analyzed the data. JH prepared Tables 1–4. All authors reviewed the manuscript.
Conflict of interest
MM, EG, MS, and MH are employees of Wild Health, Inc. JH was contracted by Wild Health, Inc., to assist with data analysis and reporting for this study. JH is a consultant at Jane Hall Biomed, LLC.
Publisher’s note
All claims expressed in this article are solely those of the authors and do not necessarily represent those of their affiliated organizations, or those of the publisher, the editors and the reviewers. Any product that may be evaluated in this article, or claim that may be made by its manufacturer, is not guaranteed or endorsed by the publisher.
Supplementary material
The Supplementary material for this article can be found online at: https://www.frontiersin.org/articles/10.3389/fmed.2023.1239737/full#supplementary-material
References
1. Bean, L, Scheuner, MT, Murray, MF, Biesecker, LG, Green, RC, Monaghan, KG, et al. DNA-based screening and personal health: a points to consider statement for individuals and health-care providers from the American College of Medical Genetics and Genomics (ACMG). Genet Med. (2021) 23:979–88. doi: 10.1038/s41436-020-01083-9
2. Ginsberg, G, and Willard, H. Genomic and personalized medicine: foundations and applications. Transl Res. (2009) 154:277–87. doi: 10.1016/j.trsl.2009.09.005
3. Karczewski, K, and Snyder, M. Integrative omics for health and disease. Nat Rev Genet. (2018) 19:299–310. doi: 10.1038/nrg.2018.4
4. San-Cristobal, R, Navas-Carretero, S, Livingstone, K, Celis-Morales, C, Macready, A, Fallaize, R, et al. Mediterranean Diet adherence and genetic background roles within a web-based nutritional intervention. The Food4Me study. Nutrients. (2017) 9:1107. doi: 10.3390/nu9101107
5. Walker, CG, Holzapfel, C, Loos, RJF, Mander, AP, Klopp, N, Illig, T, et al. Genetic predisposition to an adverse lipid profile limits the improvement in total cholesterol in response to weight loss. Obesity. (2013) 21:2589–95. doi: 10.1002/oby.20328
6. Qi, Q, Kilpeläinen, TO, Downer, MK, Tanaka, T, Smith, CE, Sluijs, I, et al. FTO genetic variants, dietary intake and body mass index: insights from 177,330 individuals. Hum Mol Genet. (2014) 23:6961–72. doi: 10.1093/hmg/ddu411
7. Cecil, JE, Tavendale, R, Watt, P, Hetherington, MM, and Palmer, CN. An obesity-associated FTO gene variant and increased energy intake in children. N Engl J Med. (2008) 359:2558–66. doi: 10.1056/NEJMoa0803839
8. Khera, AV, Emdin, CA, Drake, I, Natarajan, P, Bick, AG, Cook, NR, et al. Genetic risk, adherence to a healthy lifestyle, and coronary disease. N Engl J Med. (2016) 375:2349–58. doi: 10.1056/NEJMoa1605086
9. Maas, P, Barrdahl, M, Joshi, AD, Auer, PL, Gaudet, MM, Milne, RL, et al. Breast cancer risk from modifiable and nonmodifiable risk factors among white women in the United States. JAMA Oncol. (2016) 2:1295–302. doi: 10.1001/jamaoncol.2016.1025
10. Zubair, N, Conomos, MP, Hood, L, Omenn, GS, Price, ND, Spring, BJ, et al. Genetic predisposition impacts clinical changes in a lifestyle coaching program. Sci Rep. (2019) 9:6805. doi: 10.1038/s41598-019-43058-0
11. McClelland, RL, Jorgensen, NW, Budoff, M, Blaha, MJ, Post, WS, Kronmal, RA, et al. 10-year coronary heart disease risk prediction using coronary artery calcium and traditional risk factors: derivation in the MESA (multi-ethnic study of atherosclerosis) with validation in the HNR (Heinz Nixdorf recall) study and the DHS (Dallas heart study). J Am Coll Cardiol. (2015) 66:1643–53. doi: 10.1016/j.jacc.2015.08.035
12. Mega, J, Stitziel, N, Smith, J, Chasman, DI, Caulfield, MJ, Devlin, JJ, et al. Genetic risk, coronary heart disease events, and the clinical benefit of statin therapy: an analysis of primary and secondary prevention trials. Lancet. (2015) 385:2264–71. doi: 10.1016/S0140-6736(14)61730-X
13. Keathley, J, Garneau, V, Marcil, V, Mutch, DM, Robitaille, J, Rudkowska, I, et al. Nutrigenetics, omega-3 and plasma lipids/lipoproteins/apolipoproteins with evidence evaluation using the GRADE approach: a systematic review. BMJ Open. (2022) 12:e054417. doi: 10.1136/bmjopen-2021-054417
14. Desjardins, L-C, and Vohl, M-C. Precision nutrition for cardiovascular disease prevention. Lifestyle Genomics. (2023) 16:73–82. doi: 10.1159/000529054
15. Carrasquillo, MM, Crook, JE, Pedraza, O, Thomas, CS, Pankratz, VS, Allen, M, et al. Late-onset Alzheimer's risk variants in memory decline, incident mild cognitive impairment, and Alzheimer's disease. Neurobiol Aging. (2015) 36:60–7. doi: 10.1016/j.neurobiolaging.2014.07.042
16. Jones, N, Kiely, J, Suraci, B, Collins, DJ, de Lorenzo, D, Pickering, C, et al. A genetic-based algorithm for personalized resistance training. Biol Sport. (2016) 33:117–26. doi: 10.5604/20831862.1198210
17. Merino, J, Guasch-Ferré, M, Li, J, Chung, W, Hu, Y, Ma, B, et al. Polygenic scores, diet quality, and type 2 diabetes risk: an observational study among 35,759 adults from 3 US cohorts. PLoS Med. (2022) 19:e1003972. doi: 10.1371/journal.pmed.1003972
18. Westerman, K, Reaver, A, Roy, C, Ploch, M, Sharoni, E, Nogal, B, et al. Longitudinal analysis of biomarker data from a personalized nutrition platform in healthy subjects. Sci Rep. (2018) 8:14685. doi: 10.1038/s41598-018-33008-7
19. Price, ND, Magis, AT, Earls, JC, Glusman, G, Levy, R, Lausted, C, et al. A wellness study of 108 individuals using personal, dense, dynamic data clouds. Nat Biotechnol. (2017) 35:747–56. doi: 10.1038/nbt.3870
20. Schüssler-Fiorenza Rose, SM, Contrepois, K, Moneghetti, KJ, Zhou, W, Mishra, T, Mataraso, S, et al. A longitudinal big data approach for precision health. Nat Med. (2019) 25:792–804. doi: 10.1038/s41591-019-0414-6
21. Hirst, JA, Farmer, AJ, Ali, R, Roberts, NW, and Stevens, RJ. Quantifying the effect of metformin treatment and dose on glycemic control. Diabetes Care. (2012) 35:446. doi: 10.2337/dc11-1465
22. Knowler, WC, Barrett-Connor, E, Fowler, SE, Hamman, RF, Lachin, JM, Walker, EA, et al. Reduction in the incidence of type 2 diabetes with lifestyle intervention or metformin. N Engl J Med. (2002) 346:393–403. doi: 10.1056/NEJMoa012512
23. Wayne, N, Perez, DF, Kaplan, DM, and Ritvo, P. Health coaching reduces HbA1c in type 2 diabetic patients from a lower-socioeconomic status community: a randomized controlled trial. J Med Internet Res. (2015) 17:e224. doi: 10.2196/jmir.4871
24. Holman, N. Incidence and characteristics of remission of type 2 diabetes in England: a cohort study using the National Diabetes Audit. Diabetes Care. (2022) 45:1151–61. doi: 10.2337/dc21-2136
25. Shalaurova, I, Connelly, MA, Garvey, WT, and Otvos, JD. Lipoprotein insulin resistance index: a lipoprotein particle-derived measure of insulin resistance. Metab Syndr Rel Disord. (2014) 12:422–9. doi: 10.1089/met.2014.0050
26. Rosenson, RS, and Underberg, JA. Systematic review: evaluating the effect of lipid-lowering therapy on lipoprotein and lipid values. Cardiovasc Drugs Ther. (2013) 27:465–79. doi: 10.1007/s10557-013-6477-6
27. Ridker, PM, Rifai, N, Rose, L, Buring, JE, and Cook, NR. Comparison of C-reactive protein and low-density lipoprotein cholesterol levels in the prediction of first cardiovascular events. N Engl J Med. (2002) 347:1557–65. doi: 10.1056/NEJMoa021993
28. Ridker, PM, Cushman, M, Stampfer, MJ, Tracy, RP, and Hennekens, CH. Inflammation, aspirin, and the risk of cardiovascular disease in apparently healthy men. N Engl J Med. (1997) 336:973–9. doi: 10.1056/NEJM199704033361401
29. Ruscica, M, Ferri, N, Macchi, C, Corsini, A, and Sirtori, CR. Lipid lowering drugs and inflammatory changes: an impact on cardiovascular outcomes? Ann Med. (2018) 50:461–84. doi: 10.1080/07853890.2018.1498118
30. Ridker, PM, Everett, BM, Thuren, T, MacFadyen, JG, Chang, WH, Ballantyne, C, et al. Antiinflammatory therapy with canakinumab for atherosclerotic disease. N Engl J Med. (2017) 377:1119–31. doi: 10.1056/NEJMoa1707914
31. Rusanov, A, Weiskopf, NG, Wang, S, and Weng, C. Hidden in plain sight: bias towards sick patients when sampling patients with sufficient electronic health record data for research. BMC Med Inform Decis Mak. (2014) 14:1–9. doi: 10.1186/1472-6947-14-51
32. Shrank, WH, Patrick, AR, and Alan Brookhart, M. Healthy user and related biases in observational studies of preventive interventions: a primer for physicians. J Gen Int Med. (2011) 26:546–50. doi: 10.1007/s11606-010-1609-1
33. Hall, MK, Kea, B, and Wang, R. Recognising bias in studies of diagnostic tests part 1: patient selection. Emerg Med J. (2019) 36:431–4. doi: 10.1136/emermed-2019-208446
34. American Diabetes Association. Economic costs of diabetes in the U.S. in 2017. Diabetes Care. (2018) 41:917–28. doi: 10.2337/dci18-0007
35. Agency for Healthcare Research and Quality. Total expenses and percent distribution for selected conditions by type of service: united States. Medical Expenditure Panel Survey Household Component Data. (2017). http://meps.ahrq.gov (Accessed September 27, 2022).
Keywords: precision medicine, genomics, health coaching, chronic disease, diabetes, cardiovascular disease, primary care
Citation: Mallin M, Hall J, Herlihy M, Gelman EJ and Stone MB (2023) A pilot retrospective study of a physician-directed and genomics-based model for precision lifestyle medicine. Front. Med. 10:1239737. doi: 10.3389/fmed.2023.1239737
Edited by:
Florence Carrouel, Université Claude Bernard Lyon 1, FranceReviewed by:
Laura Goetz, Net/bio, United StatesJennifer Lovejoy, Institute for Systems Biology (ISB), United States
Copyright © 2023 Mallin, Hall, Herlihy, Gelman and Stone. This is an open-access article distributed under the terms of the Creative Commons Attribution License (CC BY). The use, distribution or reproduction in other forums is permitted, provided the original author(s) and the copyright owner(s) are credited and that the original publication in this journal is cited, in accordance with accepted academic practice. No use, distribution or reproduction is permitted which does not comply with these terms.
*Correspondence: Michael Mallin, bWlrZS5tYWxsaW5Ad2lsZGhlYWx0aC5jb20=