 Bernard X. W. Liew1*
 Ben Darlow2
- 1School of Sport, Rehabilitation and Exercise Sciences, University of Essex, Colchester, United Kingdom
- 2Department of Primary Healthcare and General Practice, University of Otago, Wellington, New Zealand
Objectives: The current study used a network analysis approach to explore the complexity of attitudes and beliefs held in people with and without low back pain (LBP). The study aimed to (1) quantify the adjusted associations between individual items of the Back Pain Attitudes Questionnaire (Back-PAQ), and (2) identify the items with the strongest connectivity within the network.
Methods: This is a secondary data analysis of a previously published survey using the Back-PAQ (n = 602). A nonparametric Spearman’s rank correlation matrix was used as input to the network analysis. We estimated an unregularised graphical Gaussian model (GGM). Edges were added or removed in a stepwise manner until the extended Bayesian information criterion (EBIC) did not improve. We assessed three measures of centrality measures of betweenness, closeness, and strength.
Results: The two pairwise associations with the greatest magnitude of correlation were between Q30–Q31 [0.54 (95% CI 0.44 to 0.60)] and Q15–Q16 [0.52 (95% CI 0.43 to 0.61)]. These two relationships related to the association between items exploring the influence of attentional focus and expectations (Q30–Q31), and feelings and stress (Q15–Q16). The three items with the greatest average centrality values, were Q22, Q25, and Q10. These items reflect beliefs about damaging the back, exercise, and activity avoidance, respectively.
Conclusion: Beliefs about back damage, exercise, and activity avoidance are factors most connected to all other beliefs within the network. These three factors may represent candidate targets that clinicians can focus their counseling efforts on to manage unhelpful attitudes and beliefs in people experiencing LBP.
1 Introduction
Low back pain (LBP) is a highly prevalent and costly musculoskeletal pain disorder, which occurs in all countries and affects individuals across the lifespan (1). In 2019, LBP accounted for over half a billion prevalent cases and over 60 million years lived with disability (YLDs) (1). In 2016, LBP was ranked first in healthcare expenditure of US$134.5 billion in the United States (2). Two-thirds of those with an acute painful episode of LBP recover within the first three months (3), although relapses and remissions are common (4). Approximately 20% of LBP sufferers go on to experience severe, high-impact chronic pain (5), which contributes most to healthcare costs.
The attitudes and beliefs of both patients and clinicians are thought to be important contributors to the development of LBP, its recovery, and how the condition is managed. Harboring negative attitudes and beliefs regarding LBP may elevate catastrophic thoughts and avoidant behaviors (6), which cascade into greater disuse and depression (7), leading to delayed recovery and functional return (8, 9). The beliefs of healthcare practitioners have been reported to explain as much as 20% of the variance in their recommendations to patients suffering from LBP (10). The importance of the relationship between beliefs and clinical management has also been reported across many healthcare professions and in different countries (11). To measure the attitudes and beliefs regarding LBP, the 34-item Back Pain Attitudes Questionnaire (Back-PAQ) was developed (12). Further work on the Back-PAQ resulted in the development of an abbreviated 20-item (13) and also a 10-item version (12).
Regardless of the versions of the Back-PAQ, a summative total score is determined by aggregating the values across all items (12). For example, the original Back-PAQ has a total score ranging from 34 to 170, with higher scores indicating more negative beliefs regarding LBP (12). This aggregate score has been used in clinical trials to determine the effects of different interventions on changes in the patient’s attitudes and beliefs (14). Analyzing only the aggregate score of the Back-PAQ does not fully maximize the use of the information. This is because two individuals can have similar aggregate Back-PAQ scores, but have very different scores on individual items. Determining the most important Back-PAQ items could improve its utility for clinical decision-making.
There are potentially many approaches in seeking to understand the most important facets underlying an individual’s beliefs about LBP. In a previous study of the Back-PAQ in the general population, items relating to posture (Q8), muscle strength (Q7), and lifting technique (Q5) were the most negatively scored (6); it may be that items with the worse score are considered the most important items. Patients and clinicians are commonly thought to hold negative beliefs about the safety of certain lifting postures (15, 16), and the appropriateness of physical activity during an episode of LBP (17). The importance of the beliefs about posture and activity resumption is evidenced by the development of therapeutic interventions seeking to target these specific beliefs (18, 19). Alternatively, facets of an individual’s belief system with strong prognostic value may be deemed as important, including expectations about recovery (20), and self-efficacy (21).
Another approach to determining the importance of items is via network analysis (22). Network analysis focuses on quantifying the multivariate relationships between individual items (23, 24). The importance of any item in network analysis, also termed centrality, is typically defined by the magnitude of association, and the closeness of associations to all other items (22). An item with a very high score may not be central, if it is connected to very few items. In a hypothetical scenario of negative beliefs about posture, a low centrality would mean that this specific belief does not affect the beliefs on other items. From a treatment perspective, targeting a low central item would not be the most efficient approach.
The current study explored the multivariate relationship of the items within the Back-PAQ. The main aims of the study were to (1) describe the network and identify the item pairs with the strongest adjusted associations, and (2) identify a reduced set of items with the strongest connectivity within the network. Given that network analysis is a data-driven approach, and that this is the first study to apply such techniques on the Back-PAQ, there were no priori hypotheses made about what item pairs would be the most correlated, or which items would have the greatest centrality measures.
2 Methods
2.1 Study design
Secondary data analysis using the methodology of network analysis.
2.2 Participants
This study used data from a previously published survey of the New Zealand population that used the Back-PAQ (6). One thousand people who were 18 years and older were randomly selected from the New Zealand Electoral Roll and invited by mail to complete the survey. The survey was completed by 602 participants (female = 331, male = 271). Participant characteristics are described in detail in the original publication (6), but briefly, 76 participants self-reported never having experienced a back pain history, 361 reported a past experience of a back pain history, 164 reported a current experience a back pain history, and one participant did not self-report.
2.3 Questionnaire
The Back-PAQ is a 34-item questionnaire (Table 1), scored on a a five-level ordinal scale [responses coded from “False” = 1 to “True” = 5 (Table 1)]. Eleven items (1, 2, 3, 15, 16, 17, 27, 28, 29, 30, 31) are reversed compared with the normal direction of the survey. Hence, for these 11 items, the answers were re-coded with the normal direction of the survey. The total score range from 34 to 170, with a higher score reflecting more unhelpful beliefs. The Back-PAQ has acceptable internal consistency (α = 0.70) (12), excellent test-retest reliability (ICC = 0.84) (25), and moderate convergent validity relative to the Tampa Scale of Kinesiophobia (r = −0.58) (25) when used by a cohort of healthcare practitioners.
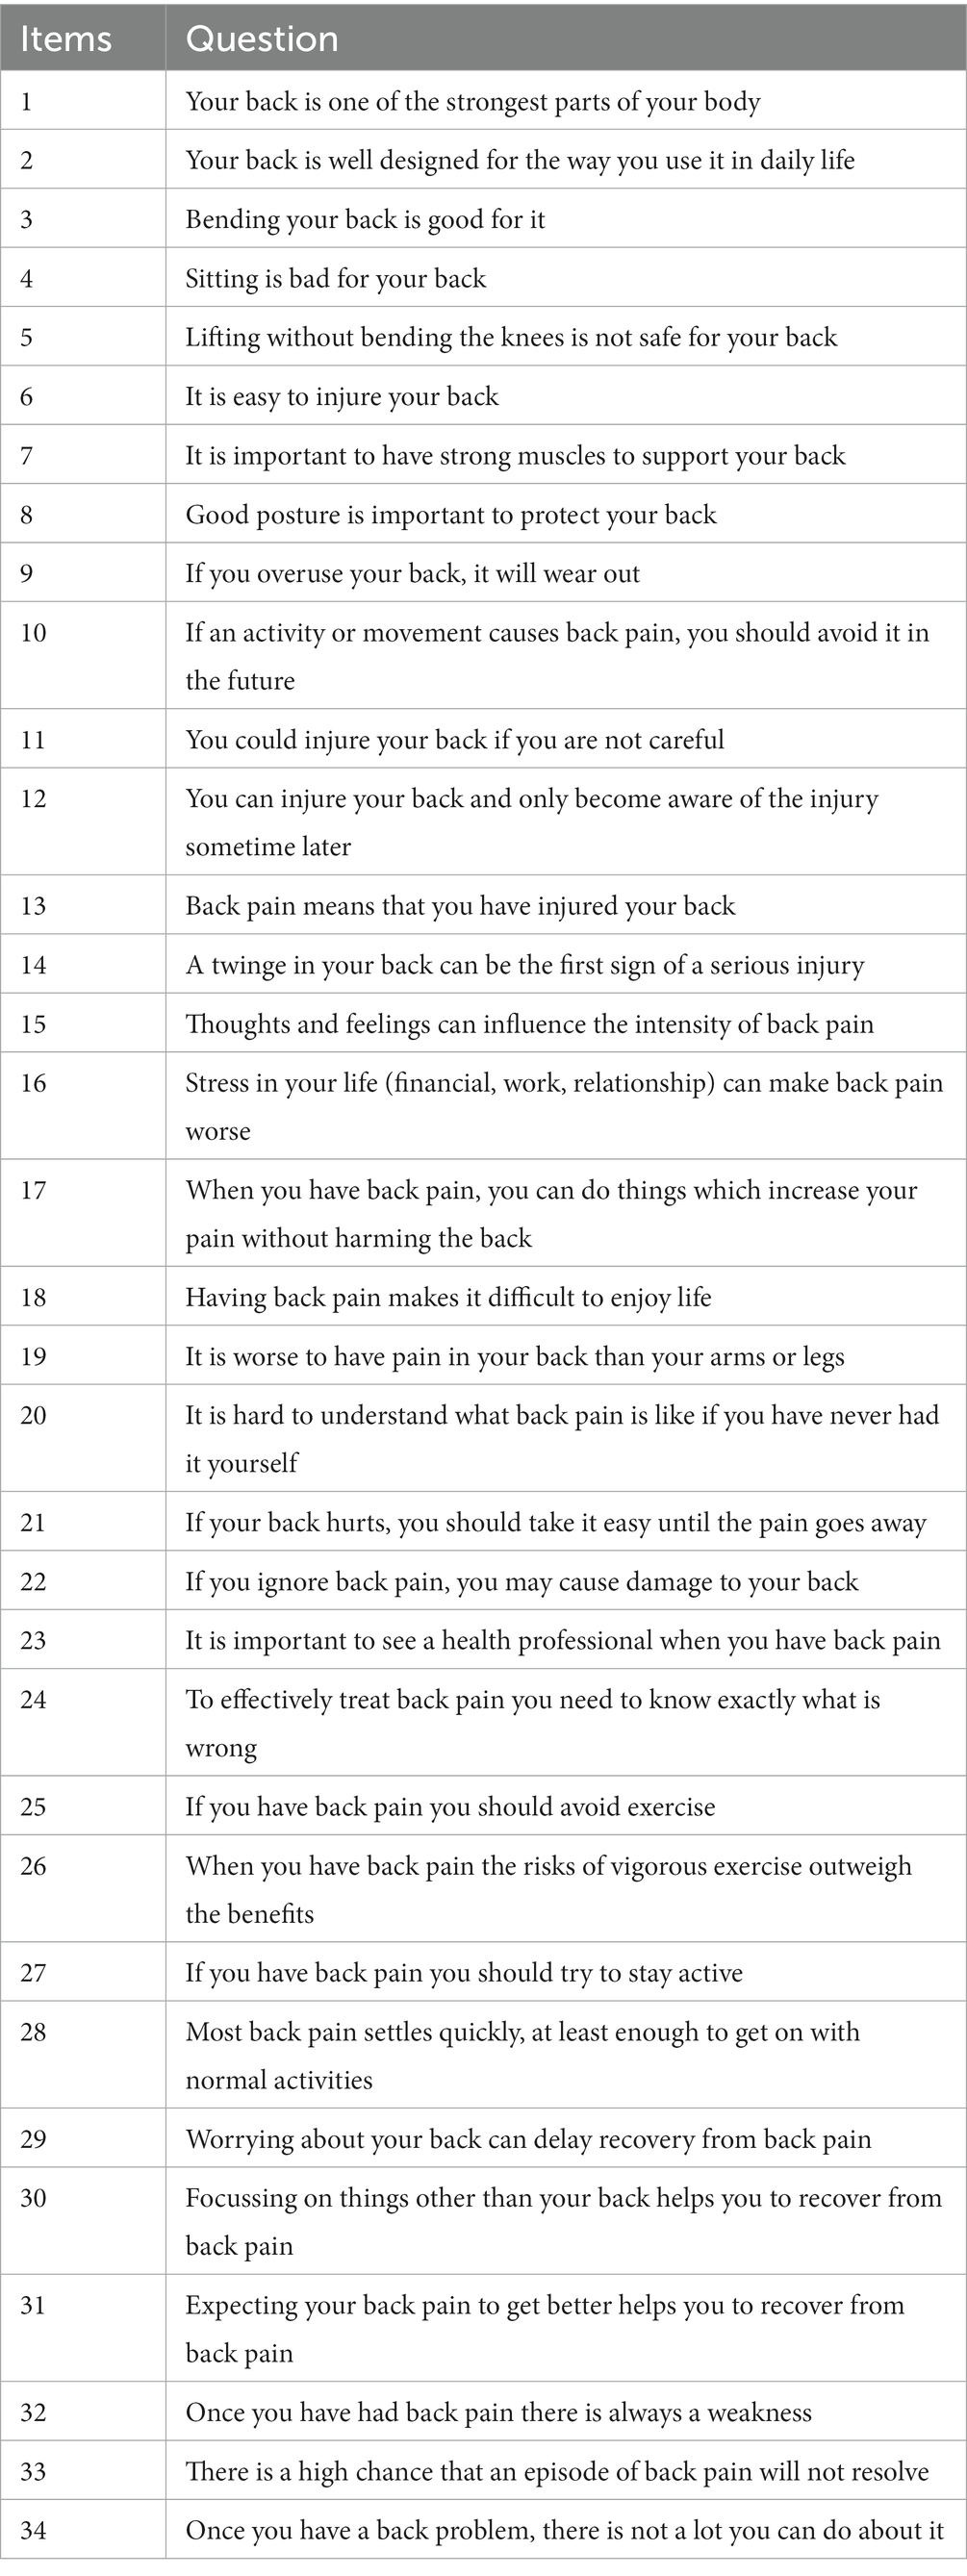
Table 1. Individual items and their questions of the Back-PAQ.
2.4 Approach to network analysis
2.4.1 Software and packages
The dataset was analyzed with R statistical software (version 4.2.2). Several packages were used to perform the analyzes, including qgraph (26) for network estimation and plotting, and bootnet (27) for stability analysis. Since the Back-PAQ items are ordinal, a nonparametric Spearman’s rank correlation matrix was used as input to the network analysis. We estimated an unregularised Graphical Gaussian model (GGM), using the ggmModselect algorithm with the following parameters (28): tuning = 0.25, stepwise = TRUE, consider PerStep = “subet,” and missing = “pairwise.” From a graphical lasso network model, edges were iteratively added and removed until the extended Bayesian information criterion (EBIC) did not improve (28). This is similar to performing stepwise selection in regression models using Akaike information criterion.
Presently, we assessed three measures of centrality: betweenness (how often one node lies on the shortest path between other nodes), closeness (shortest edges to other nodes), and Strength (magnitude of all the node’s immediate edges) (29). Clinically, a node high in Strength can directly influence many adjacent nodes, without the influence of other nodes (29). A node high in Closeness can be interpreted as the speed of influence a change in one node has on all other nodes in the network (29). Lastly, if a node high on Betweenness were to be removed, the relationship between all other nodes become more indirect (29).
We assessed the variability of the edge weights using bootstrapping (B = 1,000) (27), to estimate the 95% confidence interval of the estimated edge weights (i.e., the partial correlations). To gain an estimate of the variability of the found centrality indices (CS-coefficient)—meaning if the order of centrality indices remains the same after re-estimating the network with fewer participants, we applied the participant-dropping subset bootstrap (B = 1,000) (27). This procedure drops a percentage of participants, re-estimates the network, and re-calculates the three centrality indices. The percentage of participants dropped ranged from 5% to 75%, across 10 sampling levels. The CS-coefficient reflects the maximum proportion of participants that can be dropped, such that with 95% probability the correlation (of the centrality value of the bootstrapped sample vs. that of the original) would reach a certain value (0.7 in the current study, CScor = 0.7). It is suggested that the CScor = 0.7 should be >0.25 and is better if it is >0.5 (27).
3 Results
The mean (standard deviation) score of each item of the Back-PAQ can be found in Figure 1. The five pairwise associations with the greatest magnitude of correlation were between Q30–Q31 [0.54 (95% CI 0.44 to 0.60)], Q15–Q16 [0.52 (95% CI 0.43 to 0.61)], Q1–Q2 [0.41 (95% CI 0.30 to 0.47)], Q13–Q14 [0.38 (95% CI 0.27 to 0.43)], and between Q32–Q33 [0.37 (95% CI 0.26 to 0.44)] (Figures 2, 3). These five relationships related to the association between items exploring the perceived influence of attentional focus and expectations (Q30–Q31), items exploring the perceived influence of feelings and stress (Q15–Q16), items exploring the strength and design of the back (Q1–Q2), items exploring interpretations of pain and injury (Q13–Q14), and items exploring persistent weakness and pain (Q32–Q33) (Table 1).
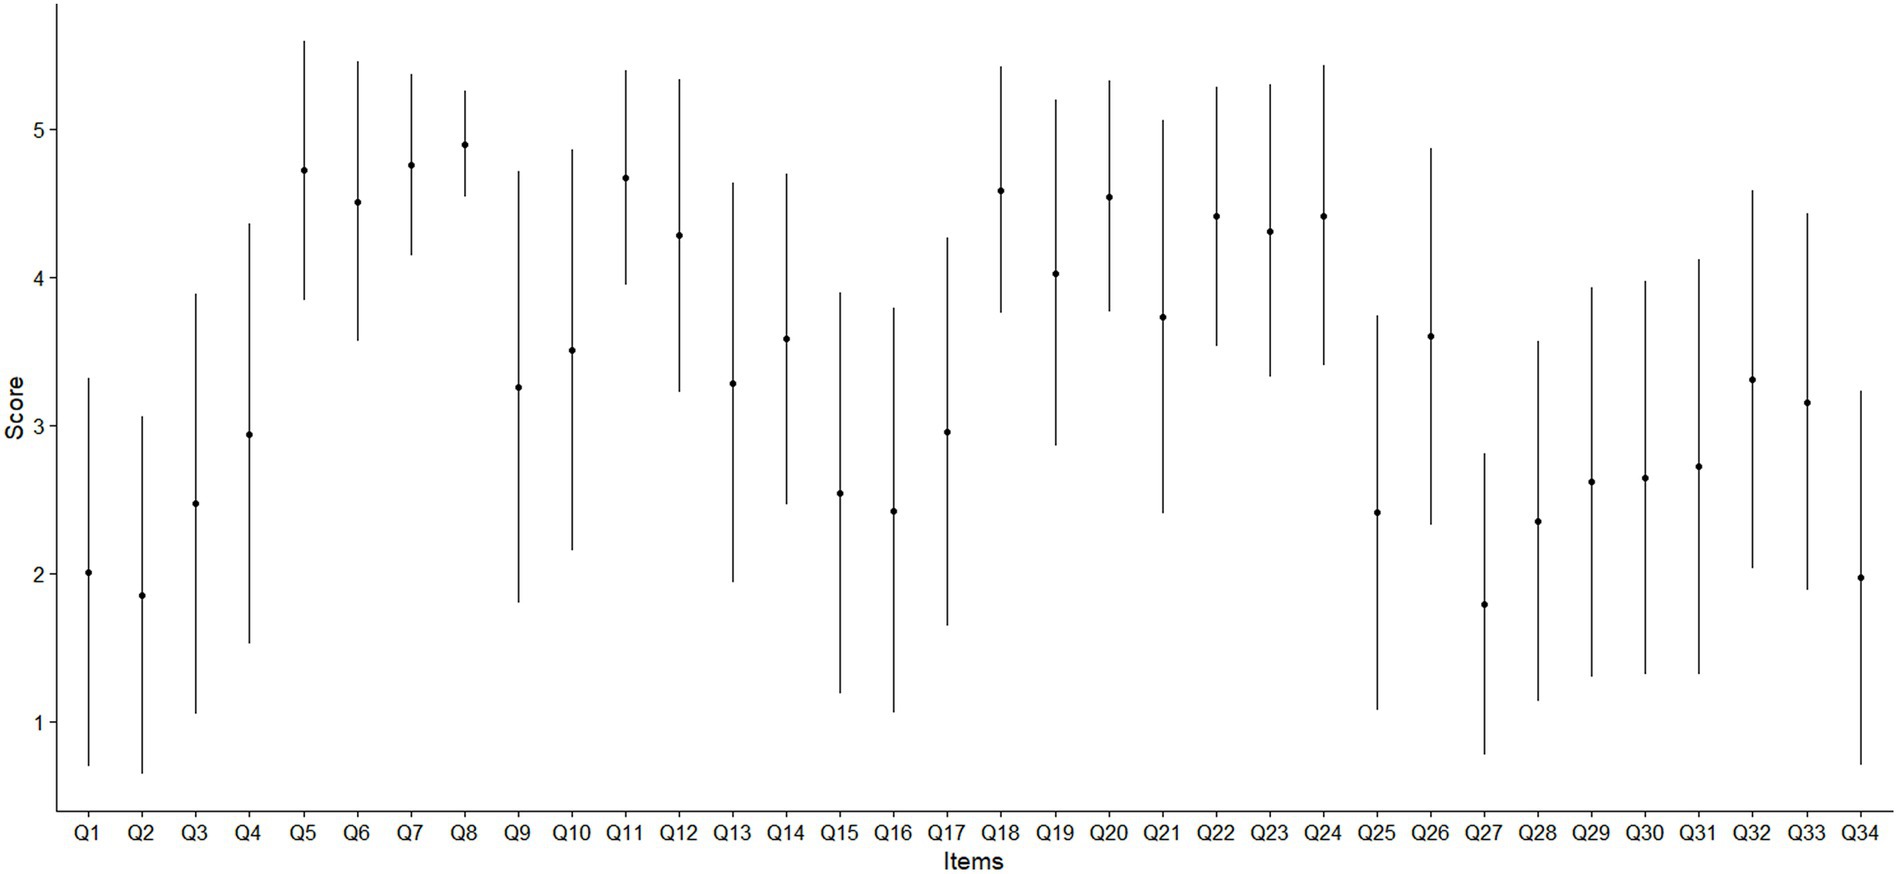
Figure 1. Mean and error bar as one standard deviation of the cohort’s individual item score of the Back-PAQ.
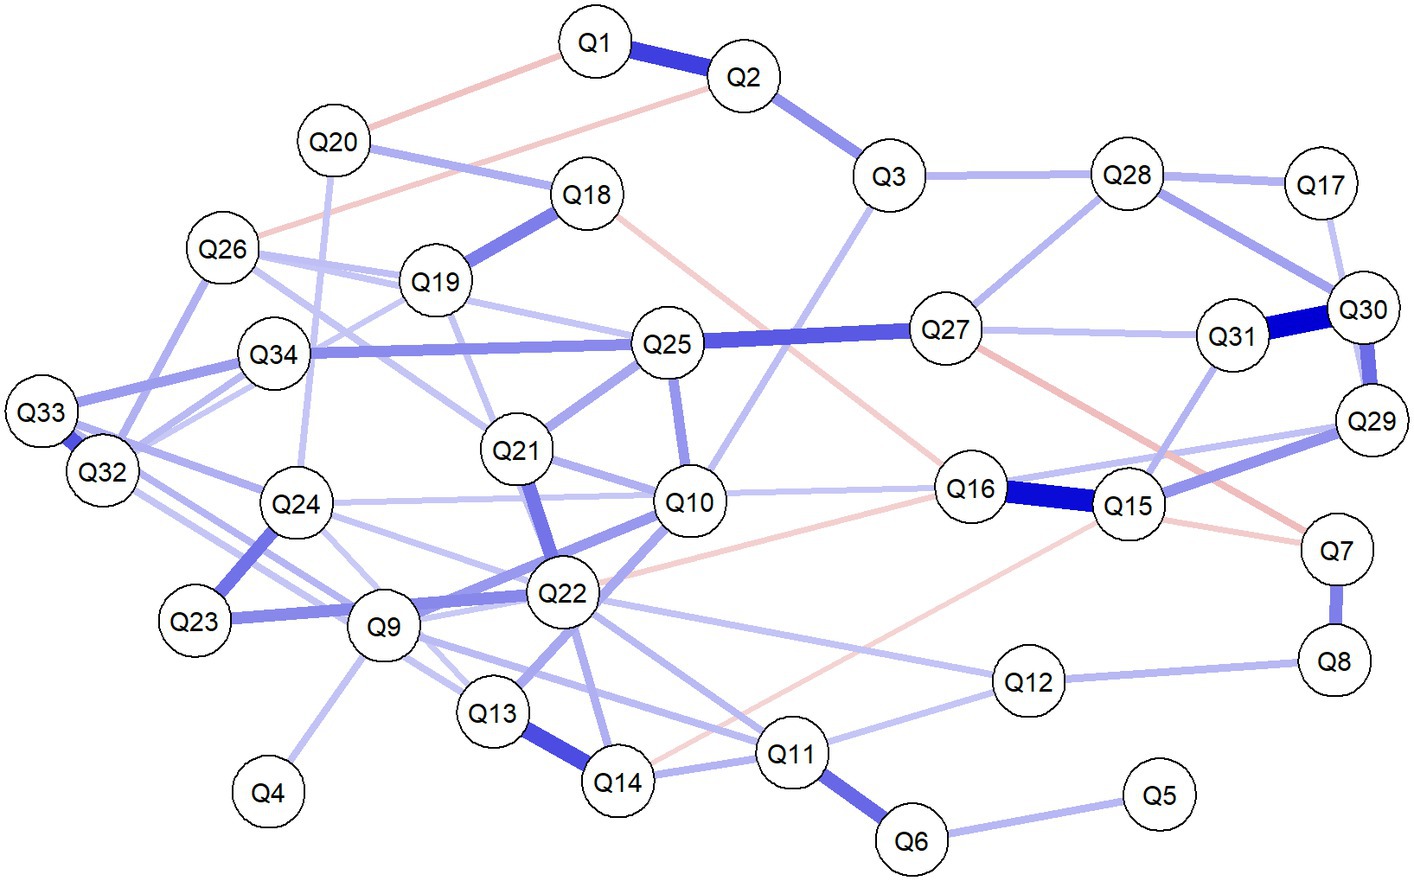
Figure 2. Network analysis of the association between the 34 items of the Back-PAQ. Each edge in the network represents either positive regularized adjusted associations (blue edges) or negative regularized adjusted associations (red edges). The thickness and color saturation of an edge denotes its weight (the strength of the association between two nodes).
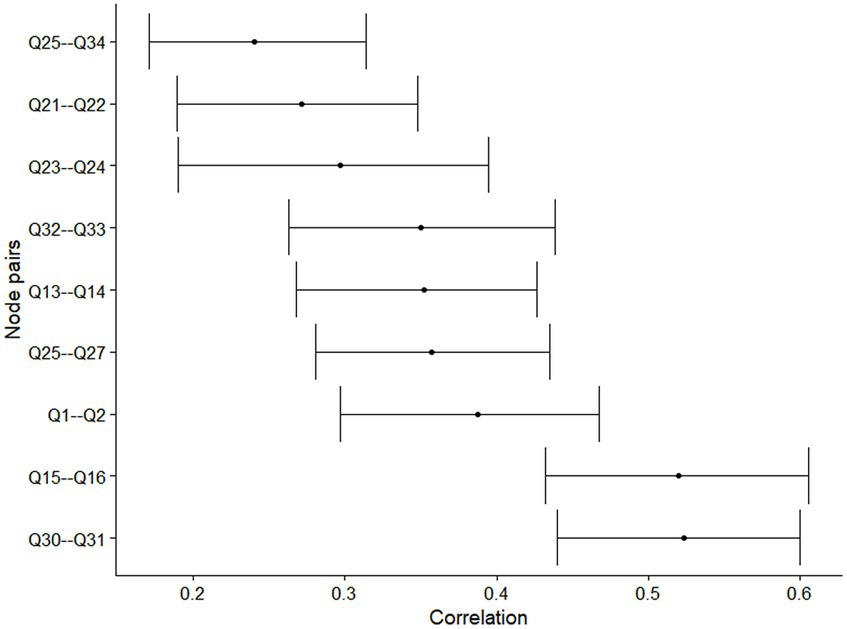
Figure 3. Bootstrapped 95% confidence interval of the estimated edge weights of the network. Only edges where 100% of the bootstrapped estimated correlation was non-zero retained for plotting.
The three nodes with the greatest average centrality values across betweenness, closeness, and strength, were Q22 (betweenness = 1.00, closeness = 1.00, strength = 1.00), Q25 (betweenness = 0.88, closeness = 0.98, strength = 0.78), and Q10 (betweenness = 0.70, closeness = 0.95, strength = 0.64) (Figure 4). The three nodes with the lowest average centrality values across strength, betweenness, and closeness, were Q4 (betweenness = 0.00, closeness = 0.58, strength = 0.09), Q5 (betweenness = 0.00, closeness = 0.51, strength = 0.11), and Q17 (betweenness = 0.00, closeness = 0.60, strength = 0.20) (Figure 4). The stability of the centrality measures, CScor = 0.7, of betweenness, closeness, and strength were 0.05, 0.00, and 0.60, respectively.
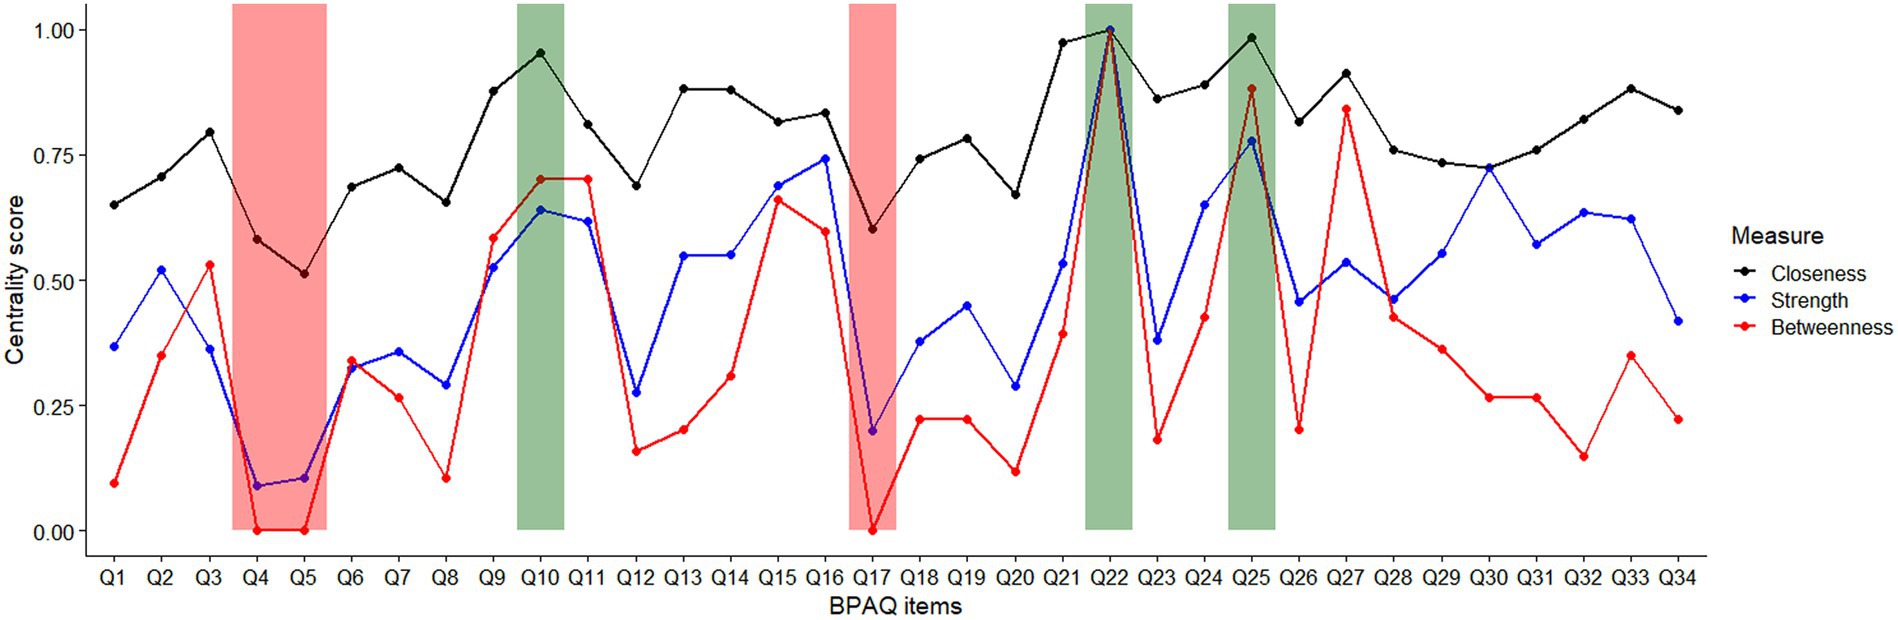
Figure 4. Standardized (0–1) centrality scores of the 34 items of Back-PAQ. Items shaded in green indicate the top three most central items and those in red indicate the least central items.
4 Discussion
Attitudes and beliefs are thought to be important contributors to the development, recovery, and management of LBP. The present study aimed to understand the complex relationship between the individual items of the Back-PAQ to better understand how different beliefs interact with each other. The top two most correlated edges were between focus and expectations (Q30–Q31), and feelings and stress (Q15–Q16). In addition, the three items with the greatest average centrality values across betweenness, closeness, and strength, were Q22, Q25 and Q10. These items reflect beliefs about damaging the back, exercise and activity avoidance, respectively.
A recent systematic review have reported that recovery expectations is a prognostic factor of return to work and recovery outcomes (20), and that expectation of symptom change modulates changes in pain and impairment (30, 31). From our network analysis, a more positive belief about recovery expectations was associated with more positive beliefs about the benefits of focusing on things other than the back (Q30), staying active (Q27), and acknowledging the role of thoughts and feelings in LBP (Q15). These associations may represent candidate mechanisms by which recovery expectations influence LBP outcomes. From the literature, it is thought that recovery expectations might affect LBP outcomes by modifying coping, healthcare-seeking, and withdrawal behaviors (20). It may be that with a more positive belief about focusing on other things and staying active, patients have greater self-efficacy in pursuing activities, despite the presence of pain, which ultimately benefits the recovery of LBP.
Even though beliefs about good posture (Q8) were not most correlated with having strong muscles (Q7), our findings still support their direct association. The present finding supports prior research which reported that patients frequently viewed correct lifting techniques, posture, and having strong muscles as collective strategies for protecting the back (32). Interestingly, beliefs about bending (Q3), sitting (Q4), and lifting (Q5), were not directly associated with each other (Figure 1). Some of these beliefs have been thought to have their roots in communication with clinicians (32) and mass media campaigns (33). If beliefs about bending, sitting, and lifting had a common cause, it would be likely that they are directly associated with each other. Findings from the present study suggest that each of these three beliefs may not be as closely associated as previously thought (34), and may have different antecedent causes. Clinically, this suggests that if educational efforts were to be directed toward altering the beliefs of these activities, they will have to be done so individually, rather than with the expectation that changing the beliefs on one task will influence another.
Items on the Back-PAQ with the worse score may not always be the most connected items within the network. For example, items relating to posture (Q8), muscle strength (Q7), and lifting technique (Q5) were the most negatively scored (6), but represented some of the least central items (Figure 4). In other words, these aforementioned items are relatively isolated from all other items. The most central items relate to beliefs about causing back damage (Q22), the benefits of avoiding exercise (Q25), and activity avoidance (Q10). These three beliefs have close relations with prior reported perceived myths about LBP, particularly on the role of tissue damage in LBP, and the importance of stopping exercise and activity when LBP occurs (34). Not surprisingly, these unhelpful beliefs about exercise are also held by clinicians [e.g., Q9 in (35)], reinforcing the importance of the enduring influence of clinical opinions on the beliefs of LBP on lay people (32). Prior qualitative research has reported that negative beliefs about low back tissue damage results in high pain-related fear (36), while quantitative longitudinal research have reported that fear is a prognostic indicator of persistent LBP symptoms (9). Our findings also support prior research which identified that LBP individuals with high pain-related fear have two predominant beliefs—the potentially damaging effects of physical activity and that performing an activity with pain will increase suffering (37).
The network visualization is clinically very intuitive, enabling rapid and unique clinical insights which may be used to efficiently guide patient counseling. For example, our findings showed that the belief about the ease of injury (Q6) is directly associated with the belief about the safety of lifting (Q5), and not sitting (Q4). This means that for clinicians desiring to alter a patient’s beliefs about sitting safety, educational efforts to modify the patient’s beliefs about the vulnerability of the spine to injury may not be the most efficient treatment approach. Second, in a busy clinical environment, findings from the present study suggest that educational efforts should focus on targeting beliefs related to back damage (Q22), exercise, and activity avoidance (Q25 and Q10). A recent editorial published the 10 common myths about LBP, calling on clinicians to incorporate these discussions with their patients (34). The present finding supplements prior clinical recommendation reports (34), providing evidence for the most efficient approach to navigating these beliefs with patients.
This study has several limitations. First, no attempt was made to distinguish the network dynamics of the Back-PAQ among people with and without LBP. Future investigations on understanding the differences in belief systems among different LBP subgroups may be useful for personalizing education efforts in managing and preventing LBP. Second, the longitudinal relationship between individual items of the Back-PAQ and clinical outcomes was not investigated. Including both the items of the Back-PAQ and measures related to clinical outcomes (e.g., pain intensity and impairment at follow-up) in a prospective study, may help to identify specific beliefs driving clinical outcomes. Third, the original study recruited participants with and without LBP randomly selected from an Electoral Roll. Information concerning the duration of current LBP and whether LBP had a specific cause (e.g., spondyloarthropathy), was not collected. A previous study reported that individuals with axial spondyloarthropathy reported lesser LBP intensity and better health related quality of life, than those with chronic non-specific LBP (38). Whether similar attitudes and beliefs are held in people with specific and non-specific LBP remains to be investigated.
5 Conclusion
Network analysis of the Back-PAQ revealed unique insights into the beliefs about LBP. Beliefs about back damage, exercise, and activity avoidance are factors most connected to all other beliefs within the network. This suggests that these three factors represent candidate targets that clinicians can focus their patient counseling efforts on.
Data availability statement
The raw data supporting the conclusions of this article will be made available by the authors, without undue reservation.
Ethics statement
The studies involving humans were approved by This study was approved by the University of Otago Ethics Committee (D12/255). The studies were conducted in accordance with the local legislation and institutional requirements. The participants provided their written informed consent to participate in this study.
Author contributions
BL: Conceptualization, Formal analysis, Methodology, Software, Validation, Visualization, Writing – original draft, Writing – review & editing. BD: Conceptualization, Data curation, Funding acquisition, Investigation, Methodology, Project administration, Resources, Supervision, Validation, Writing – original draft, Writing – review & editing.
Funding
The author(s) declare that no financial support was received for the research, authorship, and/or publication of this article.
Conflict of interest
The authors declare that the research was conducted in the absence of any commercial or financial relationships that could be construed as a potential conflict of interest.
Publisher’s note
All claims expressed in this article are solely those of the authors and do not necessarily represent those of their affiliated organizations, or those of the publisher, the editors and the reviewers. Any product that may be evaluated in this article, or claim that may be made by its manufacturer, is not guaranteed or endorsed by the publisher.
References
1. Chen, S, Chen, M, Wu, X, Lin, S, Tao, C, Cao, H, et al. Global, regional and national burden of low back pain 1990–2019: a systematic analysis of the global burden of disease study 2019. J Orthop Translat. (2022) 32:49–58. doi: 10.1016/j.jot.2021.07.005
2. Dieleman, JL, Cao, J, Chapin, A, Chen, C, Li, Z, Liu, A, et al. US health care spending by payer and health condition, 1996–2016. JAMA. (2020) 323:863–84. doi: 10.1001/jama.2020.0734
3. da Silva, T, Macaskill, P, Kongsted, A, Mills, K, Maher, CG, and Hancock, MJ. Predicting pain recovery in patients with acute low back pain: updating and validation of a clinical prediction model. Eur J Pain. (2019) 23:341–53. doi: 10.1002/ejp.1308
4. da Silva, T, Mills, K, Brown, BT, Herbert, RD, Maher, CG, and Hancock, MJ. Risk of recurrence of low Back pain: a systematic review. J Orthop Sports Phys Ther. (2017) 47:305–13. doi: 10.2519/jospt.2017.7415
5. Dutmer, AL, Schiphorst Preuper, HR, Stewart, RE, Soer, R, Reneman, MF, and Wolff, AP. Trajectories of disability and low back pain impact: 2-year follow-up of the Groningen spine cohort. Spine. (2020) 45:1649–60. doi: 10.1097/BRS.0000000000003647
6. Darlow, B, Perry, M, Stanley, J, Mathieson, F, Melloh, M, Baxter, GD, et al. Cross-sectional survey of attitudes and beliefs about back pain in New Zealand. BMJ Open. (2014) 4:e004725. doi: 10.1136/bmjopen-2013-004725
7. Pincus, T, Smeets, RJ, Simmonds, MJ, and Sullivan, MJ. The fear avoidance model disentangled: improving the clinical utility of the fear avoidance model. Clin J Pain. (2010) 26:739–46. doi: 10.1097/AJP.0b013e3181f15d45
8. Wertli, MM, Eugster, R, Held, U, Steurer, J, Kofmehl, R, and Weiser, S. Catastrophizing-a prognostic factor for outcome in patients with low back pain: a systematic review. Spine J. (2014) 14:2639–57. doi: 10.1016/j.spinee.2014.03.003
9. Wertli, MM, Rasmussen-Barr, E, Weiser, S, Bachmann, LM, and Brunner, F. The role of fear avoidance beliefs as a prognostic factor for outcome in patients with nonspecific low back pain: a systematic review. Spine J. (2014) 14:816–36.e4. doi: 10.1016/j.spinee.2013.09.036
10. Rainville, J, Carlson, N, Polatin, P, Gatchel, RJ, and Indahl, A. Exploration of physicians’ recommendations for activities in chronic low back pain. Spine. (2000) 25:2210–20. doi: 10.1097/00007632-200009010-00012
11. Darlow, B, Fullen, BM, Dean, S, Hurley, DA, Baxter, GD, and Dowell, A. The association between health care professional attitudes and beliefs and the attitudes and beliefs, clinical management, and outcomes of patients with low back pain: a systematic review. Eur J Pain. (2012) 16:3–17. doi: 10.1016/j.ejpain.2011.06.006
12. Darlow, B, Perry, M, Mathieson, F, Stanley, J, Melloh, M, Marsh, R, et al. The development and exploratory analysis of the Back Pain Attitudes Questionnaire (Back-PAQ). BMJ Open. (2014) 4:e005251. doi: 10.1136/bmjopen-2014-005251
13. Krägeloh, C, Medvedev, ON, Dean, S, Stanley, J, Dowell, A, and Darlow, B. Rasch analysis of the Back Pain Attitudes Questionnaire (Back-PAQ). Disabil Rehabil. (2022) 44:3228–35. doi: 10.1080/09638288.2020.1861484
14. Darlow, B, Stanley, J, Dean, S, Abbott, JH, Garrett, S, Wilson, R, et al. The fear reduction exercised early (FREE) approach to management of low back pain in general practice: a pragmatic cluster-randomized controlled trial. PLoS Med. (2019) 16:e1002897. doi: 10.1371/journal.pmed.1002897
15. Caneiro, JP, O’Sullivan, P, Smith, A, Ovrebekk, IR, Tozer, L, Williams, M, et al. Physiotherapists implicitly evaluate bending and lifting with a round back as dangerous. Musculoskelet Sci Pract. (2019) 39:107–14. doi: 10.1016/j.msksp.2018.12.002
16. Caneiro, JP, O’Sullivan, P, Smith, A, Moseley, GL, and Lipp, OV. Implicit evaluations and physiological threat responses in people with persistent low back pain and fear of bending. Scand J Pain. (2017) 17:355–66. doi: 10.1016/j.sjpain.2017.09.012
17. Vlaeyen, JWS, and Linton, SJ. Fear-avoidance and its consequences in chronic musculoskeletal pain: a state of the art. Pain. (2000) 85:317–32. doi: 10.1016/S0304-3959(99)00242-0
18. George, SZ, Wittmer, VT, Fillingim, RB, and Robinson, ME. Comparison of graded exercise and graded exposure clinical outcomes for patients with chronic low back pain. J Orthop Sports Phys Ther. (2010) 40:694–704. doi: 10.2519/jospt.2010.3396
19. Kent, P, Haines, T, O’Sullivan, P, Smith, A, Campbell, A, Schutze, R, et al. Cognitive functional therapy with or without movement sensor biofeedback versus usual care for chronic, disabling low back pain (RESTORE): a randomized, controlled, three-arm, parallel group, phase 3, clinical trial. Lancet. (2023) 401:1866–77. doi: 10.1016/S0140-6736(23)00441-5
20. Hayden, JA, Wilson, MN, Riley, RD, Iles, R, Pincus, T, and Ogilvie, R. Individual recovery expectations and prognosis of outcomes in non-specific low back pain: prognostic factor review. Cochrane Database Syst Rev. (2019) 2019, 2019:CD011284. doi: 10.1002/14651858.CD011284.pub2
21. da C Menezes Costa, L, Maher, CG, McAuley, JH, Hancock, MJ, and Smeets, RJ. Self-efficacy is more important than fear of movement in mediating the relationship between pain and disability in chronic low back pain. Eur J Pain. (2011) 15:213–9. doi: 10.1016/j.ejpain.2010.06.014
22. Borsboom, D, and Cramer, AO. Network analysis: an integrative approach to the structure of psychopathology. Annu Rev Clin Psychol. (2013) 9:91–121. doi: 10.1146/annurev-clinpsy-050212-185608
23. Devecchi, V, Alalawi, A, Liew, B, and Falla, D. A network analysis reveals the interaction between fear and physical features in people with neck pain. Sci Rep. (2022) 12:11304. doi: 10.1038/s41598-022-14696-8
24. Liew, X, Ford, J, Briganti, G, and Hahne, A. Understanding how individualized physiotherapy or advice altered different elements of disability for people with low back pain using network analysis. PLoS One. (2022) 17:e0263574. doi: 10.1371/journal.pone.0263574
25. Moran, RW, Rushworth, WM, and Mason, J. Investigation of four self-report instruments (FABT, TSK-HC, Back-PAQ, HC-PAIRS) to measure healthcare practitioners’ attitudes and beliefs toward low back pain: reliability, convergent validity and survey of New Zealand osteopaths and manipulative physiotherapists. Musculoskelet Sci Pract. (2017) 32:44–50. doi: 10.1016/j.msksp.2017.08.008
26. Epskamp, S, Cramer, AOJ, Waldorp, LJ, Schmittmann, VD, and Borsboom, D. qgraph: network visualizations of relationships in psychometric data. J Stat Softw. (2012) 48:1–18. doi: 10.18637/jss.v048.i04
27. Epskamp, S, Borsboom, D, and Fried, EI. Estimating psychological networks and their accuracy: a tutorial paper. Behav Res Methods. (2018) 50:195–212. doi: 10.3758/s13428-017-0862-1
28. O’Driscoll, C, Epskamp, S, Fried, EI, Saunders, R, Cardoso, A, Stott, J, et al. Transdiagnostic symptom dynamics during psychotherapy. Sci Rep. (2022) 12:10881. doi: 10.1038/s41598-022-14901-8
29. Costantini, G, Epskamp, S, Borsboom, D, Perugini, M, Mõttus, R, Waldorp, LJ, et al. State of the aRt personality research: a tutorial on network analysis of personality data in R. J Res Pers. (2015) 54:13–29. doi: 10.1016/j.jrp.2014.07.003
30. Ballestra, E, Battaglino, A, Cotella, D, Rossettini, G, Sánchez Romero, E, and Villafañe, J. Do patients’ expectations influence conservative treatment in chronic low back pain? A narrative review. Retos. (2022) 46:395–403. doi: 10.47197/retos.v46.93950
31. Sherriff, B, Clark, C, Killingback, C, and Newell, D. Impact of contextual factors on patient outcomes following conservative low back pain treatment: systematic review. Chiropr Man Therap. (2022) 30:20. doi: 10.1186/s12998-022-00430-8
32. Darlow, B, Dowell, A, Baxter, GD, Mathieson, F, Perry, M, and Dean, S. The enduring impact of what clinicians say to people with low back pain. Ann Fam Med. (2013) 11:527–34. doi: 10.1370/afm.1518
33. Gross, DP, Deshpande, S, Werner, EL, Reneman, MF, Miciak, MA, and Buchbinder, R. Fostering change in back pain beliefs and behaviors: when public education is not enough. Spine J. (2012) 12:979–88. doi: 10.1016/j.spinee.2012.09.001
34. O’Sullivan, P, Caneiro, J, O’Sullivan, K, Lin, I, Bunzli, S, Wernli, K, et al. Back to basics: 10 facts every person should know about back pain. Br J Sports Med. (2020) 54:698–9. doi: 10.1136/bjsports-2019-101611
35. Pérez, SEM, González, LL, Acevedo, IA, Barrera, RB, Pérez, JLA, Romero, EAS, et al. Attitudes and beliefs toward low back pain (LBP) among physiotherapists in Spain. Bull Fac Phys Ther. (2022) 27:52. doi: 10.1186/s43161-022-00112-9
36. Bunzli, S, Smith, A, Schütze, R, and O’Sullivan, P. Beliefs underlying pain-related fear and how they evolve: a qualitative investigation in people with chronic back pain and high pain-related fear. BMJ Open. (2015) 5:e008847. doi: 10.1136/bmjopen-2015-008847
37. Bunzli, S, Smith, A, Watkins, R, Schütze, R, and O’Sullivan, P. What do people who score highly on the Tampa Scale of Kinesiophobia really believe?: a mixed methods investigation in people with chronic nonspecific low back pain. Clin J Pain. (2015) 31:621–32. doi: 10.1097/AJP.0000000000000143
Keywords: low back pain, psychological factors, beliefs, network analysis, attitudes
Citation: Liew BXW and Darlow B (2024) Exploring the complexity of commonly held attitudes and beliefs of low back pain—a network analysis. Front. Med. 11:1327791. doi: 10.3389/fmed.2024.1327791
Edited by:
Eron Grant Manusov, The University of Texas Rio Grande Valley, United StatesReviewed by:
Julio César Casasola-Vargas, General Hospital of Mexico, MexicoEleuterio A. Sánchez Romero, European University of Madrid, Spain
Copyright © 2024 Liew and Darlow. This is an open-access article distributed under the terms of the Creative Commons Attribution License (CC BY). The use, distribution or reproduction in other forums is permitted, provided the original author(s) and the copyright owner(s) are credited and that the original publication in this journal is cited, in accordance with accepted academic practice. No use, distribution or reproduction is permitted which does not comply with these terms.
*Correspondence: Bernard X. W. Liew, YmwxOTYyMkBlc3NleC5hYy51aw==; bGlld194d2JAaG90bWFpbC5jb20=