 Linglong Ye
 Zhengman Wu1
 Yi-Wei Kao
 Mingchih Chen
 Ben-Chang Shia
 Lei Qin
- 1School of Public Affairs, Xiamen University, Xiamen, China
- 2Department of Applied Statistics and Information Science, Ming Chuan University, Taoyuan, Taiwan
- 3National Institute for Data Science in Health and Medicine, Xiamen University, Xiamen, China
- 4Data Mining Research Center, Xiamen University, Xiamen, China
- 5School of Management, Xiamen University, Xiamen, China
- 6Graduate Institute of Business Administration, College of Management, Fu Jen Catholic University, New Taipei City, Taiwan
- 7Artificial Intelligence Development Center, Fu Jen Catholic University, New Taipei City, Taiwan
- 8School of Statistics, University of International Business and Economics, Beijing, China
- 9Dong Fureng Institute of Economic and Social Development, Wuhan University, Wuhan, China
Introduction: Previous health transition patterns studies only focused on biological and psychological dimensions, and overlooked social dimension. By combining biological, psychological, and social health dimensions, this study aimed to examine heterogeneous transition patterns and assessed their determinants among Chinese middle-aged and older adults.
Methods: Four waves of longitudinal data in 2011–2012, 2013, 2015, and 2018 from the China Health and Retirement Longitudinal Study was adopted. A total of 6,161 adults aged ≥45 years with no missing data on three dimensions were included. The repeated-measures latent class analysis as a person-centered approach was used to estimate transition patterns, followed by multinomial logistic regression to assess determinants.
Results: This study highlighted five health transition groups, including “social participation slightly improving followed by deterioration” (SP-ID, 23.62%), “cognitive status deteriorating gradually and lacking social participation” (CS-DG&L-SP, 17.97%), “ADLs deteriorating followed by a slight improvement and lacking social participation” (ADLs-DI&L-SP, 9.14%), “died in the follow-up period” (DIFP, 11.65%), and “sustainedly healthy” (SH, 37.62%). Using the SH group as the reference group, sex, education, job, type of residence, and region have different impact on different patterns. Men were more likely to be in the SP-ID and DIFP groups, while women were more likely to be in the CS-DG&L-SP and ADLs-DI&L-SP groups. Being not in marriage was related to the SP-ID, CS-DG&L-SP, and DIFP groups. Those living in the central region and those having smoking and drinking habits less tended to fall into the SP-ID group. The retired, non-smokers, and drinkers even less tended to be in the CS-DG&L-SP group. Those living in the eastern region, those drinking alcohol appropriately, and those with higher income less tended to be in the ADLs-DI&L-SP group. Being uninsured by public insurance and having lower income were associated with the DIFP group.
Conclusion: Integrating the social dimension with physical and psychological dimensions enhanced our understanding of the heterogeneous health transition patterns of middle-aged and older people. These findings provide valuable evidence for promoting healthy aging targets for different groups of the aging population.
1 Introduction
As global fertility and mortality decline simultaneously, the global population ages, with the proportion of people aged ≥65 expected to rise from 10% in 2022 to 16% in 2050 (1). This phenomenon is also occurring in developing countries, particularly in China, which is transitioning to an aged society at an incredible rate, and leapfrogging to have the world’s largest number of older people, with the number of people ≥65 expected to increase from 14% in 2015 to 26% in 2050 (2). However, longer life does not mean better health (3). In China, older people’s health is also becoming a serious challenge, and the aging population has unprecedented health needs, leading to huge healthcare expenditures. Therefore, it is imperative to comprehensively and accurately assess the health status and development trends of the middle-aged and elderly in China.
The World Health Organization defines health as “a state of physical, mental, and social well-being, not just the absence of disease and infirmity” (4). The widely accepted modern medical model also emphasizes the combined effect of the biological, psychological, and social dimensions (5). There is increasingly concerned with an integrated perspective across multiple dimensions, particularly the heterogeneous state of individual health resulting from the interaction of each dimension. However, the heterogeneity of multidimensional health transition patterns among middle-aged and older adults has not been studied properly, and previous studies still focus mainly on physical and psychological health (6, 7).
“Healthy aging” is relevant to everyone (8). To understand the multidimensional nature of individual health, a person-centered approach should be used, which differs from the traditional variable-centered approach, to distinguish heterogeneity in groups by considering the individual’s characteristics (9). Researchers use person-centered methods such as latent class analysis (LCA) and latent transition analysis to explain population heterogeneity by analyzing cross-sectional and short-term longitudinal data (10, 11). In addition, mixed models such as growth mixture modeling, which are based on longitudinal data spanning longer times, provide a dynamic perspective on older people’s health (7, 9). Nevertheless, most studies have focused on single-dimensional health trajectories (12, 13), with fewer studies having separately observed health transfer patterns of older adults from a more multidimensional perspective (14–16). Developing the repeated-measures LCA (RMLCA) on the LCA model allows for the simultaneous observation of changes in multidimensional indicators over time, allowing for a more intuitive study of health transfer patterns in older people (15, 17, 18).
Moreover, the determinants of ternary-dimensional health transition patterns should be examined to promote the vision of healthy aging achievement. Andersen’s behavioral model of health services use is a widely recognized model of health influences in which predisposing, enabling, and need factors influence individual health outcomes and health behaviors are considered (19, 20).
This study aimed to integrate physical, psychological, and social health indicators to identify potential heterogeneous multidimensional health transition patterns among middle-aged and older Chinese people. In addition, this study assessed the impact of predisposing factors, enabling factors, and health behaviors on different health transition patterns.
2 Methods
2.1 Study designs and samples
This study adopted longitudinal data from the China Health and Retirement Longitudinal Study (CHARLS). The CHARLS is a nationally representative longitudinal survey of residents in mainland China aged ≥45 and has been conducted every 2 to 3 years since 2011 (21). It provides a wide range of information on health conditions, socioeconomic status, and deaths occurring during the survey period. Each CHARLS wave has received ethical approval from the Institutional Review Board at Peking University. It uses a probability-proportional-to-size sampling with a stratified (by per-capita gross domestic product of rural counties and urban districts) multistage (county/district-village/community-household) design (22). Moreover, the Harmonized CHARLS data is provided to ensure the adoption of best practices and international comparisons. More detailed information on the study design and high quality of CHARLS data have been reported elsewhere (6, 23, 24).
The longitudinal dataset in this study comprised all four waves of Harmonized CHARLS data Version D published in June 2021, with waves 1 to 4 in 2011–2012, 2013, 2015, and 2018, respectively (25). Given the potentially substantial impact of the COVID-19 pandemic and relevant government policies on individual multidimensional health in the 2020 survey, this study did not include the wave of 2020. The flow chart of the Harmonized CHARLS data Version D follow-up and the sample selection of this study is presented in Figure 1. Those aged ≥45 years old at wave 1 were included. To reduce the impact of survival bias, we included those who died during the study period (15). Respondents with missing health data were excluded, yielding 6,161 respondents aged ≥45 years to identify heterogeneous groups of health transition patterns, from which 5,464 respondents with complete information on predisposing, enabling, and health behavior information were included in the analyses of impact factors on health transition patterns.
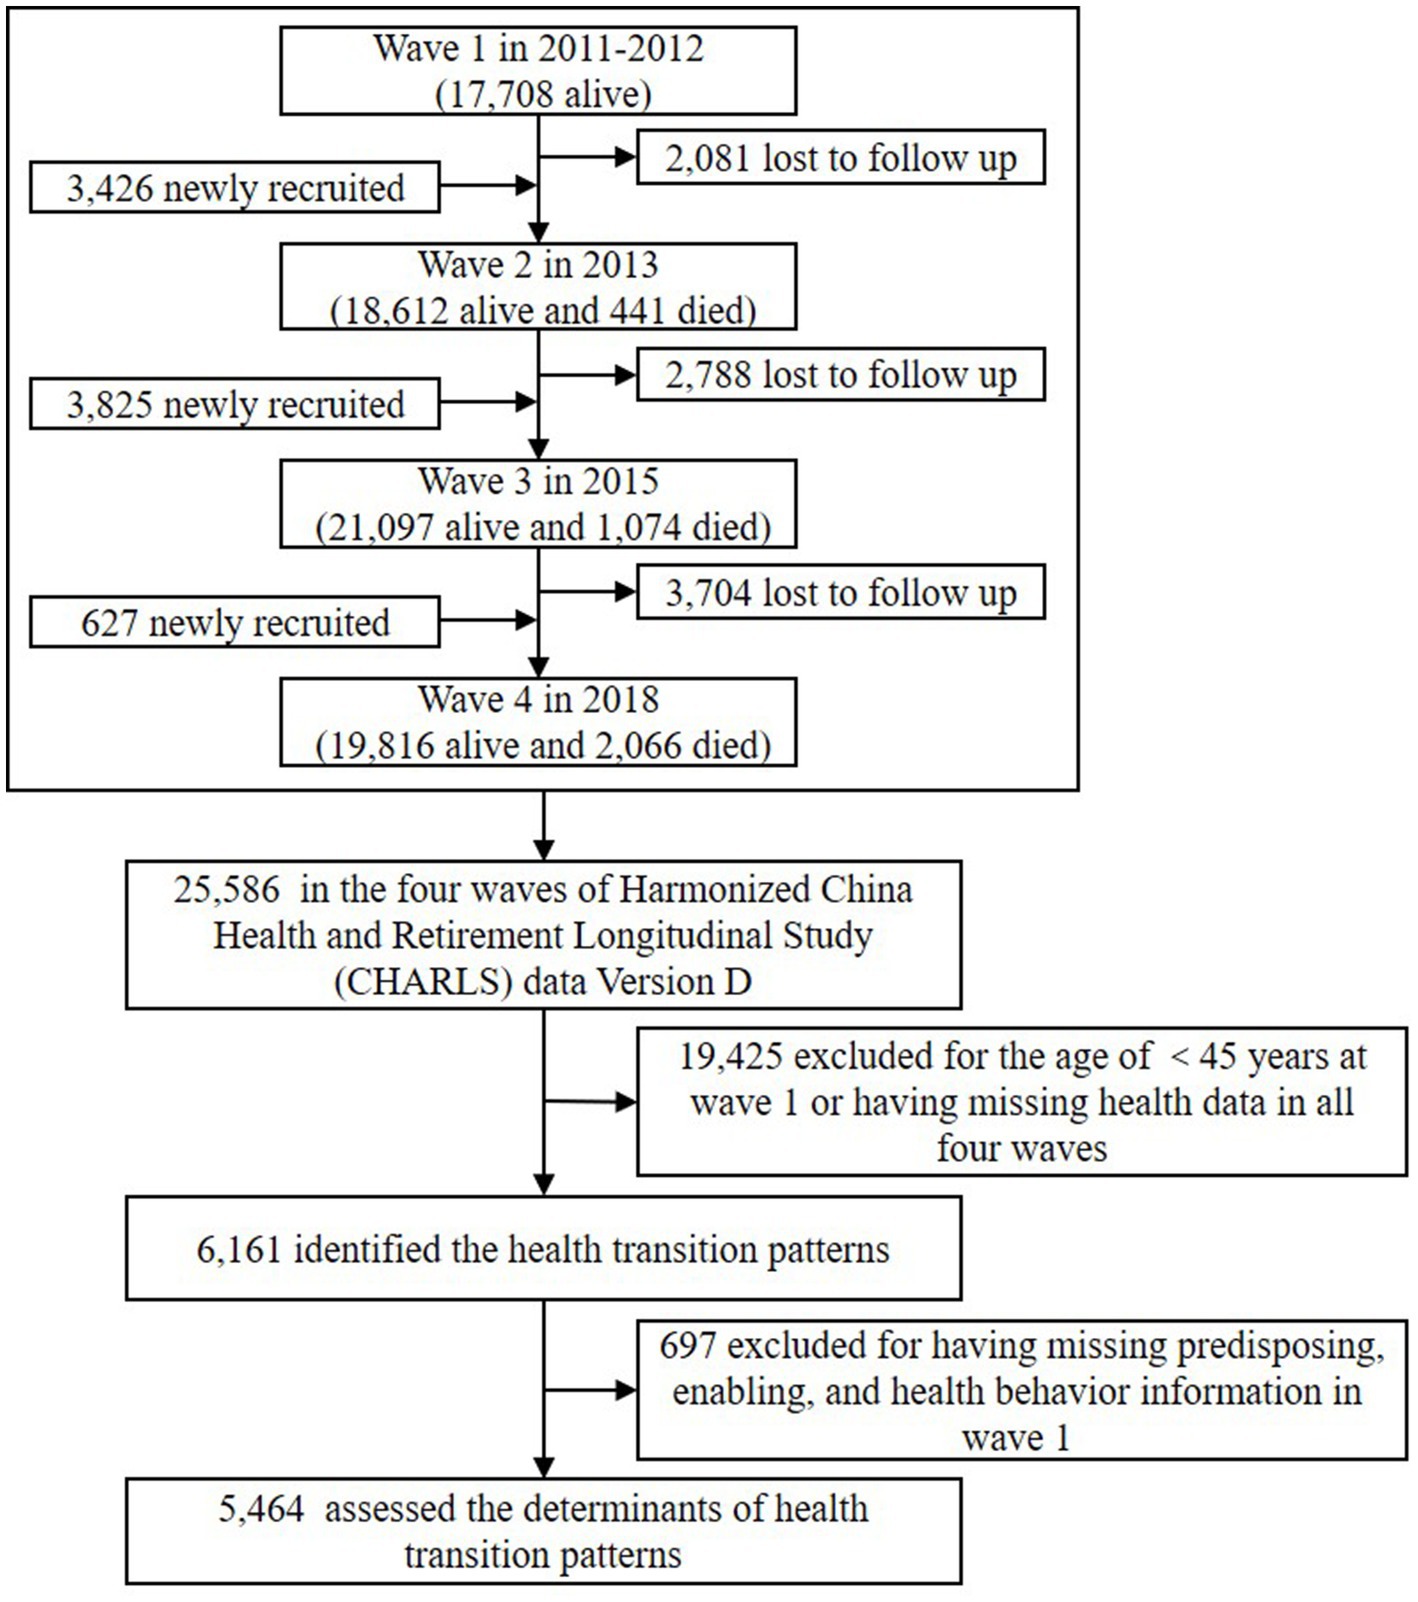
Figure 1. Flow chart of the Harmonized CHARLS data Version D follow-up and the sample selection of this study.
2.2 Assessment of multidimensional health
This study used three physical, psychological, and social health indicators at each of the four waves to measure heterogeneous transition patterns. Given the RMLCA model applied in this study, we treated death as a category of health indicators rather than as another indicator, death, which would be over certainty and therefore not be able to result in a solution of the model (15).
Physical health status was measured by six activities of daily living (ADLs), including dressing, bathing and showering, eating, getting in and out of bed, using the toilet, and controlling urination and defecation (26). The assessment of ADLs was categorized into three categories: (1) no difficulties, corresponding to those without any assistance in any one of ADLs; (2) with difficulties, corresponding to those requiring any assistance in any activity; (3) being dead.
Psychological health status was examined by the Telephone Interview of Cognitive Status (TICS) (27). Although cognitive symptoms are often viewed as an indication of non-psychiatric disorders referring to functional health, the National Institute of Mental Health, the lead federal agency for research on mental disorders, called for recognition that cognition is in fact a symptom of psychiatric disorders (28, 29). Hence, we regarded cognitive status as psychological health status. In harmonized CHARLS, the TICS includes 10 items with scores ranging from 0 to 10: a test of serial subtractions of 7 from 100 up to five times, today’s date (year, month, day) and day of the week, and ability to draw a sign picture. A higher TICS score indicates better cognitive function. Those with a score less than a median of 8 were deemed as having cognitive problems. Therefore, the measure of TICS was defined as no cognitive problems, having cognitive problems, and being dead.
Social health status was assessed by social participation (SP) in social activities (30). The measure of SP was based on the six sub-questions of the same question about social activities. These questions indicated whether the respondent participated in any social activities in the past month: (1) interacted with friends; (2) played Ma-jong, chess, or cards, or went to a community club; (3) participated in sports, social, or other club activity; (4) participated in a community-related organization; (5) did voluntary or charity work; (6) attended an educational or training course. If the respondent did not participate in any of above social activities, they were deemed as lacking social engagement (31). Hence, the measure of SP was defined as not lacking SP, lacking SP, and being dead.
2.3 Covariates
In this study, all the covariates were measured in the first wave and were divided into three determinants based on Andersen’s behavioral model: predisposing, enabling, and health behaviors (19, 20). The predisposing determinants consisted of age (45–54, 55–64, or ≥65 years), sex (male or female), education (illiterate, literate or primary school, or junior high and above), job (agriculture, non-agriculture, retired, or others), marital status (in marriage or not in marriage). The measurement of the job about “others” included unemployed and have never worked. The enabling determinants comprised living arrangement (living alone or living with others), type of residence (urban or rural), region (eastern, central, western, or northeast), public health insurance (yes or no), household income per capita (<1,000 yuan, or ≥1,000 yuan). The divisions of regions were based on the 2011 version of China’s economic regional divisions (32). The health behaviors included smoking behavior (yes or no) and drinking behavior (yes or no). Detailed information about the measurements of covariates is presented in Table 1.
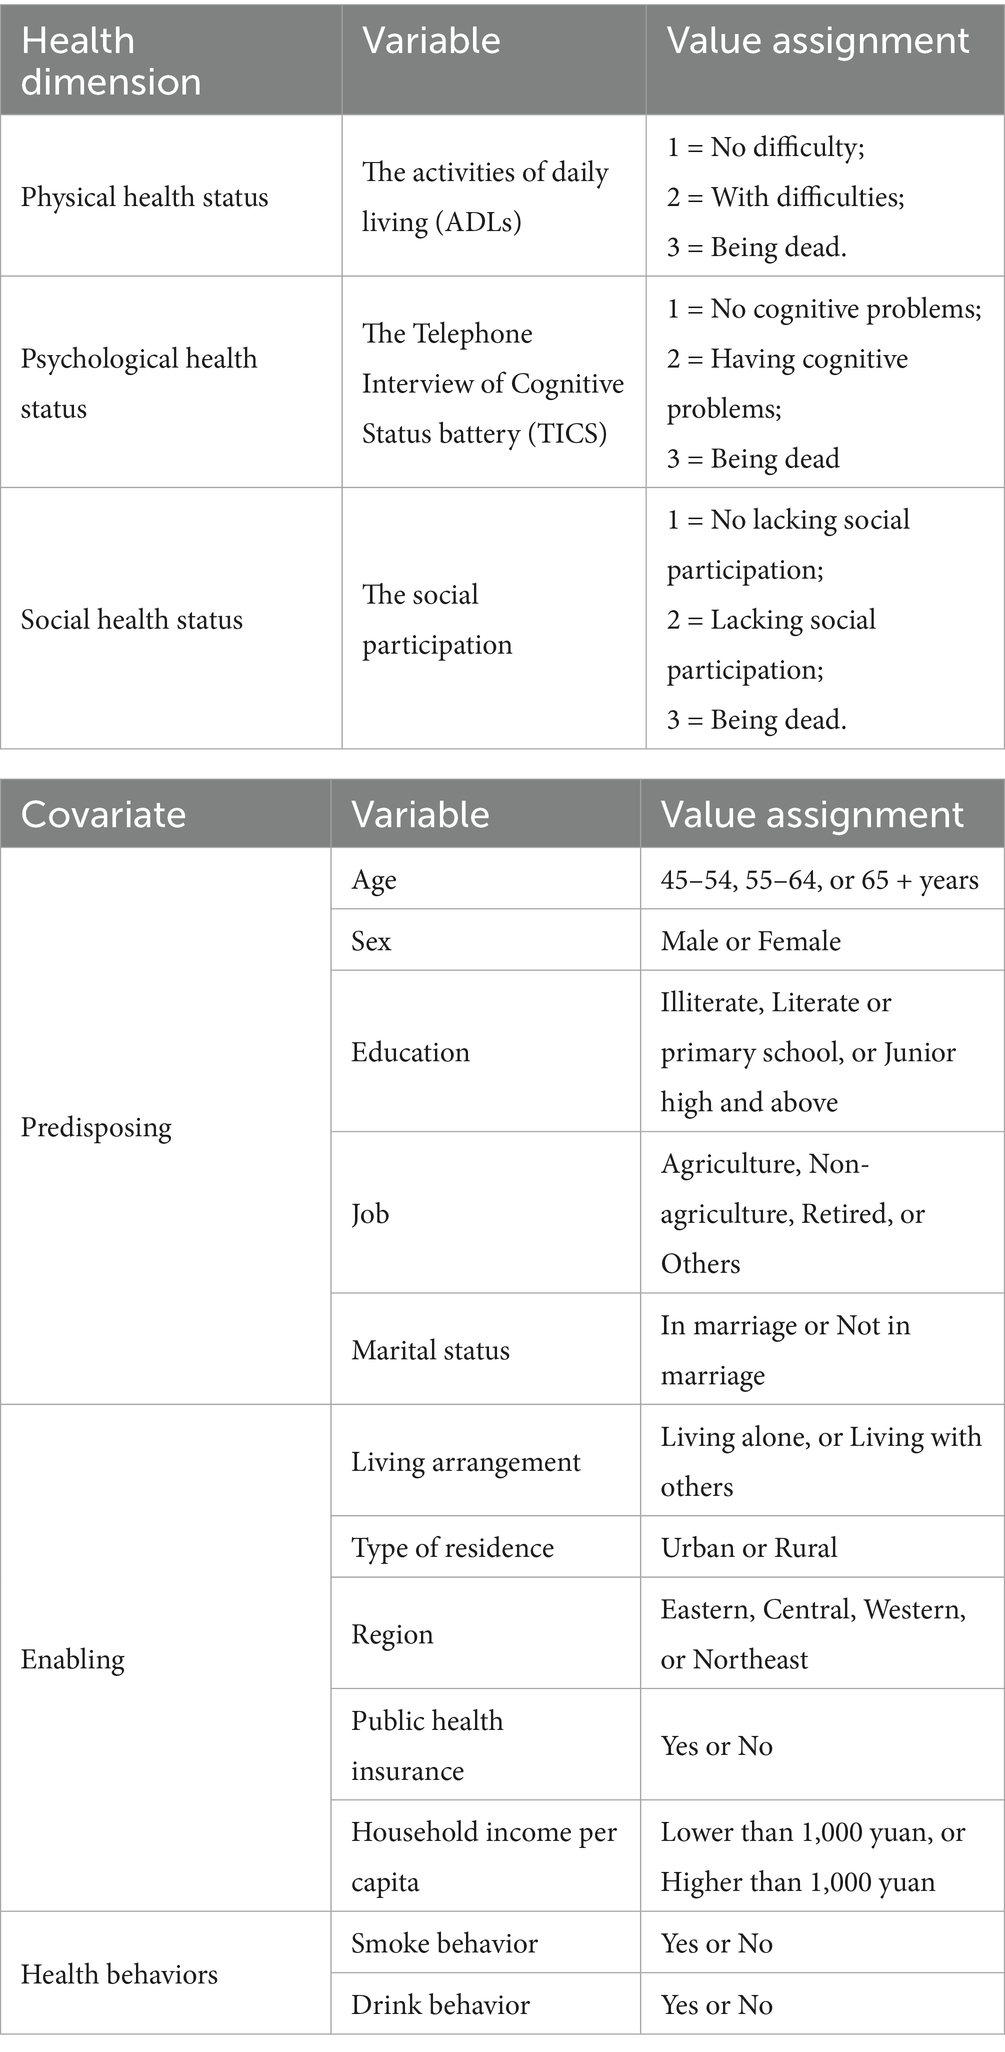
Table 1. The values assigned to indicators.
2.4 Statistical analyses
The statistical analyses in this study involved two steps. The first step identified the health transition patterns by RMLCA based on the three indicators at each of the four waves. The RMLCA model applied LCA to classify the changes during several times into different subgroups and enabled defining of the particular patterns of discontinuous development (33), which corresponded to a certain transition pattern of multidimensional health in this study. When a small number of indicators are measured three or more times, previous studies have pointed out that the RMLCA approach works best (17). As the basis of RMLCA, LCA is a person-centered method suitable for addressing heterogeneity (6). In an LCA model, those with similar performance in observable indicator features are categorized into the same unobservable subgroup, which is related to a latent class (6, 15, 17). Estimated indicator–response probabilities and class membership probabilities were reported. By comparing indicator–response probabilities among different classes, the labels of latent health transition patterns were based on the specific characteristics of certain indicator–response probabilities which different from other classes (17). The models with 2–10 classes were conducted to find the best-fitting model. The performance of the models was estimated by Bayesian information criterion (BIC), adjusted BIC (aBIC), and consistent Akaike’s information criterion (cAIC), where a lower value indicates a better performance. In addition, entropy with a range of 0 to 1 was used to measure the classification quality of the models, and a higher entropy value generally indicates a better separate of the latent classes.
The second step was to conduct a multinomial logistic regression analysis to examine how predisposing, enabling, and health behaviors impact different health transition patterns. All the statistical analyses were performed using R, version 4.2.2. A p-value<0.05 was regarded as statistically significant.
2.5 Sensitivity analyses
Three sensitivity analyses were performed to verify the robustness of the results. First, we replaced ADLs with instrumental activities of daily living (IADLs) as a measure of physical health status and reconducted RMLCA and multinomial logistic regression analyses. In harmonized CHARLS data, IADLs include the following items: managing money, taking medications, shopping for groceries, preparing meals, cleaning the house, and making phone calls. Previous studies have pointed out ADL and IADL were both widely used in the measurement of functional disability, related to physical health status in this study (34). However, previous studies have suggested that IADL disability is the prior stage of ADL disability (35). Therefore, we used ADLs to measure relatively stable physical health status.
Second, we included those respondents with complete health information or only having one missing health information in the analyze of latent health transition patterns. Given it is common to use the complete case analysis method including only samples with complete data for analysis in previous studies of the CHARLS database (36, 37), we excluded those respondents with missing health data in the identification of latent health transition patterns.
Three, using multivariable logistic regression, we examined the effect of predisposing, enabling, and health behaviors on all the classes of the best-fitting model, which may reflect a more comprehensive picture of the relationship between covariates and health status trajectories. However, several classes of the best-fitting model had a small sample size, which may result in biased estimation. The parameters of logistic regression are often estimated using maximum likelihood estimation, which is prone to bias when the sample size is small (38). General guidelines for the minimum number of events per variable (EPV) are required in logistic regression. It has been demonstrated that when the EPV values are ≥10, it does not seriously impact the results (39). Hence, to ensure that the results were statistically significant, we combined those classes with a small number of samples (17).
3 Results
3.1 Identification of latent health transition patterns
This study included 6,161 respondents aged ≥45 years with complete health information in the identification of latent health transition patterns, and their multidimensional health status of respondents during the four waves from 2011 to 2018 is shown in Table 2. The proportions of the responses with ADL difficulties were 12.60, 13.18, 15.47, and 14.28% at four waves, and the trend went up at wave 2 and 3 but went down at wave 4. The proportions of having cognitive problems during the four waves (31.67, 29.62, 28.97, and 37.12%, respectively) firstly fell at wave 2 and 3, and rose obviously at wave 4. The trend of lacking social participation (50.22, 40.04, 43.22, and 45.28%, respectively) declined at wave 2 and then increased at wave 3 and 4. The proportions of death were 3.90, 7.13, and 11.65% at wave 2–4, respectively.
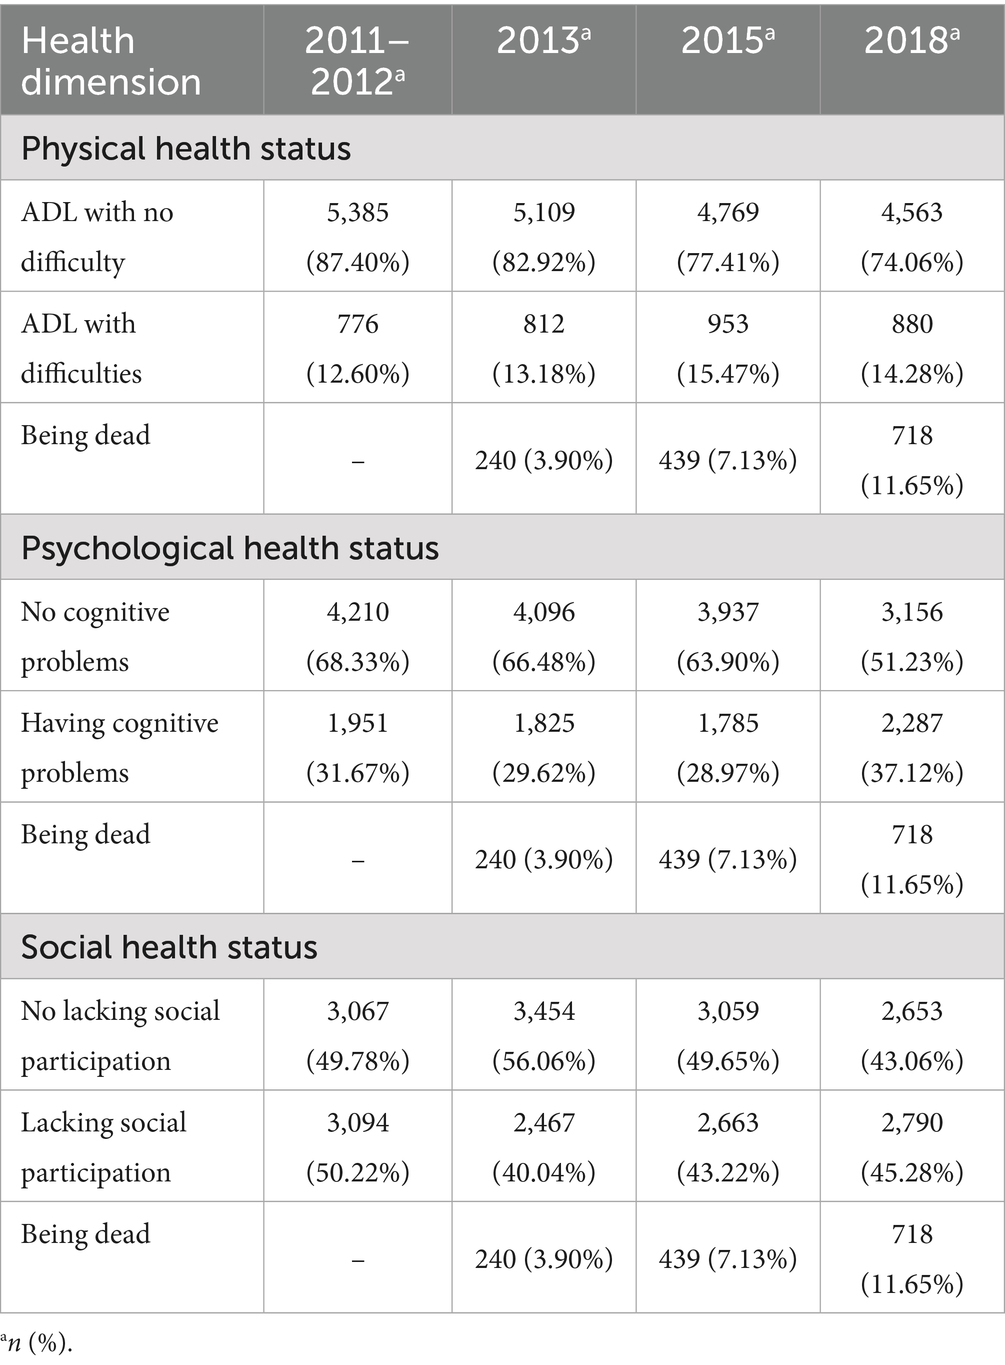
Table 2. Multidimensional health status of respondents during the four waves from 2011 to 2018.
The performance of the different class models is shown in Figure 2. The BIC, aBIC, and cAIC values declined as more latent classes were added. However, after the seven-class model, the downward trend gradually leveled off. The entropy values of the models with 2–10 classes were all over 0.7, corresponding to 1.000, 0.766, 0.783, 0.770, 0.782, 0.789, 0.760, 0.746, and 0.745, respectively. In addition, the classifications identified by the seven-class model could more adequately represent heterogeneous transition patterns of multidimensional health, including the maintenance of a relatively healthy state, changes in different health indicators, and death at different periods (Figure 3). Therefore, we chose the seven-class model as the best model.
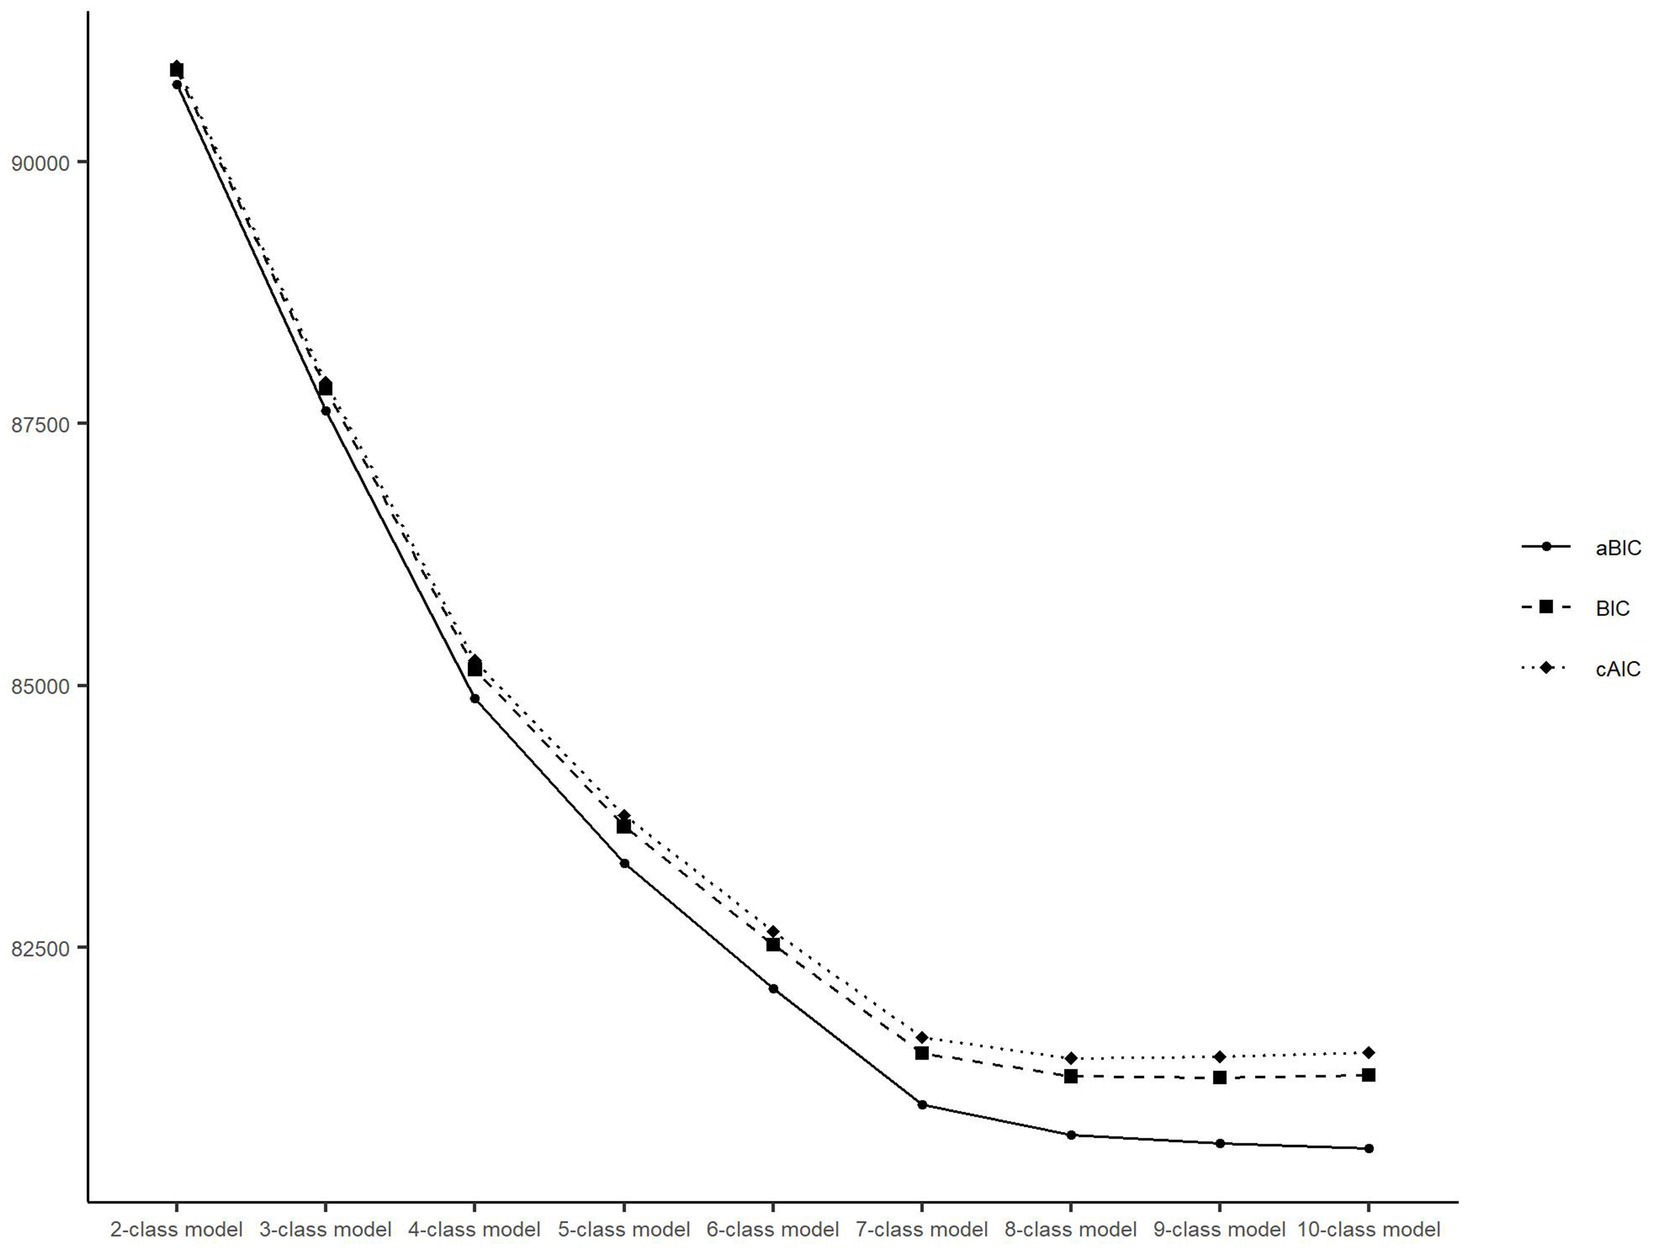
Figure 2. Latent class model and fit indices. BIC, Bayesian information criterion; aBIC, adjusted Bayesian information criterion; cAIC, consistent Akaike’s information criterion.
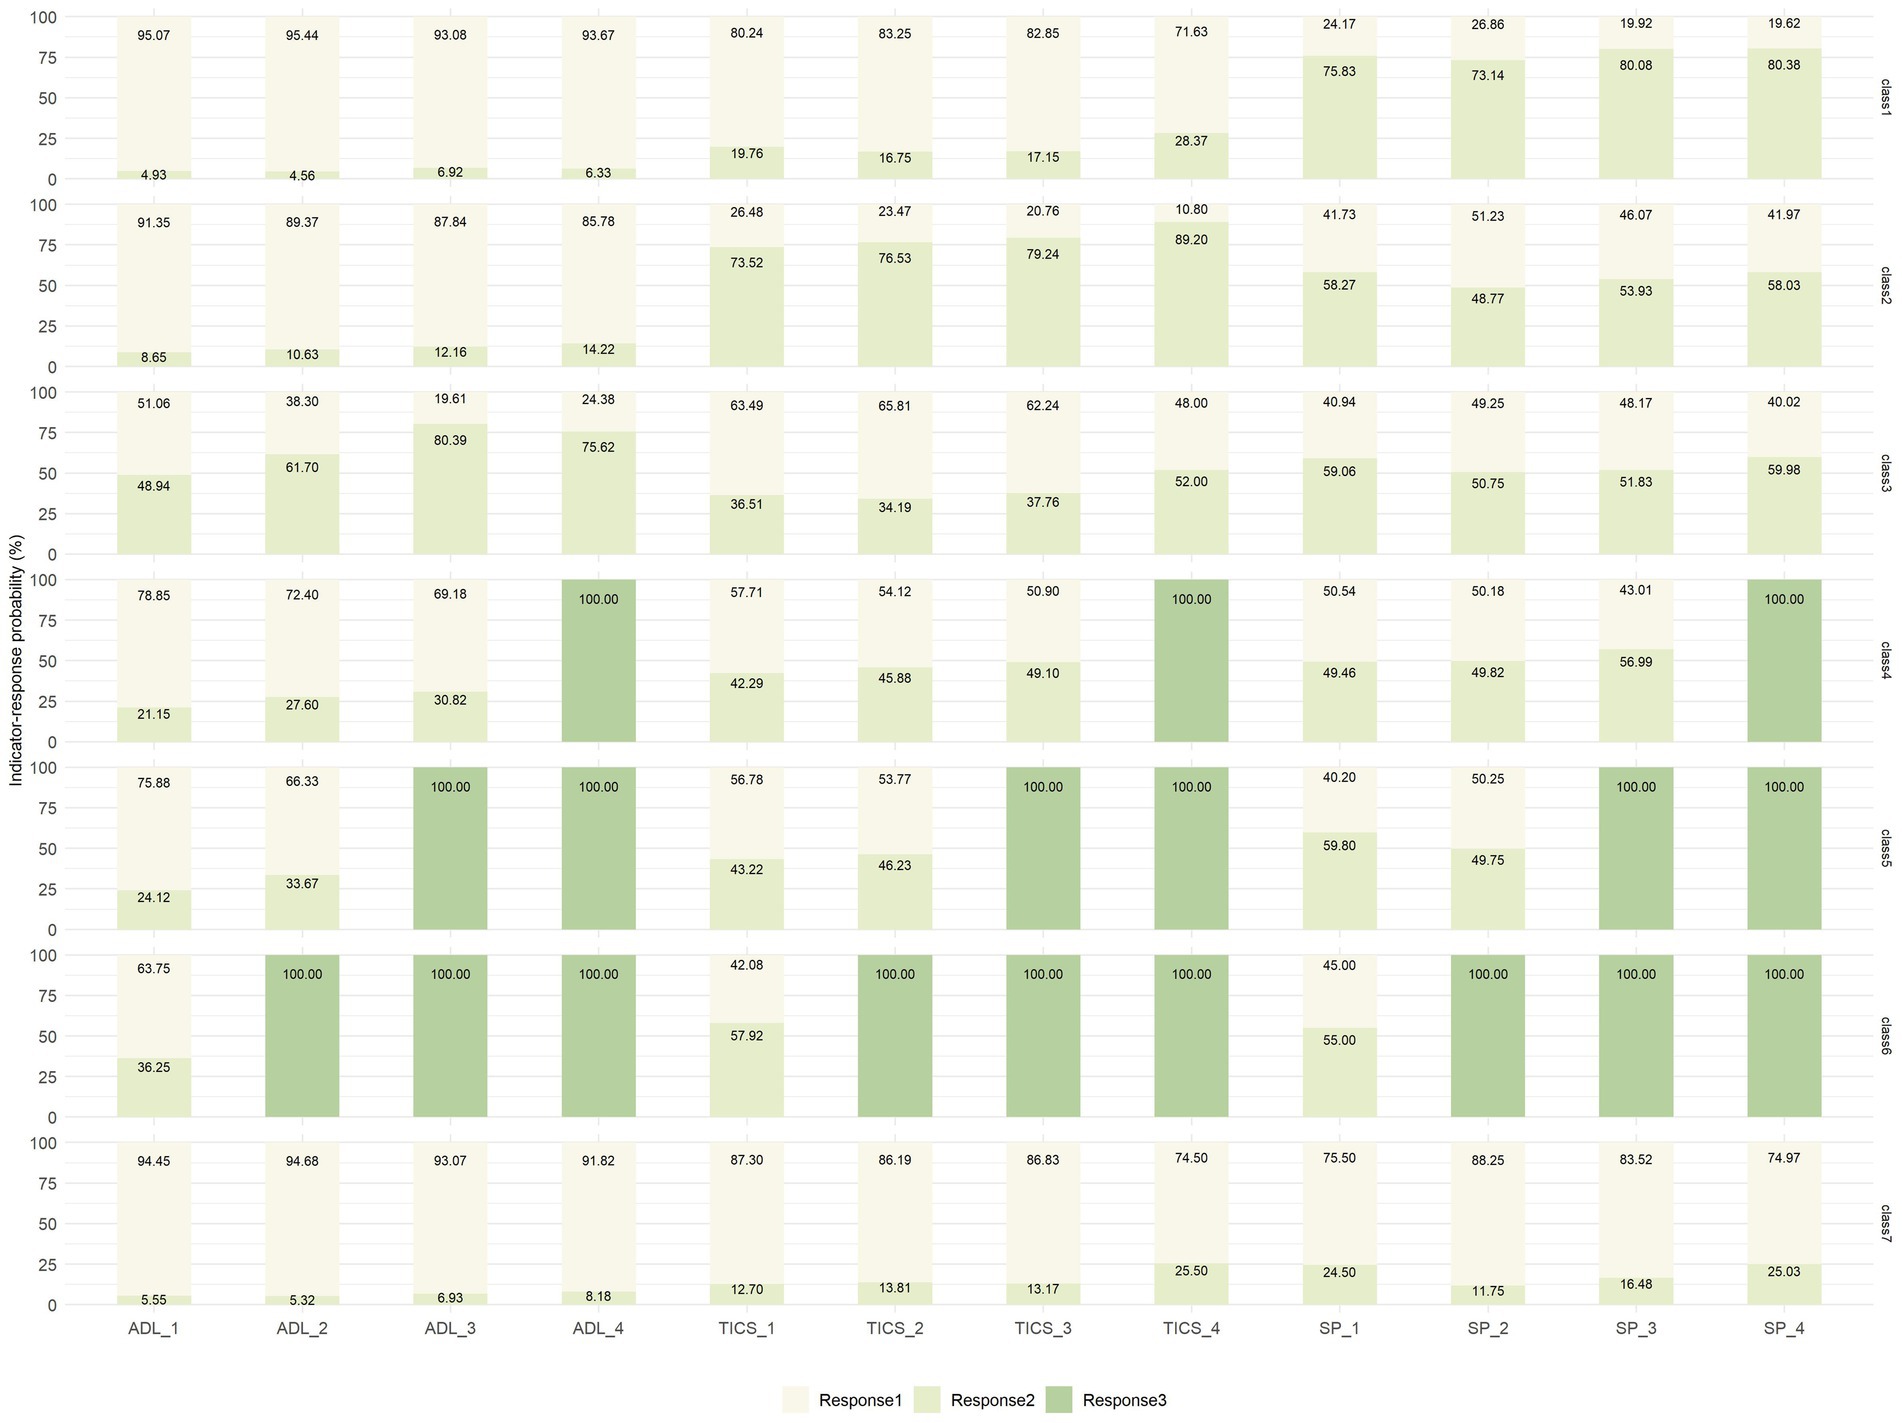
Figure 3. Latent class probability and indicator–response probabilities for the seven classes of health transition patterns. ADL, activities of daily living; TICS, Telephone Interview of Cognitive Status; SP, social participation. For ADL: response 1 = no difficulty, response 2 = with difficulties, response 3 = being dead; for TICS: response 1 = no cognitive problems, response 2 = having cognitive problems, response 3 = being dead; for SP: response 1 = no lacking SP, response 2 = lacking SP, response 3 = being dead. ADL_1–4: measured during the Wave 1–4. TICS and SP are the same as ADL.
3.2 Characteristics of health transition patterns
The labels of latent health transition patterns were defined by comparing indicator–response probabilities (Figure 3). The first class (n = 1,455, 23.62%) was characterized by a high probability of lacking SP, showing a slight decrease followed by an increase (75.83, 73.14, 80.08, and 80.38% in waves 1 to 4, respectively). Meanwhile, the probabilities of having ADLs difficulties (4.93, 4.56, 6.92, and 6.33%, in waves 1 to 4, respectively) and cognitive problems (19.76, 16.75, 17.15, and 28.37% in waves 1 to 4, respectively) were consistently low. Hence, this group was labeled “SP slightly improving followed by deterioration” (SP-ID).
The second class (n = 1,107, 17.97%) tended to have high probabilities of having cognitive problems (73.52, 76.53, 79.24, and 89.20% in waves 1 to 4, respectively), which tended to increase during the study period. The probability of ADLs difficulties (8.65, 10.63, 12.16, and 14.22% in waves 1 to 4, respectively) remained relatively low, but the probabilities of lacking SP also fluctuated around 50% (58.27, 48.77, 53.93, and 58.03% in waves 1 to 4, respectively). Thus, this group was labeled “cognitive status deteriorating gradually and lacking SP” (CS-DG&L-SP).
The third class (n = 563, 9.14%) was prone to high probabilities of having ADLs impairment and a trend of a consistent increase followed by a decrease over the four periods, peaking in wave 3 (48.94, 61.70, 80.39, and 75.62% in waves 1 to 4, respectively). At the same time, the probabilities of having cognitive problems increased significantly (36.51, 34.19, 37.76, and 52.00% in waves 1 to 4, respectively) and lacking SP consistently exceeded 50% (59.06, 50.75, 51.83, and 59.98%, in waves 1 to 4, respectively). Therefore, this group was named “ADLs deteriorating followed by a slight improvement and lacking SP” (ADLs-DI&L-SP).
The fourth, fifth, and sixth classes with a small sample size (n = 279, 4.53%, n = 199, 3.23%, and n = 240, 3.90%, respectively) corresponded to those who died during the follow-up in three waves and represented the outcomes of succumbing to death. Considering the guidelines of the EPV values, we combined the three classes into one group labeled “died in the follow-up period” (DIFP), which accounted for 11.65% (n = 682) of the whole study population. Therefore, this study adopted five groups of health transition patterns after merging the death samples from the seven-class model.
For those respondents in the last class (n = 2,318, 37.62%), the likelihoods of having ADLs difficulties (5.55, 5.32, 6.93, and 8.18% in waves 1 to 4, respectively), having cognitive problems (12.70, 13.81, 13.17, and 25.50% in waves 1 to 4, respectively), lacking SP (24.50, 11.75, 16.48, and 25.03% in waves 1 to 4, respectively) were comparatively low and stable throughout the four waves. Therefore, this group was labeled “sustainedly healthy” (SH).
After replacing physical health indicators, the performance of the RMLCA models with 2–10 classes was reestimated, which showed a similar downward trend as before (Figure 4). The entropy values of the reestimated models with 2–10 classes were also over 0.7, related to 1.000, 0.772, 0.789, 0.768, 0.765, 0.773, 0.749, 0.748, and 0.732, respectively. Given the similar results to the original sample, the seven-class model was chosen again. In addition, each health transition pattern was almost identical in characteristics and proportion to the original RMLCA classification (Figure 5). Hence, according to the different characteristics of indicator–response probabilities among different classes, the labels of reestimated seven classes could be defined to the similar labels of raw seven classes. Moreover, the proportions of reestimated seven classes (27.76, 17.49, 7.46, 4.28, 3.18, 3.89, 35.93%) were close to that of raw seven classes.
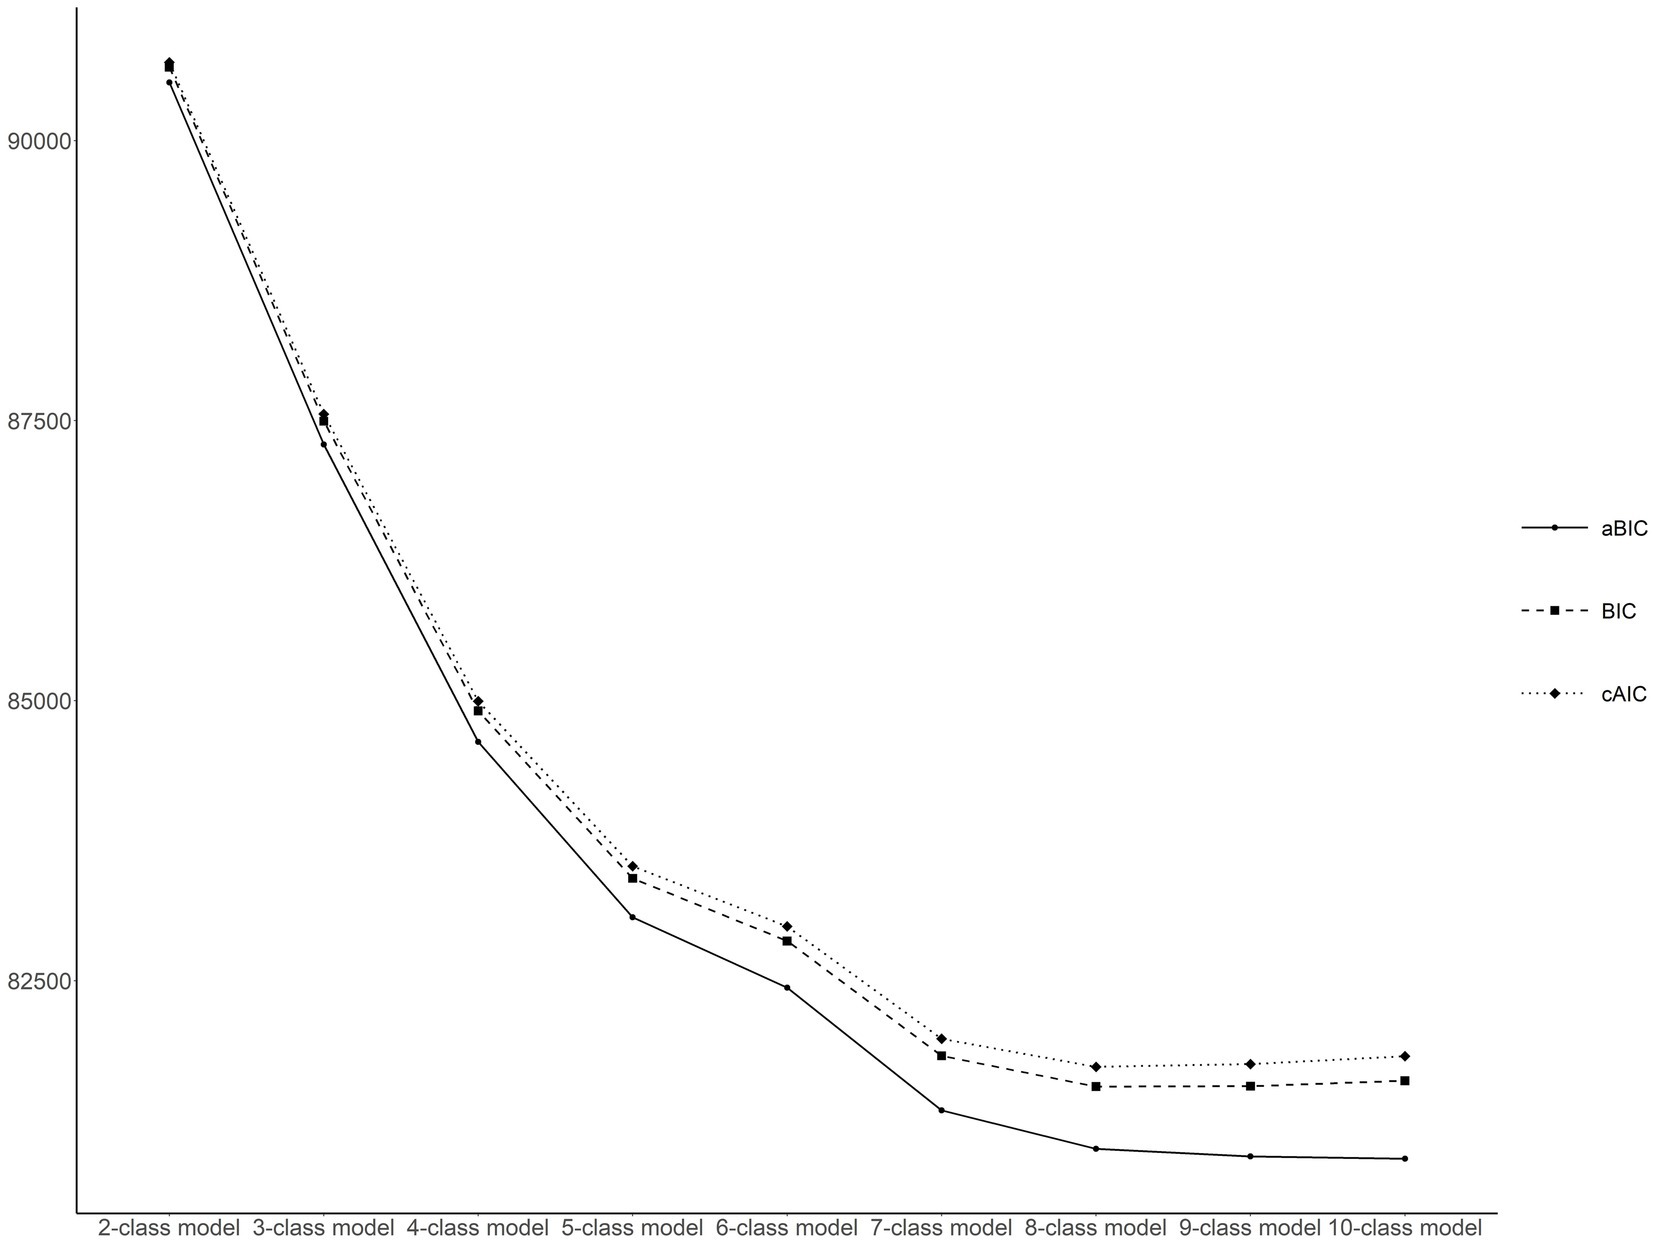
Figure 4. Latent class model and fit indices after replacing health variables. BIC, Bayesian information criterion; aBIC, adjusted Bayesian information criterion; cAIC, consistent Akaike’s information criterion.
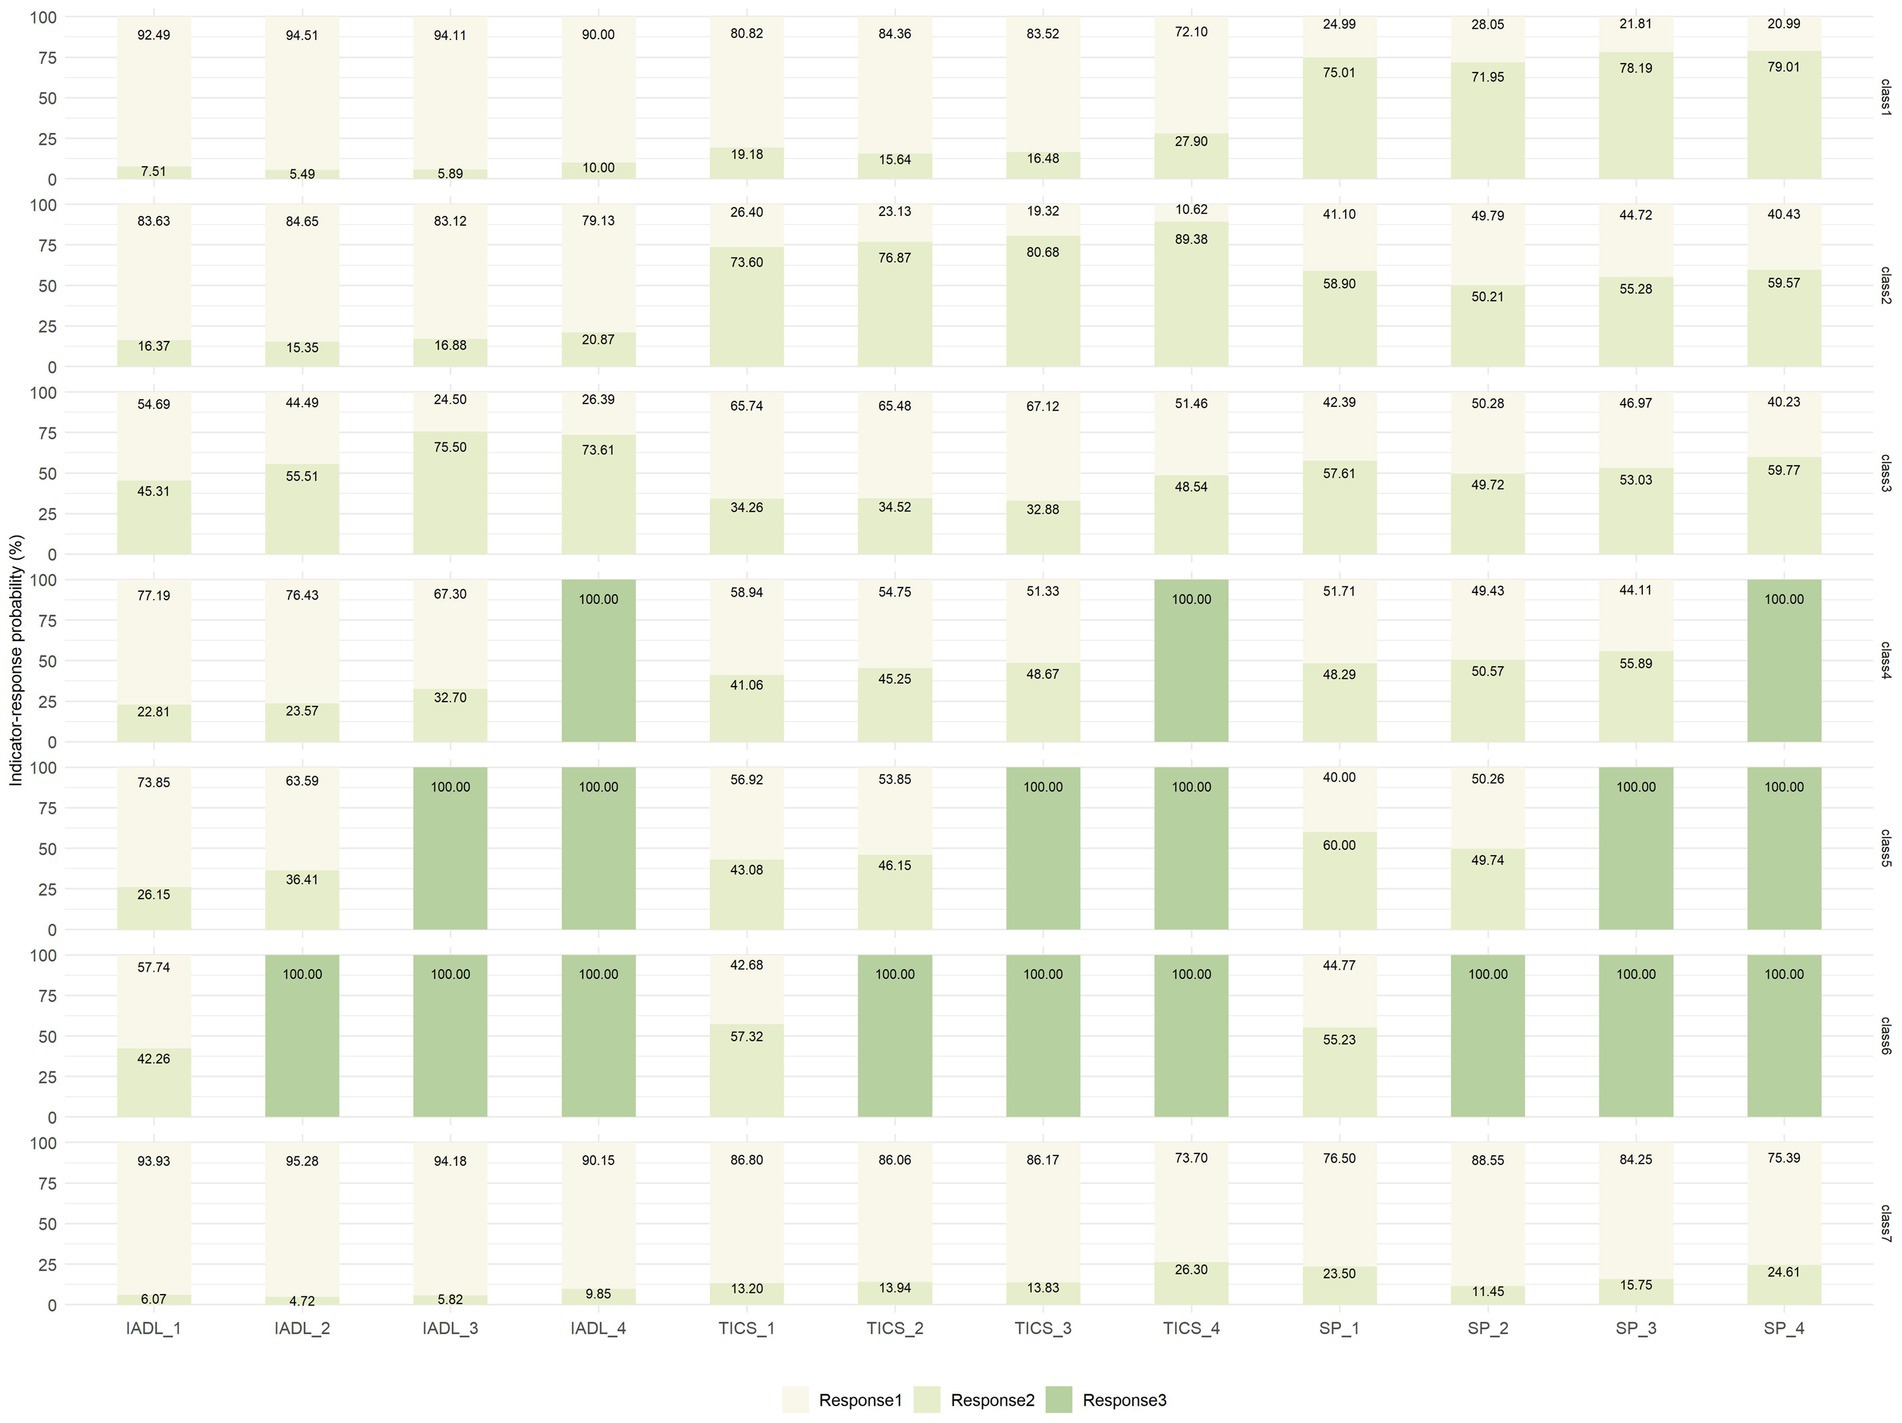
Figure 5. Latent class probability and indicator-response probabilities after replacing health variables. ADL, activities of daily living; TICS, Telephone Interview of Cognitive Status; SP, social participation; For IADL: response 1 = no difficulty, response 2 = with difficulties, response 3 = being dead; for TICS: response 1 = no cognitive problems, response 2 = having cognitive problems, response 3 = being dead; for SP: response 1 = no lacking SP, response 2 = lacking SP, response 3 = being dead. IADL_1–4: measured during the Wave 1–4. TICS and SP are the same as IADL.
After including those respondents with complete health information or only having one missing health information, we covered 8,780 respondents, which was more than the original sample size of 6,161. The performance of the RMLCA models with 2–10 classes was reestimated again (Figure 6). It showed the downward trend gradually leveled off after the eight-classes model rather than seven-class model as before. The entropy values of those models were also over 0.7, corresponding to 1.000, 0.790, 0.805, 0.773, 0.782, 0.751, 0.757, 0.746, and 0.738, respectively. The indicator–response probabilities of eight class were shown in Figure 7. Except for the last class (n = 1,147, 13.06%), the characteristics of indicator–response probabilities among the other seven classes were similar to the raw seven classes. In addition, the proportions of reestimated first, fourth, fifth, and sixth classes (23.05, 4.16, 3.20, and 3.86%) were close to raw related classes, and the proportions of reestimated second and seventh classes (14.10 and 28.21%) were lower than raw related classes, while the proportion of reestimated third class (10.35%) was higher than raw related classes. Although the larger sample size led to a greater number of classes of health transition patterns, the structures and partitions of health transition patterns were still similar to the original results.
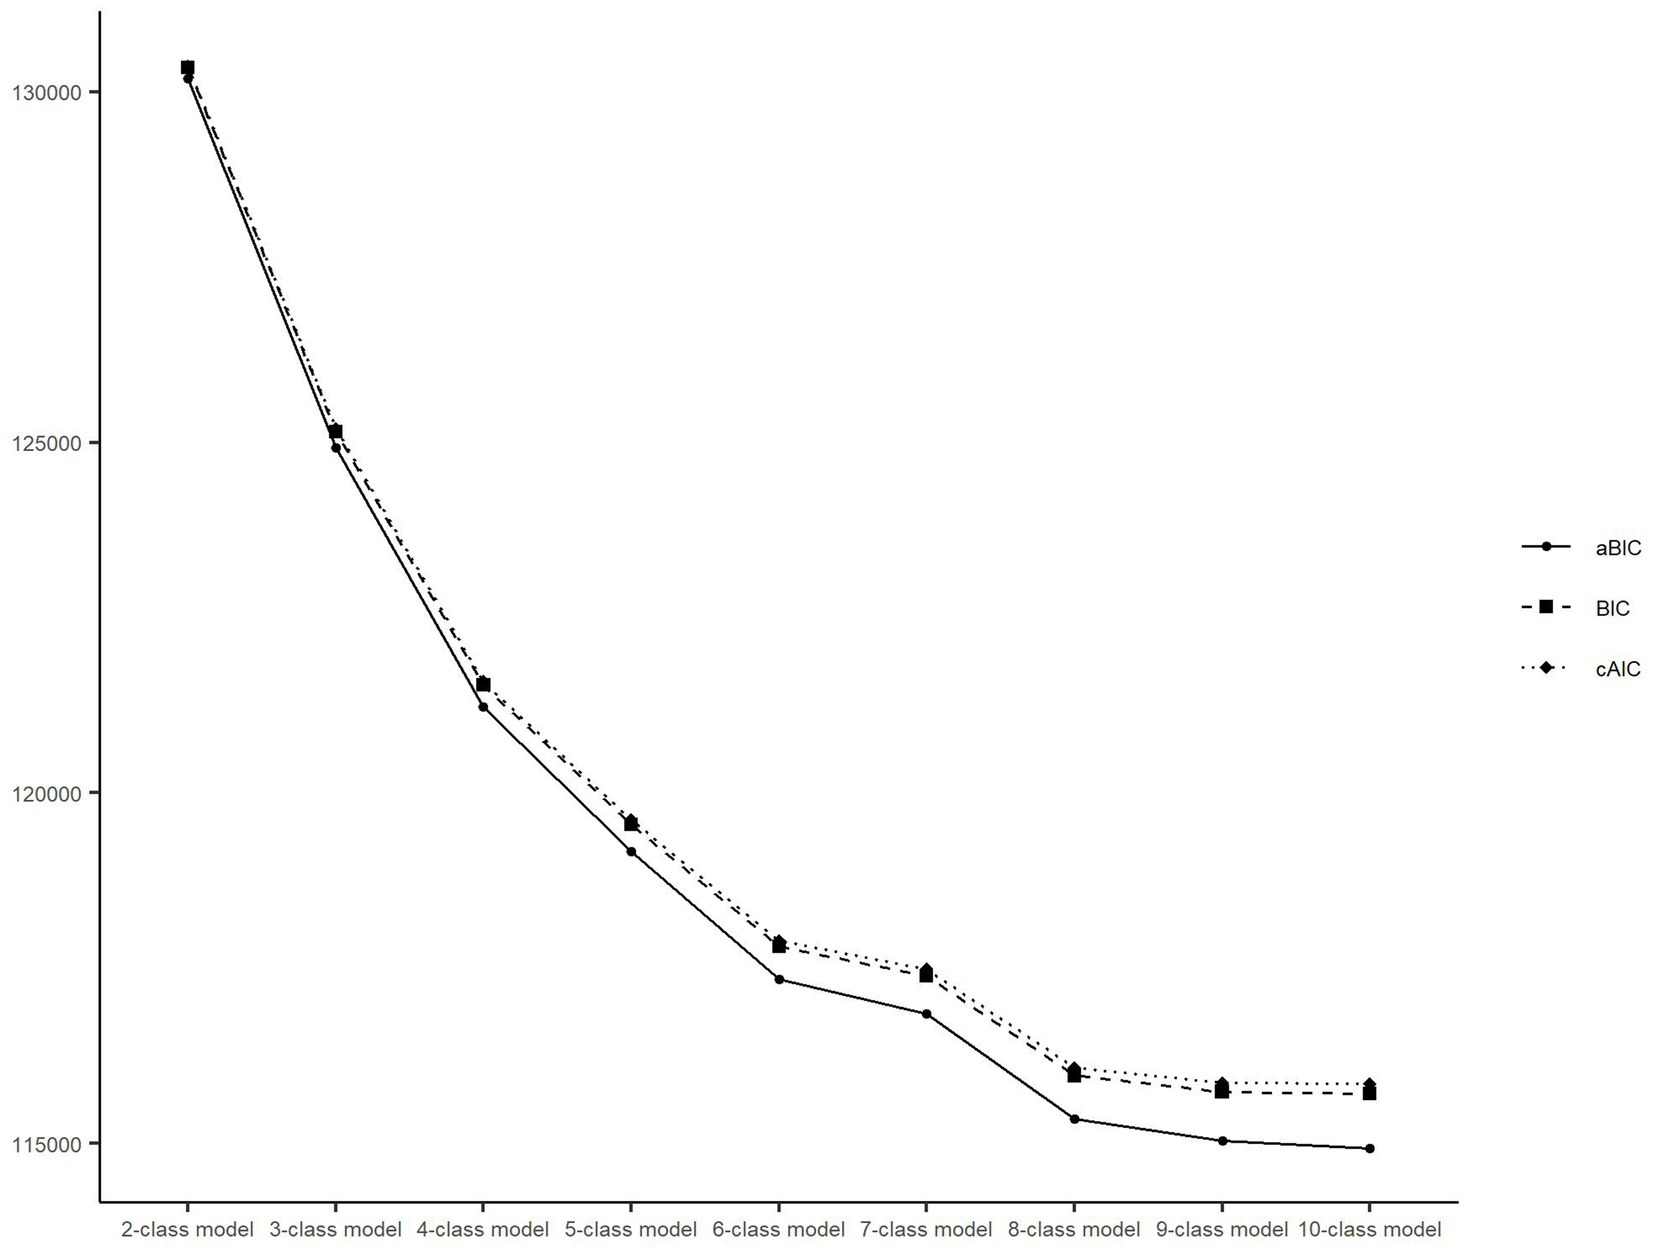
Figure 6. Latent class model and fit indices after including respondents with complete health information or only having one missing health information. BIC, Bayesian information criterion; aBIC, adjusted Bayesian information criterion; cAIC, consistent Akaike’s information criterion.
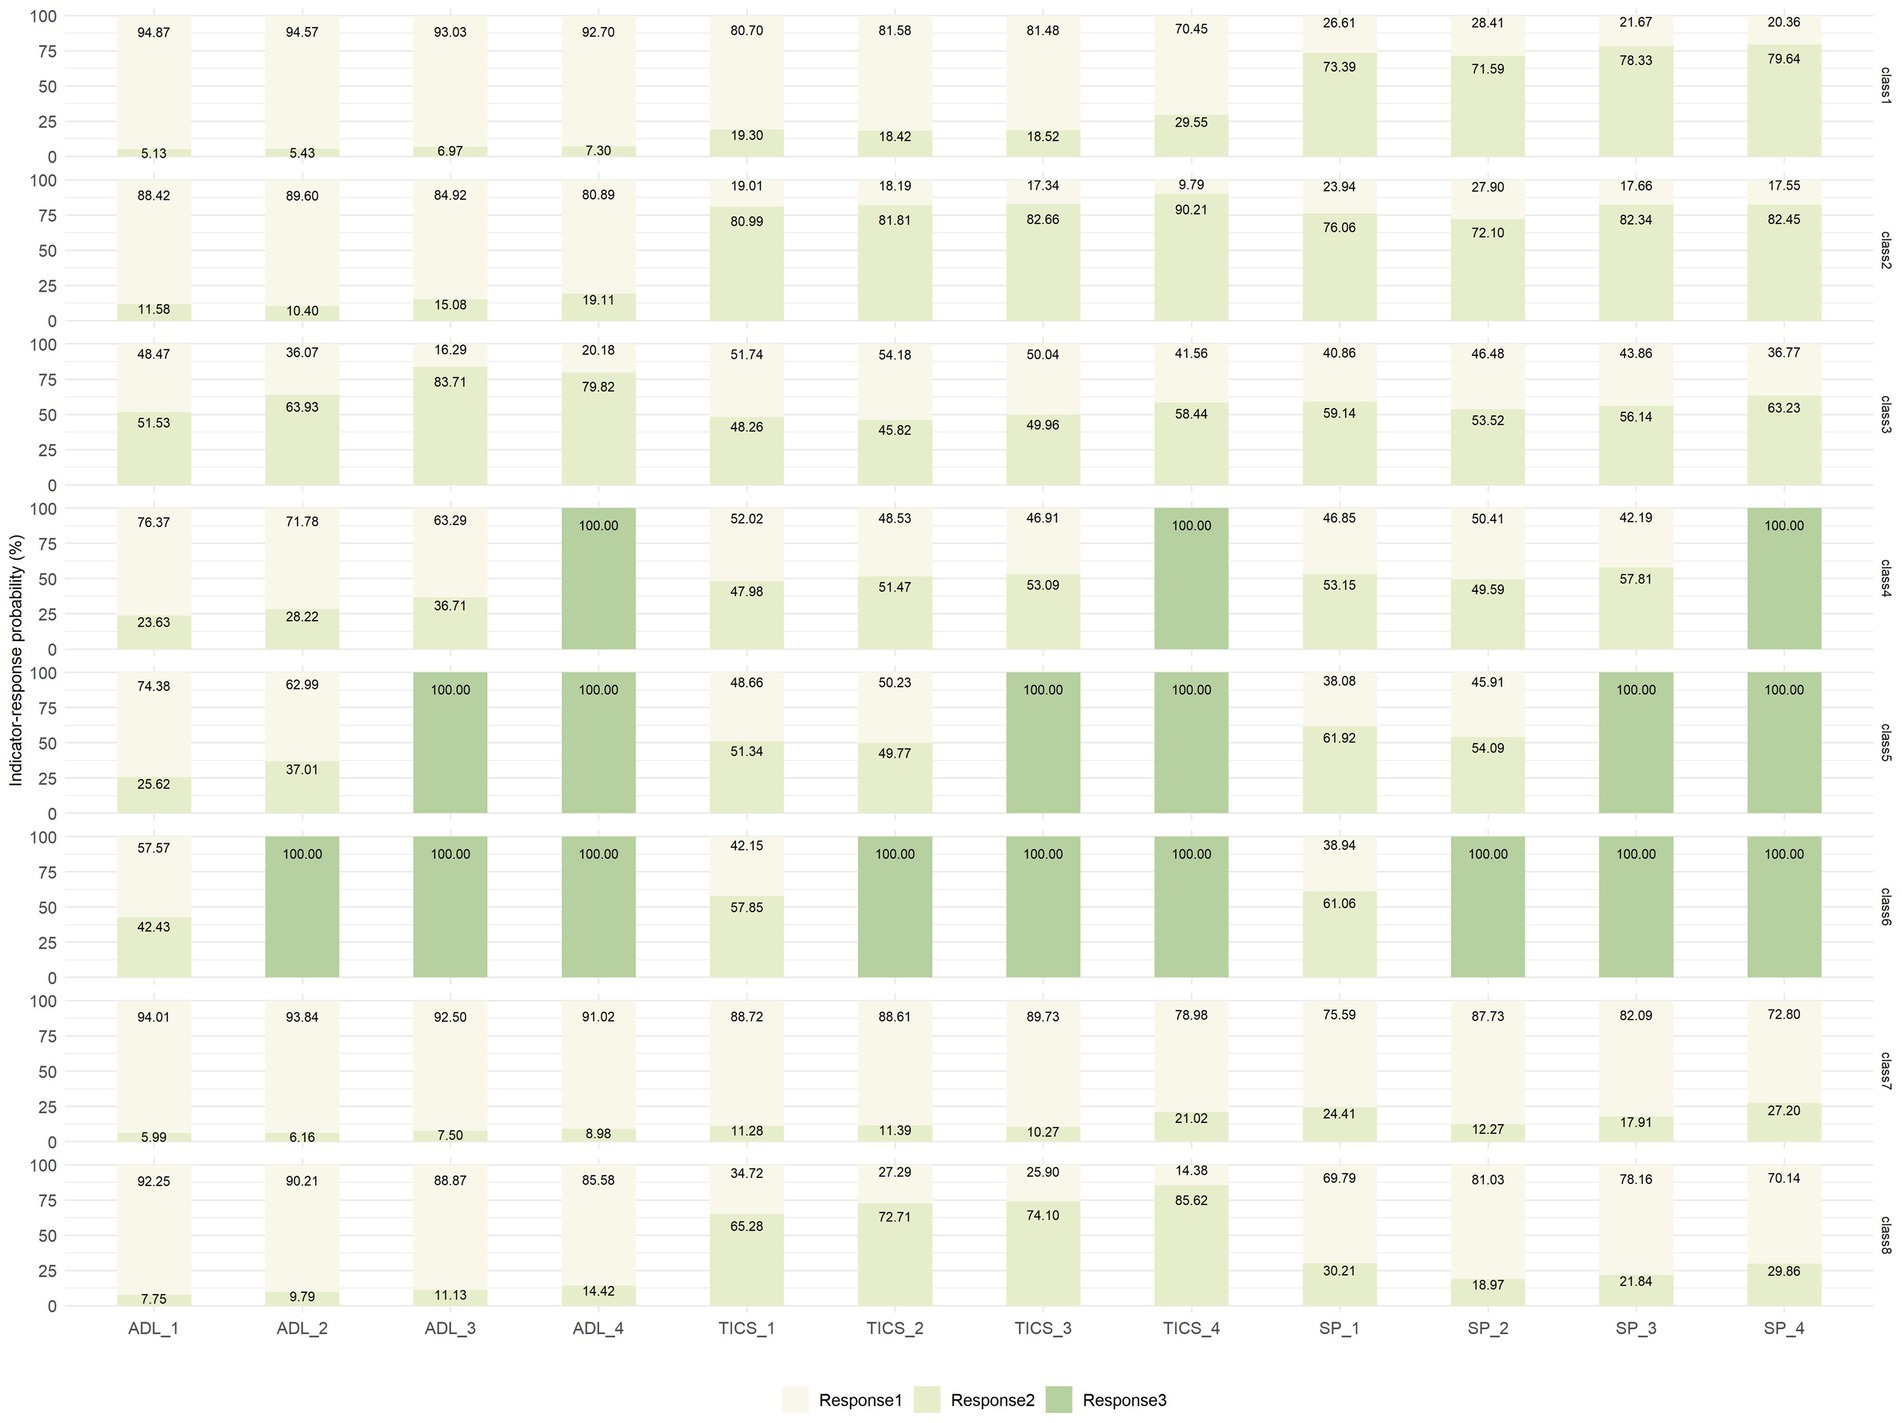
Figure 7. Latent class probability and indicator–response probabilities after respondents with including complete health information or only having one missing health information. ADL, activities of daily living; TICS, Telephone Interview of Cognitive Status; SP, social participation; For IADL: response 1 = no difficulty, response 2 = with difficulties, response 3 = being dead; for TICS: response 1 = no cognitive problems, response 2 = having cognitive problems, response 3 = being dead; for SP: response 1 = no lacking SP, response 2 = lacking SP, response 3 = being dead. IADL_1–4: measured during the Wave 1–4. TICS and SP are the same as IADL.
3.3 Associations between latent health transition patterns and covariates
Table 3 presents the characteristics of the respondents in different health transition groups in 2011. There were significant differences in predisposing, enabling, and health behaviors. For predisposing factors, the proportion of 45–54 years old (40.1%) was the highest among all age groups, and the proportion of elderly people aged 65 and above was higher in the other groups than in the SH group. Males and females accounted for 46.58 and 53.42% respectively, but the proportions of males in CS-DG&L-SP and ADLs-DI&L-SP groups (38.4 and 44.8%, respectively) were lower than that of females (61.6 and 55.2%, respectively). Nearly a tenth of the respondents (9.8%) were illiterate, which proportions in CS-DG&L-SP and DIFP groups (22.6 and 22.4%, respectively) were higher than other groups. The job of approximately two fifths of the respondents (39.5%) were agriculture, and its proportion in CS-DG&L-SP group (51.7%) was the highest among all health transition groups. Only 9% of the respondents were not in marriage, which proportion in DIFP group (21.6%) was higher than other groups. For enabling factors, 4.5% live alone, and its proportion in DIFP group (11.0%) was the only one higher than the mean rate of all samples. Almost three-fifths (58.3%) were rural, and its proportion in SH groups (49.4%) were the only one lower than the sample mean. The proportion of all samples living in the eastern (31.9%) was highest among all regions, but region with the highest proportion in the CS-DG&L-SP, ADLs-DI&L-SP, and DIFP groups was western (36.0, 35.2, and 35.1%, respectively). Only 6.2% did not have public health insurance, which proportion in DIFP group (9.2%) was the higher than other groups. For health behaviors, about one-third of the respondents smoked, and its proportion in DIFP group (40.5%) was the highest among all groups. Over one-third of the respondents drank (34.1%), and its proportion in SH and SP-ID group (39.2 and 34.7%, respectively) was higher than the mean rate of all samples.
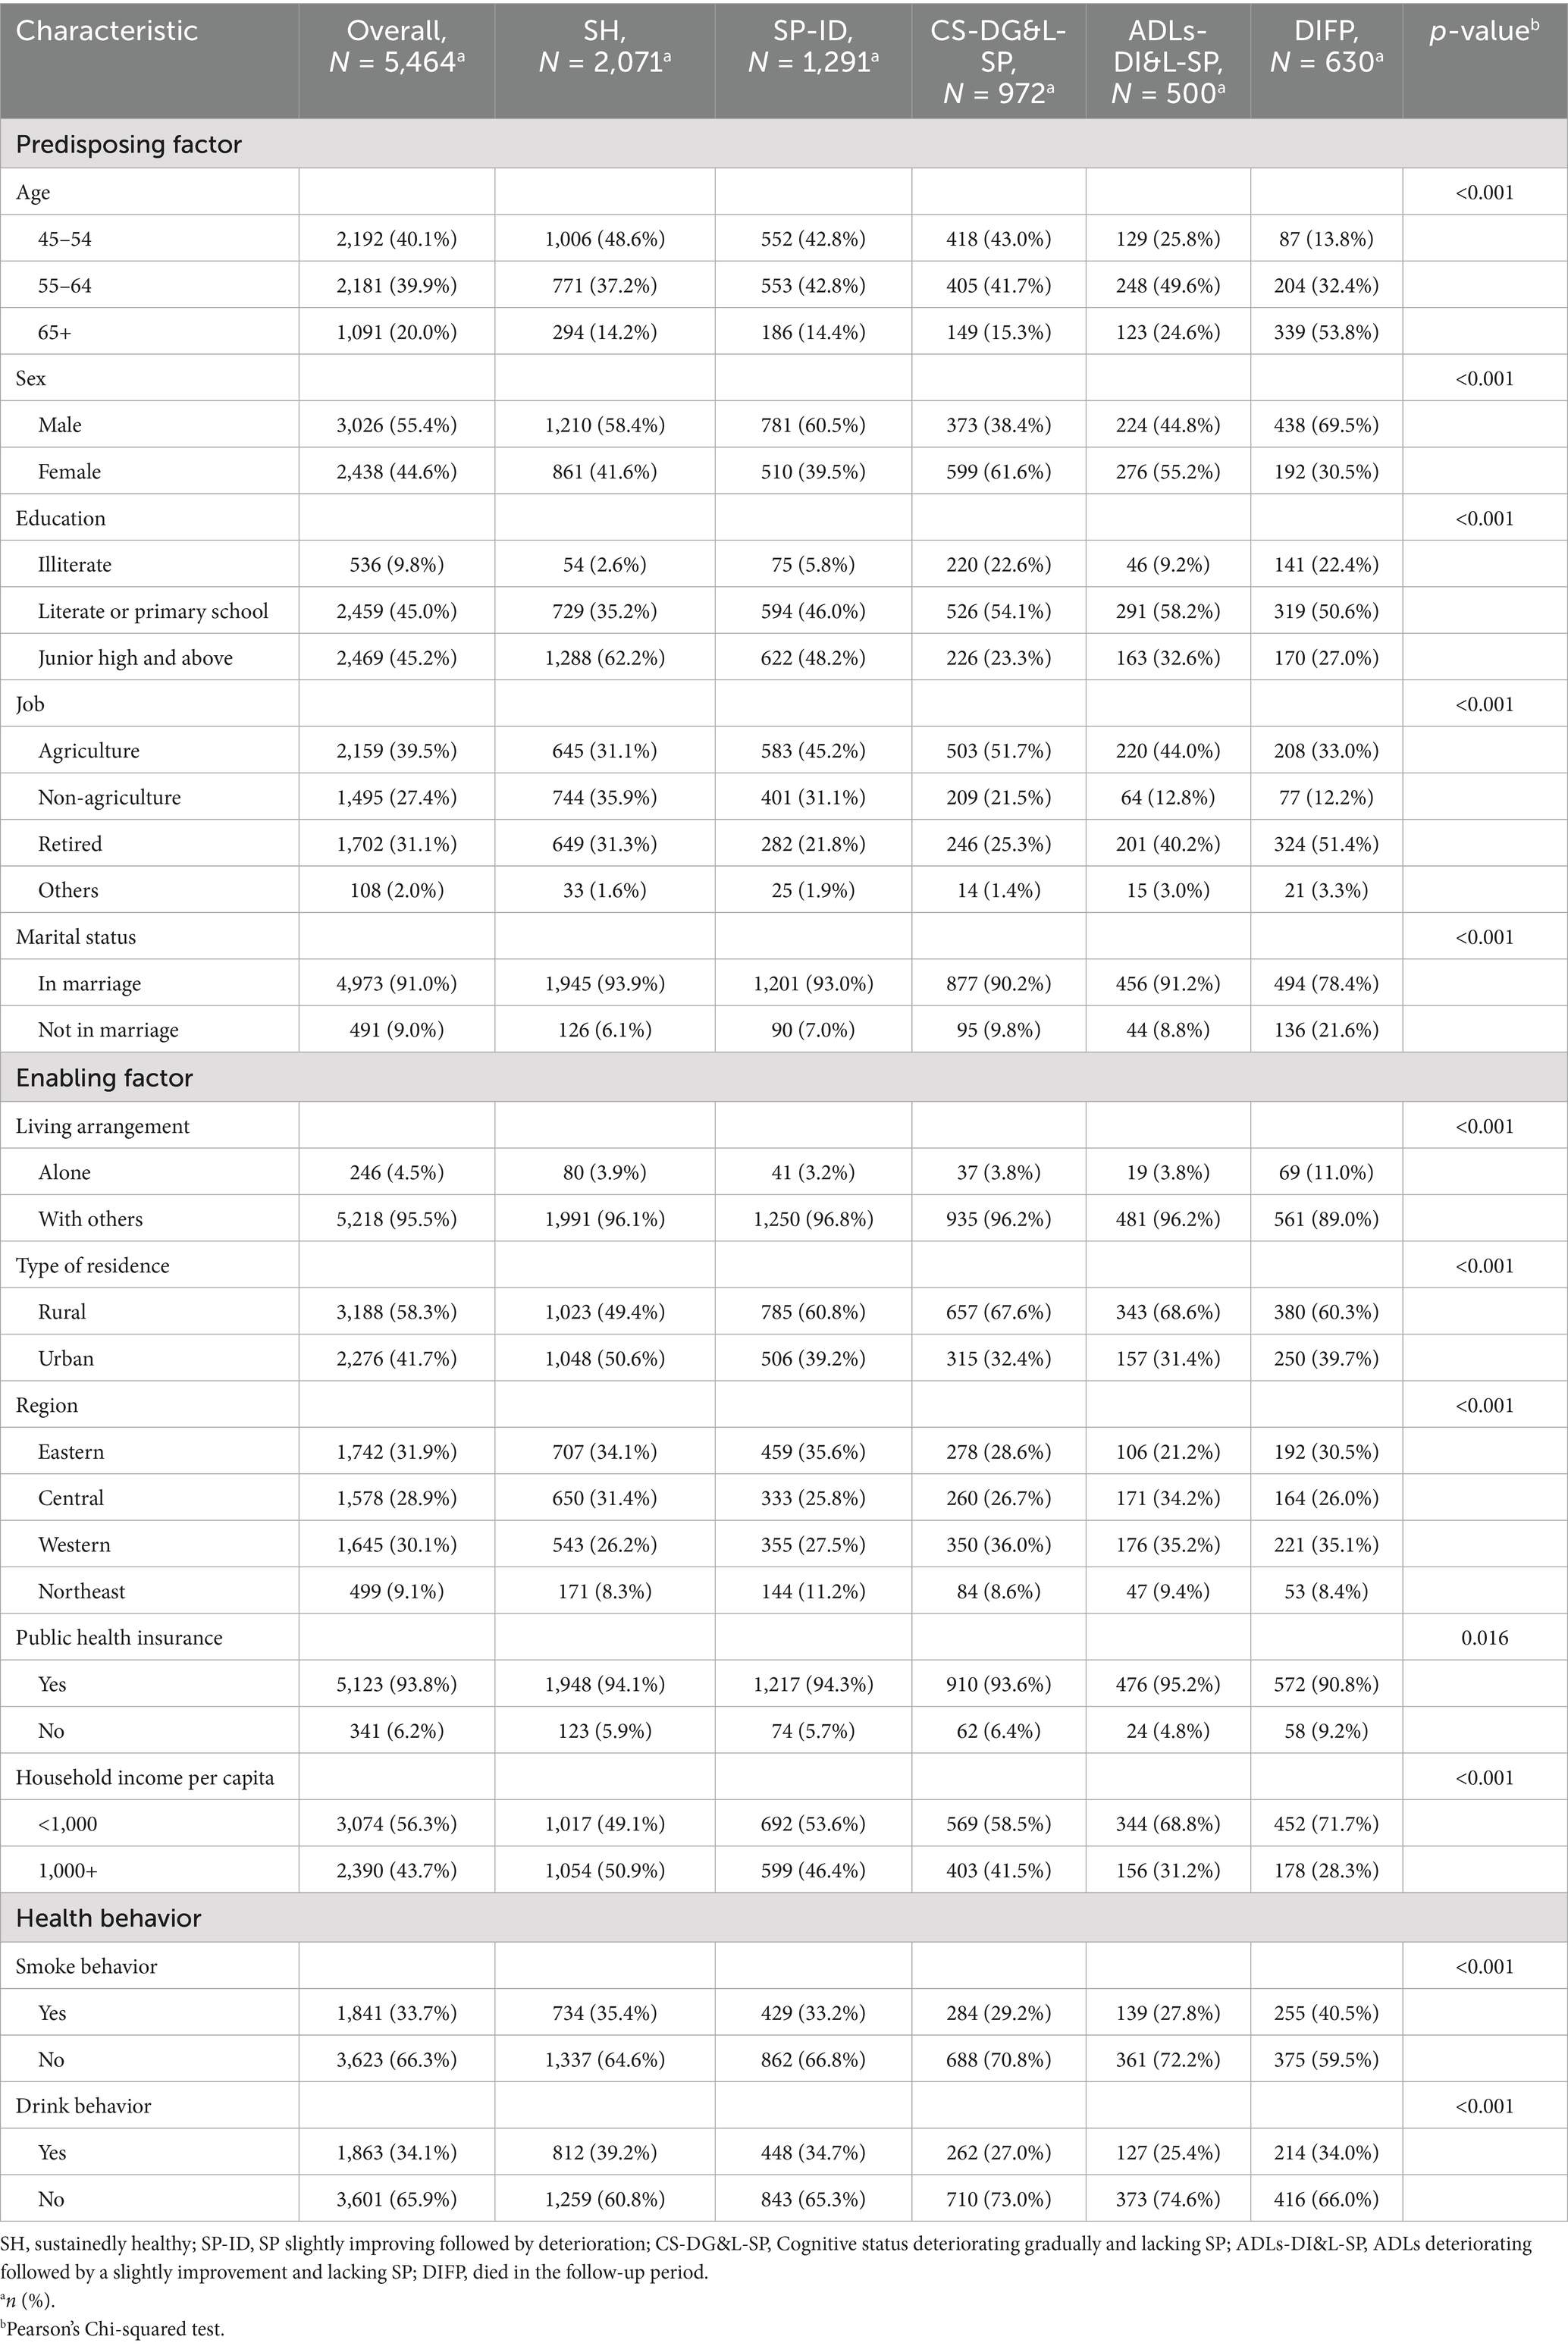
Table 3. Baseline characteristics of respondents in the five latent health transition groups.
Table 4 presents the multinomial logistic regression results concerning the relationships between baseline characteristics and latent health transition groups. The SH group was considered the reference group in the multinomial logistic regression because it represented a relatively good and stable multidimensional health transition pattern during the study period. Except for living arrangement, other covariates have significantly impact on transition patterns. Especially, sex, education, job, type of residence, and region played different roles in different transition patterns.
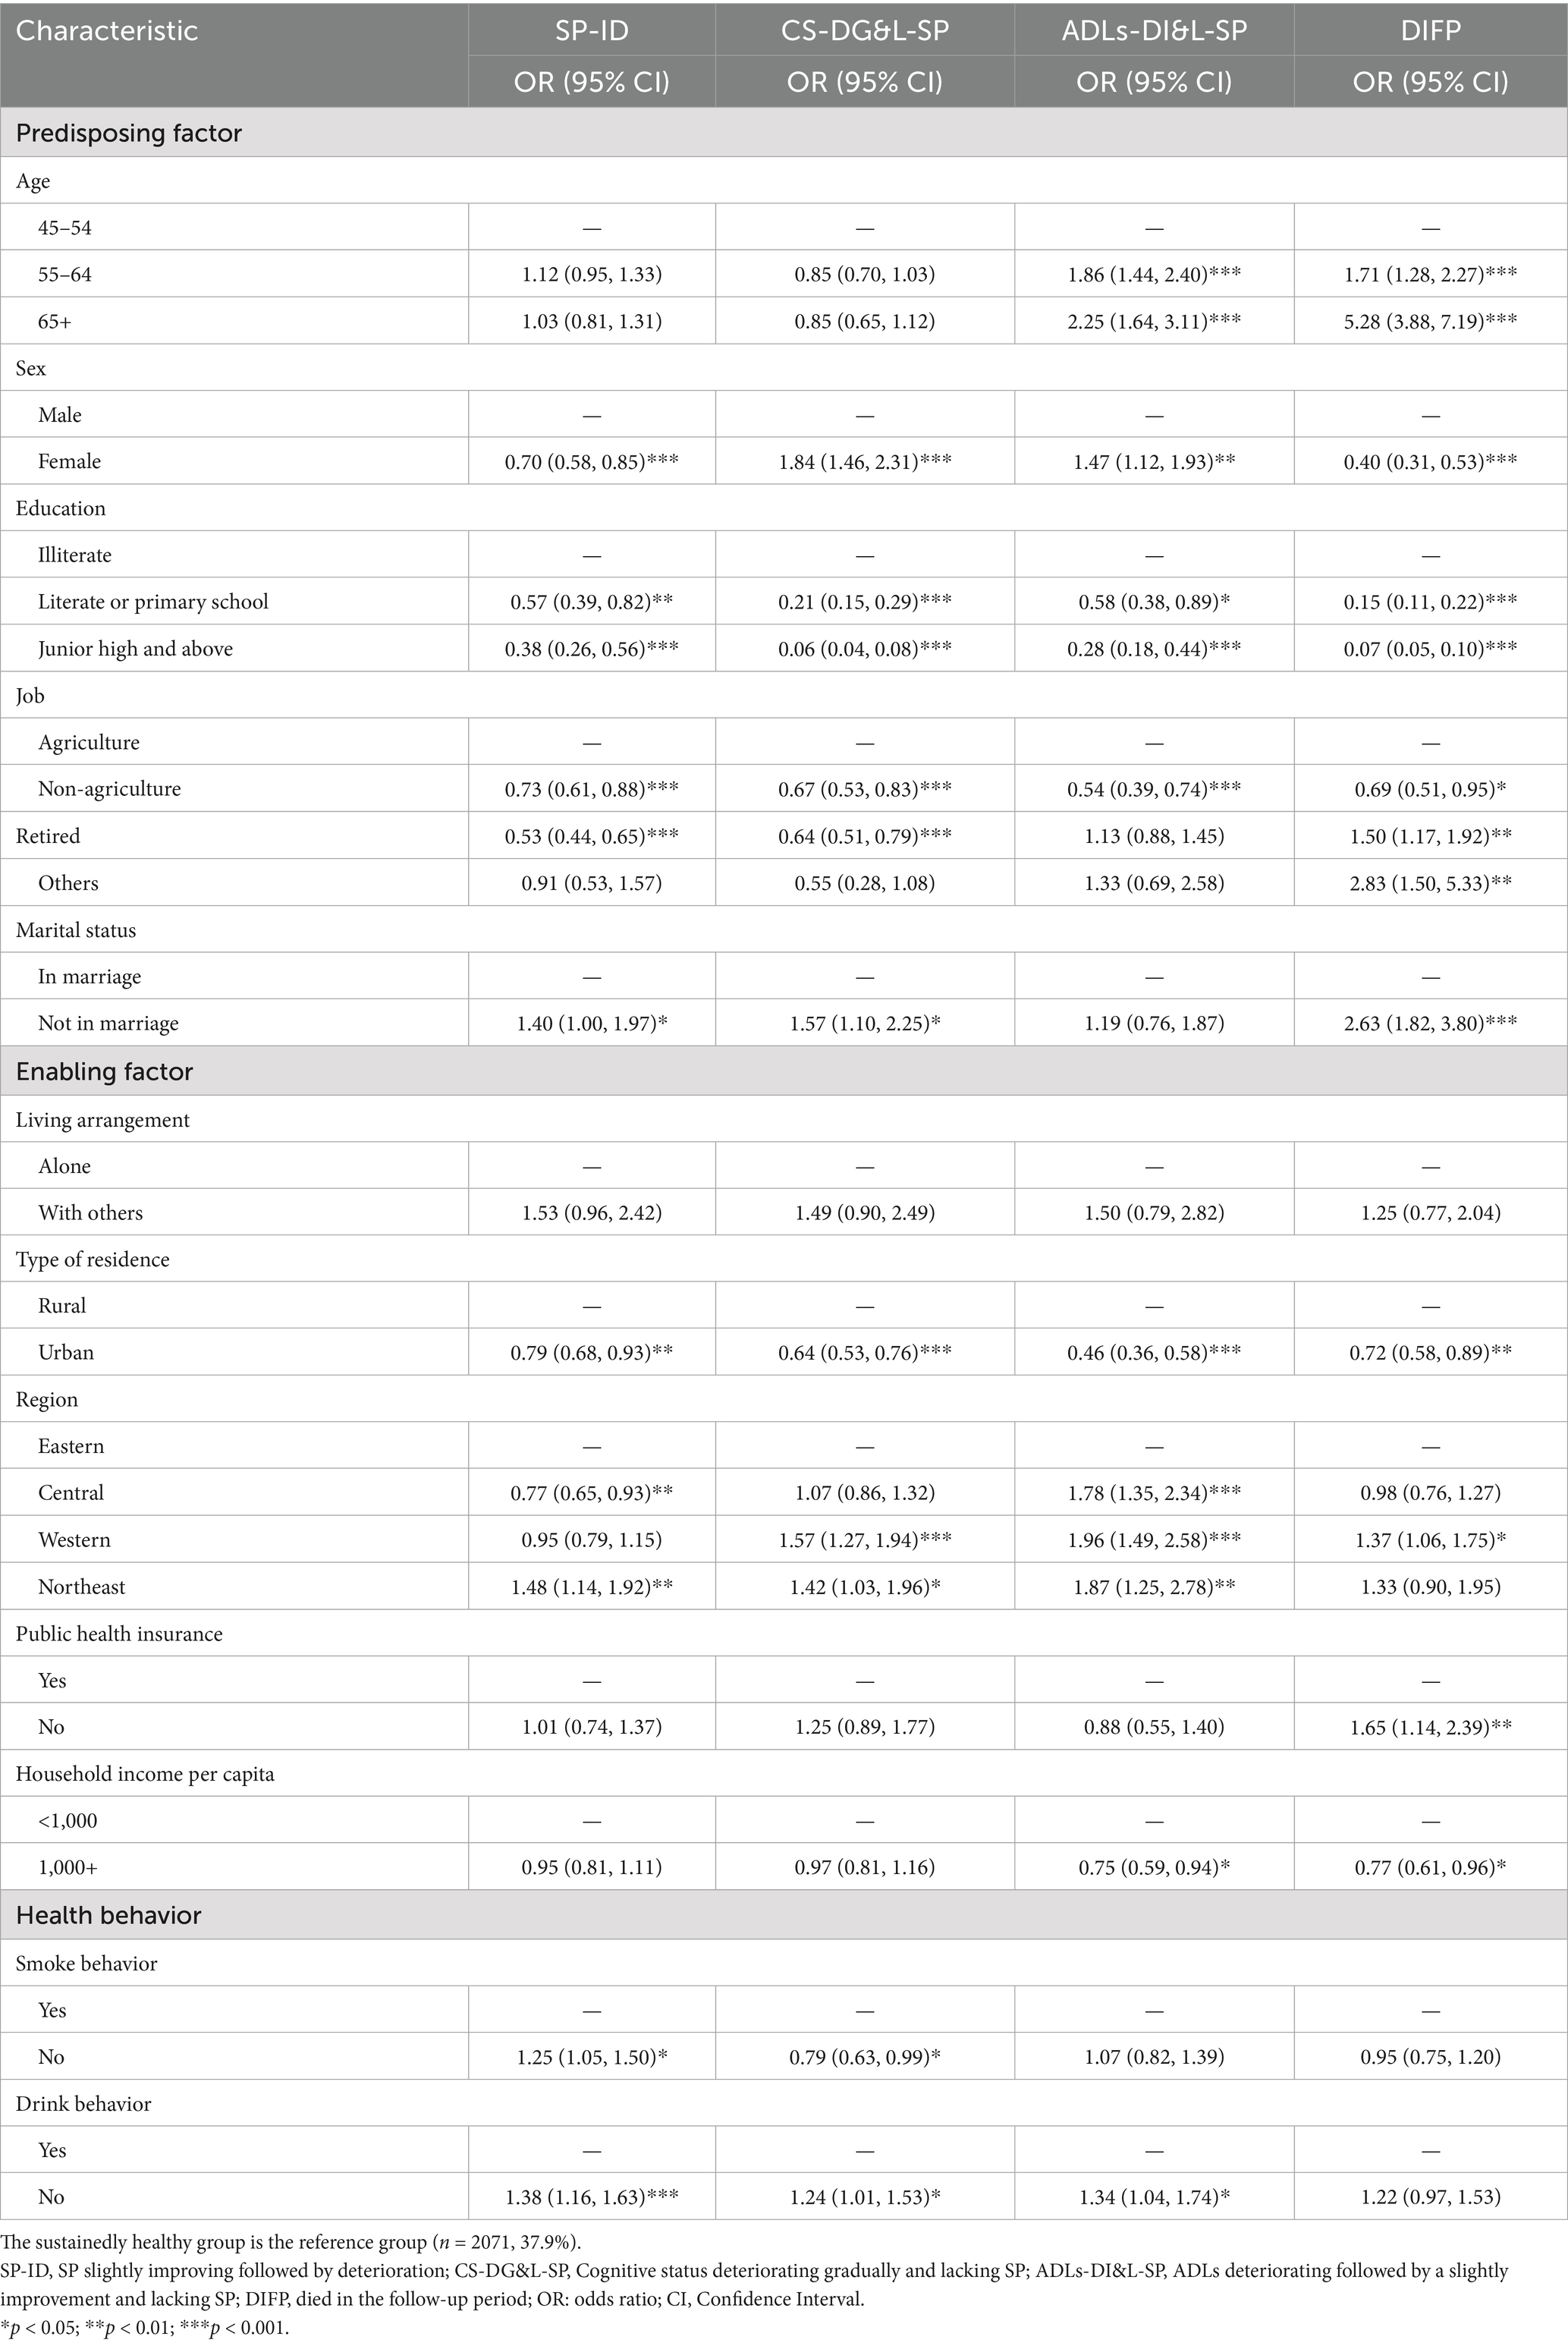
Table 4. Associations of baseline characteristics in the five latent health transition groups by multivariable logistic regression.
Age at baseline was positively associated with being classified in the ADLs-DI&L-SP, and DIFP groups. Compared to people aged 45–54, those over 55 were more likely to be in the DIFP and ADLs-DI&L-SP groups. Being a female was a protective factor for the SP-ID and DIFP groups (odds ratio [OR] = 0.70, confidence interval [CI]: 0.58–0.85 and OR = 0.40, CI: 0.31–0.53, respectively), but a risk factor for the CS-DG&L-SP and ADLs-DI&L-SP groups (OR = 1.84, CI: 1.46–2.31 and OR = 1.47, CI: 1.21–1.93, respectively) compared with males. Participants with a higher level of education were less likely to fall into the four non-healthy groups. In particular, those with an educational level of junior high and above were the least likely to experience deterioration in cognitive status (OR = 0.06, CI: 0.04–0.08). People working in non-agricultural sectors were less prone to health deterioration or death. Being retired at baseline was negatively associated with falling into the SP-ID and CS-DG&L-SP groups (OR = 0.53, CI: 0.44–0.65 and OR = 0.64, CI: 0.51–0.79, respectively). However, retirement or engagement in other works was positively associated with death during the follow-up period (OR = 1.50, CI: 1.17–1.92 and OR = 2.83, CI: 1.50–5.33, respectively). Those being not in marriage were prone to be assigned to the SP-ID, CS-DG&L-SP, and DIFP groups (OR = 1.40, CI: 1.00–1.97, OR = 1.57, CI: 1.10–2.25, and OR = 2.63, CI: 1.82–3.80, respectively).
Participants in urban areas were less likely to be classified as having health deterioration or succumbing to death than those in rural areas. Those in central regions tended to be less likely to be in the SP-ID group (OR = 0.77, CI: 0.65–0.93) and more likely to be in the ADLs-DI&L-SP group (OR = 1.78, CI: 1.35–2.34) than eastern regions. The likelihood of being in the CS-GD&L-SP, ADLs-DI&L-SP, and DIFP groups was higher in the western regions than in the eastern regions (OR = 1.57, CI: 1.27–1.94, OR = 1.96, CI: 1.49–2.58, and OR = 1.37, CI: 1.06–1.75, respectively). Furthermore, those living in the northeast regions had a higher likelihood of falling into the SP-ID, CS-DG&L-SP, and ADLs-DI&L-SP groups than those in the eastern regions (OR = 1.48, CI: 1.14–1.92, OR = 1.42, CI: 1.03–1.96, and OR = 1.87, CI: 1.25–2.78, respectively). Having public health insurance was associated with lower a risk of death during the follow-up period (OR = 1.65, CI: 1.14–2.39). Those with a household income per capita of ≥1,000 yuan were less likely to be in the ADLs-DI&L-SP and DIFP groups than in the SH group (OR = 0.75, CI: 0.59–0.94, and OR = 0.77, CI: 0.61–0.96, respectively).
Those who did not smoke were more likely to be in the SP-ID group but had a lower risk of falling into the CS-DG&L-SP group (OR = 1.25, CI: 1.05–1.50, OR = 0.79, CI: 0.63–0.99, respectively). People without drinking habits were more likely to experience health deterioration than those with drinking habits.
In the robustness analyses, the multinomial logistic regression for retaining seven classes showed stable associations between baseline characteristics and health transition classes, as presented in the (Tables 5, 6). In addition, based on the RMLCA of replacement physical health indicators, we ran a multinomial logistic regression on the classification of combined death samples and all health transition classes, respectively. Similar results were also observed (Tables 7–10). However, the relationship between marital status and the cognitive and social deterioration groups was no longer significant. In addition, the participants’ gender and residence in central regions did not significantly affect the IADLs-DI&L-SP group.
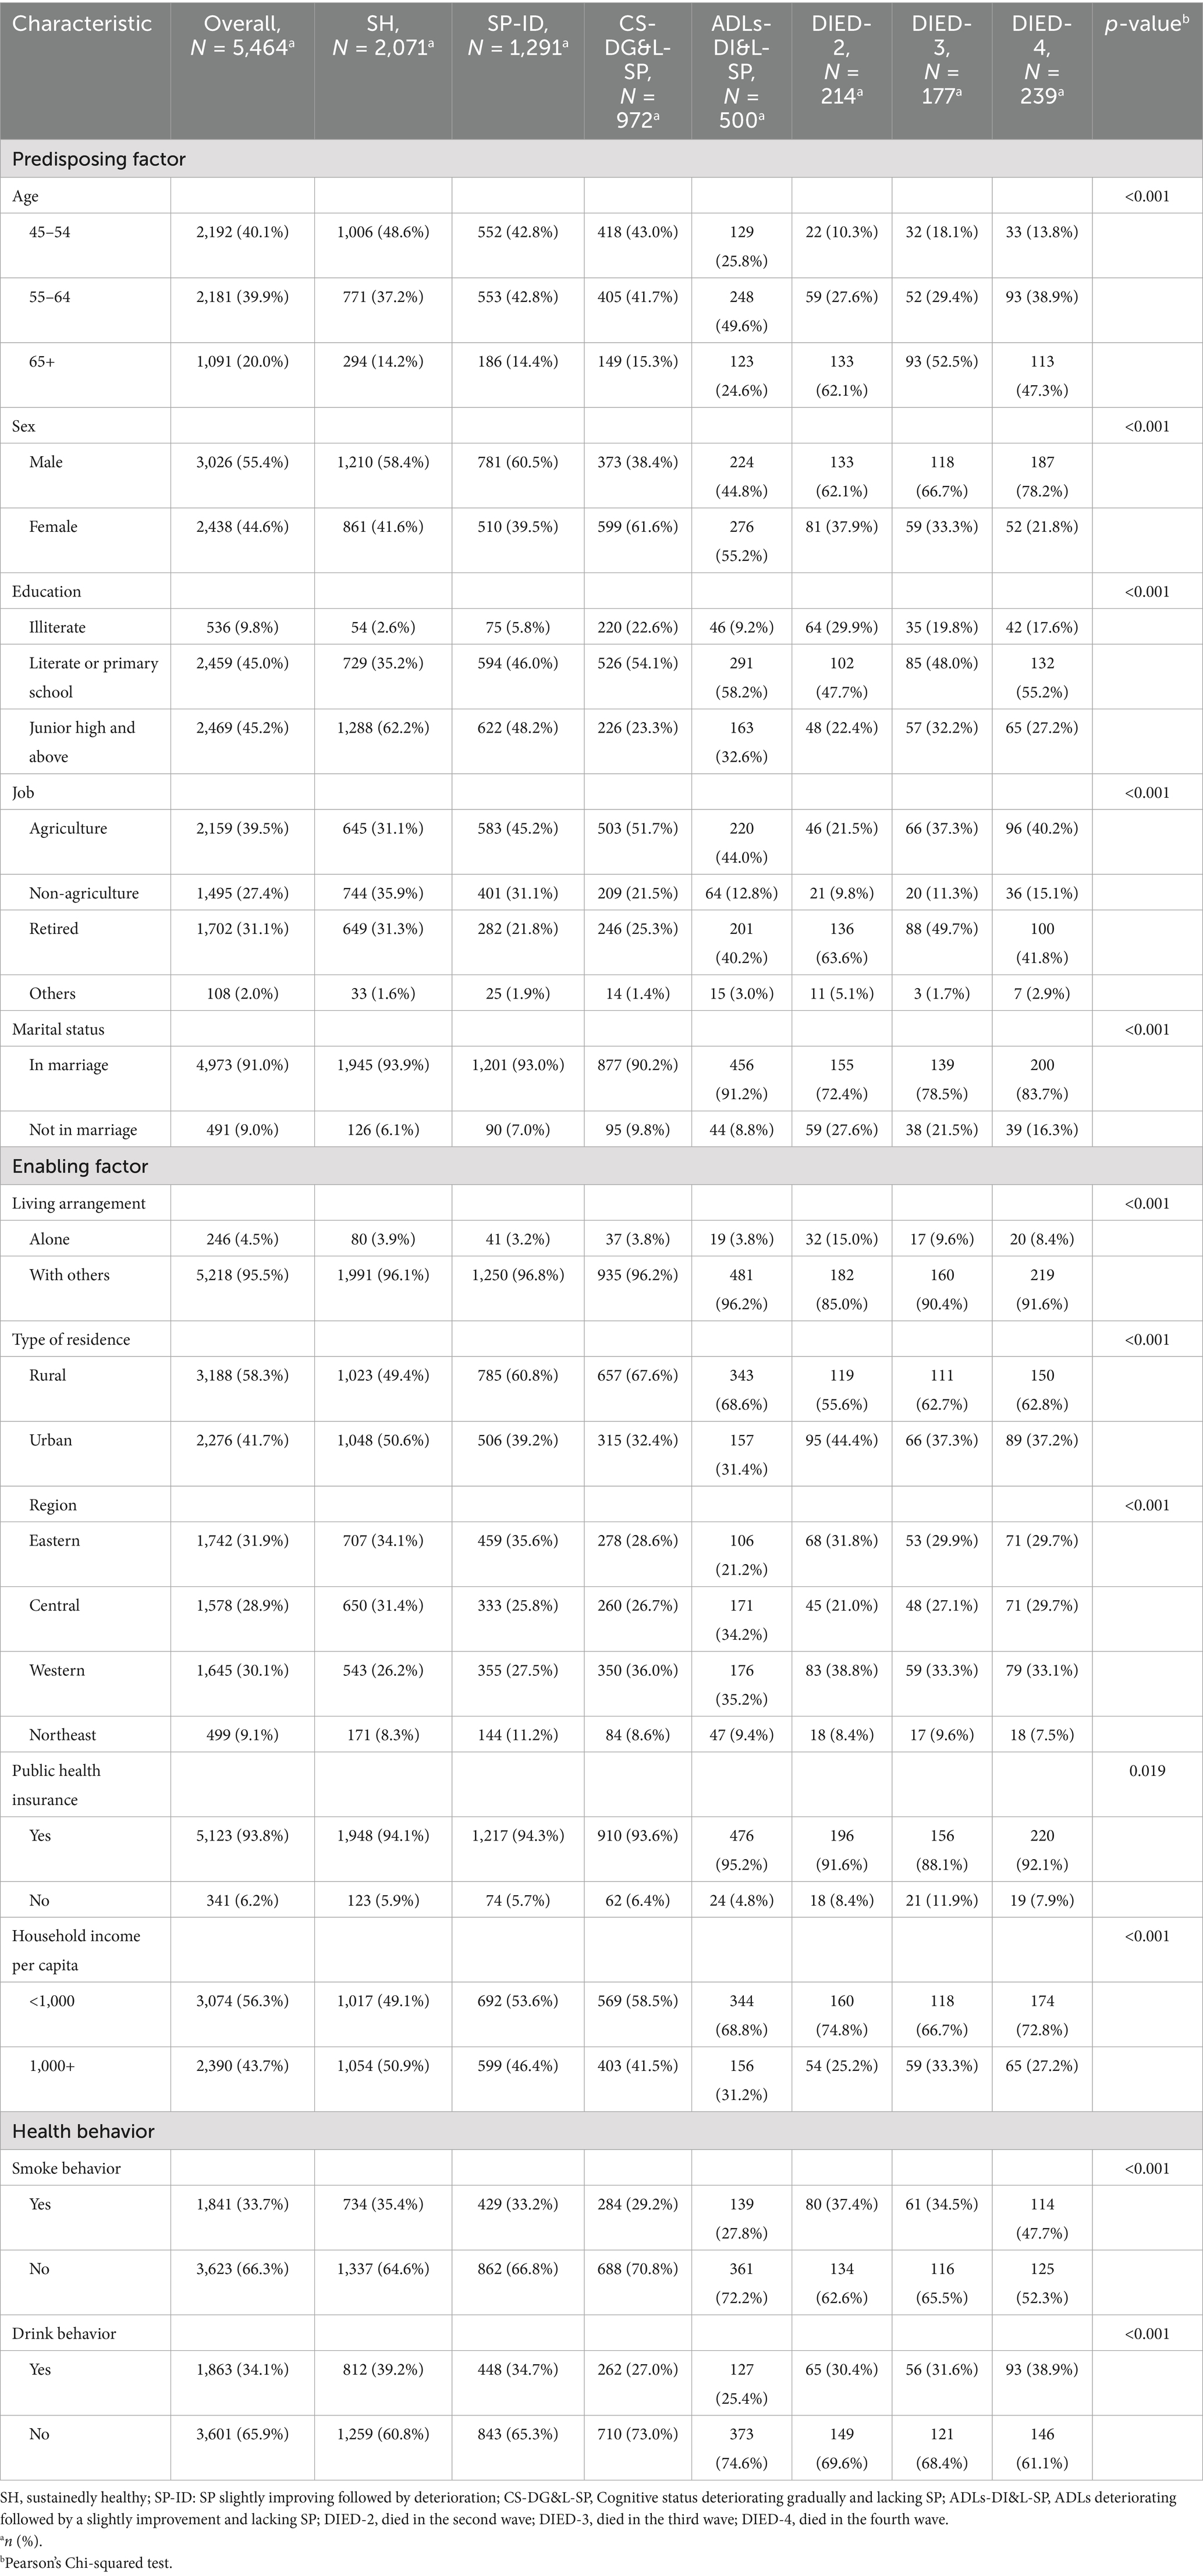
Table 5. Baseline characteristics of respondents in the seven latent health transition classes.

Table 6. Associations of baseline characteristics with the seven latent health transition classes by multivariable logistic regression.
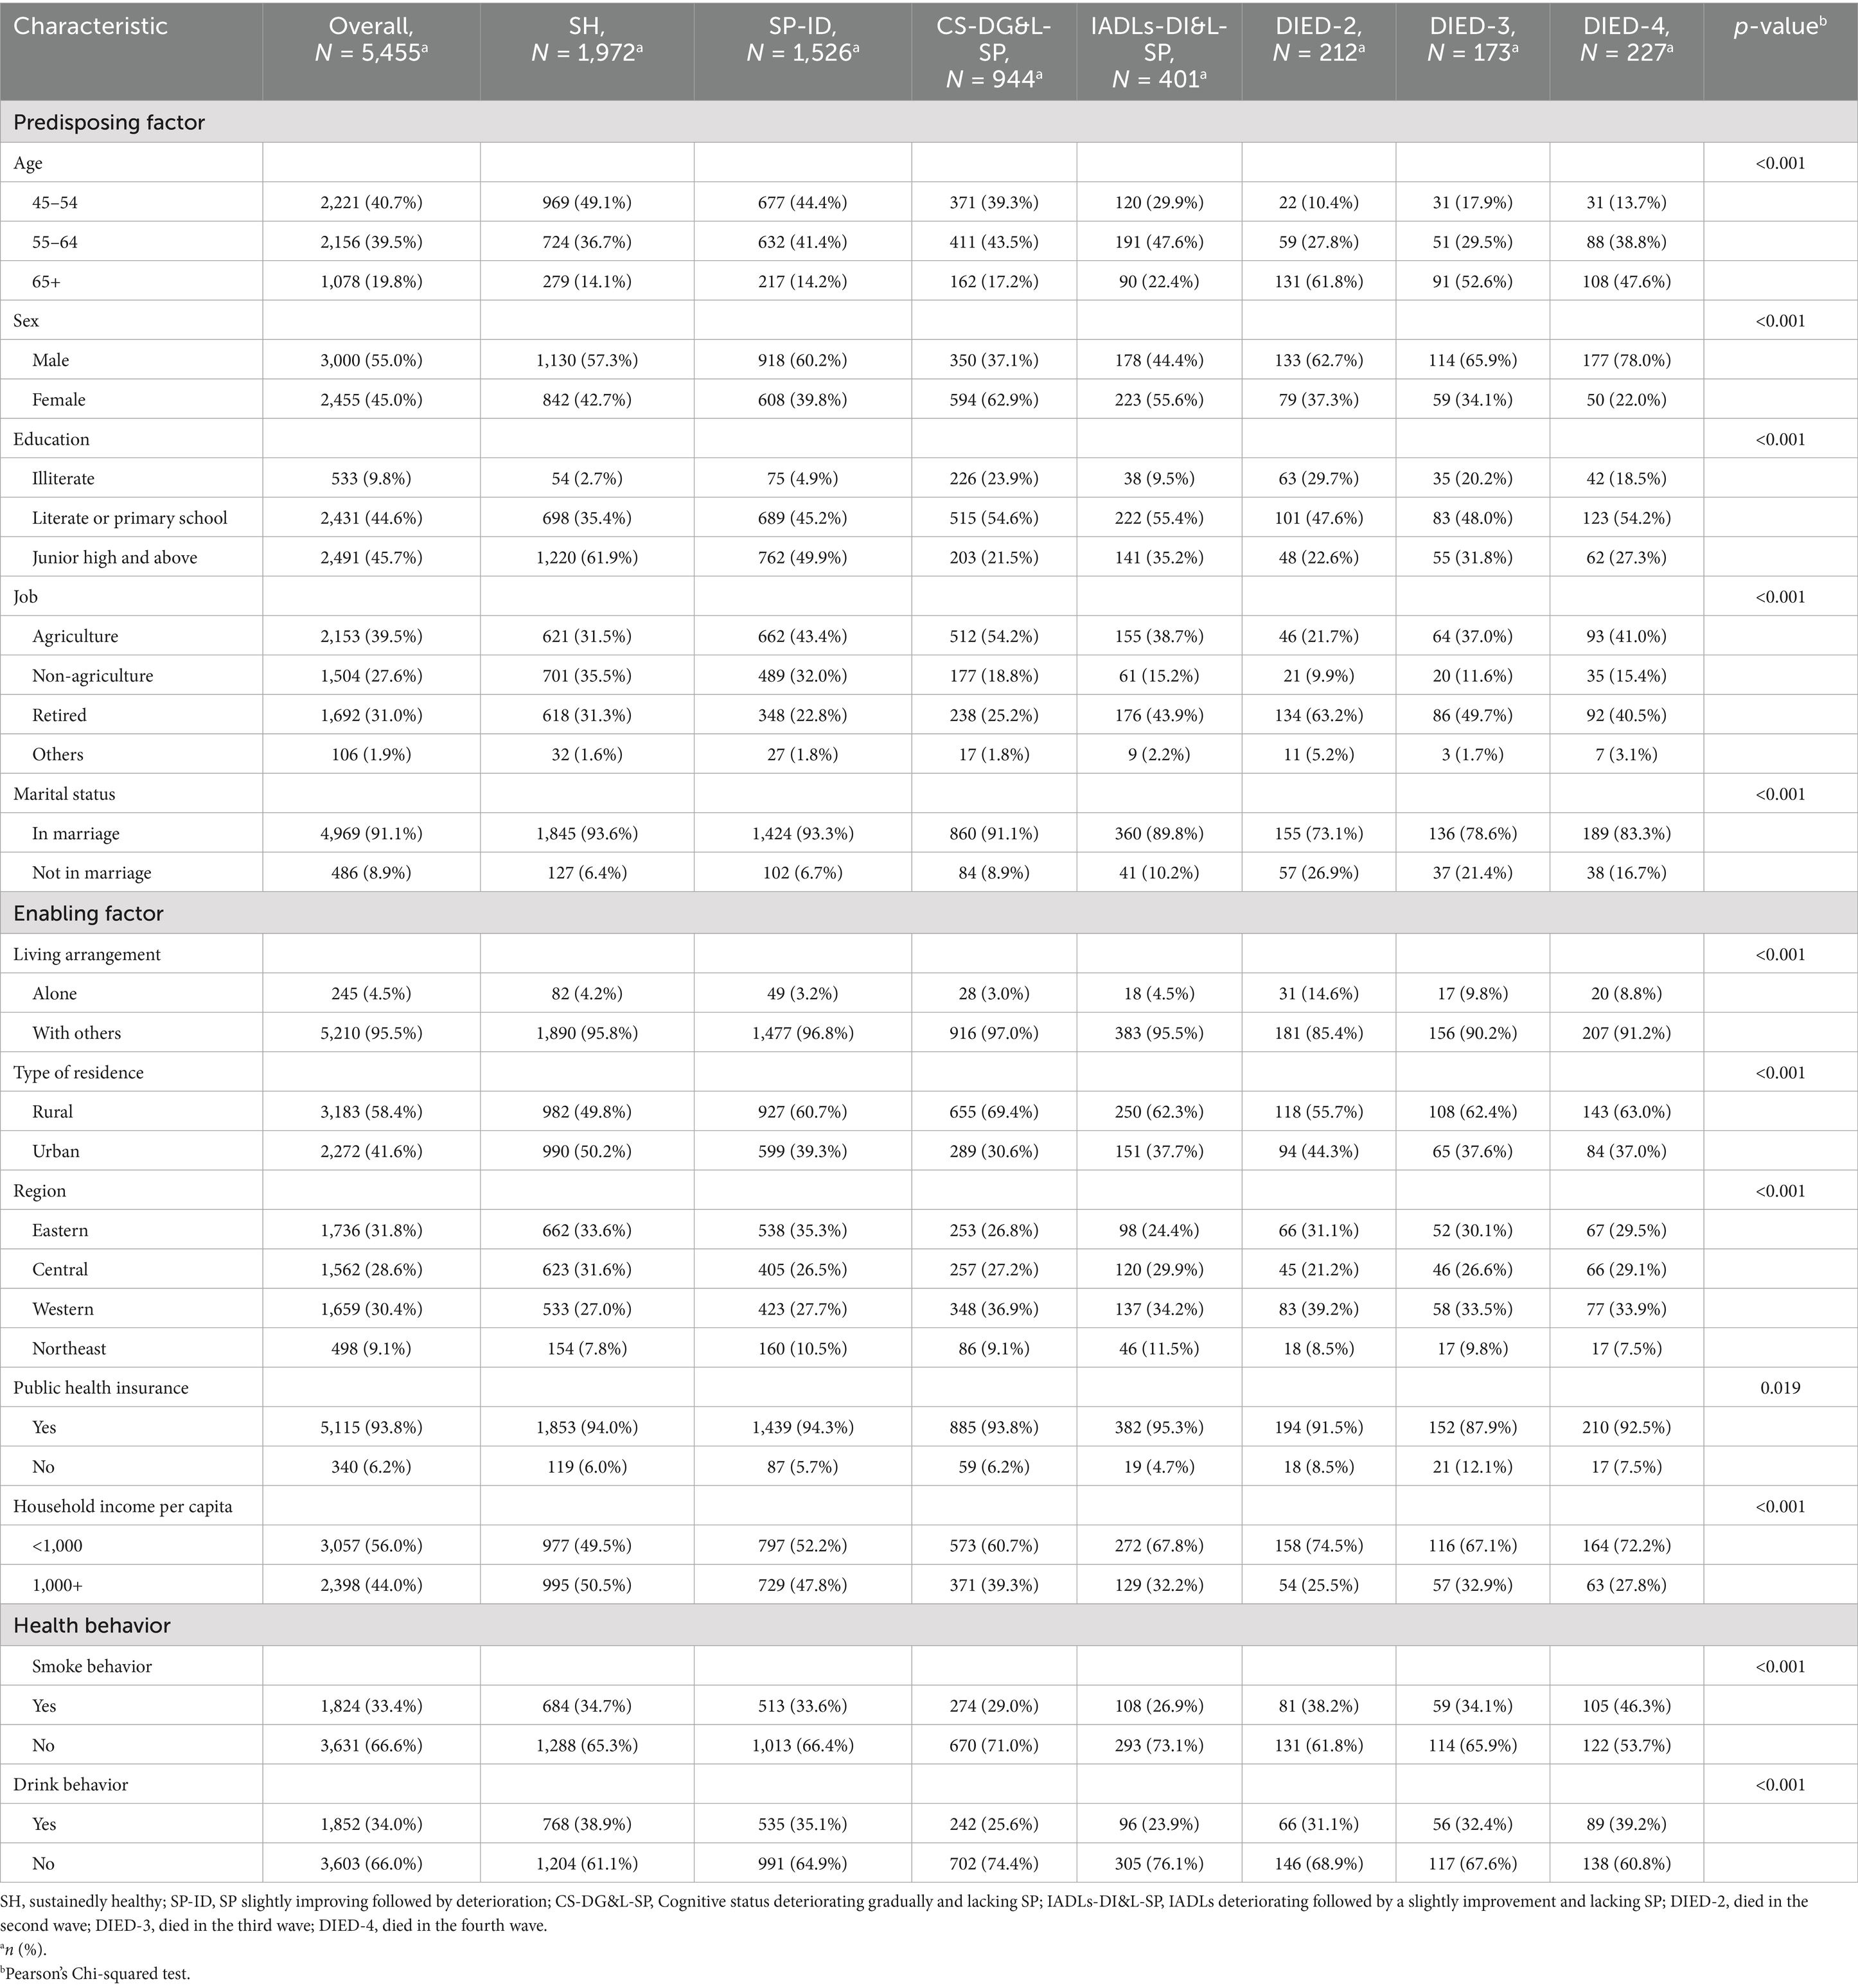
Table 7. Baseline characteristics of respondents in the seven classes after replacing health variables.
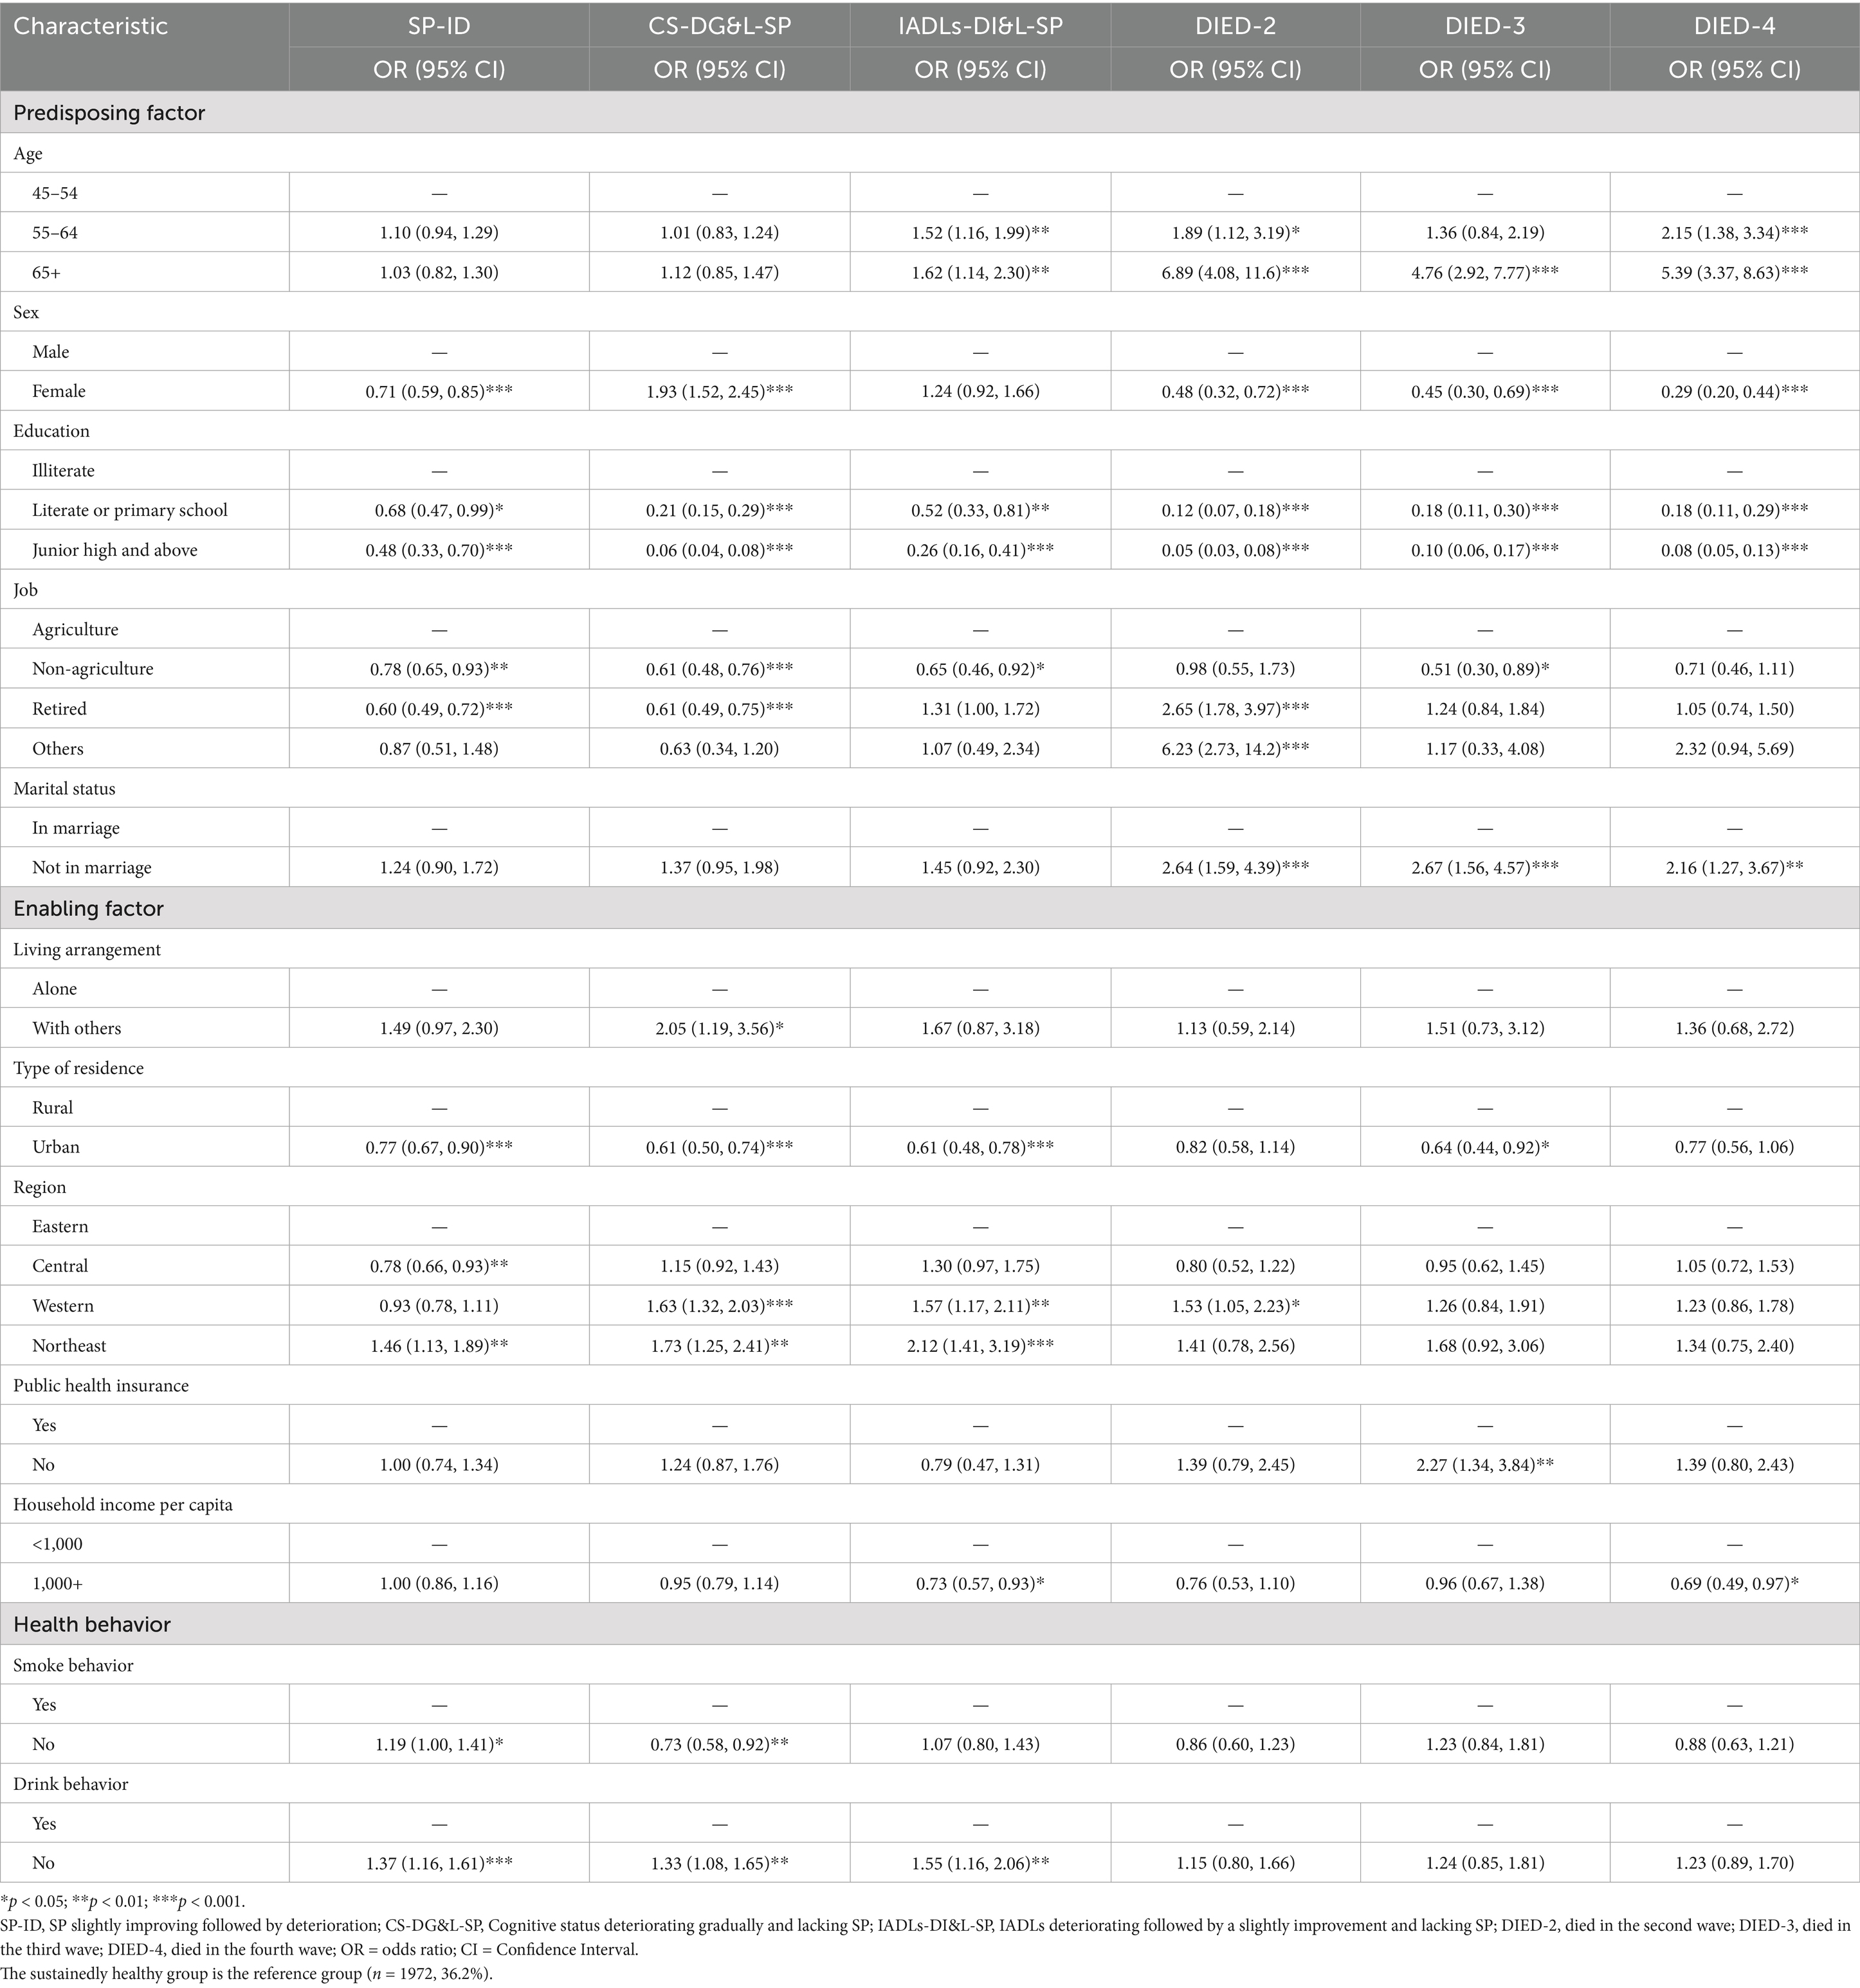
Table 8. Associations of baseline characteristics with the seven classes after replacing health variables.
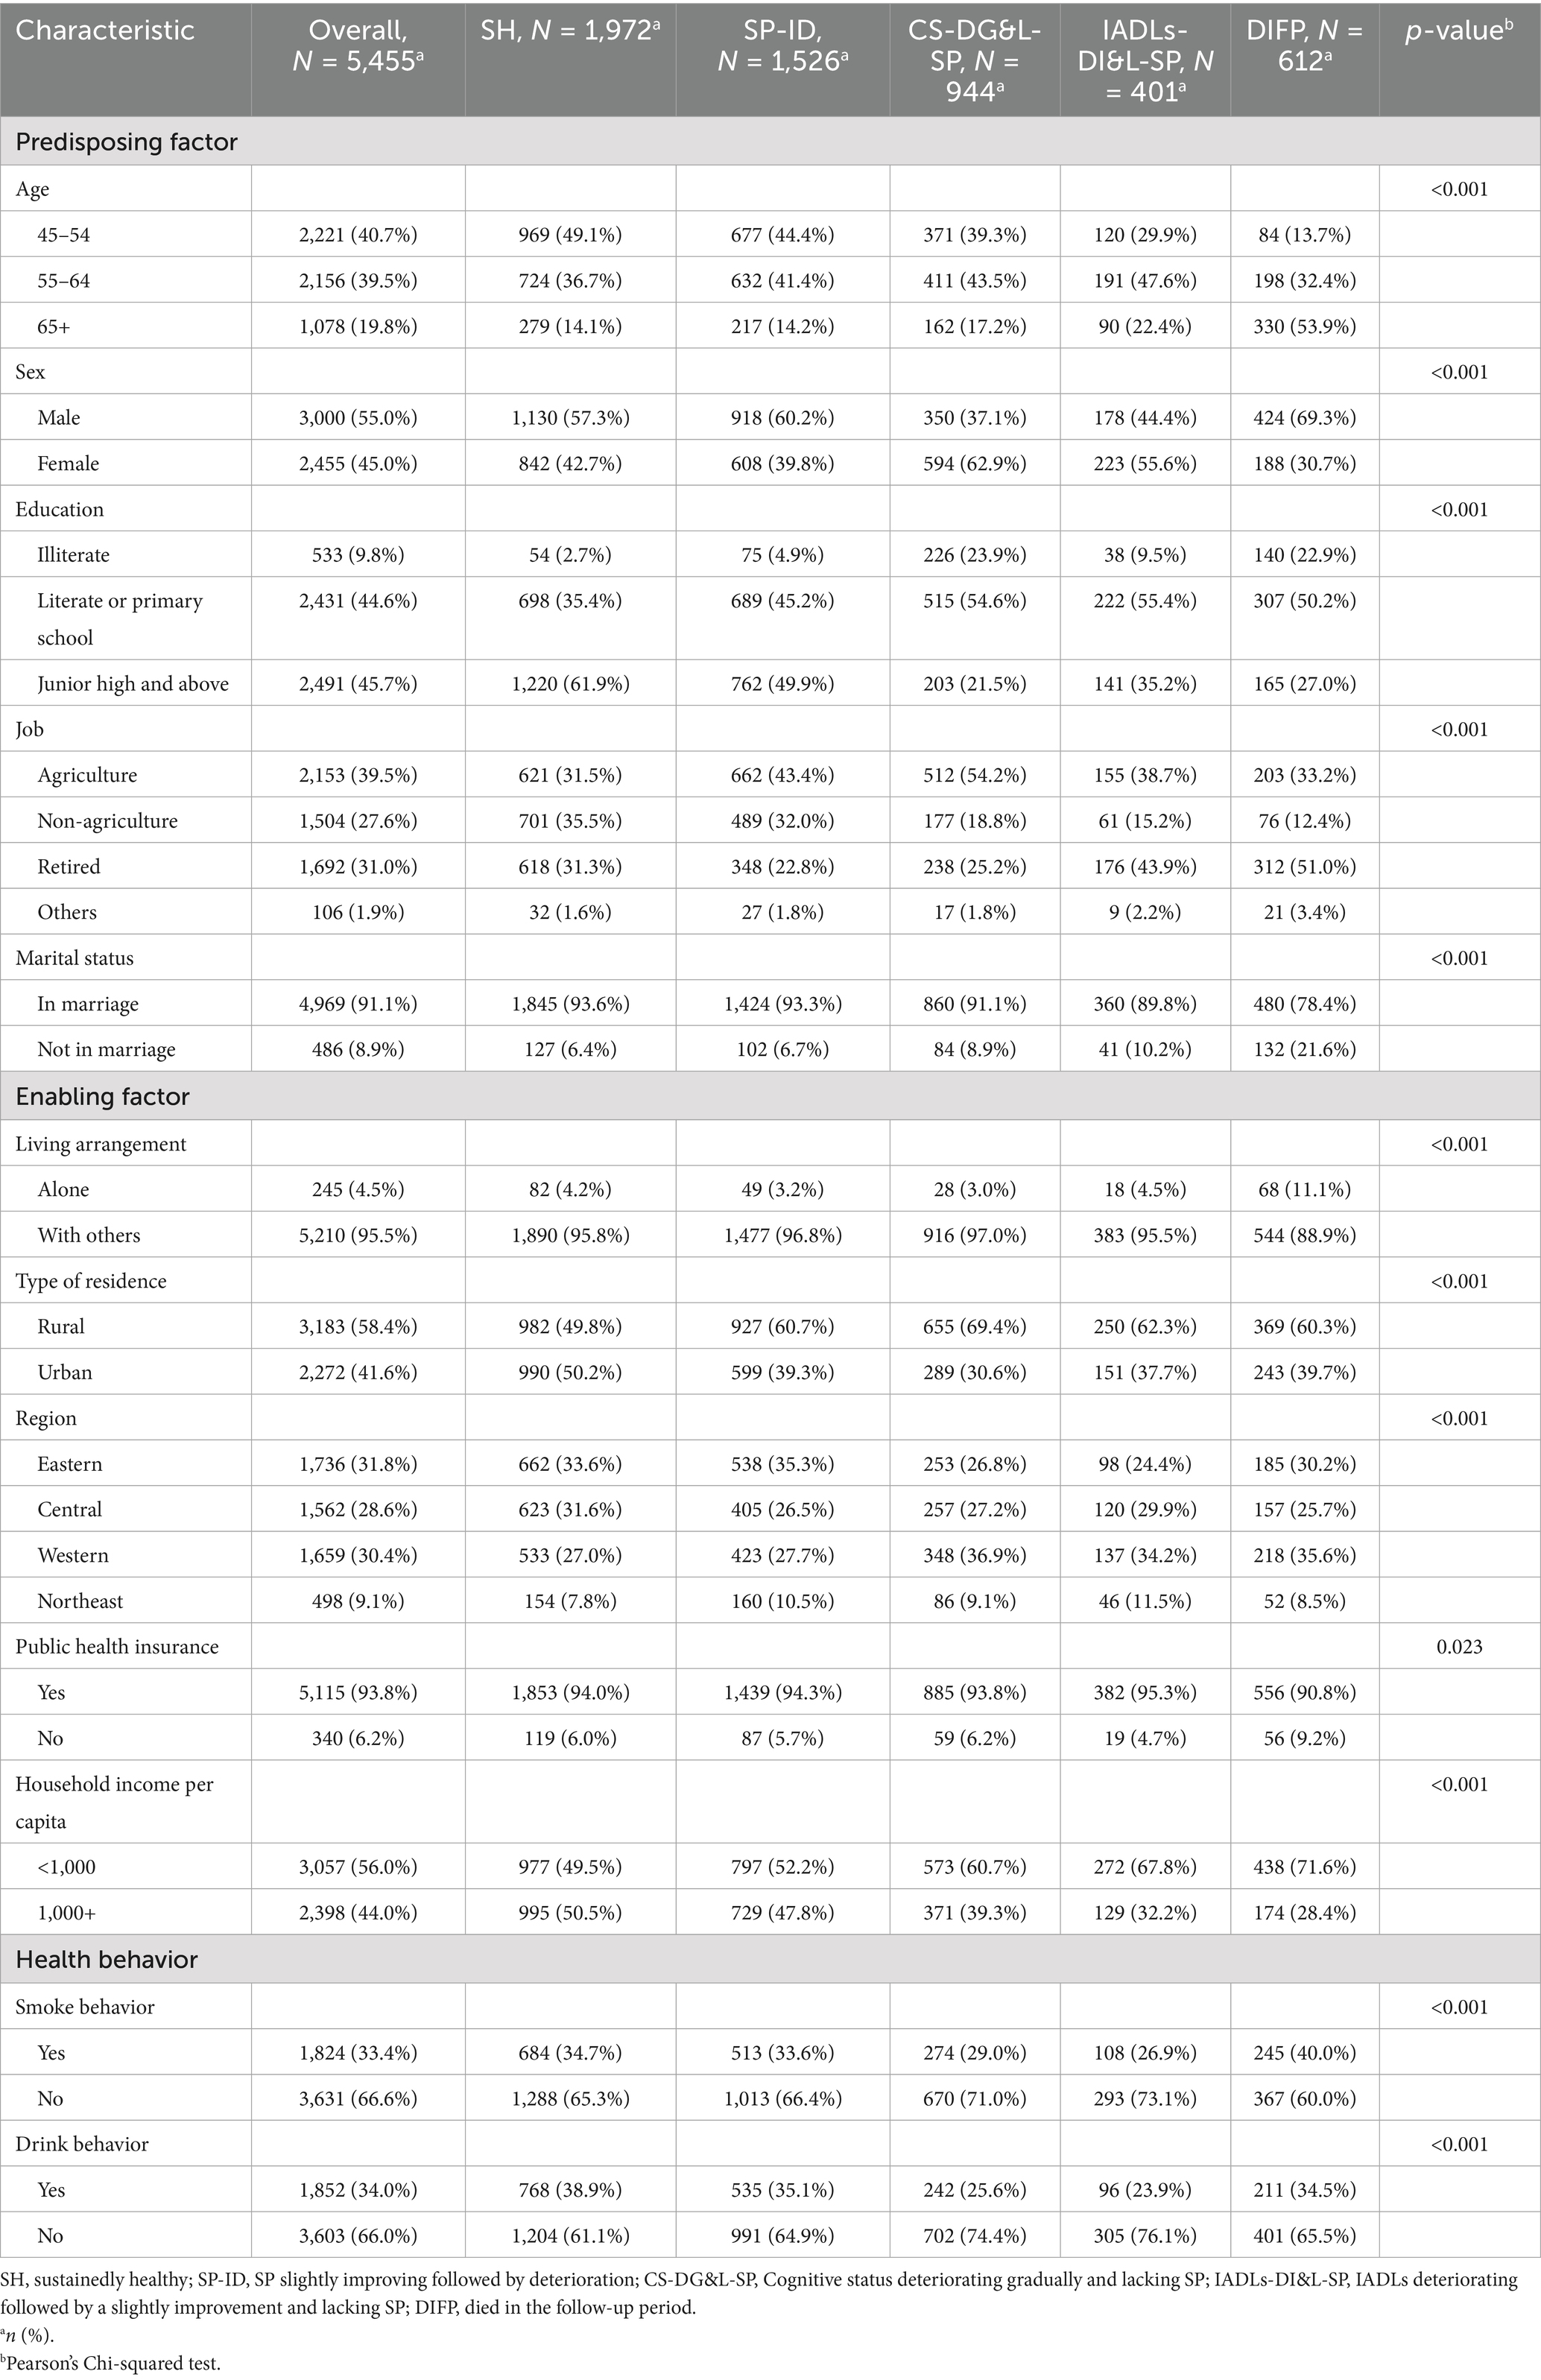
Table 9. Baseline characteristics of respondents in the five groups after replacing health variables.
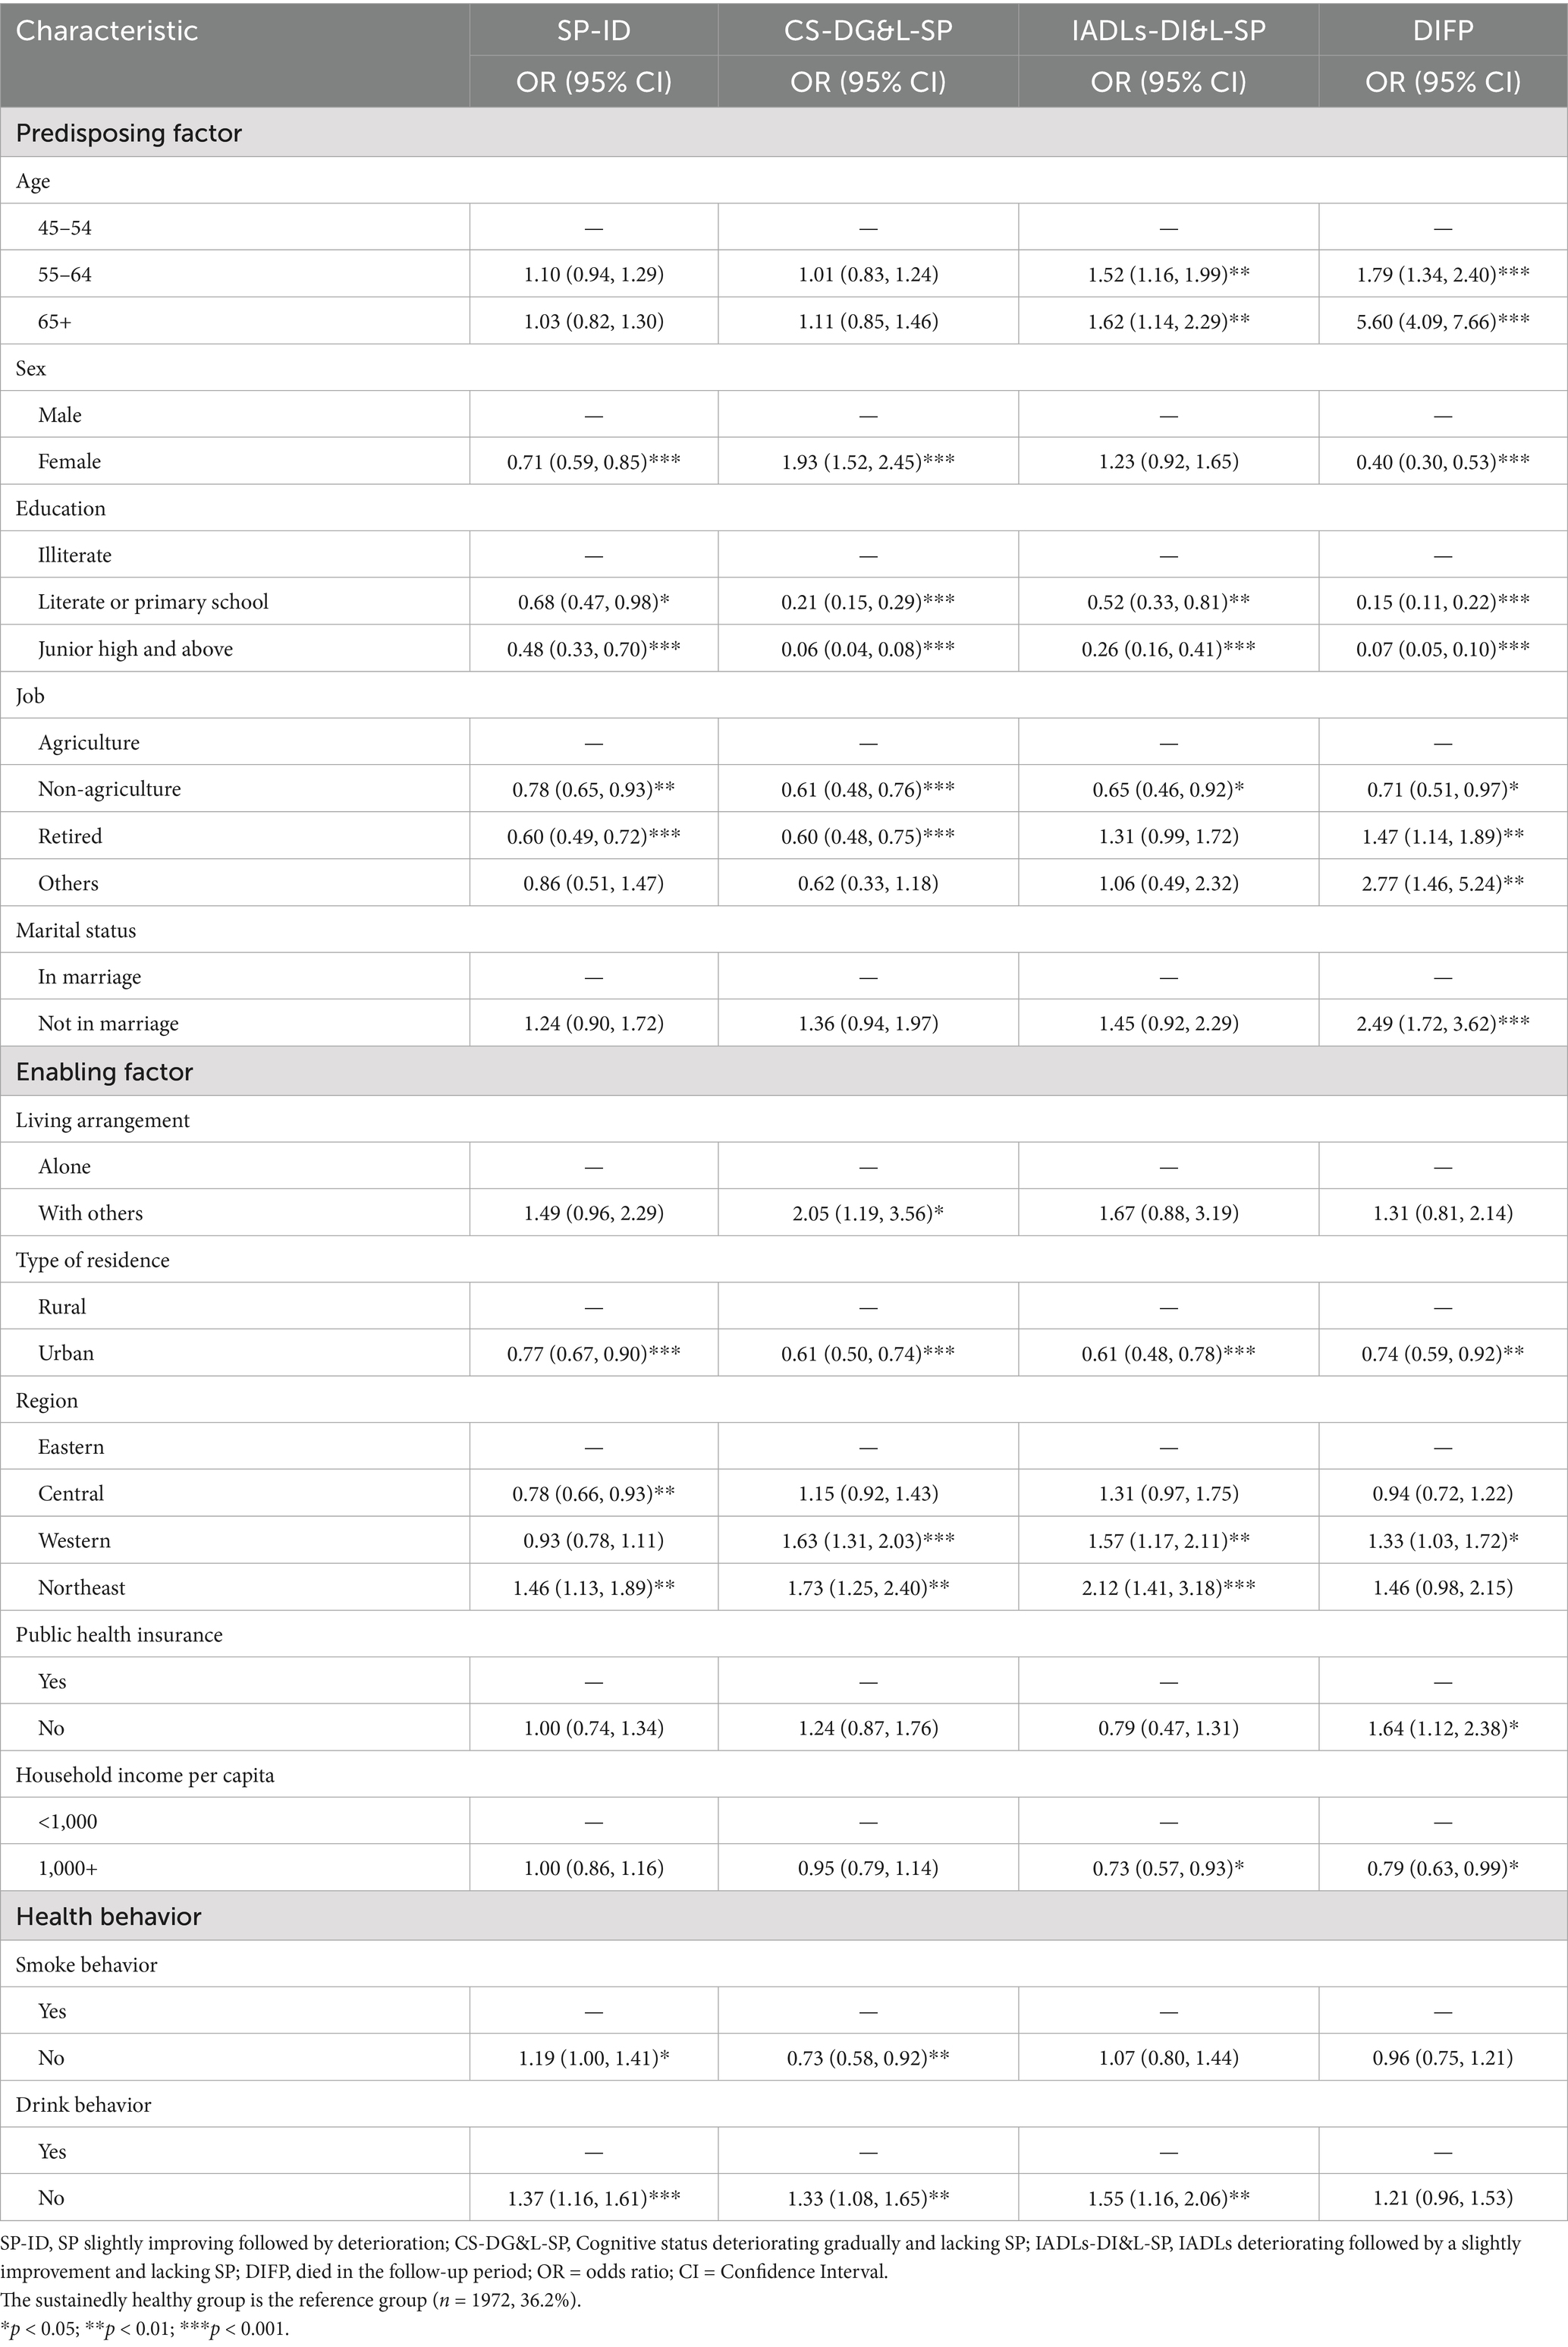
Table 10. Associations of baseline characteristics with the five groups after replacing health variables.
4 Discussion
We identified five distinct health transition pattern groups during 2011–2018 for the middle-aged and elderly population in China using the person-centered approach of RMLCA. The RMLCA approach is similar to the growth mixture modeling, but the former does not consider the particular functional relationship between each latent class and time and can observe latent transitions across multiple dimensions separately (17). Based on this, we systematically integrated multidimensional health indicators to provide greater insight into individual health transition patterns, advancing previous trajectory studies about single health dimensions (7, 12).
In particular, except for physical and psychological dimensions (14, 15), a social dimension was introduced in this study, which characterized one of the identified health transition groups (the SP-ID group). Similar to static studies based on cross-sectional data (11), our study showed noticeable differences in the physical, psychological, and social dimensions. Most participants assigned to the SP-ID group lacked SP during the follow-up period and tended to improve and then deteriorate. However, their physical and psychological health status remained good and stable. The ADLs-DI&L-SP and CS-DG&L-SP groups exhibited similar proportions and trends in the social dimensions of health. The literature similarly demonstrated a complex reciprocal relationship between SP and cognitive problems or physical functions (40, 41). It indicated that introducing the social dimension was valuable for assessing the heterogeneous health transition patterns in the middle-aged and older Chinese population. Moreover, these findings showed that deterioration in the social dimension of health did not necessarily deteriorate physical and psychological health; however, poor physical or psychological health might lead to a decline in SP. The positive effect of SP on maintaining physical and psychological health has been largely confirmed in previous studies (42, 43). Therefore, it is important to pay attention to not only the physical or psychological health but also the social dimensions of the health of older people who are in adverse physical or psychological health conditions.
Furthermore, in contrast to previous studies (7, 15), we also observed fluctuating health states (the ADLs-DI&L-SP and SP-ID groups), i.e., the possibility of a transient recovery of health status over time, which provides evidence for healthy aging policy and practice. One of the patterns that fluctuated was the SP-ID group, where individuals showed an improvement in SP followed by deterioration, indicating a possibility of improvement in the social dimension of health, similar to a previous trajectory study of social engagement (12). Another group with significant upward and downward fluctuations in the pattern of health transition was the ADLs-DI&L-SP group. Previous studies have found that positive beliefs about older people as a non-frail category would be helpful for recovery from ADLs disabilities (44, 45). These findings provide evidence for healthy aging policy and practice.
The disparities in health transition patterns could be attributed to predisposing factors, enabling factors, and health behaviors in the Andersen’s model, especially for sex, education, job, type of residence, and region.
Compared to females, the males were more likely to be assigned to the SP-ID and DIFP groups, while the females were more likely to deteriorate in physical and psychological health. This reaffirms the existence of the “gender paradox” again; i.e., women have lower health and death rates than men (46). In terms of SP, females may have the advantage of providing more care for others (47), given that it is more common for females to take care of their grandchildren in China (48). Zhang et al. have pointed out that males enjoy more health benefits from providing care to their grandchildren than females (49). Hence, more attention should be paid to the improvement of SP of elderly men, such as advocating that they provide more care of grandchildren, in order to promote elderly men health not only in social dimension but also in all dimensions. According to previous studies, females are more likely to experience cognitive impairment (50, 51) because they retire at a younger age than males in China (49). Similarly, many studies have shown females in poor physical condition (52, 53), possibly because their biological advantages earlier in life are lost in old age (51). Therefore, more interventions are necessary for older males to reduce social isolation and focus on life-threatening health problems, and addressing physical and psychological health problems in females should start at an early stage of life.
Individuals with higher educational levels were less likely to experience deterioration in all dimensions of health, with the most significant impact on cognitive ability (15, 54). In addition, the effect of education on the overall health status of older people may be influenced by other potential mechanisms related to psychological health, such as stress level (55). In older people, it is more difficult to re-advance their education. However, studies have shown that lifelong learning can reduce the impact of a lack of formal education on health in the middle to later adulthood, with a particular impact on psychological health (56). Therefore, university-based lifelong learning programs offer a viable option for enhancing educational attainment (57). Community-based education for older people, particularly health education, can increase the social trust of older people and achieve the goal of an age-friendly society (58). The internet can make learning opportunities more accessible to older people (59). Therefore, China has introduced a series of measures to broaden middle-aged and older senior citizens’ access to education, such as the establishment of the Seniors University of China (60) and the special action plan for ageing and barrier-free transformation of Internet applications (61).
Concerning working status, individuals working in the agriculture sector experienced more deterioration in all the dimensions of health status and even death than those in the non-agriculture sector, as evidenced by studies from China and Italy (62, 63). Therefore, it alerts policymakers for the health status of people in different occupations, especially those in the agriculture sector. Consistent with previous research findings, individuals who were retired at the base time or unemployed and those who never worked were more likely to die during the follow-up period (64). China’s policy of raising the retirement age in progressive steps has supported the employment of middle-aged and older people. However, there is also a risk that more people will become unemployed. Therefore, an age-friendly employment scheme is required to prevent age discrimination among middle-aged and older people. It is also important to fully respect the wishes of older people to re-join the workforce and promote their health in multiple ways.
Middle-aged and older people living in rural areas had a higher risk of multidimensional health deterioration and even death, consistent with previous studies (65–67). Despite the completion of merging the rural new cooperative medical scheme and urban resident-based basic medical insurance scheme and the adherence to the strategic approach of broad health insurance coverage in China, there is still a significant gap in the accessibility of health services between urban and rural areas (68). Expanding investment in health care in rural areas and strengthening the rural health workforce by the government have effectively reduced the rural–urban health gap (69).
People living in the eastern regions generally had better health on all dimensions than those in other regions, which was particularly evident in their physical health. This finding is inextricably linked to the relatively good economic conditions and the relative surplus of medical resources in the eastern part of China (70, 71). In fact, there are differences in specific medical security policies between different regions, with faster-developing regions likely to have higher reimbursement rates from health insurance systems (72). The subsequent reform should allocate medical and health resources and optimize medical security policies more precisely according to different regions’ population distribution and economic development. In addition, attempts can be made to promote the intra-regional sharing of medical and internet resources to achieve support between different regions. Notably, residents in the central region had a higher level of SP than those in the eastern region, which might be related to the much faster pace of development in eastern China, some extent squeezing the SP of middle-aged and older people. For the SP-ID group living in eastern China, it calls for multi-channel social participation network and the promotion of community-based engagement programs as a targeted intervention.
There are still some limitations. Firstly, although the complete case analysis method including only samples with complete data for analysis is common used in previous studies of the CHARLS database (36, 37), there were the potential selection bias in this study. Secondly, to present the model with relative clarity, we did not include more measurable health indicators, such as combination of ADL and IADL, chronic diseases, depressive factors (like the Center for Epidemiologic Studies Depression scale), and self-rated health. Thirdly, factors such as propensity, enablement, and health behaviors were measured using baseline data rather than as time-varying variable, to reduce sample bias caused by more missing data and the complication of analyses. Finally, for the stratification for household income per capita, we chose the figure (1,000 yuan) closest to the median of the sample in the thousands of yuan, and the criteria were not objective enough. A representative sample with more complete information and the changes of determinants should be considered in further research.
5 Conclusion
In conclusion, combining social dimension with physical and psychological dimensions, we identified five health transition patterns among Chinese middle-aged and older adults. This study suggests that it is crucial to identify different types of health dynamics, particularly focusing on the social dimensions of health status and the presence of fluctuating states. Andersen’s health service model showed different influencing factors for different latent health transition patterns. This study provides new insights into the complex dynamic processes and heterogeneous health of middle-aged and older people in China. The findings are valuable for personalized health services and healthy aging strategies.
Data availability statement
Publicly available datasets were analyzed in this study. This data can be found at: https://charls.pku.edu.cn/.
Ethics statement
The studies involving humans were approved by the University of Newcastle Human Research Ethics Committee (H-2015-0290). The studies were conducted in accordance with the local legislation and institutional requirements. The participants provided their written informed consent to participate in this study.
Author contributions
LY: Conceptualization, Data curation, Methodology, Writing – original draft, Writing – review & editing. ZW: Data curation, Formal analysis, Validation, Visualization, Writing – original draft. Y-WK: Methodology, Writing – review & editing. JZ: Supervision, Writing – review & editing. MC: Supervision, Writing – review & editing. B-CS: Supervision, Writing – review & editing. LQ: Conceptualization, Methodology, Writing – review & editing.
Funding
The author(s) declare that financial support was received for the research and/or publication of this article. This research was funded by the Fundamental Research Funds for the Central Universities [grant number 2072021132] and the Project of Social Science Fund of Fujian Province [grant number FJ2024C166]. The funding body had no role in designing the study; the collection, analysis, and interpretation of data; or in writing the manuscript.
Acknowledgments
This analysis uses data or information from the Harmonized CHARLS dataset and Codebook, Version D as of June 2021 developed by the Gateway to Global Aging Data. The development of the Harmonized CHARLS was funded by the National Institute on Aging (R01 AG030153, RC2 AG036619, R03 AG043052). For more information, please refer to https://g2aging.org/.
Conflict of interest
The authors declare that the research was conducted in the absence of any commercial or financial relationships that could be construed as a potential conflict of interest.
Generative AI statement
The authors declare that no Gen AI was used in the creation of this manuscript.
Publisher’s note
All claims expressed in this article are solely those of the authors and do not necessarily represent those of their affiliated organizations, or those of the publisher, the editors and the reviewers. Any product that may be evaluated in this article, or claim that may be made by its manufacturer, is not guaranteed or endorsed by the publisher.
References
1. World Population Prospects (2022): Summary of Results 2022. Available online at:https://www.un.org/development/desa/pd/content/World-Population-Prospects-2022.
2. Glinskaya, E, and Feng, Z. Options for aged care in China: Building an efficient and sustainable aged care system (English): Directions in development; human development. Washington D C: World Bank Group (2018).
4. International Health C. Constitution of the World Health Organization. 1946. Bull World Health Organ. (2002) 80:983–4. Available online at: https://iris.who.int/handle/10665/268688
5. Engel, GL. The need for a new medical model: a challenge for biomedicine. Science (New York, NY). (1977) 196:129–36. doi: 10.1126/science.847460
6. Ye, L, Shia, BC, Fang, Y, and Lee, TS. Heterogeneous health profiles and healthcare utilization of the middle-aged and elderly with multiple health insurance schemes in China. Public Health. (2019) 170:61–9. doi: 10.1016/j.puhe.2019.01.011
7. Xiao, J, Shi, Z, and Fang, Y. Association between disability trajectory and health care service utilization among older adults in China. J Am Med Dir Assoc. (2021) 22:2169. doi: 10.1016/j.jamda.2020.12.041
9. Muthen, B, and Muthen, LK. Integrating person-centered and variable-centered analyses: growth mixture modeling with latent trajectory classes. Alcohol Clin Exp Res. (2000) 24:882–91. doi: 10.1111/j.1530-0277.2000.tb02070.x
10. Lafortune, L, Beland, F, Bergman, H, and Ankri, J. Health status transitions in community-living elderly with complex care needs: a latent class approach. BMC Geriatr. (2009) 9:6. doi: 10.1186/1471-2318-9-6
11. Ye, L, Luo, J, Shia, BC, and Fang, Y. Heterogeneous health classes for older adults and their regional disparities in China: based on multidimensional health. Public Health. (2020) 178:15–22. doi: 10.1016/j.puhe.2019.08.023
12. Ye, L, Xiao, J, and Fang, Y. Heterogeneous trajectory classes of social engagement and sex differences for older adults in China. Int J Environ Res Public Health. (2020) 17:8322. doi: 10.3390/ijerph17228322
13. Zaninotto, P, Batty, GD, Allerhand, M, and Deary, IJ. Cognitive function trajectories and their determinants in older people: 8 years of follow-up in the English longitudinal study of ageing. J Epidemiol Community Health. (2018) 72:685–94. doi: 10.1136/jech-2017-210116
14. Xu, X, Liang, J, Bennett, JM, Botoseneanu, A, and Allore, HG. Socioeconomic stratification and multidimensional health trajectories: evidence of convergence in later old age. J Gerontol B Psychol Sci Soc Sci. (2015) 70:661–71. doi: 10.1093/geronb/gbu095
15. Chang, W-C, Lu, F-P, Lan, T-Y, and Wu, S-C. Multidimensional health-transition patterns among a middle-aged and older population. Geriatr Gerontol Int. (2013) 13:571–9. doi: 10.1111/j.1447-0594.2012.00937.x
16. Sun, S, Yu, Z, and An, S. Patterns of physical and mental co-occurring developmental health among Chinese elderly: a multidimensional growth mixture model analysis. SSM-Population Health. (2024) 25:101584. doi: 10.1016/j.ssmph.2023.101584
17. Collins, LM, and Lanza, ST. Latent class and latent transition analysis: With applications in the social, behavioral, and health sciences. Hoboken, New Jersey, U.S.: John Wiley & Sons (2009).
18. Byles, JE, Rahman, M, Princehorn, EM, Holliday, EG, Leigh, L, Loxton, D, et al. Successful ageing from old to very old: a longitudinal study of 12,432 women from Australia. Age Ageing. (2019) 48:803–10. doi: 10.1093/ageing/afz116
19. Andersen, RM. National health surveys and the behavioral model of health services use. Med Care. (2008) 46:647–53. doi: 10.1097/MLR.0b013e31817a835d
20. Andersen, RM. Revisiting the behavioral model and access to medical care: does it matter. J Health Soc Behav. (1995) 36:1–10. doi: 10.2307/2137284
21. Zhao, Y, Strauss, J, Chen, X, Wang, Y, Gong, J, Meng, Q, et al. China health and retirement longitudinal study wave 4 user’s guide. Beijing: National School of Development, Peking University (2020).
22. Chen, X, Wang, Y, Strauss, J, and Zhao, Y. China health and retirement longitudinal study (CHARLS) In: D Gu and ME Dupre, editors. Encyclopedia of gerontology and population aging. Cham: Springer International Publishing (2019). 1–9.
23. Chen, X, Wang, Y, Strauss, J, and Zhao, Y. China health and retirement longitudinal study (CHARLS). Encyclopedia of Gerontology and Population Aging. Singapore: Springer (2022).
24. Liu, Y, Liu, Z, Liang, R, and Luo, Y. The association between community-level socioeconomic status and cognitive function among Chinese middle-aged and older adults: a study based on the China health and retirement longitudinal study (CHARLS). BMC Geriatr. (2022) 22:1–10. doi: 10.1186/s12877-022-02946-3
25. Data GtGA. Harmonized China Health and Retirement Longitudinal Study. Gateway to Global Aging Data. (2021).
26. Katz, S, Ford, AB, Moskowitz, RW, Jackson, BA, and Jaffe, MW. studies of illness in the aged. The index of ADL: A standardized measure of biological and psychosocial function. JAMA. (1963) 185:914–9. doi: 10.1001/jama.1963.03060120024016
27. Lei, X, Hu, Y, McArdle, JJ, Smith, JP, and Zhao, Y. Gender differences in cognition among older adults in China. J Hum Resour. (2012) 47:951–71. doi: 10.1353/jhr.2012.0033
28. Keshavan, MS, Vinogradov, S, Rumsey, J, Sherrill, J, and Wagner, A. Cognitive training in mental disorders: update and future directions. Am J Psychiatry. (2014) 171:510–22. doi: 10.1176/appi.ajp.2013.13081075
29. Medalia, A, and Erlich, M. Why cognitive health matters. American J Public Health Association; (2017) 107:45–7. doi: 10.2105/AJPH.2016.303544
30. Liu, J, Rozelle, S, Xu, Q, Yu, N, and Zhou, T. Social engagement and elderly health in China: evidence from the China health and retirement longitudinal survey (CHARLS). Int J Environ Res Public Health. (2019) 16:278. doi: 10.3390/ijerph16020278
31. Liu, H, Fan, X, Luo, H, Zhou, Z, Shen, C, Hu, N, et al. Comparison of depressive symptoms and its influencing factors among the elderly in urban and rural areas: evidence from the China health and retirement longitudinal study (CHARLS). Int J Environ Res Public Health. (2021) 18:3886. doi: 10.3390/ijerph18083886
32. Methods for the division of eastern, western, central, and northeast regions of China (2011). Available online at:http://www.stats.gov.cn/ztjc/zthd/sjtjr/dejtjkfr/tjkp/201106/t20110613_71947.htm.
33. Lanza, ST, and Collins, LM. A mixture model of discontinuous development in heavy drinking from ages 18 to 30: the role of college enrollment. J Stud Alcohol. (2006) 67:552–61. doi: 10.15288/jsa.2006.67.552
34. Amlak, BT, Getinet, M, Getie, A, Kebede, WM, Tarekegn, TT, and Belay, DG. Functional disability in basic and instrumental activities of daily living among older adults globally: a systematic review and meta-analysis. BMC Geriatr. (2025) 25:1–20. doi: 10.1186/s12877-025-06056-8
35. Yeh, C-J, Wang, C-Y, Tang, P-F, Lee, M-C, Lin, H-S, and Chen, H-Y. Hierarchy of higher-level physical functions: a longitudinal investigation on a nationally representative population of community-dwelling middle-aged and elderly persons. Disabil Rehabil. (2012) 34:1271–6. doi: 10.3109/09638288.2011.641657
36. Xie, X, Que, J, Sun, L, Sun, T, and Yang, F. Association between urbanization levels and frailty among middle-aged and older adults in China: evidence from the CHARLS. BMC Med. (2025) 23:171. doi: 10.1186/s12916-025-03961-y
37. Zhou, K, Wang, A, and Yi, K. Cardiometabolic multimorbidity and frailty in middle-aged and older adults: a cross-nationally harmonized study. Front Public Health. (2025) 13:1565682. doi: 10.3389/fpubh.2025.1565682
38. Zhou, H, and Feng, G. Analysis of common mistakes in logistic regression analysis in medical papers. Chinese J General Prac. (2020) 12:1194–6. doi: 10.3760/cma.j.cn114798-20201018-01073
39. Peduzzi, P, Concato, J, Kemper, E, Holford, TR, and Feinstein, AR. A simulation study of the number of events per variable in logistic regression analysis. J Clin Epidemiol. (1996) 49:1373–9. doi: 10.1016/S0895-4356(96)00236-3
40. Ma, L, Sun, F, and Tang, Z. Social frailty is associated with physical functioning, cognition, and depression, and predicts mortality. J. Nutri. Health Aging. (2018) 22:989–95. doi: 10.1007/s12603-018-1054-0
41. He, Q, Cui, Y, Liang, L, Zhong, Q, Li, J, Li, Y, et al. Social participation, willingness and quality of life: a population-based study among older adults in rural areas of China. Geriatr Gerontol Int. (2017) 17:1593–602. doi: 10.1111/ggi.12939
42. Barbieri, PN. Healthy by association: the relationship between social participation and self-rated physical and psychological health. Health Soc Care Community. (2021) 29:1925–35. doi: 10.1111/hsc.13306
43. Fiorillo, D, Lavadera, GL, and Nappo, N. Social participation and self-rated psychological health: a longitudinal study on BHPS. SSM - Population Health. (2017) 3:266–74. doi: 10.1016/j.ssmph.2017.02.003
44. Levy, BR, Slade, MD, Murphy, TE, and Gill, TM. Association between positive age stereotypes and recovery from disability in older persons. JAMA. (2012) 308:1972–3. doi: 10.1001/jama.2012.14541
45. Xu, W, Li, Y-X, Hu, Y, and Wu, C. Association of Frailty with recovery from disability among community-dwelling Chinese older adults: China health and retirement longitudinal study. Bmc. Geriatrics. (2020) 20:119. doi: 10.1186/s12877-020-01519-6
46. Nathanson, CA. Illness and the feminine role: a theoretical review. Soc Sci Med. (1975) 9:57–62. doi: 10.1016/0037-7856(75)90094-3
47. Flood, SM, and Moen, P. Healthy time use in the encore years: do work, resources, relations, and gender matter? J Health Soc Behav. (2015) 56:74–97. doi: 10.1177/0022146514568669
48. Chen, F, Liu, G, and Mair, CA. Intergenerational ties in context: grandparents caring for grandchildren in China. Soc Forces. (2011) 90:571–94. doi: 10.1093/sf/sor012
49. Zhang, W, Feng, Q, Liu, L, and Zhen, Z. Social engagement and health: findings from the 2013 survey of the Shanghai elderly life and opinion. Int J Aging Hum Dev. (2015) 80:332–56. doi: 10.1177/0091415015603173
50. Zhang, Q, Wu, Y, Han, T, and Liu, E. Changes in cognitive function and risk factors for cognitive impairment of the elderly in China: 2005-2014. Int J Environ Res Public Health. (2019) 16:2847. doi: 10.3390/ijerph16162847
51. Wang, D, Zheng, J, Kurosawa, M, and Inaba, Y. Relationships between age and gender differentials in health among older people in China. Ageing Soc. (2009) 29:1141–54. doi: 10.1017/S0144686X09008629
52. Tzeng, H-J, and Lee, M-C. Multifaceted changes and mortality in older people: a longitudinal study in Taiwan. Geriatr Gerontol Int. (2017) 17:959–66. doi: 10.1111/ggi.12819
53. Gill, TM, Gahbauer, EA, Lin, H, Han, L, and Allore, HG. Comparisons between older men and women in the trajectory and burden of disability over the course of nearly 14 years. J Am Med Dir Assoc. (2013) 14:280–6. doi: 10.1016/j.jamda.2012.11.011
54. de la Fuente, J, Felix Caballero, F, Sanchez-Niubo, A, Panagiotakos, DB, Prina, AM, Arndt, H, et al. Determinants of health trajectories in England and the United States: An approach to identify different patterns of healthy aging. J Gerontol. (2018) 73:1512–8. doi: 10.1093/gerona/gly006
55. Elo, IT. Social class differentials in health and mortality: patterns and explanations in comparative perspective. Annu Rev Sociol. (2009) 35:553–72. doi: 10.1146/annurev-soc-070308-115929
56. Yamashita, T, Bardo, AR, Liu, D, and Yoo, JW. Education, lifelong learning and self-rated health in later life in the USA. Health Educ J. (2019) 78:328–39. doi: 10.1177/0017896918809500
57. Park, JH, Lee, K, and Dabelko-Schoeny, H. A comprehensive evaluation of a lifelong learning program: program 60. Int J Aging Hum Dev. (2016) 84:88–106. doi: 10.1177/0091415016668352
58. Korte, M, Graupner, J, Thompson, K, and Gleason, LJ. Age friendly care: what do Community aging services professionals need to know? Gerontol Geriatr Educ. (2022) 1:156–65. doi: 10.1080/02701960.2022.2151443
59. Wister, AV, Malloy-Weir, LJ, Rootman, I, and Desjardins, R. Lifelong educational practices and resources in enabling health literacy among older adults. J Aging Health. (2010) 22:827–54. doi: 10.1177/0898264310373502
60. Xinhua. China inaugurates national university for the aged 2023. (2023). Available online at: https://www.chinadaily.com.cn/a/202303/07/WS64069784a31057c47ebb2bb5.html
61. Technology TMoIaI. Notice of the Ministry of Industry and Information Technology on the issuance of the "Special Action Plan for Ageing and Barrier-free Transformation of Internet Applications" (2020) Available online at:https://www.gov.cn/zhengce/zhengceku/2020-12/26/content_5573472.htm.
62. Fan, Y, and He, D. Self-rated health, socioeconomic status and all-cause mortality in Chinese middle-aged and elderly adults. Sci Rep. (2022) 12:9309. doi: 10.1038/s41598-022-13502-9
63. Strozza, C, Pasqualetti, P, Egidi, V, Loreti, C, Vannetti, F, Macchi, C, et al. Health profiles and socioeconomic characteristics of nonagenarians residing in Mugello, a rural area in Tuscany (Italy). Bmc. Geriatrics. (2020) 20:289. doi: 10.1186/s12877-020-01689-3
64. Anxo, D, Ericson, T, and Miao, C. Impact of late and prolonged working life on subjective health: the Swedish experience. European J. Health Econ. (2019) 20:389–405. doi: 10.1007/s10198-018-1005-z
65. Jiang, H, Burstrom, B, Chen, J, and Burstrom, K. Rural-urban inequalities in poor self-rated health, self-reported functional disabilities, and depression among Chinese older adults: evidence from the China health and retirement longitudinal study 2011 and 2015. Int J Environ Res Public Health. (2021) 18:6557. doi: 10.3390/ijerph18126557
66. Gui, S, and Chen, J. Average life expectancy of the Chinese population in 1949–2019: trends, contributors and prospects. China Popul Dev Stud. (2020) 3:142–53. doi: 10.1007/s42379-019-00036-3
67. Xu, H, Dupre, ME, Gu, D, and Wu, B. The impact of residential status on cognitive decline among older adults in China: results from a longitudinal study. Bmc. Geriatrics. (2017) 17. doi: 10.1186/s12877-017-0501-9
68. Meng, Q, Fang, H, Liu, X, Yuan, B, and Xu, J. Consolidating the social health insurance schemes in China: towards an equitable and efficient health system. Lancet. (2015) 386:1484–92. doi: 10.1016/S0140-6736(15)00342-6
69. The 14th Five-Year Plan for Universal Health Coverage (2021). Available online at: https://www.ndrc.gov.cn/fggz/fzzlgh/gjjzxgh/202111/t20211102_1302819.html.
70. Press, CS. Tabulation on the 2010 population census of the people’s republic of China. National Bureau of Statistics. (2010).
71. Wang, Y, Li, Y, Qin, S, Kong, Y, Yu, X, Guo, K, et al. The disequilibrium in the distribution of the primary health workforce among eight economic regions and between rural and urban areas in China. Int J Equity Health. (2020) 19:1–10. doi: 10.1186/s12939-020-1139-3
Keywords: aging, health transition, heterogeneity, multidimensional health, repeated-measures latent class analysis
Citation: Ye L, Wu Z, Kao Y-W, Zhu J, Chen M, Shia B-C and Qin L (2025) Heterogeneity and the determinants of multidimensional health transition among Chinese middle-aged and older people: a person-centered approach. Front. Med. 12:1563419. doi: 10.3389/fmed.2025.1563419
Edited by:
Marios Kyriazis, National Gerontology Centre, CyprusReviewed by:
Hui Wang, Xi’an Jiaotong University, ChinaMingcheng Gao, Dongbei University of Finance and Economics, China
Copyright © 2025 Ye, Wu, Kao, Zhu, Chen, Shia and Qin. This is an open-access article distributed under the terms of the Creative Commons Attribution License (CC BY). The use, distribution or reproduction in other forums is permitted, provided the original author(s) and the copyright owner(s) are credited and that the original publication in this journal is cited, in accordance with accepted academic practice. No use, distribution or reproduction is permitted which does not comply with these terms.
*Correspondence: Lei Qin, cWlubGVpQHVpYmUuZWR1LmNu