 Mali Salmon-Divon
 Tamar Zahavi1
 David Kornspan
- 1Genomic Bioinformatics Laboratory, Department of Molecular Biology, Ariel University, Ariel, Israel
- 2Department of Bacteriology, Kimron Veterinary Institute, Bet Dagan, Israel
The live attenuated Brucella melitensis Rev.1 (Elberg-originated) vaccine strain is widely used to control the zoonotic infection brucellosis in small ruminants, but the molecular mechanisms underlying the attenuation of this strain have not been fully characterized. Following their uptake by the host cell, Brucella replicate inside a membrane-bound compartment—the Brucella-containing vacuole—whose acidification is essential for the survival of the pathogen. Therefore, identifying the genes that contribute to the survival of Brucella in acidic environments will greatly assist our understanding of its molecular pathogenic mechanisms and of the attenuated virulence of the Rev.1 strain. Here, we conducted a comprehensive comparative transcriptome analysis of the Rev.1 vaccine strain against the virulent reference strain 16M in cultures grown under either normal or acidic conditions. We found 403 genes that respond differently to acidic conditions in the two strains (FDR < 0.05, fold change ≥ 2). These genes are involved in crucial cellular processes, including metabolic, biosynthetic, and transport processes. Among the highly enriched genes that were downregulated in Rev.1 under acidic conditions were acetyl-CoA synthetase, aldehyde dehydrogenase, cell division proteins, a cold-shock protein, GroEL, and VirB3. The downregulation of these genes may explain the attenuated virulence of Rev.1 and provide new insights into the virulence mechanisms of Brucella.
Introduction
Brucella are facultative intracellular bacteria that are responsible for brucellosis—a zoonotic infection that causes abortions and sterility in ruminants, pigs, dogs, and rodents, and a severely debilitating febrile illness in humans (Ko and Splitter, 2003; von Bargen et al., 2012). One factor that crucially contributes to the virulence of Brucella is their ability to survive within various host cells, where they are inaccessible to the humoral immune response of the host (Delrue et al., 2004). Following uptake by the host cells, Brucella create a unique, highly acidic intracellular niche—the Brucella-containing vacuole (BCV)—in which they reside and multiply (Celli, 2006; Starr et al., 2008). The acidification of the BCV is essential for inducing the major Brucella virulence determinant, the type-IV secretion system (T4SS; Porte et al., 1999; Boschiroli et al., 2002; Köhler et al., 2002; Ke et al., 2015) which is encoded by the virB locus in their chromosomes. As the T4SS system (and, especially, the proteins VirB3–6 and VirB8–11) plays a crucial role in inhibiting the host immune response and in the intracellular survival and replication of Brucella within the host cells (Comerci et al., 2001; den Hartigh et al., 2008; Ke et al., 2015; Smith et al., 2016), the ability of Brucella to survive within the acidic conditions of the BCV is key to their pathogenesis and can be used to study the underlying mechanisms (Roop et al., 2009).
Porte et al. (1999) reported that the pH in phagosomes containing live Brucella suis decreases to 4.0 within 1 h following infection, and that this value persists for at least 5 h. Thus, one can assume the existence of a complex, transcription-level regulation network, which responds to specific cellular signals that enable the bacteria to survive in the acidic BCV environment. Indeed, two recent comparative transcriptome analyses employed RNA-seq to determine the changes in Brucella gene expression in cultures containing normal-pH media (namely, pH7.3) versus those containing low-pH media (pH4.4), thereby revealing novel molecular mechanisms leading to Brucella pathogenicity (Liu et al., 2015, 2016). Notably, one gene that was shown to play an important role in the resistance of Brucella to low-pH conditions is BMEI1329, which encodes a two-component response regulator gene in the transcriptional regulation pathway of Brucella melitensis (Liu et al., 2016).
Brucella melitensis, which infects goats and sheep mainly around the Mediterranean and the Persian Gulf, is the most pathogenic Brucella species for humans (Poester et al., 2013). Among the brucellosis vaccines used in high-prevalence regions, a widely used one utilizes the live attenuated Rev.1 B. melitensis strain (Avila-Calderón et al., 2013). This strain, originally developed from the virulent B. melitensis 6056 strain by Elberg and Herzberg in the mid-1950s, successfully protects and reduces abortions in small ruminants (Herzberg and Elberg, 1953; Banai, 2002), but it remains infectious for humans and causes abortions in small ruminants vaccinated during the last trimester of gestation. To improve brucellosis vaccines, we need to better understand the mechanisms underlying the virulence attenuation of the Rev.1 vaccine strain (as compared with that of other, pathogenic strains), but these mechanisms are yet unclear.
In a recent study, we sequenced and annotated the whole genome of the original Elberg B. melitensis Rev.1 vaccine strain (passage 101, 1970) and compared it to that of the virulent B. melitensis 16M strain (Salmon-Divon et al., 2018a,b). We found that, as compared with 16M, Rev.1 contains non-synonymous and frameshift mutations in important virulence-related genes—including genes involved in lipid metabolism, stress response, regulation, amino acid metabolism, and cell-wall synthesis—which we assumed are related to the attenuated virulence of this strain. In this study, we aimed to extend these findings to elucidate the intracellular survival mechanisms of the virulent 16M strain versus the vaccine Rev.1 strain. To this end, and in light of the importance of the acidic BCV environment for the virulence of Brucella species, we employed RNA-seq to comprehensively compare the transcriptome of the Rev.1 and 16M strains, each grown under either low- or normal-pH conditions, under the hypothesis that the gene expression patterns of the two strains will differ between the two conditions. Our analysis revealed several candidate genes that may be related to the attenuated virulence of Rev.1 and may, therefore, facilitate the design of improved brucellosis vaccines.
Materials and Methods
Bacteria Strains and Culture Conditions
Bacterial strains used in the present study were B. melitensis 16M (INRA Brucella Culture Collection)—the commonly used, virulent, wild-type biotype 1 strain—and the original attenuated B. melitensis Rev.1 vaccine strain (passage 101, 1970). For comparative assays, both the Rev.1 and 16M strains were cultured for 72 h on tryptic soy agar (TSA) plates at 37°C under 5% CO2. The low-pH treatment assay was performed as reported previously (Liu et al., 2016). Briefly, bacteria were grown with shaking for 24 h in 10 ml of a tryptic soy broth (TSB; pH7.3) at 37°C, with an initial density of 1 × 10⁷ CFU/ml. The final bacterial densities were adjusted to 5 × 10⁸ CFU/ml (OD600 ≅ 0.4) before the low-pH treatment, in which 1 ml of the culture was centrifuged at 7000 ×g, resuspended in a pH4.4 TSB culture, and incubated for 4 h at 37°C. In the control group, bacteria were cultured in a pH7.3 TSB and incubated at 37°C for 4 h. After incubation, cell cultures were collected and centrifuged at 7000 ×g, and then the supernatants were removed and an RNA Protect Reagent (Qiagen, Hilden, Germany) was added to the pellets to prevent RNA degradation. Five different biological replicates were used for each strain under each type of condition (total 20 samples). All the work with Brucella strains was performed at a biosafety level 3 laboratory in the Kimron Veterinary Institute, Bet Dagan, Israel.
RNA Isolation
The total RNA of the 16M and Rev.1 strains was isolated using the RNeasy Mini Kit (Qiagen) with a DNase treatment (Qiagen). RNA was eluted from the column using RNase-free water. RNA quality was measured by Bioanalyzer (Agilent, Waldbronn, Germany). Libraries were prepared using the ScriptSeq RNA-Seq Library Preparation Kit (Illumina, Inc., San Diego, CA, United States). Library quantity and pooling were measured by Qubit [dsDNA high sensitivity (HS); Molecular Probes, Inc., Eugene, OR, United States]. The pool was size-selected by using a 4% agarose gel. Library quality was measured by TapeStation (HS; Agilent). For RNA-seq, the NextSeq 500 high output kit V2 was used (Illumina, Inc.). The reads were single end at the length of 75 bp (∼10 million reads per sample). Sample denaturation and loading were conducted according to the manufacturer’s instructions. Library preparation and RNA-seq were conducted at the Center for Genomic Technologies at the Hebrew University of Jerusalem, Jerusalem, Israel.
Reverse Transcriptase PCR (RT-PCR)
To confirm the RNA-seq results, five upregulated or downregulated genes from the RNA-seq analysis were selected and a RT-PCR was used to confirm the expression changes of these genes in both strains (16M and Rev.1) and conditions (low- and normal-pH). PCR primers were designed using Primer-BLAST (Ye et al., 2012) and are listed in Supplementary Table S1. Complementary DNA (cDNA) was obtained by a reverse transcription of 850 ng total RNA at a final reaction volume of 20 μl, containing 4 μl qScript Reaction Mix, and 1 μl qScript Reverse Transcriptase (Quantabio, Beverly, MA, United States). Quantitative RT-PCR assays were purchased from Biosearch Technologies (Petaluma, CA, United States) and used according to the manufacturer’s instructions. PCR reactions were conducted in a final reaction volume of 10 μl containing 20 ng of cDNA template, 5 μl of PerfeCTa SYBR Green FastMix, ROX (Quantabio), and 1 μl of primer mix. All reactions were run in triplicate and the reference gene 16S rRNA was amplified in a parallel reaction for normalization.
RNA-Seq Analysis
Following quality control with FastQC1, the reads were processed to trim adaptors and low-quality bases by using Trim Galore software2. The EDGE-pro v1.3.1 software (Magoc et al., 2013) was used with the default parameters to map reads to the B. melitensis 16M reference genome (GCF_000007125.1), filter out multi-aligned reads, and estimate the expression levels of each gene. To convert the EDGE-pro output to a count-table format, the “edgeToDeseq.perl” script (provided with the software) was used. Normalization and differential gene expression analysis were conducted with the edgeR (Robinson et al., 2010) and Limma R packages (Smyth, 2005), using as input the count table generated by EDGE-pro. Briefly, genes that did not show more than 1 count per million (CPM) mapped reads in at least three samples were filtered out. Then, a TMM normalization (Robinson and Oshlack, 2010) was applied, followed by voom transformation (Law et al., 2014). Linear models to assess differential gene expression were generated by fitting a model with a coefficient for all factor combinations (strain and low-pH treatment) and then extracting the comparisons of interest, which also included the interaction between strain and treatment effects. The aim of adding the interaction term in this experimental setup was to detect genes that respond differently to pH treatment in Rev.1 compared to 16M; we named these genes “interaction genes.” Only genes that demonstrated a fold change ≥ 2 and an FDR ≤ 0.05 were considered significant. Sequencing reads from this study were deposited in the NCBI SRA repository under the accession number PRJNA498082. The significantly upregulated or downregulated genes were subjected to a gene ontology enrichment analysis using ClusterProfiler (Yu et al., 2012) with a cutoff of FDR < 0.05. To perform the gene ontology analysis, we first generated a database annotation package for B. melitensis 16M using the “makeOrgPackage” command from the AnnotationForge R package (Carlson, 2018). As input, we used the GO annotation, downloaded from QuickGO (Binns et al., 2009). Additional comparisons of the biological processes were performed with the Comparative GO web server (Fruzangohar et al., 2013) using all the upregulated and downregulated genes. Multidimensional scaling analysis (MDS) was conducted using the “plotMDS” command within the edgeR (Robinson et al., 2010) package. A heatmap of the 403 genes that respond differently to acidic conditions in the two strains was generated using the “heatmap3” R package (Zhao et al., 2014), employing 1-Pearson correlation as the distance measure and “complete” as the linkage method. Genes were categorized into five clusters based on the generated dendrogram, and genes within each cluster were characterized based on Clusters of Orthologous Groups (COGs) annotations. For this purpose, protein sequences of the clustered genes were searched against a local COG BLAST database, which was downloaded from NCBI using the reverse position-specific BLAST (RPS-BLAST) tool (Marchler-Bauer et al., 2013). The expectation value (E) threshold was set to 0.01 and the BLAST output was parsed using an updated version of the cdd2cog.pl script3 to obtain the assignment statistics of the COGs. The number of genes within each heatmap cluster belonging to each COG assignment was calculated, and the ontologies with the highest number of genes were indicated in the heatmap.
Cell Infection Test
JEG-3 (ATCC® HTB-36TM) human trophoblasts were grown in Eagle’s Minimum Essential Medium (EMEM; ATCC® 30-2003TM) with 10% fetal bovine serum. For intracellular replication experiments, 2 × 10⁵ cells were seeded in a 24-well plate and cultured overnight at 37°C under 5% CO2. Monolayers of cells were infected with the 16M or Rev.1 strains at a multiplicity of infection (MOI) of 500 (100 μl of bacterial suspension per well). To synchronize the infection, the infected plates were centrifuged at 400 g for 5 min at room temperature, followed by a 75 min incubation at 37 °C in an atmosphere containing 5% CO2. The cells were then washed three times with PBS and re-incubated for another 60 min in a medium containing 50 μg/ml gentamicin to eliminate extracellular bacteria, after which the number of internalized bacteria was measured (time zero of the culture). To assess the intracellular bacterial growth, the concentration of gentamicin was reduced to 5 μg/ml. To monitor the intracellular survival of the bacteria at various times post-infection, the infected cells were lysed for 10 min with 0.1% Triton X-100 in water and serial dilutions of the lysates were plated on TSA plates to enumerate the colony-forming units. Three identical wells were evaluated at each time for each strain. Experiments were repeated three times, independently.
Results
We used RNA-seq to conduct a comprehensive comparative transcriptomic analysis of the gene expression profiles of the Rev.1 (vaccine) and 16M (virulent) B. melitensis strains, grown either under low-pH conditions that mimic the intracellular niche of the BCV (pH4.4; referred to here as the “low- pH” group) or normal-pH conditions (pH7.3; “normal-pH” group). The raw sequence outputs for each group are presented in Table 1. An MDS analysis revealed four clusters, of which all bacterial samples within each cluster are closely related, emphasizing the high quality and reproducibility of the data (Figure 1).
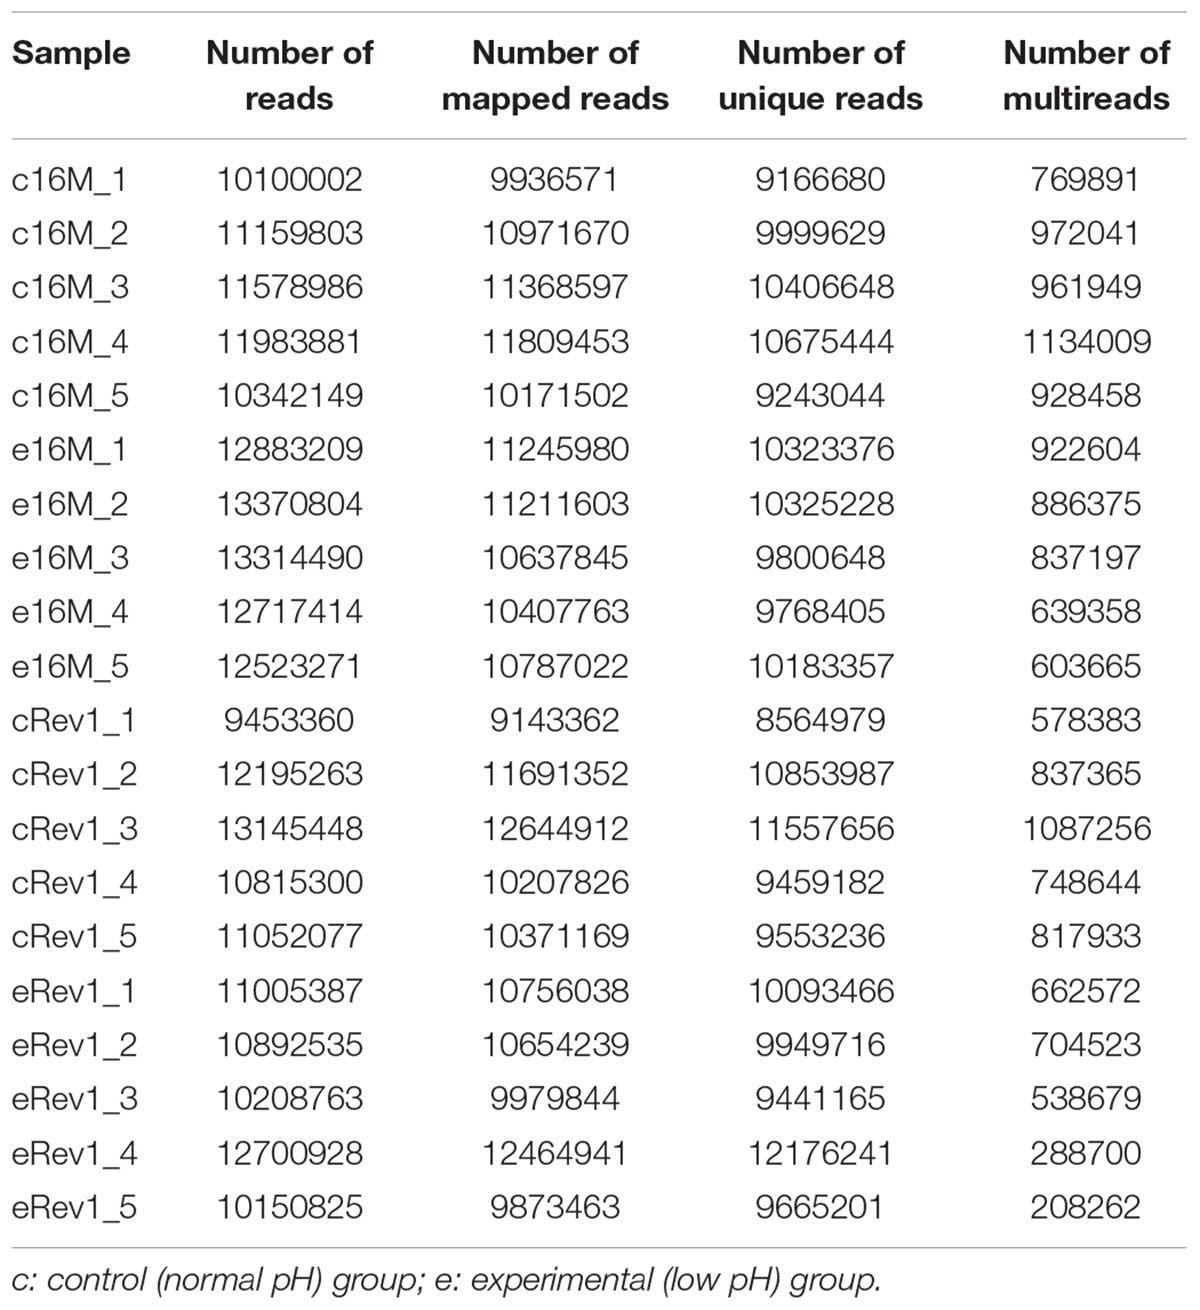
Table 1. The list of raw data sequence output for the normal- and low-pH groups of B. melitensis 16M and Rev.1.
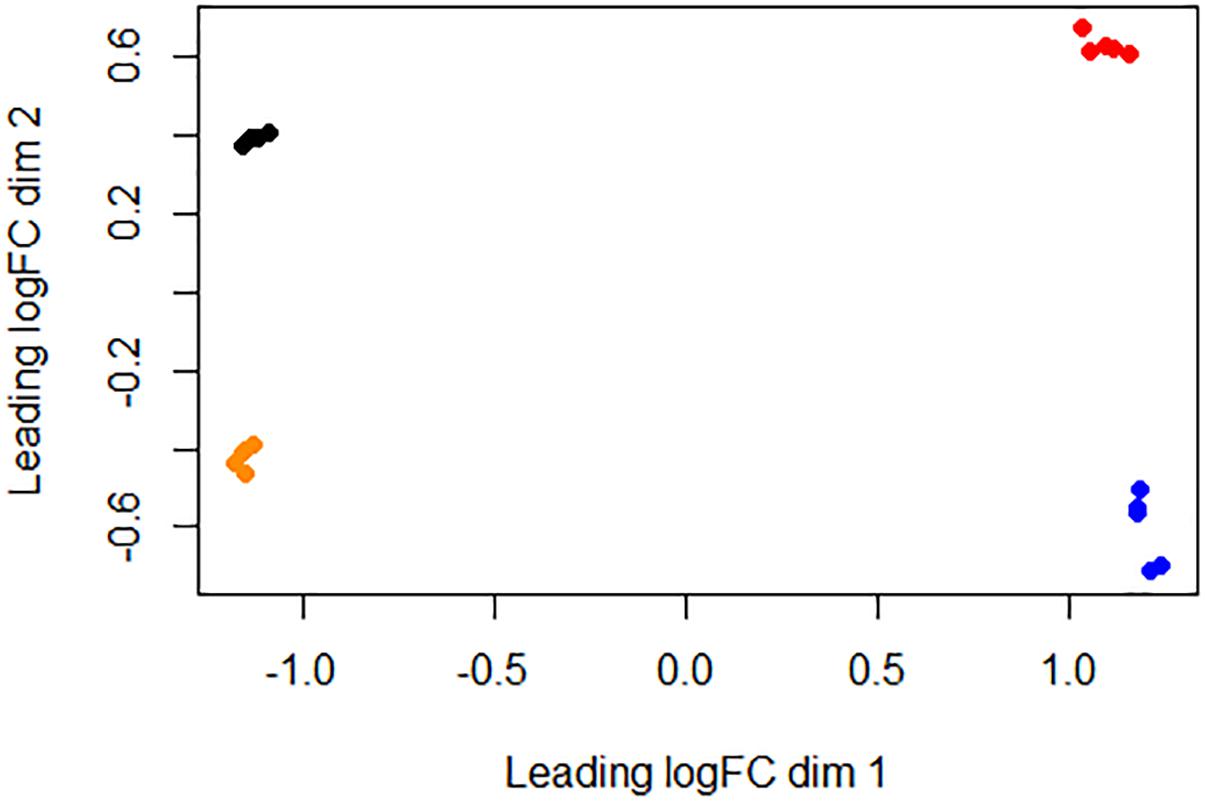
Figure 1. Similarities between bacterial samples visualized using an MDS analysis. Relative distances between bacterial samples were projected onto a two-dimensional space using the “plotMDS” command implemented at the Limma R package (Smyth, 2005). Black, 16M normal-pH group samples; red, 16M low-pH group samples; orange, Rev.1 normal-pH group samples; blue, Rev.1 low-pH group samples.
Below, we first report the genes that are differentially expressed (DE) between the Rev.1 and 16M strains, each grown under normal-pH conditions. Then, for each separate strain, we report the genes that are DE between bacteria grown under normal-pH conditions and those grown under low-pH conditions. Finally, we report possible interactions between the strain and its unique response to acidic conditions.
Differential Gene Expression Between B. melitensis Rev.1 and 16M Grown Under Normal-pH Conditions
When both Rev.1 and 16M were grown under normal-pH conditions (pH7.3), our comparative transcriptomic analysis revealed 242 genes that were DE (FDR < 0.05, fold change ≥ 2; Supplementary Table S2) between the two strains, of which 172 genes were upregulated and 70 genes were downregulated in Rev.1 versus 16M. The most enriched biological processes associated with the DE genes were transport-related processes (Figure 2), while the most enriched molecular functions were cation transmembrane transporter, oxidoreductase, hydrolase, and ATPase activities (Figure 3). Twelve of the 242 DE genes encode for proteins that were previously reported in a proteomic analysis to be overexpressed in Rev.1 versus 16M (Table 2), including BMEII0704 (which encodes bacterioferritin) and six genes that encode ABC transporters (Forbes and Gros, 2001).
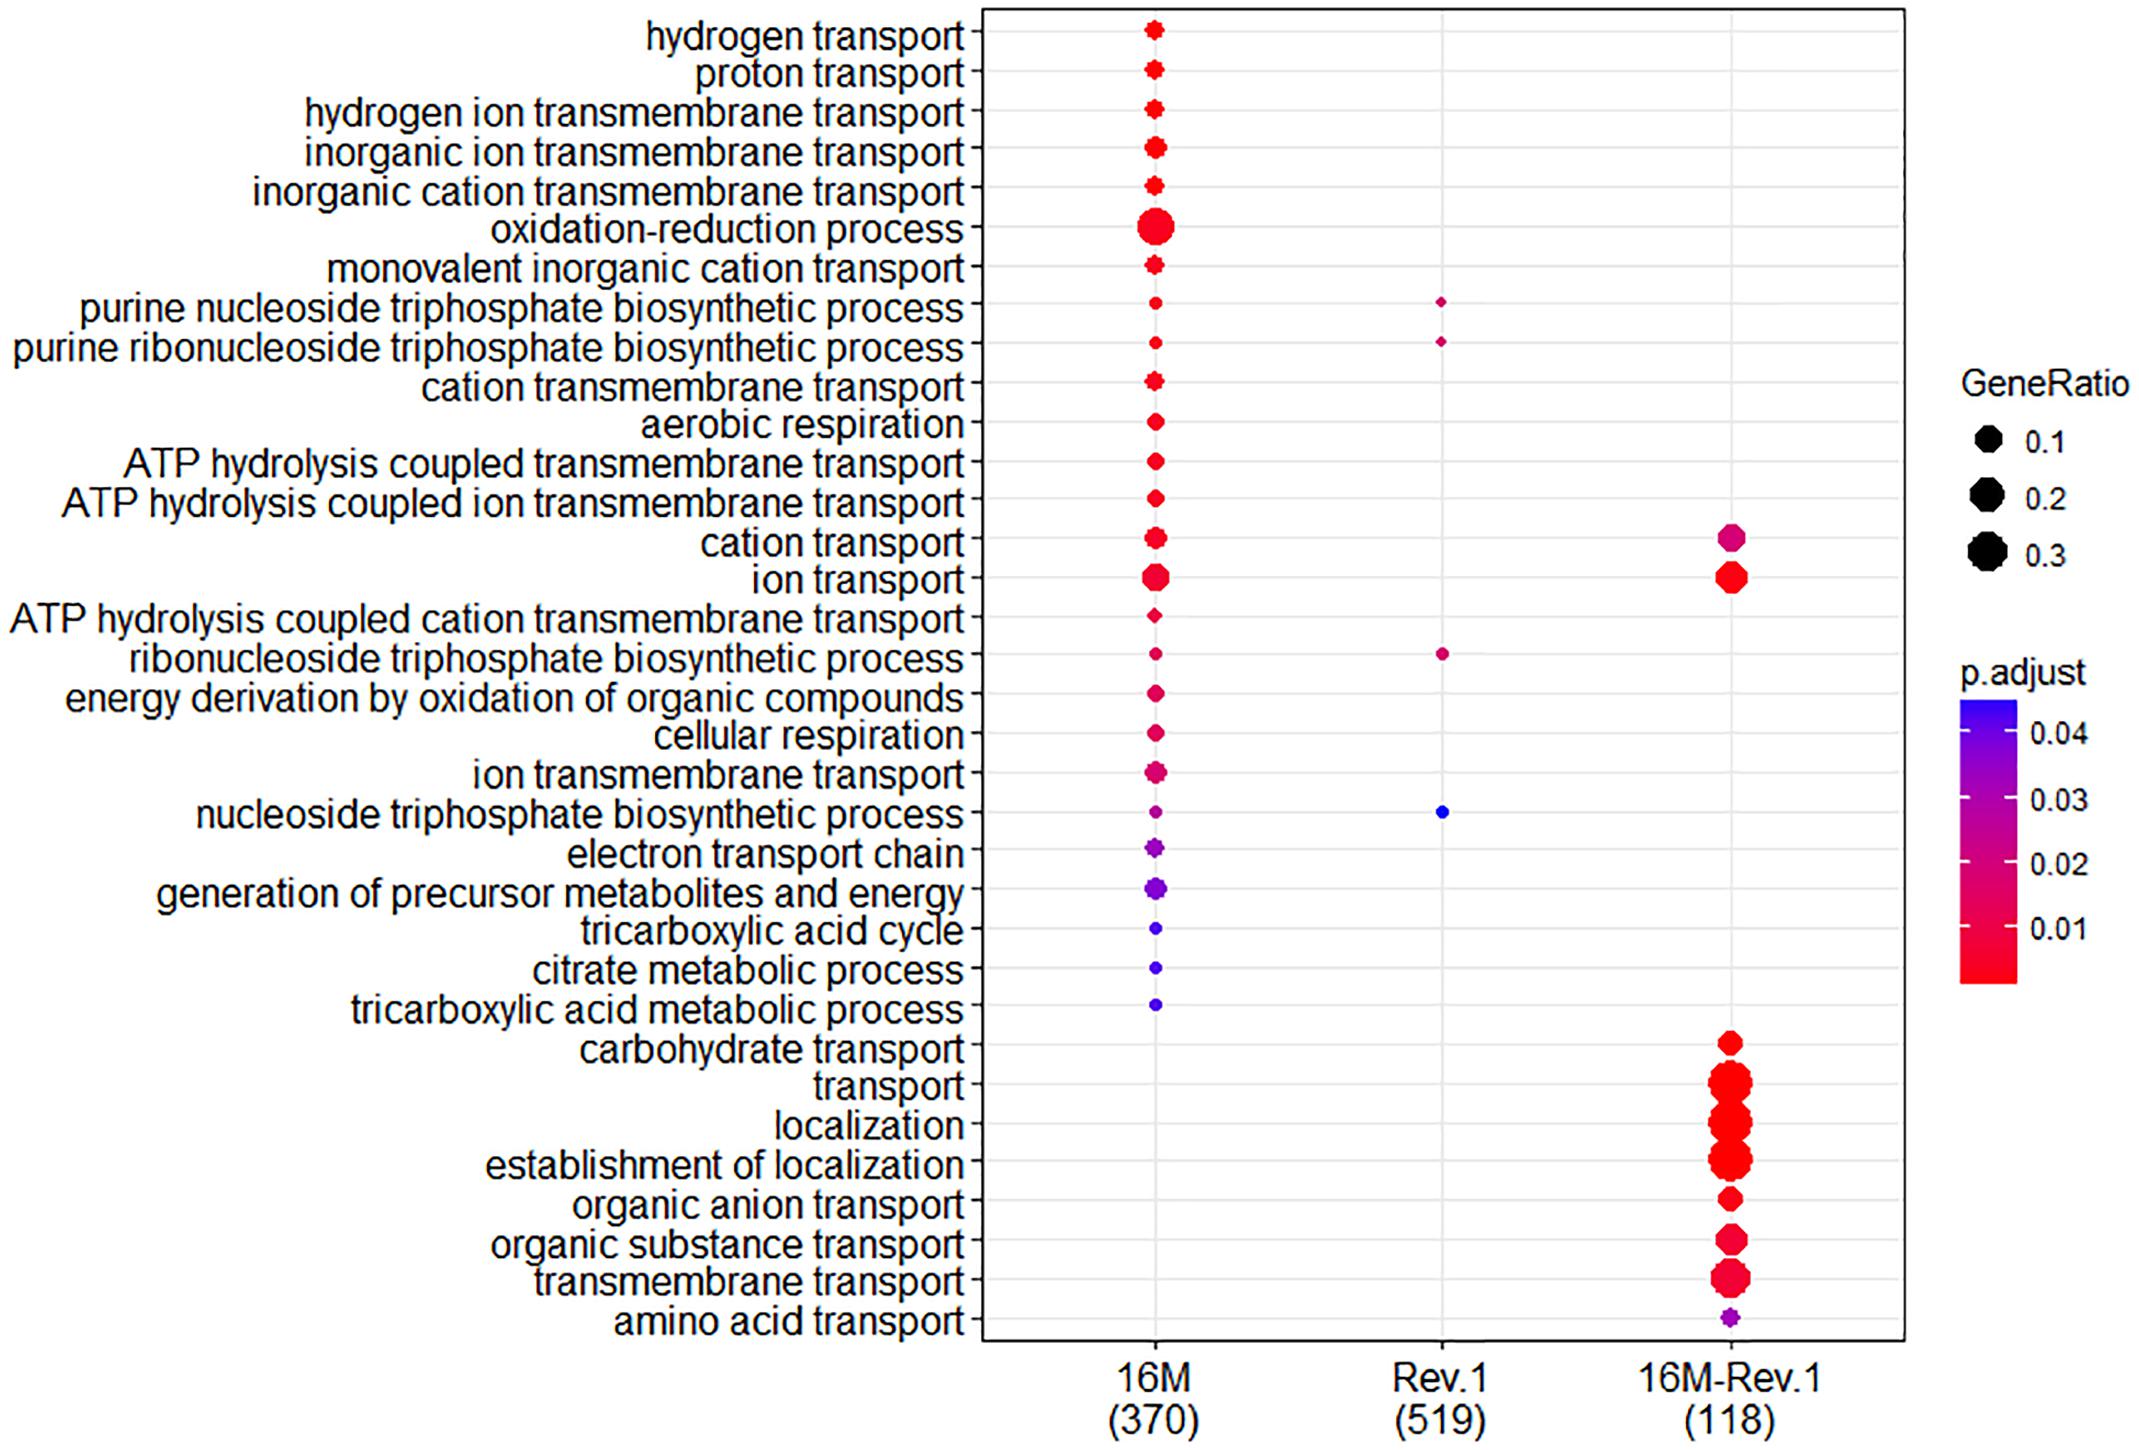
Figure 2. Comparison of biological Gene Ontology (GO) enrichment of the B. melitensis 16M (left column) and Rev.1 (middle column) genes that were differentially expressed when the bacteria were grown under low-pH versus normal-pH conditions. The right column (16M–Rev.1) indicates genes that were differentially expressed in the normal-pH Rev.1 group compared with the normal-pH 16M group. The dot-plot displays two layers of information: significance of enrichment (p-value), which is represented by the color of the dot (highly enriched: red; lowly enriched: blue), and the “gene ratio,” which is the degree of overlap between genes in the tested list and the genes associated with a GO term, represented by the size of each dot (large dots indicate a higher degree of overlap).

Figure 3. Comparison of molecular Gene Ontology (GO) enrichment of the B. melitensis 16M (left column) and Rev.1 (middle column) genes that were differentially expressed when the bacteria were grown under low- versus normal-pH conditions. The right column (16M–Rev.1) indicates genes that were differentially expressed in the normal-pH group of Rev.1, as compared with the normal-pH group of 16M. The dot-plot displays two layers of information: significance of enrichment (p-value), which is represented by the color of the dot (highly enriched: red; lowly enriched: blue), and the “gene ratio,” which is the degree of overlap between genes in the tested list and the genes associated with a GO term, represented by the size of each dot (large dots indicate a higher degree of overlap).
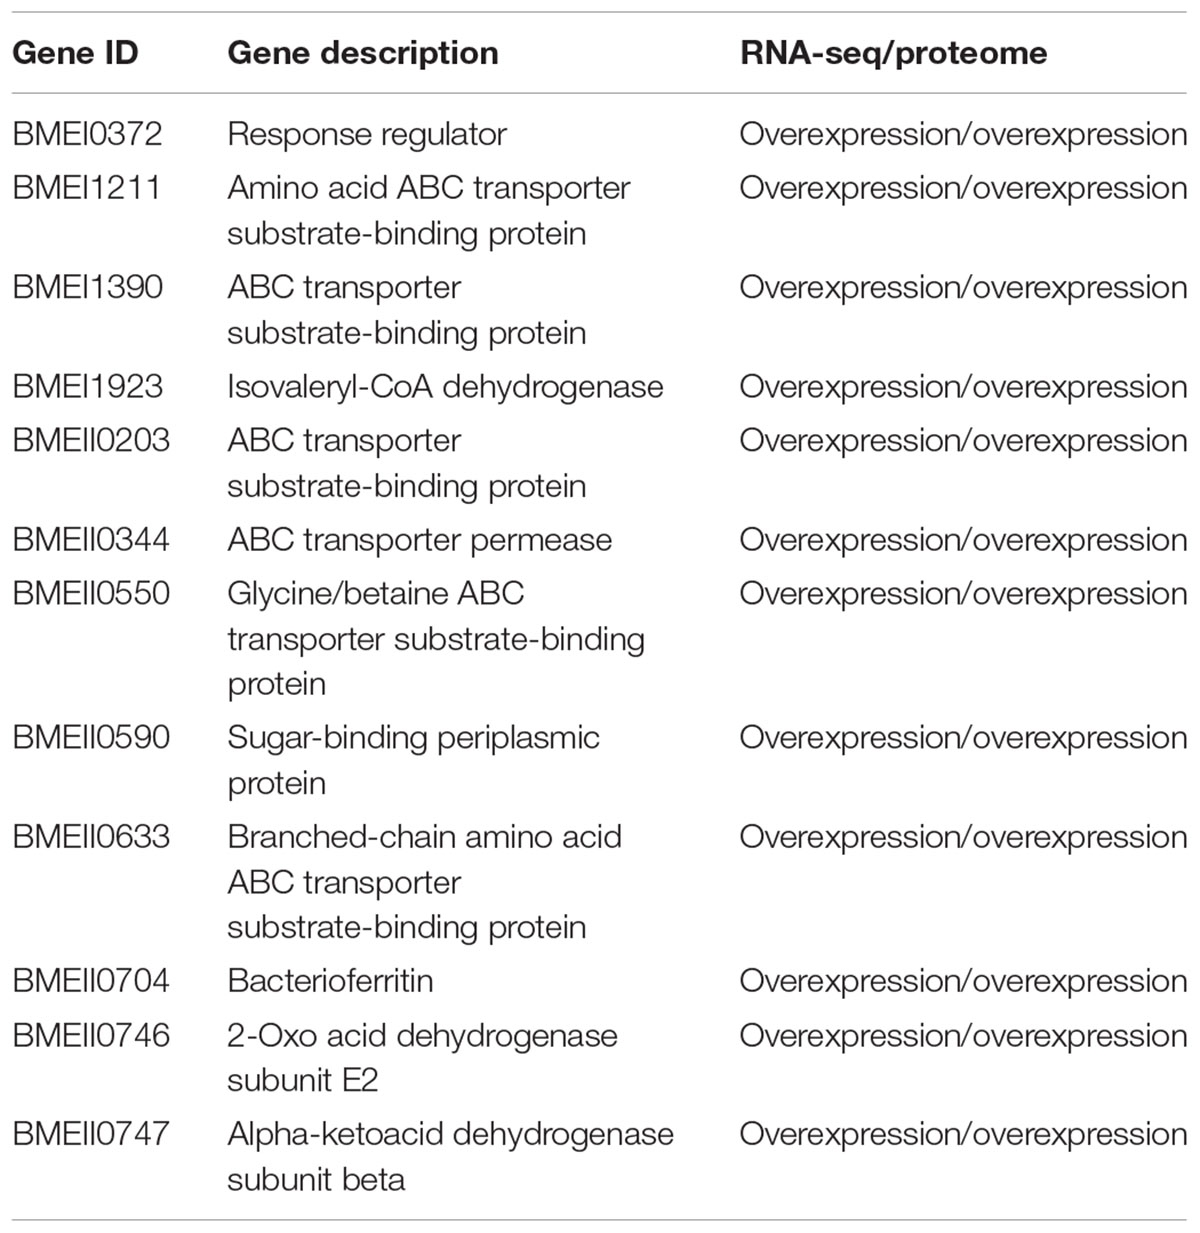
Table 2. List of DE genes found in the reported proteomic analysis.
Next, we compared the genes that we found to be DE between the two strains to a list of Brucella virulence genes obtained from the Brucella Bioinformatics Portal (Xiang et al., 2006). Out of the 212 B. melitensis virulence genes that were reported in the Brucella Bioinformatics Portal, our transcriptomic analysis indicated eight genes that were upregulated and eight genes that were downregulated in Rev.1 versus 16M (Table 3), including six genes that encode transporters, of which three are annotated as sugar transporters.
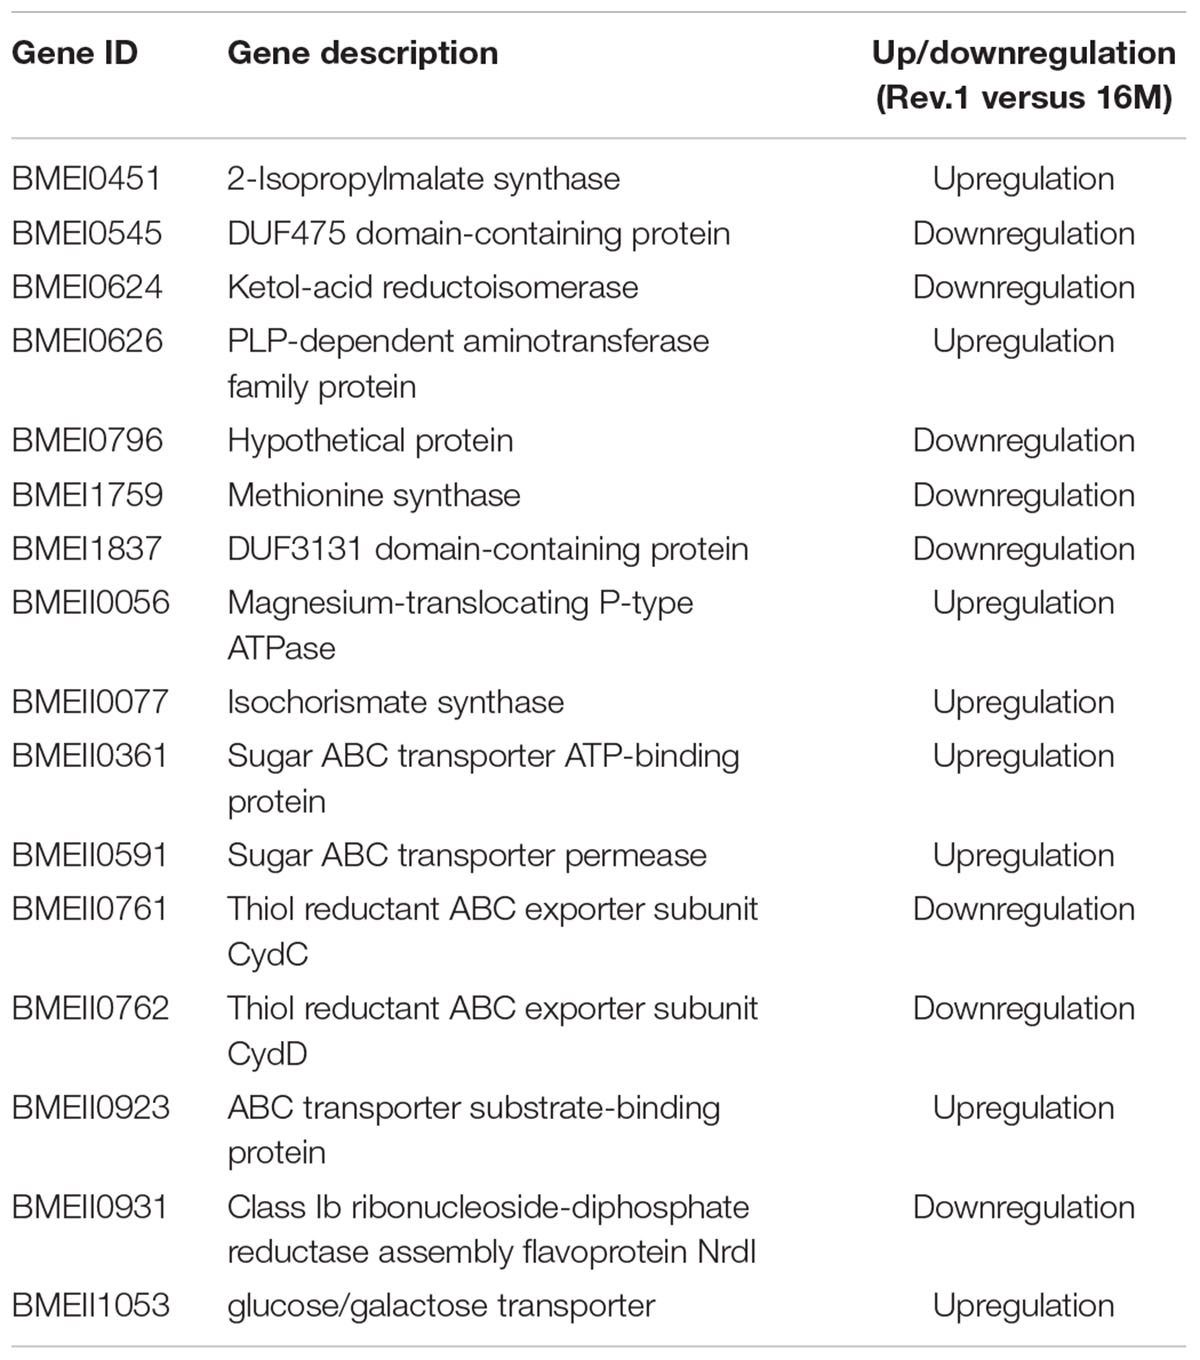
Table 3. List of DE genes found in the Brucella Bioinformatics Portal.
Differential Gene Expression Between B. melitensis 16M Grown Under Low- and Normal-pH Conditions
In total, 773 genes in the 16M strain were DE (FDR < 0.05, fold change ≥ 2) between bacteria grown under normal- and low-pH conditions, of which 374 were upregulated and 399 were downregulated in the low-pH group versus the normal-pH group (Supplementary Table S3). The most enriched biological processes within these DE genes were transport, oxidation–reduction, and nucleoside triphosphate biosynthetic processes (Figure 2), and the most enriched molecular functions were ion and cation transmembrane transporters, oxidoreductase activities, and transition metal ion binding (Figure 3). Recently, Liu et al. (2016) reported 113 genes that are DE (using FDR < 0.05 and fold change ≥ 8) between normal- and low-pH conditions in 16M. Of these genes, 104 were also annotated in our analysis, of which 72 were DE (∼70%; FDR < 0.05, fold change ≥ 2; Supplementary Table S4) between the two conditions, including 24 genes that were upregulated and 48 genes that were downregulated in the low-pH group versus the normal-pH group. Notably, the two-component response regulator BMEI1329, which is involved in the acid resistance of B. melitensis (Liu et al., 2016) was upregulated to a similar extent (namely, a fold-change of ∼4.55) in our analysis and in that of Liu et al. (2016).
Differential Gene Expression Between B. melitensis Rev.1 Grown Under Normal- and Low-pH Conditions
In total, 1076 genes in the Rev.1 strain were DE (FDR < 0.05, fold change ≥ 2) between the low-pH and normal-pH groups, of which 519 genes were upregulated and 557 genes were downregulated in the low-pH versus the normal-pH group (Supplementary Table S5). The most enriched biological process within these DE genes was the nucleoside triphosphate biosynthetic process (Figure 2), and the most enriched molecular functions were rRNA binding and a structural constituent of the ribosome (Figure 3).
The Effects of Low-pH Conditions on Gene Expression in B. melitensis 16M and Rev.1: A Comparison
In total, 560 genes that were DE between the low-pH and normal-pH conditions were common to both 16M and Rev.1, while 213 and 516 of the DE genes were unique to either 16M or Rev.1, respectively (Figure 4). A comparison of the genes that uniquely changed their expression between the low-pH and normal-pH groups in Rev.1 to those that uniquely changed their expression between the two conditions in 16M, in relation to their GO categories, revealed that the main biological processes that were highly enriched in Rev.1 were translation, metabolic process, and transport (transmembrane, amino acid, carbohydrate, and protein), whereas multiple biological processes were enriched in 16M, including pathogenesis, cell division, cell cycle, and cell wall organization (Supplementary Table S6).
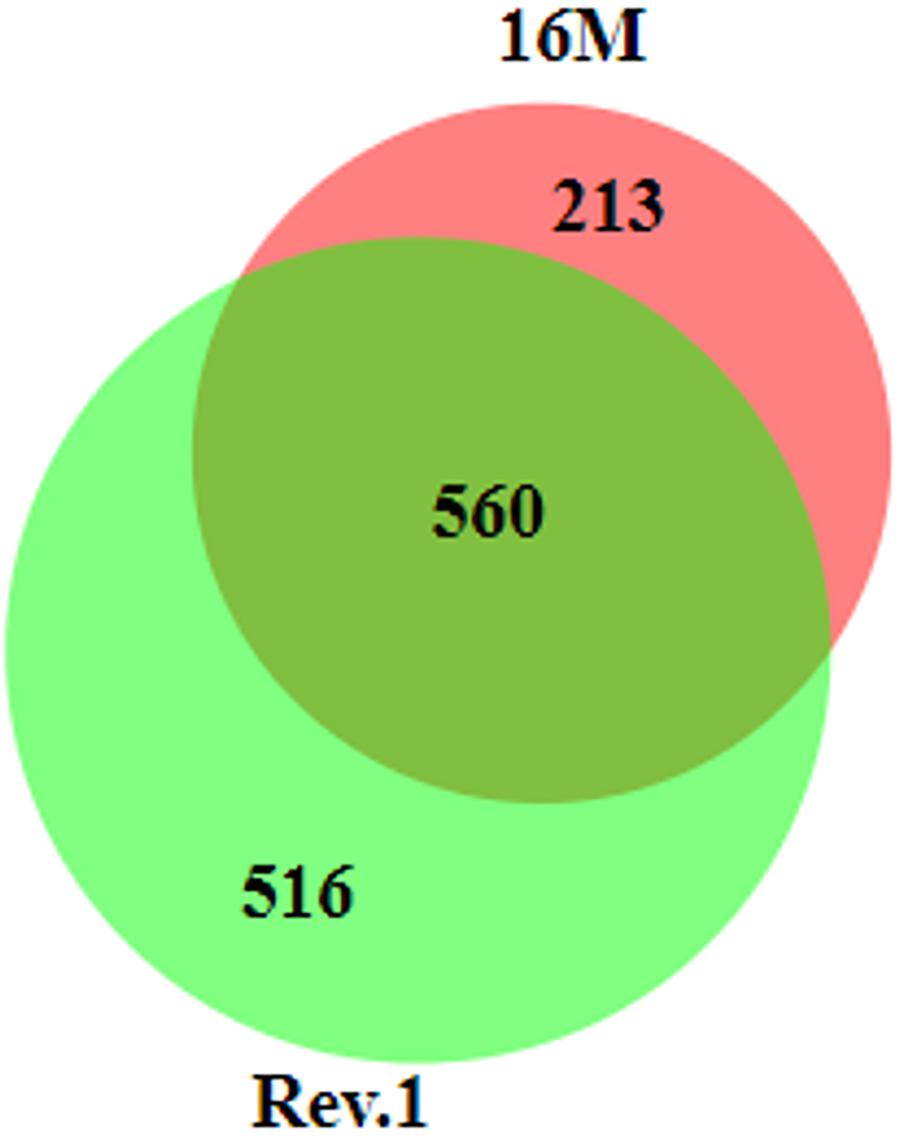
Figure 4. Venn diagram of differentially expressed genes (fold change ≥ 2 and FDR < 0.05) in 16M and Rev.1 under low-pH conditions. The size of the circles and the overlaps correspond to the sizes of the data sets (number of DE genes in each strain). The numbers of overlapping and unique genes in each strain are indicated in the plot. The diagram was generated using BioVenn (Hulsen et al., 2008).
Interaction Genes: Determination of a Possible Link Between Gene Expression, Environmental Stress, and a Specific Strain
In the analyses described above, we assumed that the two major parameters that could affect gene expression—the specific B. melitensis strain (Rev.1 versus 16M) and the environmental pH (4.4 versus 7.3)—are independent. Therefore, we adopted a naive approach and detected the effect of the acidic environment on gene expression in each strain separately, then compared the final list of DE genes. Our next step was to identify the potential dependency between strain and environmental pH, i.e., we sought to detect genes that respond differently to acidic stress in Rev.1 versus 16M. To this end, we added the “interaction” term to our statistical model, which revealed 403 genes that can be referred to as “interaction genes” (FDR < 0.05, fold change ≥ 2; Supplementary Table S7) and may potentially shed light on the attenuation mechanisms of Rev.1. Annotating these “interaction genes” revealed that the most enriched biological processes were related to metabolic, biosynthetic, and transport processes; the most enriched molecular functions were related to catalytic, hydrolase, nucleotide binding, oxidoreductase, and transporter activities; and the most enriched cellular compartments were related to integral components of the membrane (Supplementary Tables S8–S10). To identify genes that are potentially involved in the attenuation and survival of Rev.1, we searched the interaction genes for those that are associated with bacterial virulence and survival within the host and found four highly downregulated genes involved in metabolism processes and mitigation of acidic and oxidative stresses (Table 4). A heatmap of the 403 detected interaction genes, categorized into five clusters, is presented in Figure 5, and the list of genes within each cluster is shown in Supplementary Table S11. Finally, we created a GO Network based on 133 interaction genes with FDR < 0.05 and fold change ≥ 2.8 (Figure 6); as expected, the most enriched GO was related to transport and metabolic processes.
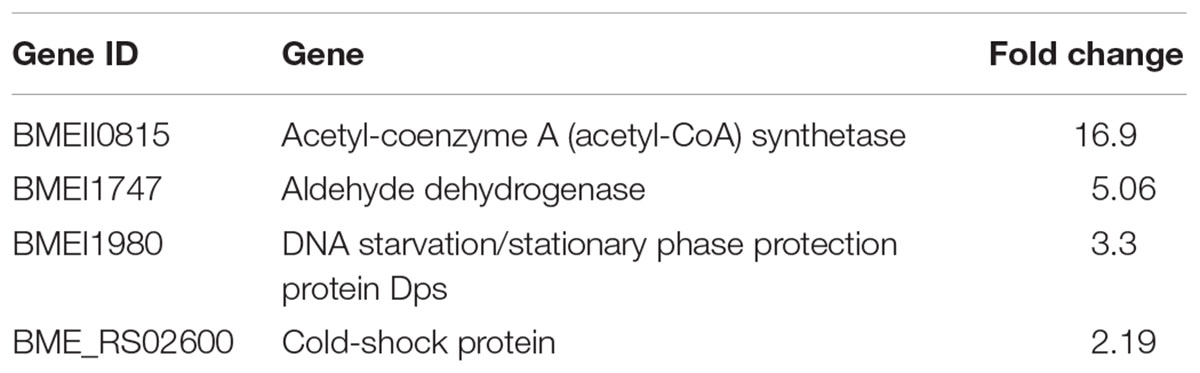
Table 4. Potentially key genes involved in the attenuation of Rev.1.
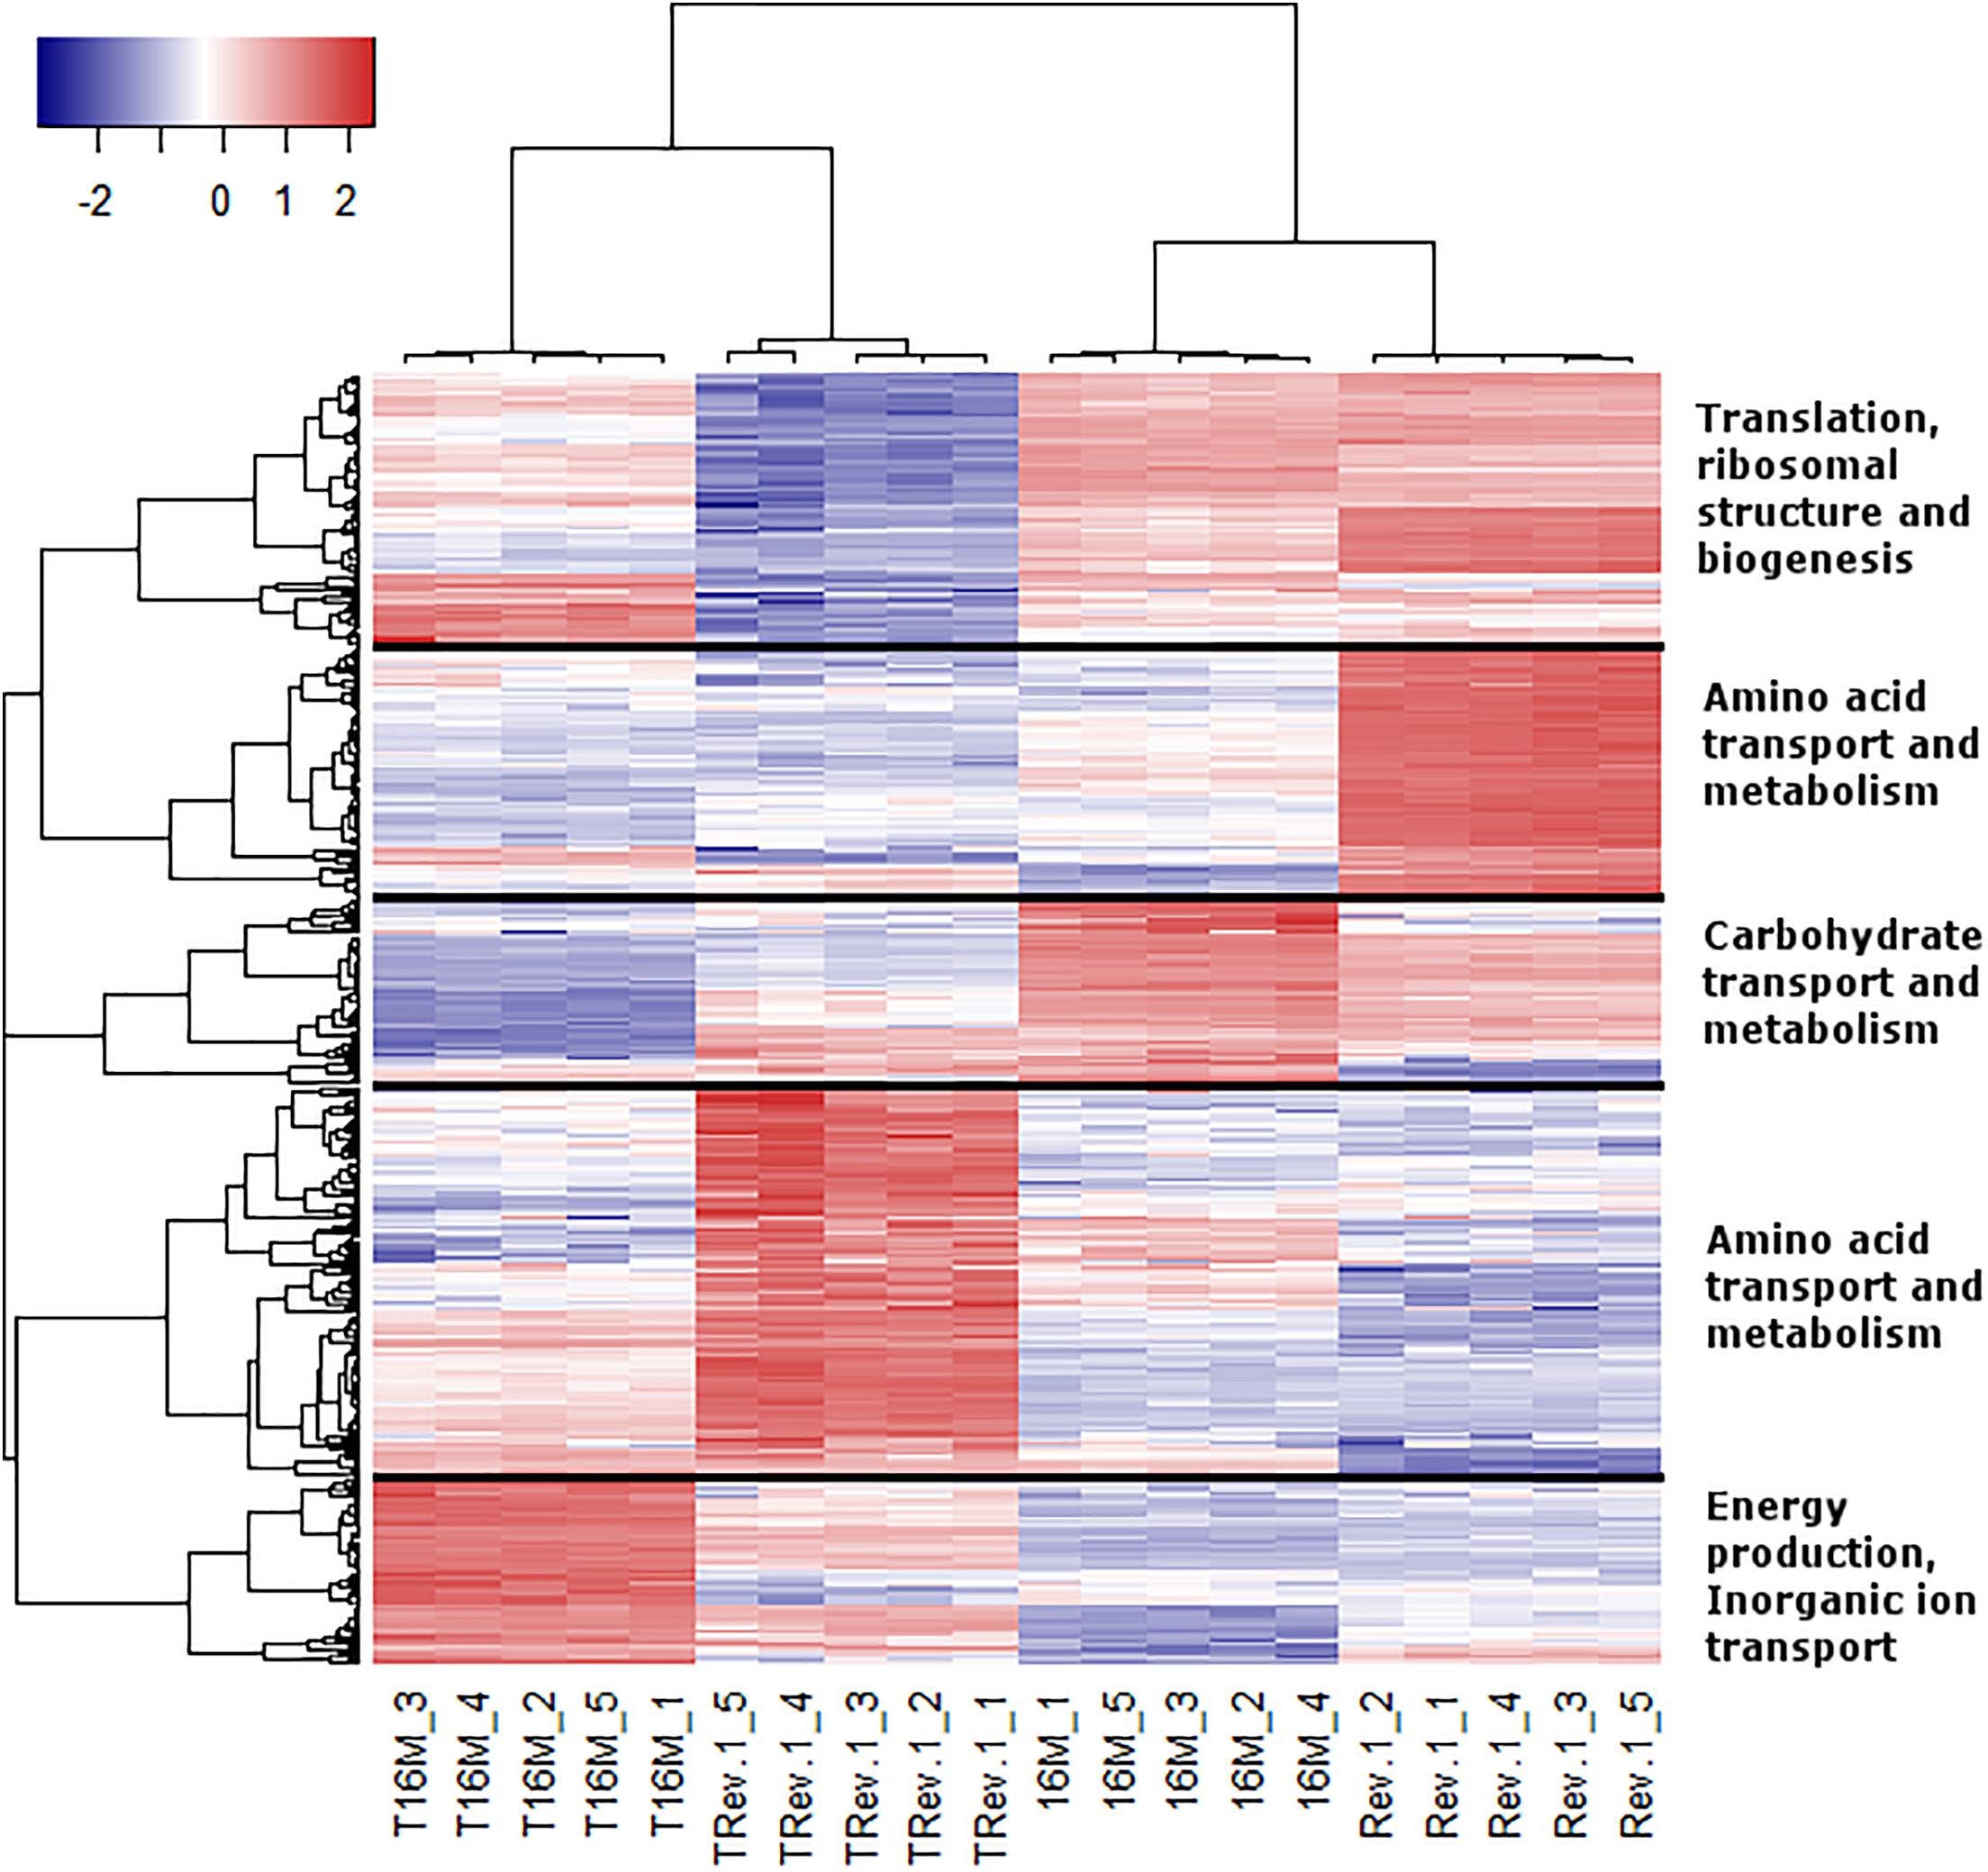
Figure 5. Heatmap representing the expression profiles of the 403 interaction genes. Rows represent genes and columns represent bacterial samples. Red and blue pixels indicate upregulated and downregulated genes (Rev.1 versus 16M), respectively. The hierarchical clustering was generated using 1-Pearson correlation as the distance measure, and “complete” as the linkage method. Genes were categorized into five clusters based on the generated dendrogram, and genes within each cluster were characterized based on Clusters of Orthologous Groups (COGs) annotations.
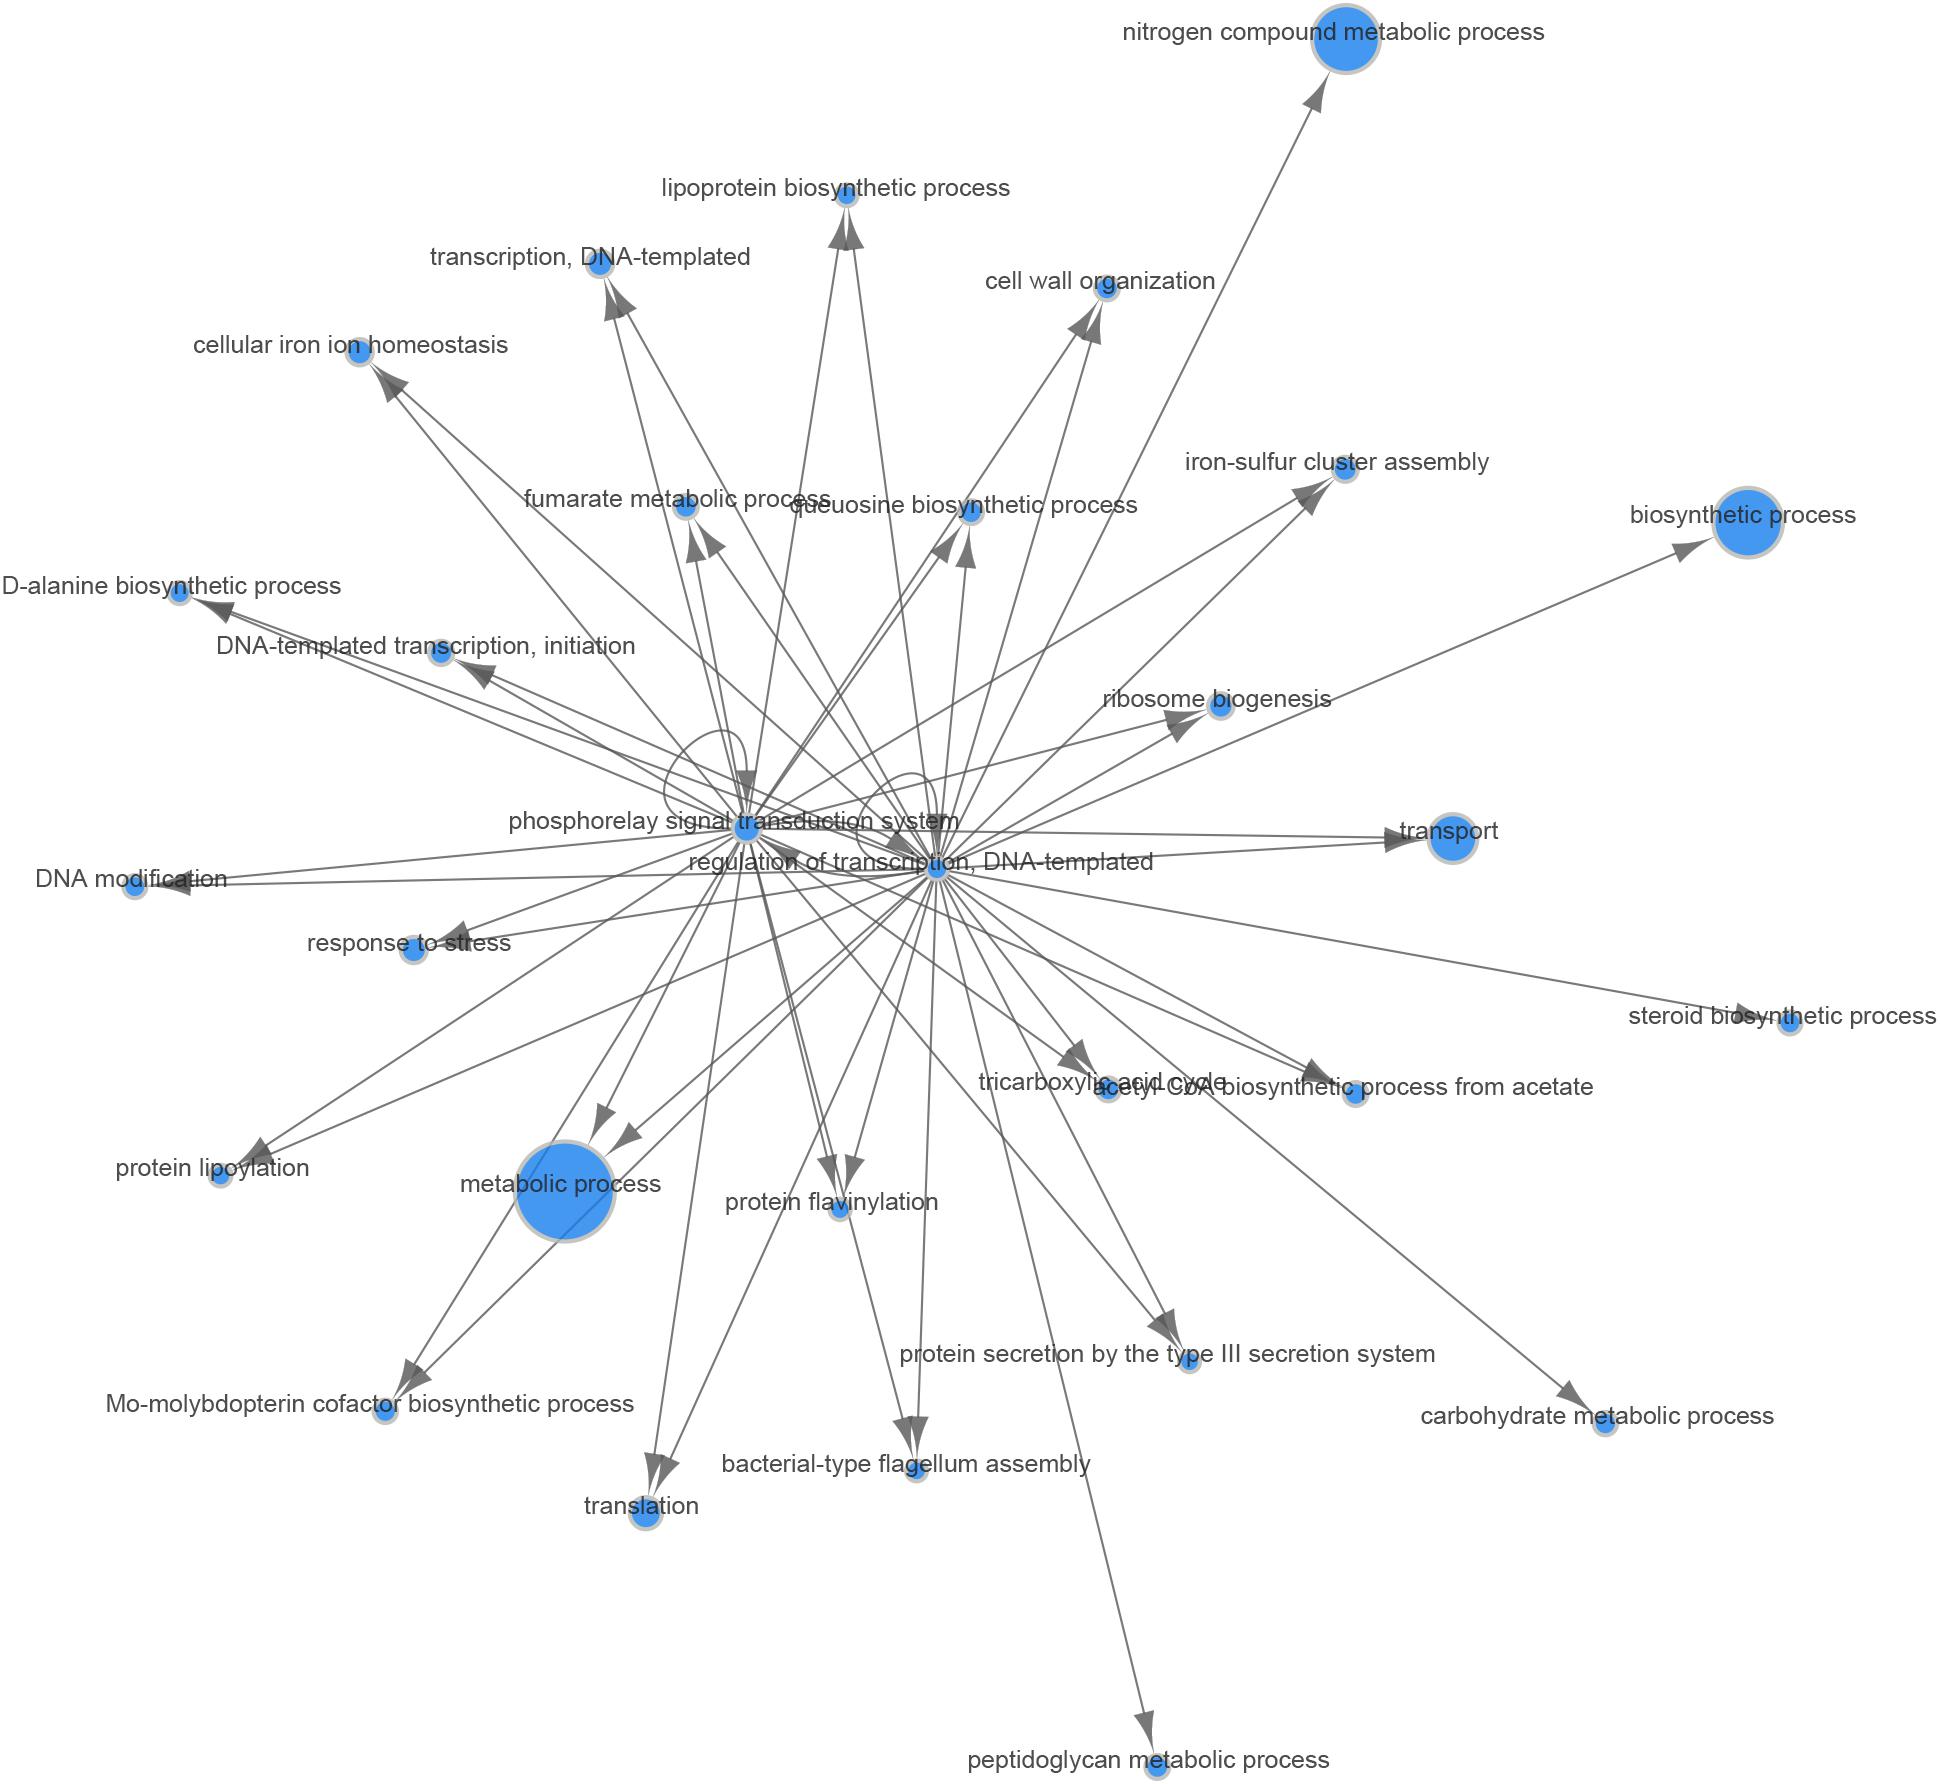
Figure 6. Gene Ontology (GO) network of genes responding differently to low-pH conditions in the Rev.1 versus 16M strains. Of the 403 interaction genes (FDR < 0.05, fold change ≥ 2) expressed differently in Rev.1 versus 16M, the 133 most significant genes (FDR < 0.05, fold change ≥ 2.8) were selected and their GO network was generated using the Comparative GO tool (Fruzangohar et al., 2013). The node sizes represent the level of GO enrichment.
RT-qPCR Validation of the RNA-Seq Results
To ensure technical reproducibility and to validate the data generated from the RNA-seq experiment, we conducted a real-time qPCR analysis of five selected genes (BMEII0027, BMEII0591, BMEI1980, BMEII1116, and BMEI1040), from both strains (16M and Rev.1), grown under either low- or normal-pH conditions. The mRNA levels of all genes obtained by the RT-qPCR were in high accordance with those obtained by our RNA-seq analysis (Supplementary Table S1).
Differential Survival of B. melitensis 16M and Rev.1 Within JEG-3 Human Trophoblastic Cells
As shown by Porte et al. (1999), the acidic environment during the early phase of infection is necessary for the survival and multiplication of Brucella in host cells. Therefore, we investigated the ability of the virulent 16M and the attenuated Rev.1 strains to infect and replicate within the human trophoblastic cell line JEG-3. As expected, the number of bacteria that were replicated over time (4 and 24 h) was higher in 16M than in Rev.1 (Figure 7).
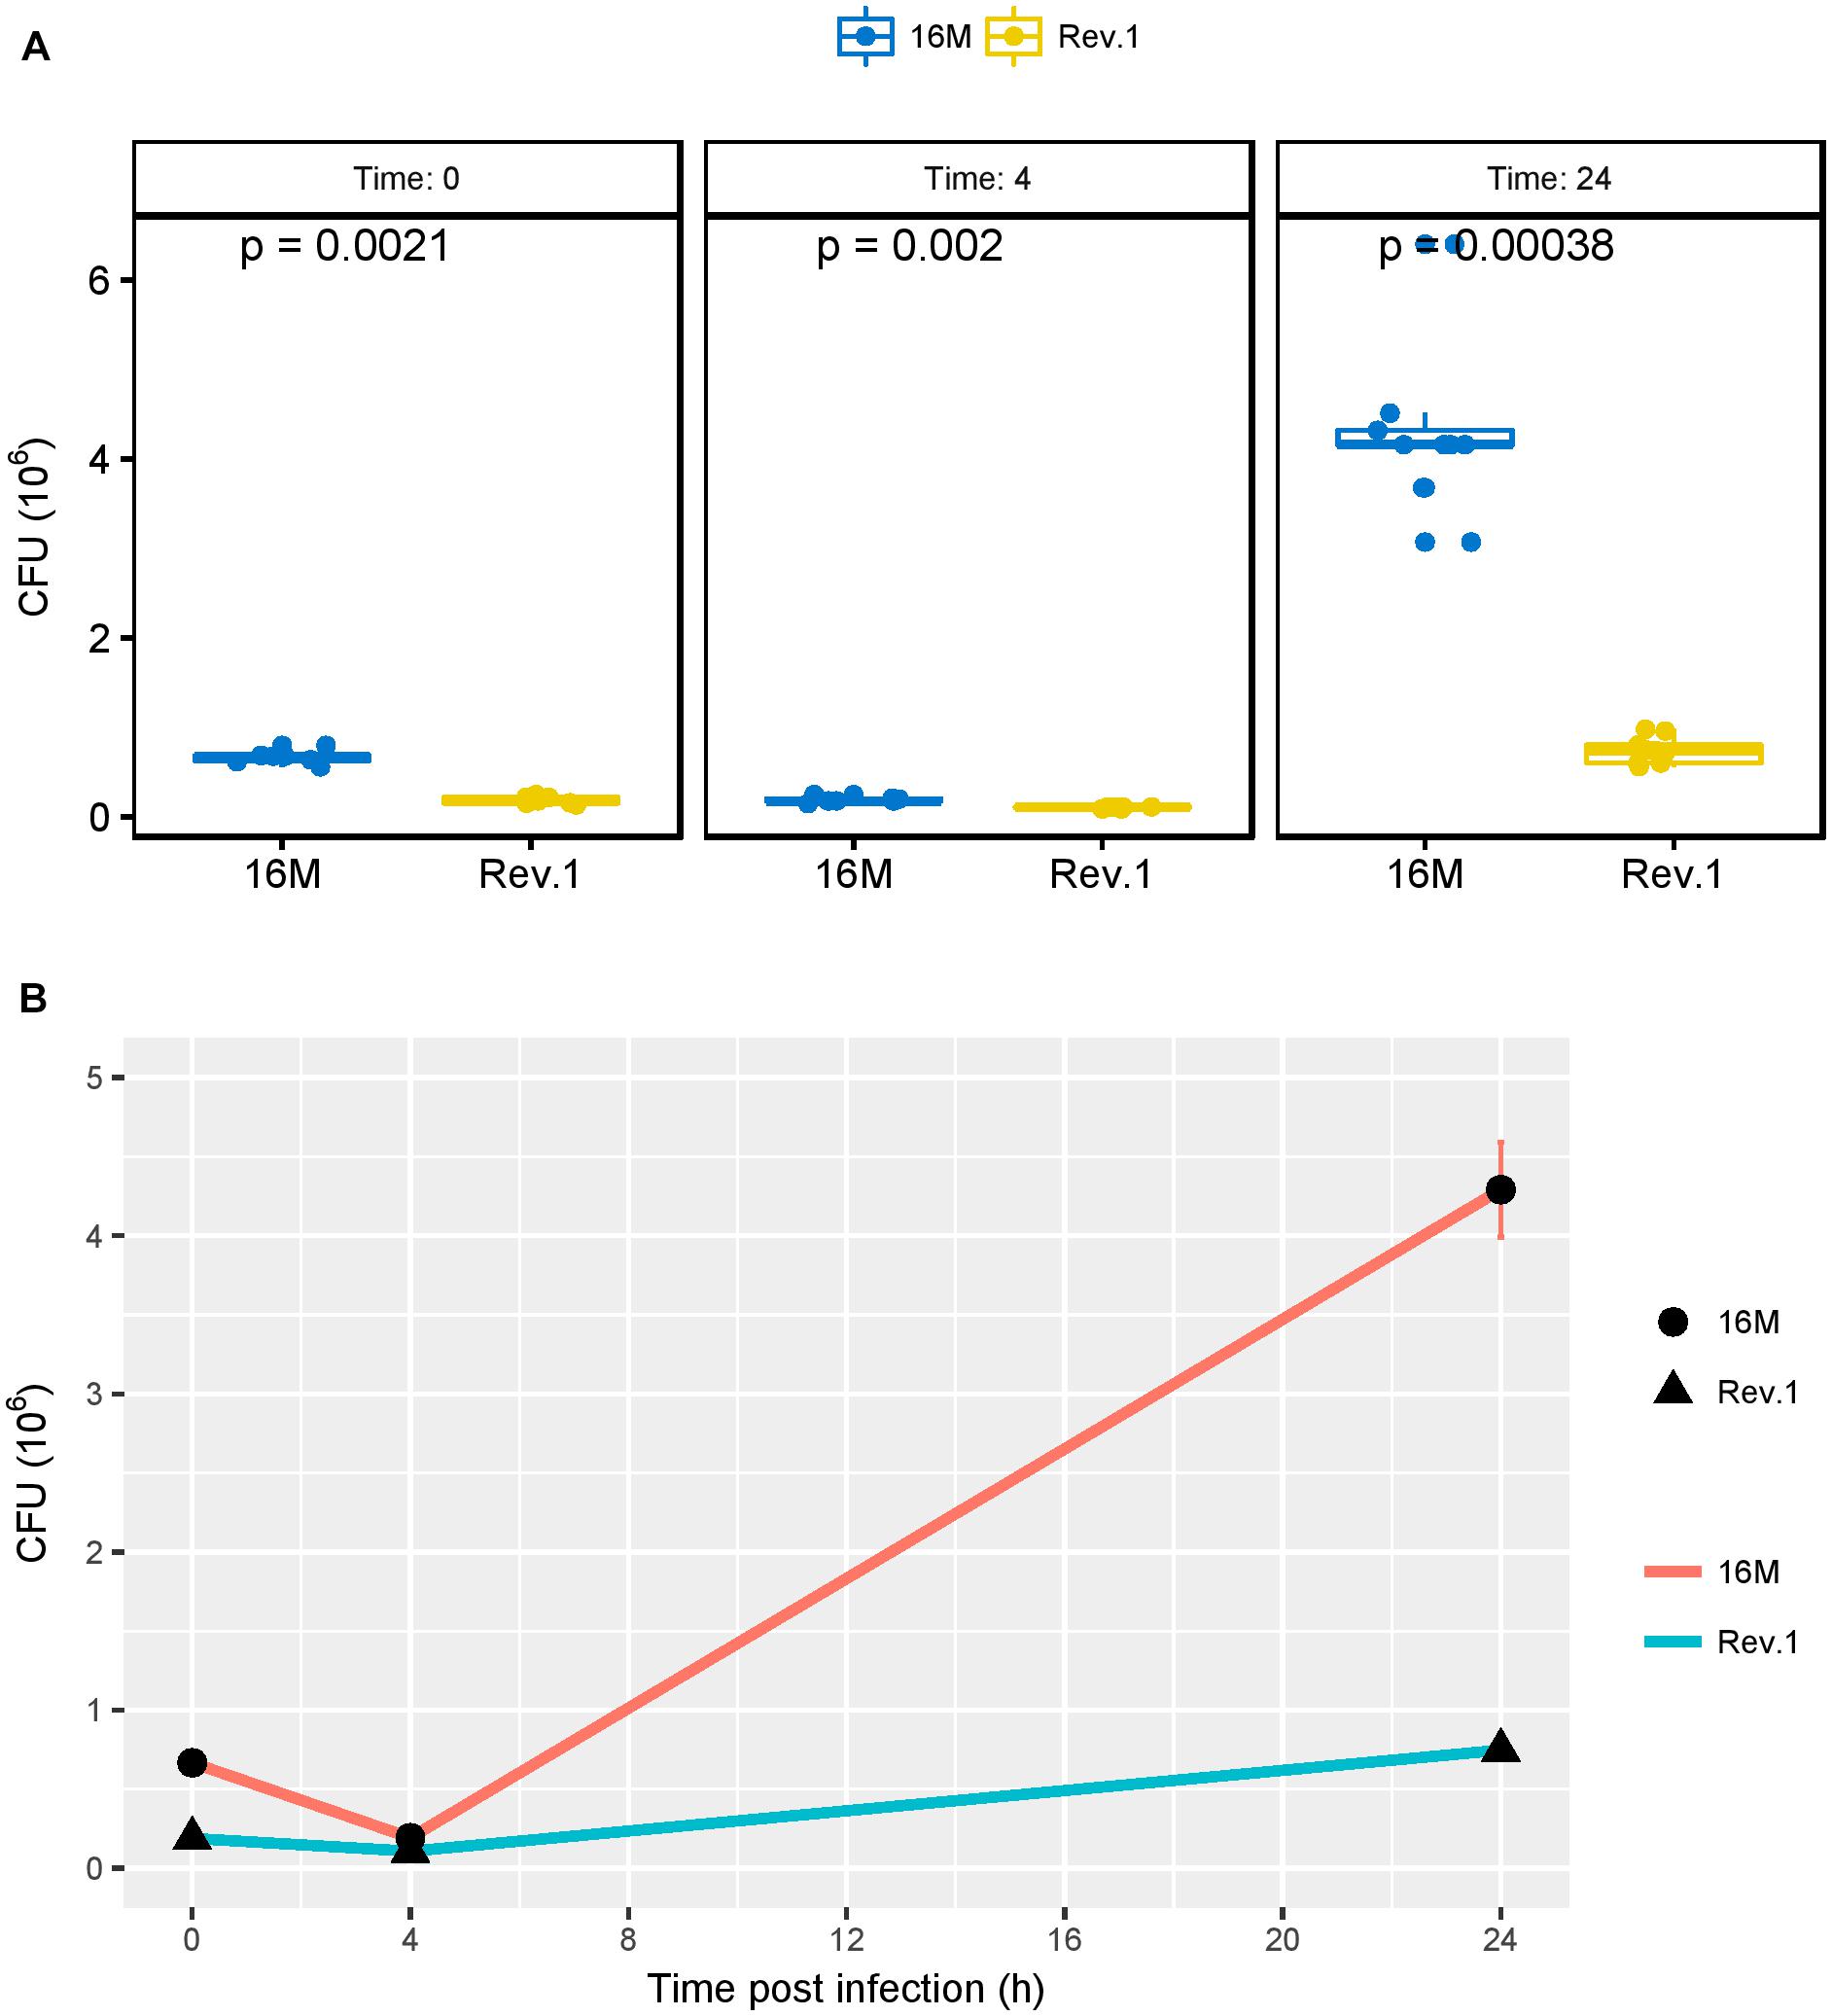
Figure 7. Bacterial burden, measured as colony forming units (CFUs) over time. JEG-3 trophoblasts were infected with bacteria at a MOI of 500, and CFUs were determined 0, 4, and 24 h thereafter. (A) Boxplots representing the distribution of 16M (blue) and Rev.1 (yellow) bacterial count replicates, measured 0, 4, and 24 h following infection. P-values were calculated using two-sample Wilcoxon test. (B) Scatter plot indicating the change in bacterial counts over time (means ± SD) following infection. Three replicate wells were evaluated at each time for each strain.
Discussion
To elucidate the molecular mechanisms underlying the attenuation of the B. melitensis Rev.1 vaccine strain, we conducted a comparative transcriptomic analysis between Rev.1 and its virulent counterpart, 16M, each grown under either normal- or low-pH conditions. When the two strains were grown under normal-pH conditions, Rev.1 showed a marked upregulation, as compared with 16M, of various genes that encode ABC transporters—a large and widespread family of proteins (Garmory and Titball, 2004). ABC transporters, which export solutes, antibiotics, and extracellular toxins, play a role in various cellular processes, such as translational regulation and DNA repair (Garmory and Titball, 2004), and the number of ABC systems appears to depend upon the bacterial adaptation to its environment (Garmory and Titball, 2004; Tanaka et al., 2018). The upregulation of ABC transporter-related genes in the attenuated Rev.1 strain should be considered in light of two other findings. First, Rev.1 showed an upregulated expression of BMEII0704, which encodes for bacterioferritin (Table 2). Notably, iron plays an important role in the survival of pathogens within host cells (Collins, 2003), and during infection, macrophages actively export iron from the phagosome (which is the replicative niche of Brucella; Forbes and Gros, 2001); it was previously suggested that Rev.1 may have lost the ability to regulate bacterioferritin synthesis and degradation (Eschenbrenner et al., 2002). Second, Rev.1 showed a downregulated expression of BMEI1759 (Table 3), which encodes for the vitamin B12-dependent methyltransferase, MetH (Lestrate et al., 2000). As MetH is involved in methionine biosynthesis, its downregulation in Rev.1 may have impaired amino acid metabolism in this strain. Taken together, these finding suggest that an improper regulation of essential metabolic pathways, including iron and amino acid metabolism, may have affected the ABC transporter activity, leading to down/upregulation of specific transporters to compensate for the gain/loss of critical metabolites.
To further understand the molecular mechanisms underlying Rev.1 attenuation, we examined the “interaction genes,” i.e., the main genes that are influenced differently by the acidic treatment in Rev.1 and in 16M. These interaction genes are probably the key genes involved in the attenuation of Rev.1, and are, therefore, of particular interest. Among these interaction genes, we found that acetyl-coenzyme A (acetyl-CoA) synthetase was significantly downregulated in the low-pH group of Rev.1, as compared with the low-pH group of 16M. Acetyl-CoA is the molecule by which glycolytic pyruvate enters the tricarboxylic acid cycle, it is a crucial precursor of lipid synthesis, and it acts as a sole donor of the acetyl groups for acetylation (Pietrocola et al., 2015). Previous studies revealed a clear association between the metabolism of Brucella and its persistence in its hosts (Hong et al., 2000; Lestrate et al., 2000; Barbier et al., 2011). The significantly high downregulation of acetyl-CoA synthetase in Rev.1 may decrease the levels of acetyl-CoA production, thereby affecting crucial metabolic processes that may potentially have a major contribution to bacterial attenuation.
Pathogenic bacteria must deal with oxidative stress emanating from the host immune response during invasion and persistent infection (Cabiscol et al., 2000; Singh et al., 2013). We found several key interaction genes that were significantly downregulated in Rev.1, as compared with 16M, and which encode proteins involved in oxidative stress: aldehyde dehydrogenase (ALDH), the DNA starvation/stationary phase protection protein Dps, and a cold-shock protein (CSP). Prokaryotic and eukaryotic ALDHs metabolize endogenous and exogenous aldehydes to mitigate oxidative stress, (Singh et al., 2013) and an upregulation of bacterial ALDH was shown to occur following exposure to environmental or chemical stressors. It was suggested that such an upregulation is a critical element in the response of bacteria to oxidative stress (Singh et al., 2013). Dps was shown to protect Escherichia coli from oxidative stress, UV and gamma irradiation, iron and copper toxicity, thermal stress, and acid and base shocks (Martinez and Kolter, 1997; Nair and Finkel, 2004; Karas et al., 2015). CSP-A activity was found to be associated with the ability of B. melitensis to resist acidic and H2O2 stresses, especially during the mid-log-phase (Wang et al., 2014), and it was suggested that the Brucella CSP highly contributes to its virulence, most likely by facilitating its adaptation to the harsh environmental circumstances within the host (Wang et al., 2014). Taken together, it is possible that the downregulation of these key interaction genes in Rev.1 results in its inability to cope with oxidative stress in the host, thus contributing to bacterial attenuation.
As compared with Rev.1, 16M demonstrated a downregulation (FDR < 0.05, fold change ≥ 2) of interaction genes that encode for four proteins of the SUF system and the heat-shock protein IbpA, which were shown to be involved in the resistance to heat and oxidative stress (Kitagawa et al., 2000; Angelini et al., 2008; Outten, 2015). In E. coli, the SUF pathway plays a major role in preserving Fe-S cluster biosynthesis under oxidative stress conditions (Angelini et al., 2008; Outten, 2015). The small heat shock proteins (sHsps) IbpA and IbpB were previously suggested to be involved in the resistances to heat and oxidative stress, as overexpression of ibpA and ibpB in E. coli increased the resistance to heat and superoxide stress (Kitagawa et al., 2000). Our transcriptomic analysis revealed enhanced enrichment within the molecular function of oxidoreductase activity in the low-pH group of 16M, but not in the low-pH group of Rev.1. As oxidoreductase protects bacteria against oxidative stress (Lumppio et al., 2001), we assume that the enhanced expression of the SUF system and IbpA by Rev.1, as compared with 16M, compensates for its impaired oxidoreductase activity, thereby enabling survival within the harsh oxidative intracellular environment of the host.
As compared with the low-pH group of 16M, the low-pH group of Rev.1 showed a downregulation (FDR < 0.05, fold change ∼ 2) of five key interaction genes BME_RS02910, BMEI0584, BMEI0583, BME_RS13825, and BMEI1943 that encode for FtsZ, FtsA, FtsQ, FtsK, and DnaA respectively, all of which participate in critical stages of the cell cycle (Margolin, 2005; Sherratt et al., 2010; van den Ent et al., 2008; Bell and Kaguni, 2013; Loose and Mitchison, 2014). This finding may indicate that, in the acidic conditions of the BCV, the replication capabilities of Rev.1 are reduced, which lowers their intracellular survival compared to 16M. The significantly lower intracellular survival of Rev.1 in trophoblasts (Figure 7) supports this conclusion.
Under low-pH conditions, Rev.1 also showed a downregulation of the interaction gene BMEII1048 that encodes the molecular chaperone, GroEL (FDR < 0.05, fold change ∼ 2). Molecular chaperons facilitate protein folding, preventing protein denaturation, and are involved in various cellular processes, including DNA replication, UV mutagenesis, bacterial growth, and RNA transcription (Maleki et al., 2016). Under acidic conditions, partially unfolded proteins may emerge (Mendoza et al., 2017) and molecular chaperones may stabilize them to prevent their acid-induced aggregation. Indeed, the Helicobacter pylori GroEL homolog, HSP60, was shown to be induced upon acid stress (Mendoza et al., 2017). Thus, the downregulation of the interaction gene encoding GroEL in Rev.1 under low-pH conditions may lead to the accumulation of partially unfolded and desaturated proteins, leading to bacterial attenuation.
Finally, the interaction gene BMEII0027, which encodes for the T4SS protein VirB3, was upregulated (FDR < 0.05, fold change ∼ 2) in the low-pH group of 16M, as compared with the low-pH group of Rev.1. This may have a harmful effect on the survival of Rev.1 within host cells, as VirB3 was shown to be essential for Brucella virulence because, together with VirB4, VirB6, VirB8, and the N-terminus of VirB10, it comprises the inner membrane complex of the T4SS apparatus (Ke et al., 2015).
Notably, the Rev.1 upregulated interaction gene BMEII1116 that encodes the HTH-type quorum sensing-dependent transcriptional regulator VjbR, was shown to contribute to the virulence and survival of Brucella by regulating the expression of various virulence factors (Delrue et al., 2005; Weeks et al., 2010). It is possible that this interaction gene somewhat compensates for the lower expression of highly important virulent genes, such as VirB3, in Rev.1.
Conclusion
Through a comparative transcriptomic analysis, we revealed DE key genes involved in various crucial pathways, which are either upregulated or downregulated under acidic conditions in Rev.1, as compared with 16M. We suggest that these genes—and, especially, those mentioned in Table 4—are involved in the molecular mechanisms underlying Rev.1 attenuation, although further characterization through mutation and knockout experiments is required to conclusively determine the role of these genes in acid resistance and virulence attenuation of the B. melitensis Rev.1 strain.
Author Contributions
MS-D and DK conceived and coordinated the study. DK conducted the bacteriology work, acidic experiments, acquired the samples, and extracted RNA. MS-D analyzed the data. TZ performed the real-time PCR validation experiments. All authors interpreted the data, drafted the manuscript, and approved the content for publication.
Conflict of Interest Statement
The authors declare that the research was conducted in the absence of any commercial or financial relationships that could be construed as a potential conflict of interest.
Supplementary Material
The Supplementary Material for this article can be found online at: https://www.frontiersin.org/articles/10.3389/fmicb.2019.00250/full#supplementary-material
Footnotes
- ^http://www.bioinformatics.babraham.ac.uk/projects/fastqc
- ^http://www.bioinformatics.babraham.ac.uk/projects/trim_galore/
- ^https://github.com/aleimba/bac-genomics-scripts/tree/master/cdd2cog
References
Angelini, S., Gerez, C., Ollagnier-de Choudens, S., Sanakis, Y., Fontecave, M., Barras, F., et al. (2008). NfuA, a new factor required for maturing Fe/S proteins in Escherichia coli under oxidative stress and iron starvation conditions. J. Biol. Chem. 283, 14084–14091. doi: 10.1074/jbc.M709405200
Avila-Calderón, E. D., Lopez-Merino, A., Sriranganathan, N., Boyle, S. M., and Contreras-Rodríguez, A. (2013). A history of the development of Brucella vaccines. Biomed. Res. Int. 2013:743509. doi: 10.1155/2013/743509
Banai, M. (2002). Control of small ruminant brucellosis by use of Brucella melitensis Rev.1 vaccine: laboratory aspects and field observations. Vet. Microbiol. 90, 497–519.
Barbier, T., Nicolas, C., and Letesson, J. J. (2011). Brucella adaptation and survival at the crossroad of metabolism and virulence. FEBS Lett. 585, 2929–2934. doi: 10.1016/j.febslet.2011.08.011
Bell, S. P., and Kaguni, J. M. (2013). Helicase loading at chromosomal origins of replication. Cold Spring Harb. Perspect. Biol. 5:a010124. doi: 10.1101/cshperspect.a010124
Binns, D., Dimmer, E., Huntley, R., Barrell, D., O’Donovan, C., and Apweiler, R. (2009). QuickGO: a web-based tool for gene ontology searching. Bioinformatics 25, 3045–3046. doi: 10.1093/bioinformatics/btp536
Boschiroli, M. L., Ouahrani-Bettache, S., Foulongne, V., Michaux-Charachon, S., Bourg, G., Allardet-Servent, A., et al. (2002). The Brucella suis virB operon is induced intracellularly in macrophages. Proc. Natl. Acad. Sci. U.S.A. 99, 1544–1549. doi: 10.1073/pnas.032514299
Cabiscol, E., Tamarit, J., and Ros, J. (2000). Oxidative stress in bacteria and protein damage by reactive oxygen species. Int. Microbiol. 3, 3–8.
Carlson M, P. H. (2018). AnnotationForge: Code for Building Annotation Database Packages. Available at: https://bioconductor.org/packages/release/bioc/html/AnnotationForge.html
Celli, J. (2006). Surviving inside a macrophage: the many ways of Brucella. Res. Microbiol. 157, 93–98. doi: 10.1016/j.resmic.2005.10.002
Collins, H. L. (2003). The role of iron in infections with intracellular bacteria. Immunol. Lett. 85, 193–195.
Comerci, D. J., Martínez-Lorenzo, M. J., Sieira, R., Gorvel, J. P., and Ugalde, R. A. (2001). Essential role of the VirB machinery in the maturation of the Brucella abortus-containing vacuole. Cell. Microbiol. 3, 159–168.
Delrue, R.-M., Deschamps, C., Léonard, S., Nijskens, C., Danese, I., Schaus, J.-M., et al. (2005). A quorum-sensing regulator controls expression of both the type IV secretion system and the flagellar apparatus of Brucella melitensis. Cell. Microbiol. 7, 1151–1161. doi: 10.1111/j.1462-5822.2005.00543.x
Delrue, R.-M., Lestrate, P., Tibor, A., Letesson, J.-J., and De Bolle, X. (2004). Brucella pathogenesis, genes identified from random large-scale screens. FEMS Microbiol. Lett. 231, 1–12.
den Hartigh, A. B., Rolán, H. G., de Jong, M. F., and Tsolis, R. M. (2008). VirB3 to VirB6 and VirB8 to VirB11, but not VirB7, are essential for mediating persistence of Brucella in the reticuloendothelial system. J. Bacteriol. 190, 4427–4436. doi: 10.1128/JB.00406-08
Eschenbrenner, M., Wagner, M. A., Horn, T. A., Kraycer, J. A., Mujer, C. V., Hagius, S., et al. (2002). Comparative proteome analysis of Brucella melitensis vaccine strain Rev.1 and a virulent strain, 16M. J. Bacteriol. 184, 4962–4970.
Forbes, J. R., and Gros, P. (2001). Divalent-metal transport by NRAMP proteins at the interface of host-pathogen interactions. Trends Microbiol. 9, 397–403.
Fruzangohar, M., Ebrahimie, E., Ogunniyi, A. D., Mahdi, L. K., Paton, J. C., and Adelson, D. L. (2013). Comparative GO: a web application for comparative gene ontology and gene ontology-based gene selection in bacteria. PLoS One 8:e58759. doi: 10.1371/journal.pone.0058759
Garmory, H. S., and Titball, R. W. (2004). ATP-binding cassette transporters are targets for the development of antibacterial vaccines and therapies. Infect. Immun. 72, 6757–6763. doi: 10.1128/IAI.72.12.6757-6763.2004
Herzberg, M., and Elberg, S. (1953). Immunization against Brucella infection. I. Isolation and characterization of a streptomycin-dependent mutant. J. Bacteriol. 66, 585–99.
Hong, P. C., Tsolis, R. M., and Ficht, T. A. (2000). Identification of genes required for chronic persistence of Brucella abortus in mice. Infect. Immun. 68,4102–4107.
Hulsen, T., de Vlieg, J., and Alkema, W. (2008). BioVenn – A web application for the comparison and visualization of biological lists using area-proportional Venn diagrams. BMC Genomics 9:488. doi: 10.1186/1471-2164-9-488
Karas, V. O., Westerlaken, I., and Meyer, A. S. (2015). The DNA-binding protein from starved cells (Dps) utilizes dual functions to defend cells against multiple stresses. J. Bacteriol. 197, 3206–3215. doi: 10.1128/JB.00475-15
Ke, Y., Wang, Y., Li, W., and Chen, Z. (2015). Type IV secretion system of Brucella spp. and its effectors. Front. Cell. Infect. Microbiol. 5:72. doi: 10.3389/fcimb.2015.00072
Kitagawa, M., Matsumura, Y., and Tsuchido, T. (2000). Small heat shock proteins, IbpA and IbpB, are involved in resistances to heat and superoxide stresses in Escherichia coli. FEMS Microbiol. Lett. 184, 165–171.
Ko, J., and Splitter, G. A. (2003). Molecular host-pathogen interaction in brucellosis: current understanding and future approaches to vaccine development for mice and humans. Clin. Microbiol. Rev. 16, 65–78.
Köhler, S., Porte, F., Jubier-Maurin, V., Ouahrani-Bettache, S., Teyssier, J., and Liautard, J.-P. (2002). The intramacrophagic environment of Brucella suis and bacterial response. Vet. Microbiol. 90, 299–309.
Law, C. W., Chen, Y., Shi, W., and Smyth, G. K. (2014). Voom: precision weights unlock linear model analysis tools for RNA-seq read counts. Genome Biol. 15:R29. doi: 10.1186/gb-2014-15-2-r29
Lestrate, P., Delrue, R. M., Danese, I., Didembourg, C., Taminiau, B., Mertens, P., et al. (2000). Identification and characterization of in vivo attenuated mutants of Brucella melitensis. Mol. Microbiol. 38, 543–551.
Liu, Q., Liu, X., Yan, F., He, Y., Wei, J., Zhang, Y., et al. (2016). Comparative transcriptome analysis of Brucella melitensis in an acidic environment: identification of the two-component response regulator involved in the acid resistance and virulence of Brucella. Microb. Pathog. 91, 92–98. doi: 10.1016/j.micpath.2015.11.007
Liu, W., Dong, H., Li, J., Ou, Q., Lv, Y., Wang, X., et al. (2015). RNA-seq reveals the critical role of OtpR in regulating Brucella melitensis metabolism and virulence under acidic stress. Sci. Rep. 5:10864. doi: 10.1038/srep10864
Loose, M., and Mitchison, T. J. (2014). The bacterial cell division proteins FtsA and FtsZ self-organize into dynamic cytoskeletal patterns. Nat. Cell Biol. 16, 38–46. doi: 10.1038/ncb2885
Lumppio, H. L., Shenvi, N. V., Summers, A. O., Voordouw, G., and Kurtz, D. M. (2001). Rubrerythrin and rubredoxin oxidoreductase in Desulfovibrio vulgaris: a novel oxidative stress protection system. J. Bacteriol. 183, 101–108. doi: 10.1128/JB.183.1.101-108.2001
Magoc, T., Wood, D., and Salzberg, S. L. (2013). EDGE-pro: estimated degree of gene expression in prokaryotic genomes. Evol. Bioinform. 9, 127–136. doi: 10.4137/EBO.S11250
Maleki, F., Khosravi, A., Nasser, A., Taghinejad, H., and Azizian, M. (2016). Bacterial heat shock protein activity. J. Clin. Diagn. Res. 10, BE01–BE3. doi: 10.7860/JCDR/2016/14568.7444
Marchler-Bauer, A., Zheng, C., Chitsaz, F., Derbyshire, M. K., Geer, L. Y., Geer, R. C., et al. (2013). CDD: conserved domains and protein three-dimensional structure. Nucleic Acids Res. 41, D348–D352. doi: 10.1093/nar/gks1243
Margolin, W. (2005). FtsZ and the division of prokaryotic cells and organelles. Nat. Rev. Mol. Cell Biol. 6, 862–871. doi: 10.1038/nrm1745
Martinez, A., and Kolter, R. (1997). Protection of DNA during oxidative stress by the nonspecific DNA-binding protein Dps. J. Bacteriol. 179, 5188–5194.
Mendoza, J. A., Weinberger, K. K., and Swan, M. J. (2017). The Hsp60 protein of Helicobacter pylori displays chaperone activity under acidic conditions. Biochem. Biophys. Rep. 9, 95–99. doi: 10.1016/j.bbrep.2016.11.011
Nair, S., and Finkel, S. E. (2004). Dps protects cells against multiple stresses during stationary phase. J. Bacteriol. 186, 4192–4198. doi: 10.1128/JB.186.13.4192-4198.2004
Outten, F. W. (2015). Recent advances in the Suf Fe-S cluster biogenesis pathway: beyond the Proteobacteria. Biochim. Biophys. Acta 1853, 1464–1469. doi: 10.1016/j.bbamcr.2014.11.001
Pietrocola, F., Galluzzi, L., Bravo-San Pedro, J. M., Madeo, F., and Kroemer, G. (2015). Acetyl coenzyme A: a central metabolite and second messenger. Cell Metab. 21, 805–821. doi: 10.1016/j.cmet.2015.05.014
Poester, F. P., Samartino, L. E., and Santos, R. L. (2013). Pathogenesis and pathobiology of brucellosis in livestock. Rev. Sci. Tech. 32, 105–115.
Porte, F., Liautard, J. P., and Köhler, S. (1999). Early acidification of phagosomes containing Brucella suis is essential for intracellular survival in murine macrophages. Infect. Immun. 67, 4041–4047.
Robinson, M. D., McCarthy, D. J., and Smyth, G. K. (2010). edgeR: a bioconductor package for differential expression analysis of digital gene expression data. Bioinformatics 26, 139–140. doi: 10.1093/bioinformatics/btp616
Robinson, M. D., and Oshlack, A. (2010). A scaling normalization method for differential expression analysis of RNA-seq data. Genome Biol. 11:R25. doi: 10.1186/gb-2010-11-3-r25
Roop, R. M., Gaines, J. M., Anderson, E. S., Caswell, C. C., and Martin, D. W. (2009). Survival of the fittest: how Brucella strains adapt to their intracellular niche in the host. Med. Microbiol. Immunol. 198, 221–238. doi: 10.1007/s00430-009-0123-8
Salmon-Divon, M., Banai, M., Bardenstein, S., Blum, S. E., and Kornspan, D. (2018a). Complete genome sequence of the live attenuated vaccine strain Brucella melitensis Rev.1. Genome Announc. 6:e00175-18. doi: 10.1128/genomeA.00175-18
Salmon-Divon, M., Yeheskel, A., and Kornspan, D. (2018b). Genomic analysis of the original Elberg Brucella melitensis Rev.1 vaccine strain reveals insights into virulence attenuation. Virulence 9, 1436–1448. doi: 10.1080/21505594.2018.1511677
Sherratt, D. J., Arciszewska, L. K., Crozat, E., Graham, J. E., and Grainge, I. (2010). The Escherichia coli DNA translocase FtsK. Biochem. Soc. Trans. 38, 395–398. doi: 10.1042/BST0380395
Singh, S., Brocker, C., Koppaka, V., Chen, Y., Jackson, B. C., Matsumoto, A., et al. (2013). Aldehyde dehydrogenases in cellular responses to oxidative/electrophilic stress. Free Radic. Biol. Med. 56, 89–101. doi: 10.1016/j.freeradbiomed.2012.11.010
Smith, E. P., Miller, C. N., Child, R., Cundiff, J. A., and Celli, J. (2016). Postreplication roles of the Brucella VirB type IV secretion system uncovered via conditional expression of the VirB11 ATPase. MBio 7:e01730-16. doi: 10.1128/mBio.01730-16
Smyth, G. K. (2005). “Limma: linear models for microarray data,” in Bioinformatics and Computational Biology Solutions Using R and Bioconductor, eds R. Gentleman, V. Carey, and S. Dudoit (Berlin: Springer), 397–420.
Starr, T., Ng, T. W., Wehrly, T. D., Knodler, L. A., and Celli, J. (2008). Brucella intracellular replication requires trafficking through the late endosomal/lysosomal compartment. Traffic 9, 678–694. doi: 10.1111/j.1600-0854.2008.00718.x
Tanaka, K. J., Song, S., Mason, K., and Pinkett, H. W. (2018). Selective substrate uptake: the role of ATP-binding cassette (ABC) importers in pathogenesis. Biochim. Biophys. Acta 1860, 868–877. doi: 10.1016/j.bbamem.2017.08.011
van den Ent, F., Vinkenvleugel, T. M. F., Ind, A., West, P., Veprintsev, D., Nanninga, N., et al. (2008). Structural and mutational analysis of the cell division protein FtsQ. Mol. Microbiol. 68, 110–123. doi: 10.1111/j.1365-2958.2008.06141.x
von Bargen, K., Gorvel, J.-P., and Salcedo, S. P. (2012). Internal affairs: investigating the Brucella intracellular lifestyle. FEMS Microbiol. Rev. 36, 533–562. doi: 10.1111/j.1574-6976.2012.00334.x
Wang, Z., Wang, S., and Wu, Q. (2014). Cold shock protein A plays an important role in the stress adaptation and virulence of Brucella melitensis. FEMS Microbiol. Lett. 354, 27–36. doi: 10.1111/1574-6968.12430
Weeks, J. N., Galindo, C. L., Drake, K. L., Adams, G. L., Garner, H. R., and Ficht, T. A. (2010). Brucella melitensis VjbR and C12-HSL regulons: contributions of the N-dodecanoyl homoserine lactone signaling molecule and LuxR homologue VjbR to gene expression. BMC Microbiol. 10:167. doi: 10.1186/1471-2180-10-167
Xiang, Z., Zheng, W., and He, Y. (2006). BBP: Brucella genome annotation with literature mining and curation. BMC Bioinformatics 7:347. doi: 10.1186/1471-2105-7-347
Ye, J., Coulouris, G., Zaretskaya, I., Cutcutache, I., Rozen, S., and Madden, T. L. (2012). Primer-BLAST: a tool to design target-specific primers for polymerase chain reaction. BMC Bioinformatics 13:134. doi: 10.1186/1471-2105-13-134
Yu, G., Wang, L.-G., Han, Y., and He, Q.-Y. (2012). clusterProfiler: an R package for comparing biological themes among gene clusters. Omics A J. Integr. Biol. 16, 284–287. doi: 10.1089/omi.2011.0118
Keywords: Brucella melitensis 16M, Brucella melitensis Rev.1, acid stress, attenuation, virulence, transcriptomic analyses, RNA-Seq
Citation: Salmon-Divon M, Zahavi T and Kornspan D (2019) Transcriptomic Analysis of the Brucella melitensis Rev.1 Vaccine Strain in an Acidic Environment: Insights Into Virulence Attenuation. Front. Microbiol. 10:250. doi: 10.3389/fmicb.2019.00250
Received: 24 October 2018; Accepted: 30 January 2019;
Published: 14 February 2019.
Edited by:
Axel Cloeckaert, Institut National de la Recherche Agronomique (INRA), FranceReviewed by:
Caterina Guzmán-Verri, National University of Costa Rica, Costa RicaRamesh Vemulapalli, Texas A&M University, United States
Thomas A. Ficht, Texas A&M University, United States
Copyright © 2019 Salmon-Divon, Zahavi and Kornspan. This is an open-access article distributed under the terms of the Creative Commons Attribution License (CC BY). The use, distribution or reproduction in other forums is permitted, provided the original author(s) and the copyright owner(s) are credited and that the original publication in this journal is cited, in accordance with accepted academic practice. No use, distribution or reproduction is permitted which does not comply with these terms.
*Correspondence: Mali Salmon-Divon, malisa@ariel.ac.il David Kornspan, davidko@moag.gov.il