 Yangbo Song
 Patrick Gibney3
 Lailiang Cheng
 Gregory Peck
- 1College of Enology, Northwest A&F University, Yangling, China
- 2Horticulture Section, School of Integrative Plant Science, Cornell University, Ithaca, NY, United States
- 3Department of Food Science, Cornell University, Ithaca, NY, United States
The fermentation of apple juice into hard cider is a complex biochemical process that transforms sugars into alcohols by yeast, of which Saccharomyces cerevisiae is the most widely used species. Among many factors, hydrogen sulfide (H2S) production by yeast during cider fermentation is affected by yeast strain and yeast assimilable nitrogen (YAN) concentration in the apple juice. In this study, we investigated the regulatory mechanism of YAN concentration on S. cerevisiae H2S formation. Two S. cerevisiae strains, UCD522 (a H2S-producing strain) and UCD932 (a non-H2S-producing strain), were used to ferment apple juice that had Low, Intermediate, and High diammonium phosphate (DAP) supplementation. Cider samples were collected 24 and 72 h after yeast inoculation. Using RNA-Seq, differentially expressed genes (DEGs) identification and annotation, Gene Ontology (GO), and Kyoto Encyclopedia of Genes and Genomes (KEGG) pathway enrichment, we found that gene expression was dependent on yeast strain, fermentation duration, H2S formation, and the interaction of these three factors. For UCD522, under the three DAP treatments, a total of 30 specific GO terms were identified. Of the 18 identified KEGG pathways, “Sulfur metabolism,” “Glycine, serine and threonine metabolism,” and “Biosynthesis of amino acids” were significantly enriched. Both GO and KEGG analyses revealed that the “Sulfate Reduction Sequence (SRS) pathway” was significantly enriched. We also found a complex relationship between H2S production and stress response genes. For UCD522, we confirm that there is a non-linear relationship between YAN and H2S production, with the Low and Intermediate treatments having greater H2S production than the High treatment. By integrating results obtained through the transcriptomic analysis with yeast physiological data, we present a mechanistic view into the H2S production by yeast as a result of different concentrations of YAN during cider fermentation.
Introduction
Hard cider, simply referred to as cider in this paper, is a fermented beverage made from apple (Malus × domestica Borkh.) juice. Commercial cider producers use techniques and yeast strains similar to industry standards for grape-based wines. Hydrogen sulfide, which smells like “rotten eggs” (sensory threshold >0.00041 mg L–1), is a common off-aroma compound formed by yeast (Saccharomyces cerevisiae) during cider fermentation. Many environmental factors, such as nitrogen, vitamin, and metal ion concentration, fermentation temperature, juice turbidity, soluble solids concentration, acidity, fungicides, and sulfite (SO2) additions, have been reported to affect H2S production (Spiropoulos et al., 2000; Peck et al., 2016; Boudreau et al., 2017b). In particular, H2S is often released when nitrogen concentration is deficient in apple juice (Giudici, 1994; Sadhu et al., 2014).
There are three main pathways through which H2S may be produced by S. cerevisiae: degradation of sulfur-containing amino acids, the reduction of elemental sulfur, and the reduction of sulfite or sulfate (Hansen et al., 1994; Jiranek et al., 1995; Noble et al., 2015). When yeast produce H2S during fermentation, it is most often a result of the sulfate reduction sequence (SRS) pathway. S. cerevisiae reduces sulfate or sulfite for the synthesis of the sulfur-containing amino acids methionine and cysteine and their derivatives (Linderholm et al., 2008). The SRS pathway is multifaceted and responsive to numerous regulatory inputs. Both cysteine and methionine are chemically reactive under reductive fermentation conditions, which induces H2S and other undesirable sulfur-containing compounds (Boudreau et al., 2017a). Sulfite reductase is responsible for reducing sulfite to sulfide and is regulated by general amino acid control, cysteine, and methionine (Mountain et al., 1991). Previous reports suggest that cysteine and its derivatives, rather than methionine, are the main end products that regulate the pathway activity (Hansen and Johannesen, 2000).
Nitrogen is a critical nutrient that affects yeast growth (Crépin et al., 2014), fermentation performance (Freese et al., 2011; Brice et al., 2014; Walker et al., 2014), and the development of organoleptic qualities in ciders (Rollero et al., 2015). In the fermented beverage industry, nitrogen available for yeast metabolism is referred to as yeast assimilable nitrogen (YAN). YAN is the combination of organic [also known as free amino nitrogen (FAN)] and inorganic [ammonia (NH3) and ammonium (NH4+)] available for S. cerevisiae to use during fermentation. Free amino acids are the main constituent of YAN in apple juice. Although apple juice nitrogen concentration and composition can vary greatly among cultivars, geographic locations, and management practices, YAN concentrations are often reported to be below 140 mg N L–1, a value considered the minimum recommended YAN concentration for fermentation of fruit juice by S. cerevisiae (Boudreau et al., 2017b; Ma et al., 2018). Low nitrogen levels in apple juice may cause sluggish or incomplete fermentations (i.e., when not all of the sugars are metabolized by the yeast) (Blateyron and Sablayrolles, 2001). Commercial cider producers often add exogenous inorganic nitrogen in the form of diammonium phosphate (DAP) to compensate for low YAN apple juice. Interestingly, yeast may produce increased levels of H2S as a response to both low and high YAN concentrations depending on the yeast strain (Spiropoulos et al., 2000).
There are almost 30 nitrogen-containing compounds that can be metabolized by yeast (Godard et al., 2007). Research is mixed as to the sequential order that yeast metabolize different nitrogenous compounds. Zhang et al. (2018) suggested that ammonium, glutamine, glutamate, and asparagine are preferred over urea, proline, and allantoin, but other authors have found different responses depending on the yeast species and/or fermentation condition (Gobert et al., 2017). Sequential nitrogen assimilation is likely the result of differential regulation of the permeases involved in the uptake of these molecules (Crépin et al., 2012). As a preferred nitrogen source, ammonium supports growth when other preferred sources, such as glutamate and glutamine, are exhausted (Ljungdahl and Daignan-Fornier, 2012).
Several studies have reported on the wide genetic diversity of S. cerevisiae strains from both natural (often found in association with plants, soils, insects, etc.) and human-associated biotypes (Steensels et al., 2014; Marsit and Dequin, 2015; Dujon and Louis, 2017; Peter et al., 2018). The selective pressure imposed by adapting to diverse habitats has created a large number of natural mutants that can be used in the study of biochemical and physiological processes (Landry et al., 2006; Greig and Leu, 2009; Hittinger et al., 2015). Furthermore, humans have manipulated yeast genetics to obtain strains with specific properties for bread baking and producing various fermented beverages, including the fermentation of grains and fruit juices (Mortimer, 2000). Since the S. cerevisiae genome has been sequenced, it is an ideal candidate for transcriptomic studies. However, as a wide array of genes impact sulfide formation and release, a fair amount of yeast strain variability exists, which makes it difficult to develop universal fermentation management strategies to reduce or eliminate H2S production in commercial operations.
In this study, we took advantage of yeast strains that produce opposing H2S levels. The objective of this study was to determine gene expression related to H2S production that occurs for two yeast strains (UCD522 and UCD932) under three YAN levels [Low (L = 86 mg L–1), Intermediate (I = 208 mg L–1), and High (H = 433 mg L–1)] after 24 and 72 h of cider fermentation. RNA-Seq was used to obtain sequence data representing the entire set of RNA molecules transcribed within each treatment. A second objective was to characterize gene expression differences between UCD522 and UCD932.
Materials and Methods
Microorganisms and Media
The yeast (S. cerevisiae) strains, UCD522 and UCD932, were obtained from the collection of the Department of Viticulture and Enology, University of California, Davis. UCD522 is a commercially available S. cerevisiae strain that is widely used in commercial wineries and cideries. UCD522 produces relatively high amounts of H2S during alcoholic fermentation (Spiropoulos et al., 2000). UCD932 is a vineyard isolate that produces no H2S due to a natural mutation in which threonine was substituted for lysine at position 662 in the MET10 gene. This allele behaves in a dominant manner over the other quantitative trait loci leading to reduced sulfide formation. The MET10 gene encodes a part of the enzyme responsible for the conversion of sulfite to sulfide. The mutation does not allow “leakage” of H2S produced in the sulfate reductase out of the cell (Linderholm et al., 2010). Prior to use, yeast cultures were stored in 50% (v/v) glycerol at −80°C. A yeast extract peptone dextrose starter culture consisting of 20 g glucose⋅L–1; 10 g yeast extract⋅L–1; 20 peptone g L–1 was incubated for 48 h at 28°C in an orbital shaker (200 rpm).
Apple Juice
Apple juice was produced from a mixture of culinary and European cider apples grown at the Cornell University Agricultural Experiment Station Research Orchards (Ithaca, NY, United States) in 2016. Whole apples were milled using a rotary grinder drum fitted with carbide teeth and pressed using a hydraulic rack and cloth pressing system (OESCO, Inc., Conway, MA, United States). The pre-fermentation juice chemistry was: YAN = 63.7 mg L–1, soluble solids concentration = 12.95 °Brix; titratable acidity = 3.45 g L–1; pH 4.15; and total polyphenols (as measured by the Folin-Ciocalteu Assay) = 1.1 g gallic acid equivalents⋅L–1. The same base apple juice was used for all fermentations. Juice was stored at −20°C prior to fermentation.
DAP Treatments, Cider Fermentation Conditions, and Hydrogen Sulfide Detection
DAP was added to the apple juice at 22.3, 144.3, and 369.3 mg⋅L–1 to create Low, Intermediate, and High treatments, respectively. All other fermentation conditions [e.g., temperature, physical agitation, and potassium metabisulfite (160 mg L–1) additions] were kept constant.
Two sets of fermentations were carried out in a temperature-controlled room set at 20°C using 250-ml flasks filled to 40% of their volume with juice. One set was used to monitor fermentation progression; the other was used to collect samples for RNA extraction. The starter yeast was then added to 100 ml of apple juice at a rate of 1 × 10⁷ cells⋅ml–1. Fermentations were conducted in triplicate for each yeast strain × DAP treatment.
Fermentation rate was measured by mass loss every 24 h. Fermentations were considered completed when there was less than 0.01 g day–1 mass loss. Residual sugars in fermented ciders were measured using a Megazyme (Bray, Ireland) Sucrose, D-Fructose, and D-Glucose kit in a 96-well microplate spectrophotometric method at λ 340 nm. Residual sugar concentrations were not different among the treatments.
During fermentation, H2S was quantified daily using lead acetate selective gas detector tubes (Komyo Kitagawa, Japan), as described elsewhere (Ugliano et al., 2011). The detector tubes were introduced into the flasks through stoppers. During fermentation, the CO2 produced by yeast metabolism forced H2S through the detector tube. Reaction of H2S with the chemicals contained in the tube resulted in the formation of a colored band. The length of the band is proportional to the amount of evolved H2S. Detector tubes were replaced when the band was near the end scale. Readings were taken every day through the course of fermentation to obtain a profile of H2S released during fermentation.
Total RNA Extraction
Samples for RNA sequencing and metabolomic analyses were taken 24 and 72 h after yeast inoculation. One fermentation sample per experimental unit was taken (2 time points × 3 DAP treatments × 3 replications = 18 total samples for each yeast strain). Aliquots of 4 × 10⁷ cells (4 ml) were taken at each time point before centrifugation at 1,000 × g for 5 min at 4°C. Total RNA was immediately extracted using the Hot-Phenol method (Sung et al., 2003) and contaminating genomic DNA was removed using the RNase-Free DNase I (Invitrogen), according to the manufacturer’s protocols. RNA purity and concentration were assessed using a NanoDrop 2000 Spectrophotometer (Thermo Fisher Scientific, Waltham, MA, United States) and Qubit® 2.0 spectrofluorometer (Life Technologies, Carlsbad, CA, United States), respectively. Extractions yielded more than 100 ng RNA μl–1 with absorption characteristics of 260/280 above 2.0 and 260/230 above 1.8. Samples were then stored at −80°C.
RNA-Seq Library Preparation
RNA-Seq libraries were constructed using the NEBNext Poly(A) mRNA Magnetic mRNA Isolation Module (NEB, Ipswich, MA, United States). For library preparation, non-ribosomal, polyA-containing mRNAs were enriched using polyT oligonucleotides. RT-PCR was used to establish accurate cycling for barcode incorporation and final library amplification, avoiding over- or under-cycling libraries, which could skew transcript counts during sequencing. Library fragment size was assessed by fragment analysis. A 2 nM equimolar pool was prepared for each lane of the Illumina HiSeq 2500.
RNA Sequencing Analysis
Raw RNA-Seq reads were processed using Trimmomatic to remove adaptor and low-quality sequences (Bolger et al., 2014). Reads shorter than 40 base pairs (bp) were discarded. RNA-Seq reads were then aligned to the ribosomal RNA database (Quast et al., 2012) using Bowtie (Langmead et al., 2009) and the mappable reads were discarded. The resulting high-quality cleaned reads were aligned to the S288C genome (Nijkamp et al., 2010) using HISAT (Kim et al., 2015), allowing up to three mismatches. Raw counts for each S288C gene were derived and normalized to reads per kilobase of exon model per million mapped reads (RPKM). The raw counts were also fed to the edgeR program to identify differentially expressed genes (DEGs). Raw P values were corrected for multiple testing errors using the false discovery rate (FDR) (Benjamini and Hochberg, 1995). DEGs were identified, with a fourfold change (log2 fold change >2) as the criteria for significant gene expression difference.
Gene Ontology and KEGG Enrichment Analysis of DEGs
Gene Ontology (GO) enrichment analysis of DEGs was implemented using the GOseq R package, which corrects for gene length bias. The GOseq method is based on Wallenius non-central hyper-geometric distribution compared with ordinary hyper-geometric distribution, which calculates the probability of GO term enriched by differential expression genes more accurately (Young et al., 2010). GO terms (including cellular components, molecular function, and biological processes) with corrected P values of <0.001 were considered significantly enriched by DEGs. KOBAS software was used to examine the statistical enrichment of DEGS in the Kyoto Encyclopedia of Genes and Genomes (KEGG1) pathways (Mao et al., 2005; Kanehisa et al., 2007). Specific gene functions and biological pathways were annotated according to Saccharomyces Genome Database (SGD2).
qPCR Verification for Transcriptomic Data
Total extracted RNA was transcribed to cDNA using the Applied BiosystemsTM High-Capacity cDNA Reverse Transcription Kit (Ambion Inc., Carlsbad, CA, United States) for reverse transcription. Real-time PCR was carried out with Bio-Rad iTaqTM Universal SYBR Green Supermix on a BIO-RAD IQ5 (Bio-Rad, Berkeley, CA, United States) and calculation of relative expression was carried out following the protocols outlined in Pfaffl (2004). Primer sets for the targeted genes are listed in Table 1. Gene expression was assessed relative to expression of actin (ACT1).
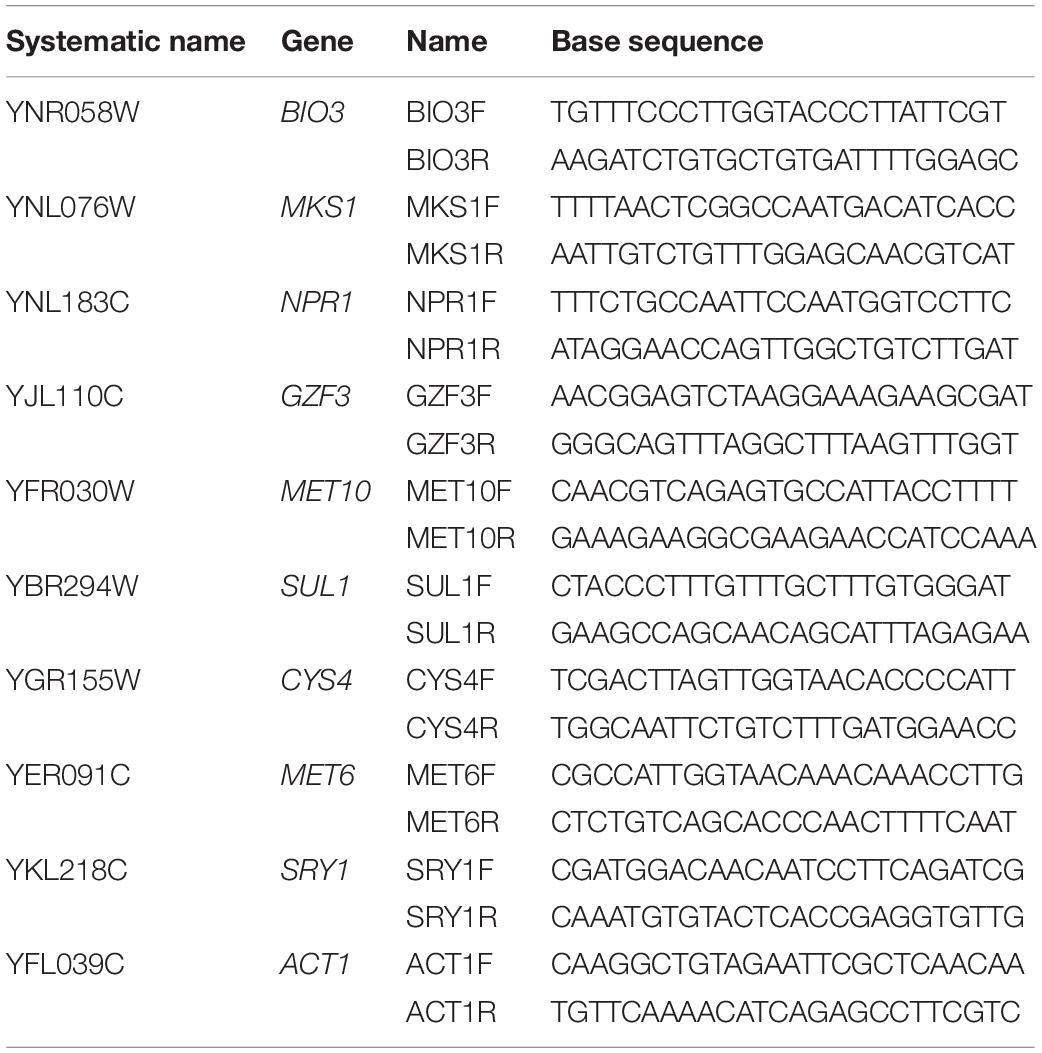
Table 1. Primers used to analyze two yeast strains (UCD932 and UCD522) under three diammonium phosphate (DAP) treatments [Low (22.3 mg L–1), Intermediate (144.3 mg L–1), and High (369.3 mg L–1)] in a cider fermentation.
Statistical Analysis
Fermentation and H2S data were tested for normalcy and then subjected to a one-way analysis of variance (ANOVA) followed by mean separation with Tukey’s Honestly Significant Difference using JMP 5.0.1 (SAS, Cary, NC, United States). Linear regressions between RNA-Seq and qPCR results were carried out using R studio 3.4.4 (R Studio, Boston, MA, United States).
Results
Fermentation Characteristics
All fermentations lasted for at least 102 h (Table 2 and Figure 1). The longest fermentation duration was observed in the Intermediate DAP treatment; 174 and 222 h for UCD932 and UCD522, respectively. The Intermediate treatment resulted in a longer fermentation duration than the Low or High DAP treatments. The fermentation rate of both the Intermediate and High treatments was faster than the Low treatment. Mass loss of the two strains under three treatments were similar (P value = 0.00513). However, the fermentation profiles of the two strains diverged substantially at the 72-h time point when UCD932 under the Intermediate DAP treatment exhibited a higher fermentation rate (1.85 g day–1) than UCD522 (0.36 g day–1). Overall, the correlation between DAP concentration and fermentation kinetics was poor.
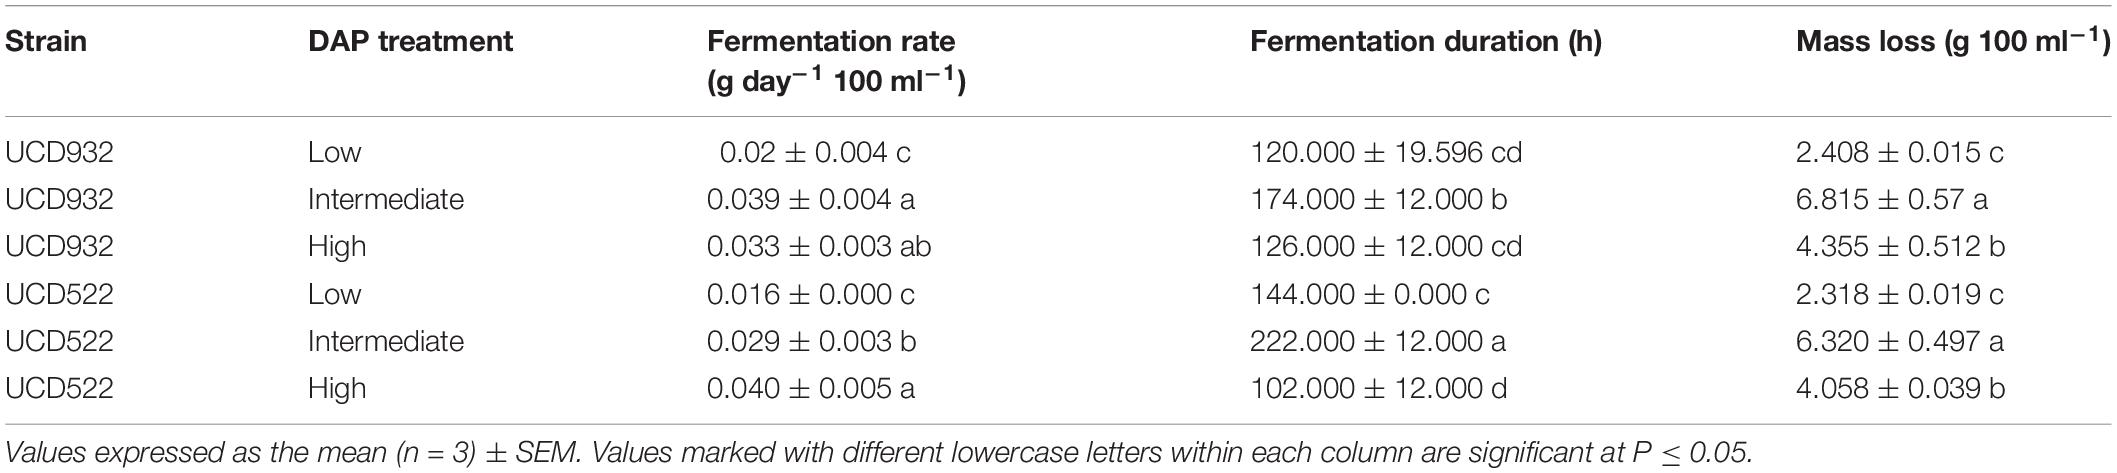
Table 2. Mean fermentation rate, fermentation duration, and mass loss production for two yeast strains (UCD932 and UCD522) under three diammonium phosphate (DAP) treatments [Low (22.3 mg L–1), Intermediate (144.3 mg L–1), and High (369.3 mg L–1)] in a cider fermentation.
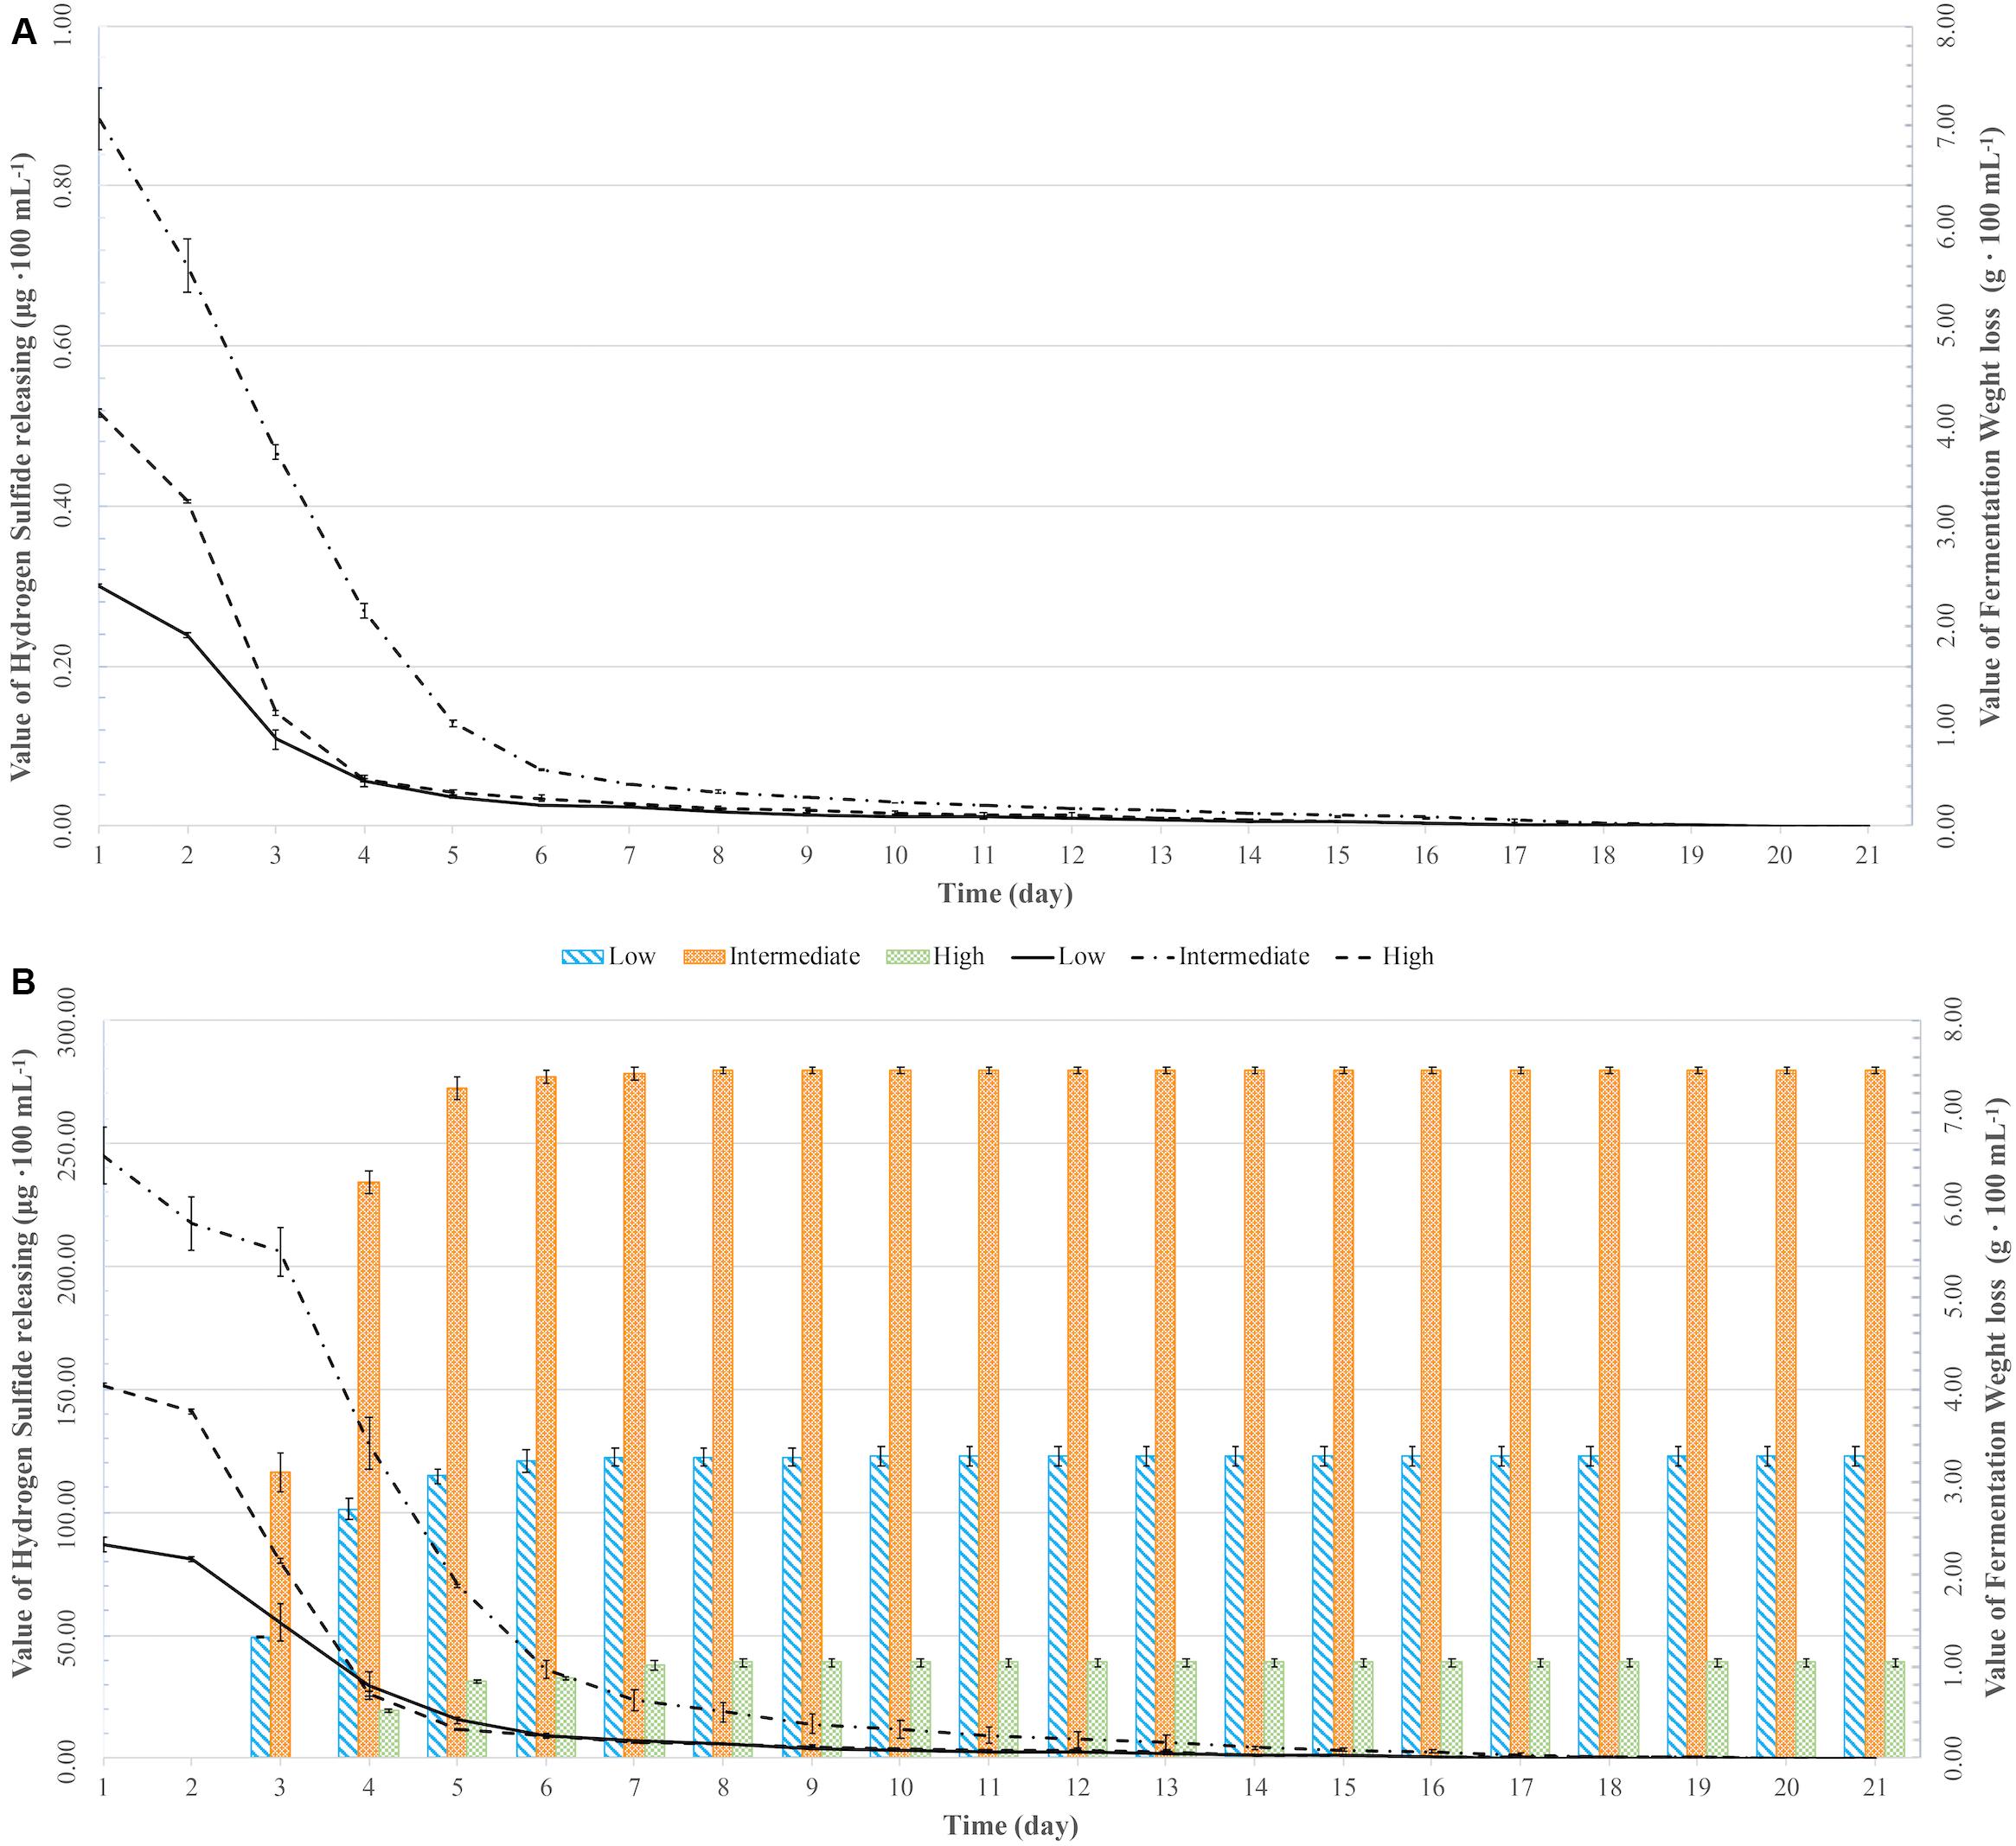
Figure 1. Weight loss over time (lines) and hydrogen sulfide (H2S) production (bars) for two yeast strains [UCD932 (A) and UCD522 (B)] under three diammonium phosphate (DAP) treatments [Low (22.3 mg L–1), Intermediate (144.3 mg L–1), and High (369.3 mg L–1)] in cider fermentations. Values reported as mean (n = 3) values ± SEM.
Hydrogen Sulfide Production
Hydrogen sulfide was not detected for the fermentations using the UCD932 yeast strain, regardless of DAP treatment concentration (Table 3 and Figure 1). For UCD522, the release of H2S started after 24 h for the High treatment and after 72 h for the Low and Intermediate treatments. Hydrogen sulfide production ceased after 192 h for all three UCD522 fermentations. Under the Low treatment, there was a positive correlation between the fermentation rate and the H2S production rate (P value ≤0.001; Pearson R2 = 0.95). In the UCD522 Intermediate DAP fermentation, H2S production was two and six times greater (288.250 μg 100 ml–1) than the Low (123.750 μg 100 ml–1) and High (44.125 μg 100 ml–1) treatments. Under the High DAP treatment, UCD522 produced the least amount of H2S throughout the fermentation.
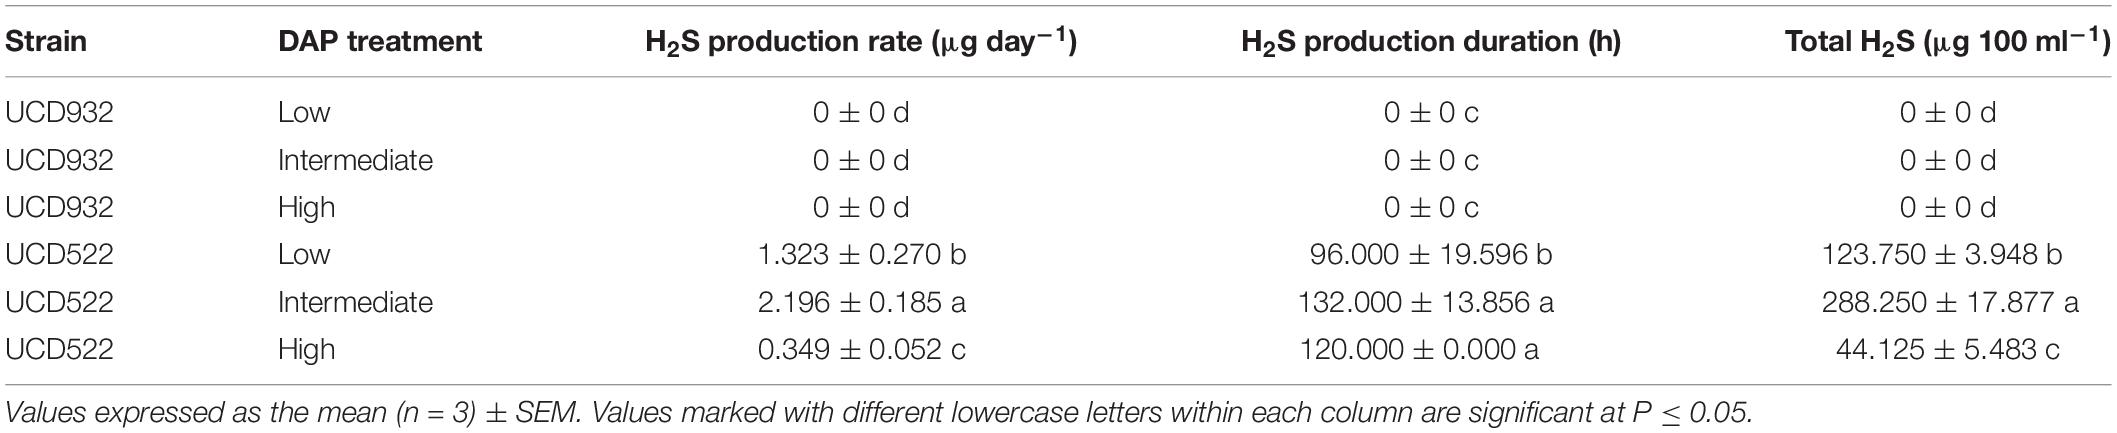
Table 3. Mean hydrogen sulfide (H2S) production rate, production duration, and total H2S production for two yeast strains (UCD932 and UCD522) under three diammonium phosphate (DAP) treatments [Low (22.3 mg L–1), Intermediate (144.3 mg L–1), and High (369.3 mg L–1)] in a cider fermentation.
Differential Gene Expression
Differential gene expression utilizing RNA-seq was used to quantify differences among the yeast strains (UCD932 = 932; UCD522 = 522), sample time points (24 = 24 h; 72 = 72 h), and DAP treatments (L = low; I = intermediate; H = high). The RNA-seq results were validated using qRT-PCR. Relative expression levels of selected genes between the methods were well correlated (r2 = 0.88; P ≤ 0.0001) (Supplementary Figure S1). Thousands of genes were differentially expressed between 24 and 72 h, under the three DAP treatments (Figure 2). For UCD522, there were 3,877 genes differentially expressed between L522-24 and L522-72 (1974 DEGs were up-regulated and 1,903 DEGs were down-regulated), 3554 genes differentially expressed between I522-24 and I522-72 (1796 DEGs were up-regulated and 1,758 DEGs were down-regulated), whereas 439 genes differentially expressed between H522-24 and H522-72 (239 DEGs were up-regulated and 200 DEGs were down-regulated) (Figure 3). Detailed DEGs for these three comparisons are provided in Supplementary Table S1.
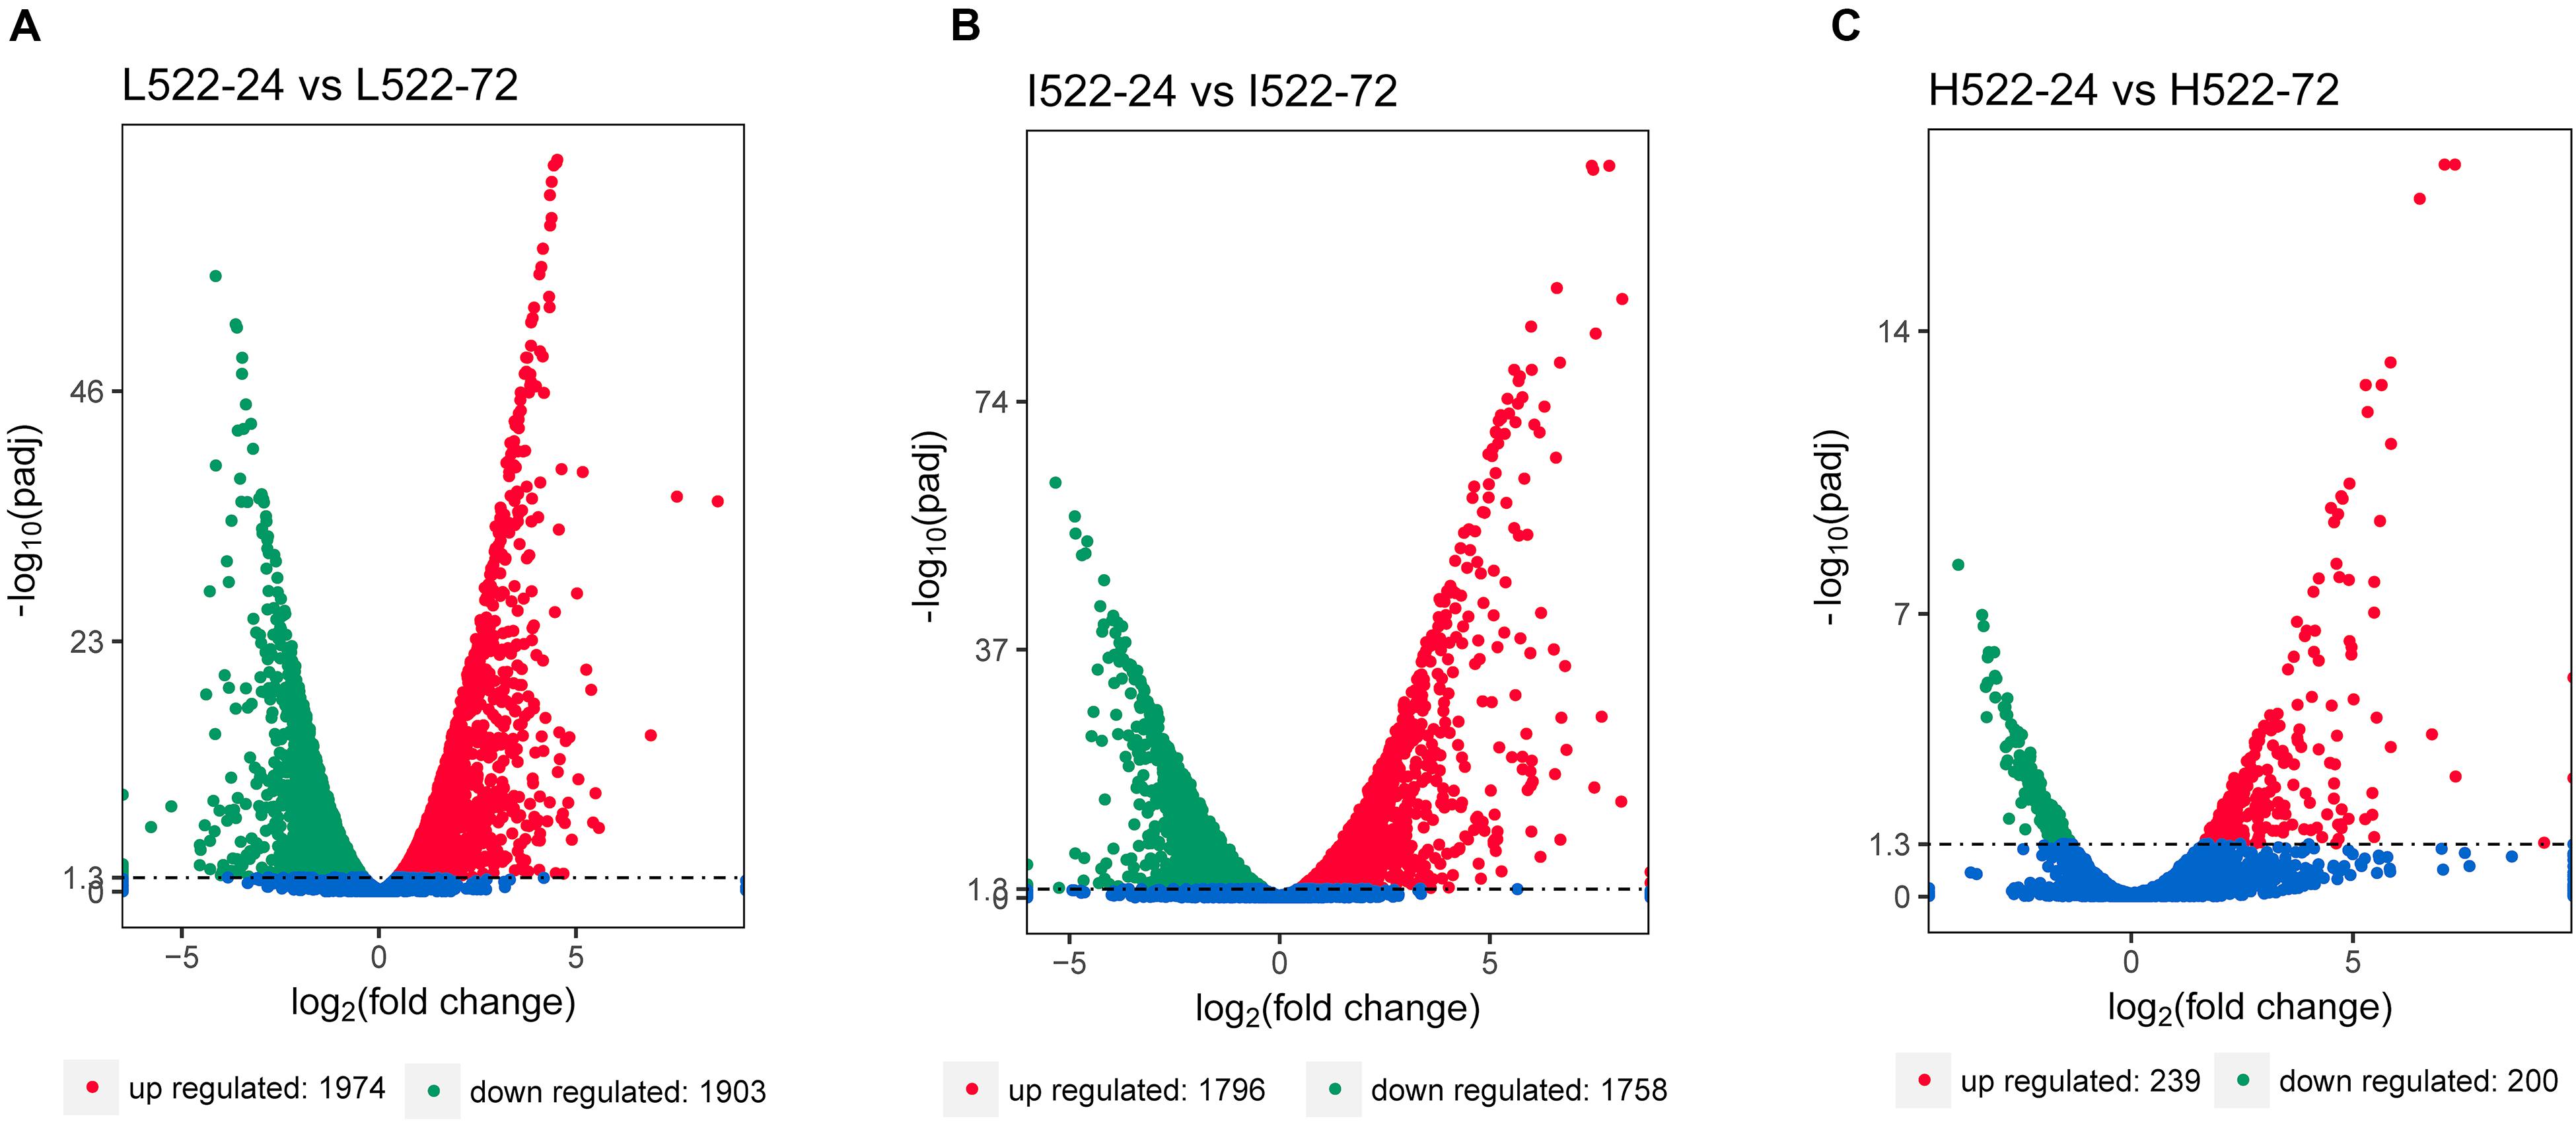
Figure 2. Volcano map of differentially expressed Saccharomyces cerevisiae (UCD522) genes under three diammonium phosphate (DAP) treatments [(A) Low (22.3 mg L−1), (B) Intermediate (144.3 mg L−1), and (C) High (369.3 mg L−1)] after 24 and 72 h in a cider fermentation. DEGs are shown as a red (up) or green (down) dot. Blue dots represent genes that were not different between the time points. Abscissa represents multiple genes expressed in different samples. Ordinate values on the axes represent the magnitude of gene expression change.
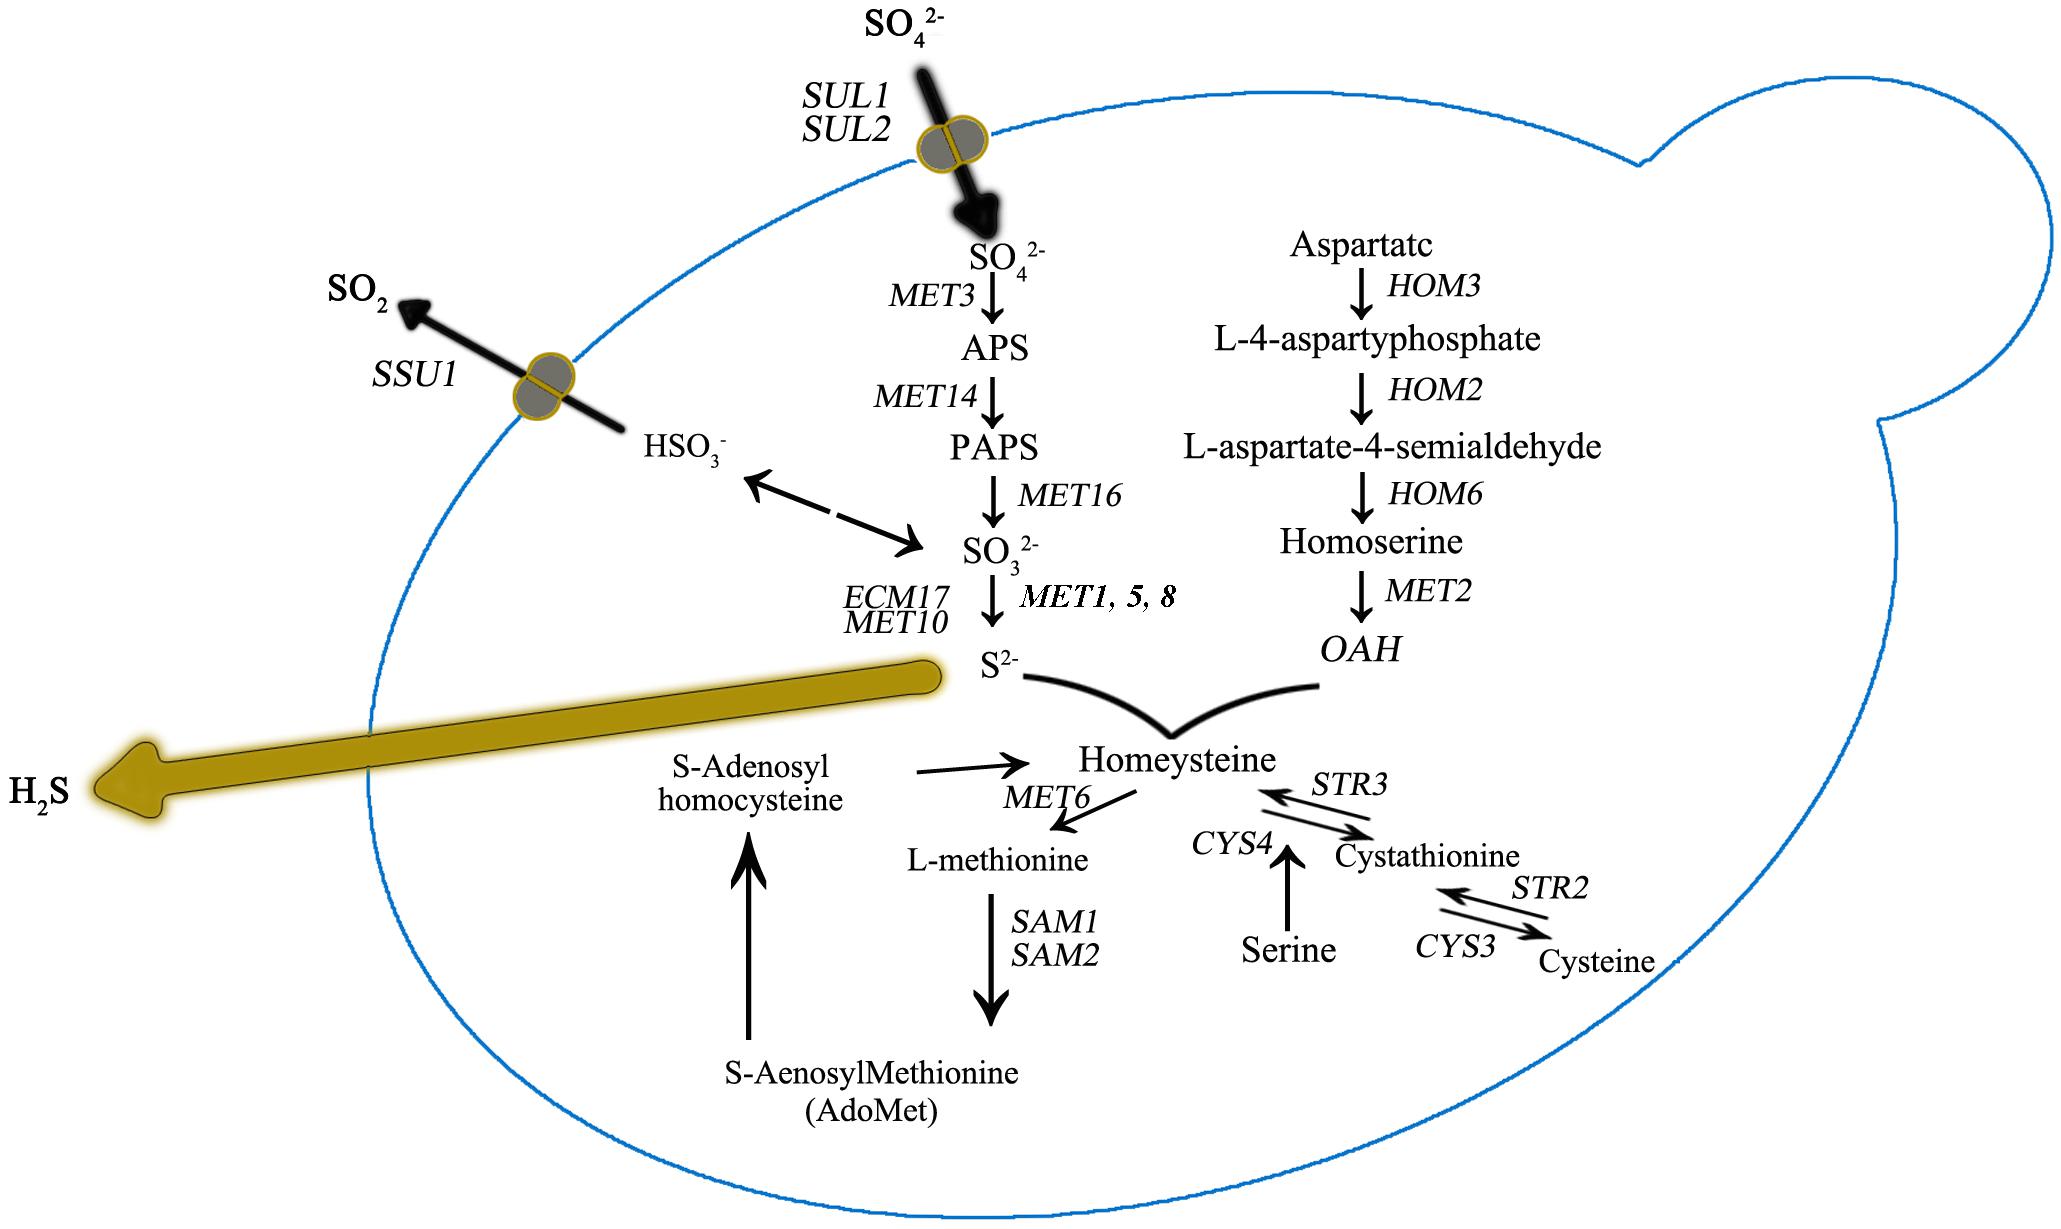
Figure 3. Sulfur amino acid biochemical pathways in Saccharomyces cerevisiae. Genes that encode for catalyzing enzymes are shown in italic.
For UCD932, between 24 and 72 h (L932-24 and L932-72) there were 826 DEGs (447 were up-regulated and 379 were down-regulated). Comparison of I932-24 and I932-72 was 4,615 DEGs (2332 DEGs were up-regulated and 2,293 were down-regulated). For H932-24 and H932-72, there were a total of 3,020 DEGs (1535 DEGs were up-regulated and 1,485 were down-regulated). Detailed DEGs for these three comparisons are provided in Supplementary Table S2.
It was also observed that the number of DEGs decreased as the DAP concentration increased (Figure 2). We further focused DEG statistical analyses on the SRS pathway for each comparison (Supplementary Table S1). We found that the expression level of MET10 and MET5 genes was impacted by the DAP treatments (Figure 3). Most of the genes of the SRS pathway were highly expressed at the 24-h time point when no H2S was detected and down-regulated in the later fermentation stages, which coincided with H2S production.
For both yeast strains, the Low and Intermediate DAP treatments had similar hierarchical clustering of the SRS gene expression, at 72 h (Figure 4). Under all treatments, CYS4, HOM2, HOM6, MET6, MET17, SAH1, SAM2, and SHM2 were consistently up-regulated, only CYS3 was up-regulated in UCD522, and only SAM1 was up-regulated in UCD932. Conversely, under all treatments, DUG2, DUG3, MET1, MET8, and STR3 were consistently down-regulated. Only SUL1 was down-regulated in UCD522, while GSH2, MET5, and STR2 were all down-regulated in UCD932. Under the treatments that produced more H2S (Low and Intermediate), UCD522 had a down-regulated MET10 gene expression. MET10 was up-regulated by UCD932, particularly at the 24-h time point, in all three DAP treatments. Several SRS genes showed reverse direction regulation between the two yeast strains under Low (24 h: MET14, SAM1, SUL1, and HOM3), Intermediate (24 h: MET16 and SUL1; 72 h: SUL1), and High (24 h: MET14, MET22, SUL1, and HOM3; 72 h: GSH2, MET1, SUL1, ECM38, and GSH1) treatments. For UCD522, the comparison of SRS gene expression between the Low and High conditions, ECM38, MET22, and MET10, had reverse direction regulation at the 24-h sampling point, while MET2 and OPT1 also had reverse direction regulation at 72 h (Table 4).
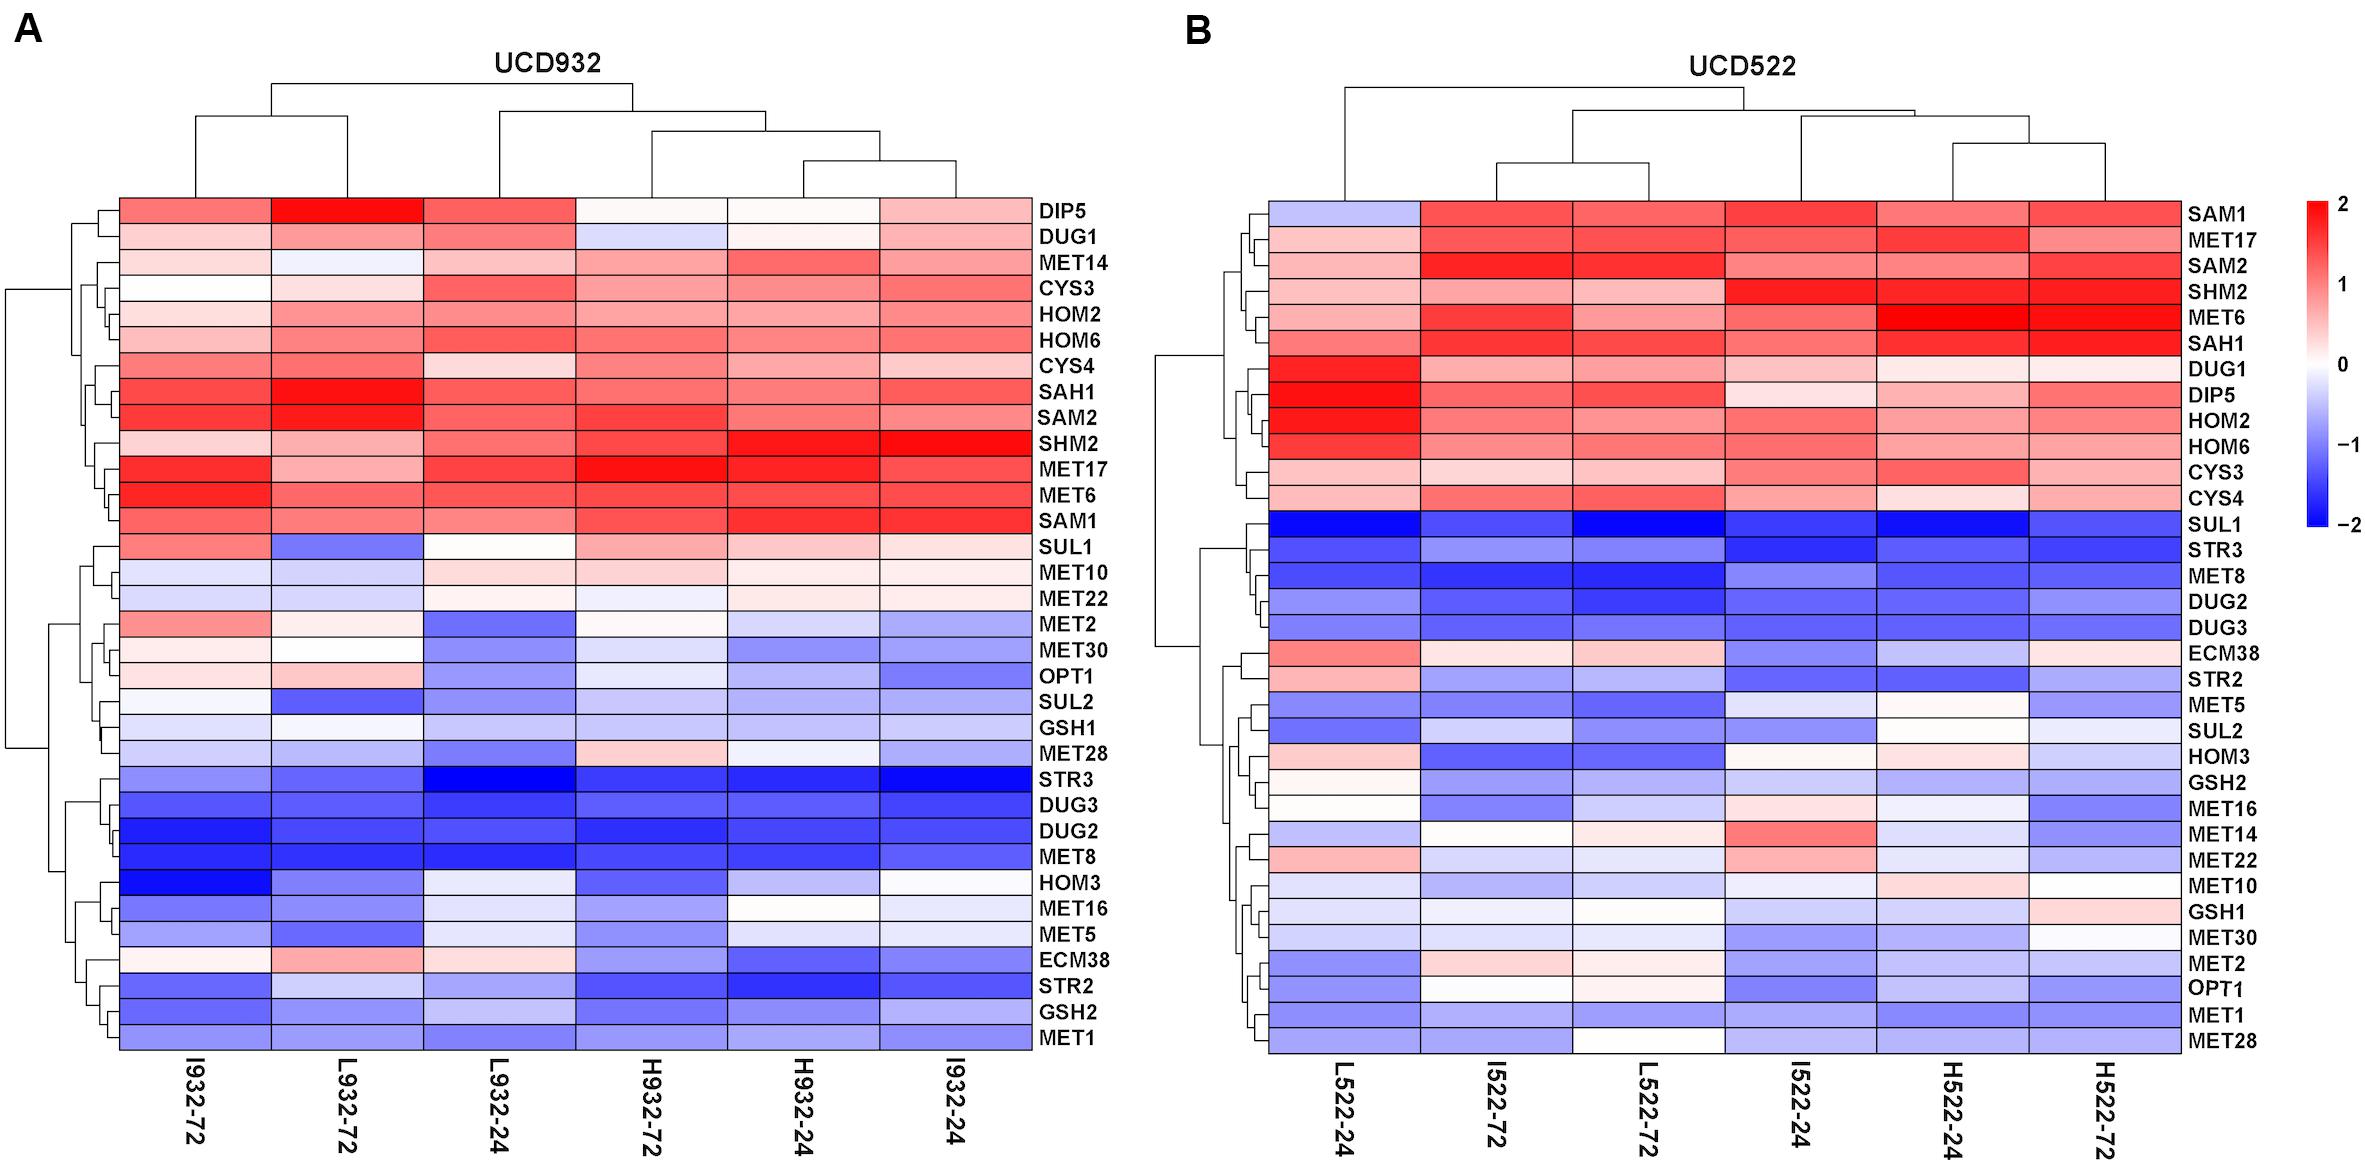
Figure 4. Heatmap of expression levels of sulfate reduction sequence core genes in two strains. Expression level (FPKM) for 33 genes encoding the core enzymes for sulfate reduction sequence for UCD932 (A) and UCD522 (B) under three diammonium phosphate (DAP) treatments [Low (22.3 mg L–1), Intermediate (144.3 mg L–1), and High (369.3 mg L–1)] after 24 and 72 h in a cider fermentation.
Table 4. Genes affecting hydrogen sulfide production in Saccharomyces.
For UCD522, after 24 h, the expression quantity of HOM3, MET10, MET2, and SAH1 genes had a positive correlation with the increasing DAP concentration, and HOM2 had a negative correlation. Furthermore, for the samples of UCD522 that were acquired during the liberation of H2S (at 72 h), there were negative correlations between the expression level of CYS3, GSH1, and MET10 and the H2S concentration. However, this metabolic pathway also requires the two regulatory subunits encoded by MET1 and MET8, and we did not find any correlation with the expression levels for those genes. Our data suggest that the genes that impact H2S production in a cider fermentation are under a tight regulatory control both during biosynthesis (MET5 and MET10) and sulfide incorporation (MET17 and MET2) (Table 4).
Gene Expression Levels and Sulfur Compound Production
Under the Low and High DAP treatments, the MET17 gene, which encodes the bifunctional O-acetylserine/O-acetylhomoserine sulfhydrylase (OAS/OAH SHLase), was both up- and down-regulated, but the production of H2S was only minimally affected. At the 24-h sampling point, under the Intermediate treatment, the expression of MET17 was nearly eightfold greater than the Low treatment, but at 72 h, there was more H2S production. At the same time point, expression of MET17 resulted in a 10-fold increase over the low one in OAS/OAH SHLase activity in UCD522, but had no impact on the level of H2S produced. Thus, transcriptome activity and H2S production were not well correlated in our study.
Most of the genes of the SRS pathway were highly expressed at the beginning of fermentation, when no H2S could be detected, and down-regulated in the later stages, which coincided with H2S production (Figure 4). The higher expression of SRS genes in the fermentation did not correlate with the lower levels of H2S production observed.
GO Enrichment of DEGs Between UCD522 and UCD932
To further understand the function of the DEGs underlying the effect of concentration of YAN on the two yeast strains, GO enrichment analysis was performed with the DEGs of six comparisons (L522-24 vs L522-72, I522-24 vs I522-72, H522-24 vs H522-72, L932-24 vs L932-72, I932-24 vs I932-72, and H932-24 vs H932-72). DEGs were assigned to one or more GO terms and categorized into 1,770 (L522-24 vs L522-72), 1800 (I522-24 vs I522-72), 834 (H522-24 vs H522-72), 1128 (L932-24 vs L932-72), 1923 (I932-24 vs I932-72), and 1,664 (H932-24 vs H932-72) GO terms in the three main categories (biological process, molecular function, and cellular component) (Supplementary Table S3).
For UCD522, under the High treatment, nine GO terms were enriched in the category of biological process, including “small molecule catabolic process,” “glucose catabolic process,” “hexose catabolic process,” “cellular carbohydrate catabolic process,” “alcohol catabolic process,” “monosaccharide catabolic process,” “carbohydrate catabolic process,” “glucose metabolic process,” and “hexose metabolic process” (Figure 5). In the category of molecular function, “oxidoreductase activity” was significantly enriched.
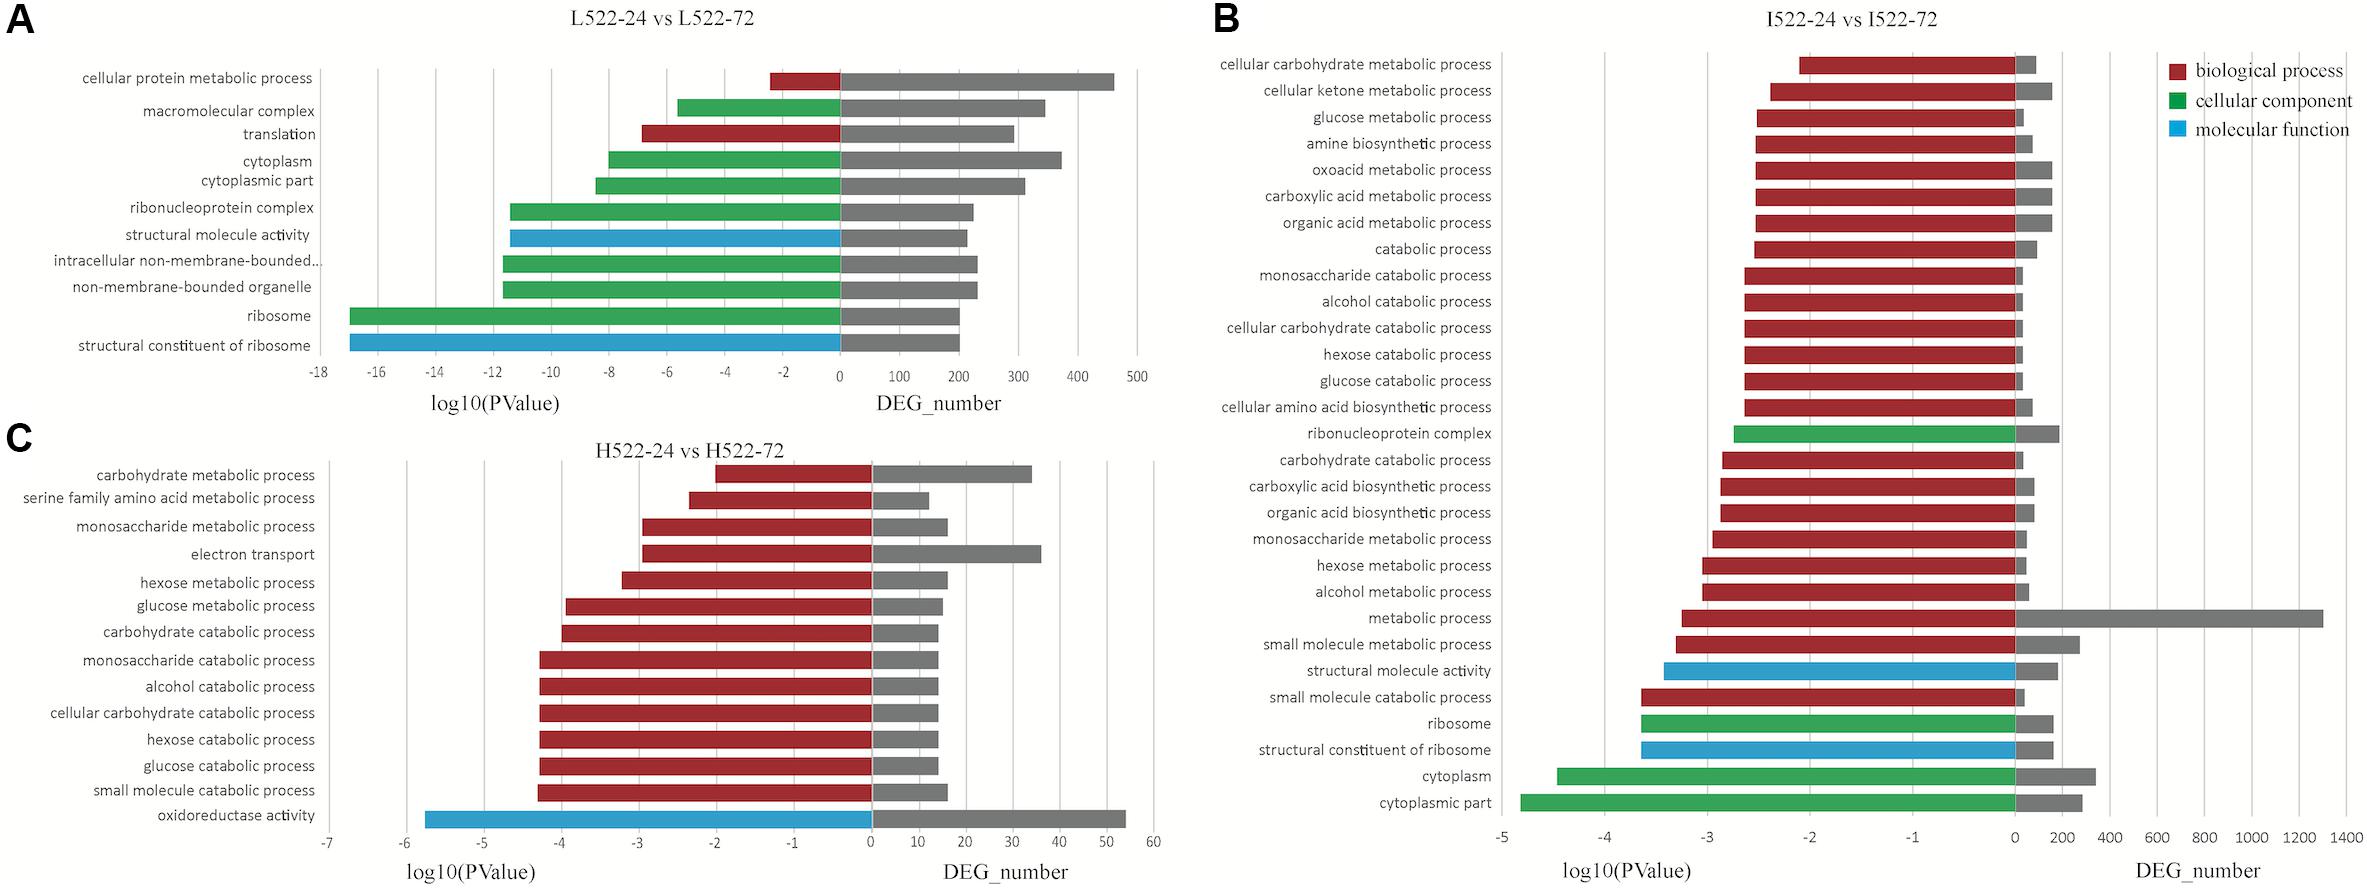
Figure 5. Enriched (P value < 0.001) Gene Ontology (GO) terms associated with Saccharomyces cerevisiae (UCD522) genes under three diammonium phosphate (DAP) treatments [(A) Low (22.3 mg L−1), (B) Intermediate (144.3 mg L−1), and (C) High (369.3 mg L−1)] after 24 and 72 h in a cider fermentation.
For the Intermediate treatment, in the category of biological process, “small molecule metabolic process,” “metabolic process,” “alcohol metabolic process,” “hexose metabolic process,” and “small molecule catabolic process” were significantly enriched (Figure 5). Three GO terms were enriched in the category of cellular component, “cytoplasmic part,” “cytoplasm,” and “ribosome.” Only two GO terms, “structural constituent of ribosome” and “structural molecule activity,” were enriched in the category of molecular function.
For the Low treatment, there was one and only GO term, “translation,” in the biological process category (Figure 5). In the cellular component category, “ribosome,” “non-membrane-bounded organelle,” “intracellular non-membrane-bounded organelle,” “ribonucleoprotein complex,” “cytoplasmic part,” “cytoplasm,” and “macromolecular complex” were enriched. “Structural constituent of ribosome” and “structural molecule activity” were enriched in the molecular function category.
KEGG Functional Annotation
Based on our gene expression data, metabolic pathways in the KEGG database were differentially regulated between UCD522 and UCD932 significantly under three DAP treatments (Figure 6). When including DEGs from both yeast strains with all different treatments in the analysis, pathways listed with black text were significantly enriched. Those shown in blue or red were significantly enriched when only genes with higher expression at 24 or 72 h, respectively, were included in the analysis. Numbers shown in the green circles match the same pathway shown in panel A, meaning these pathways were enriched in both analyses. Pathways shown in bold remained significant following FDR correction (Supplementary Table S4).
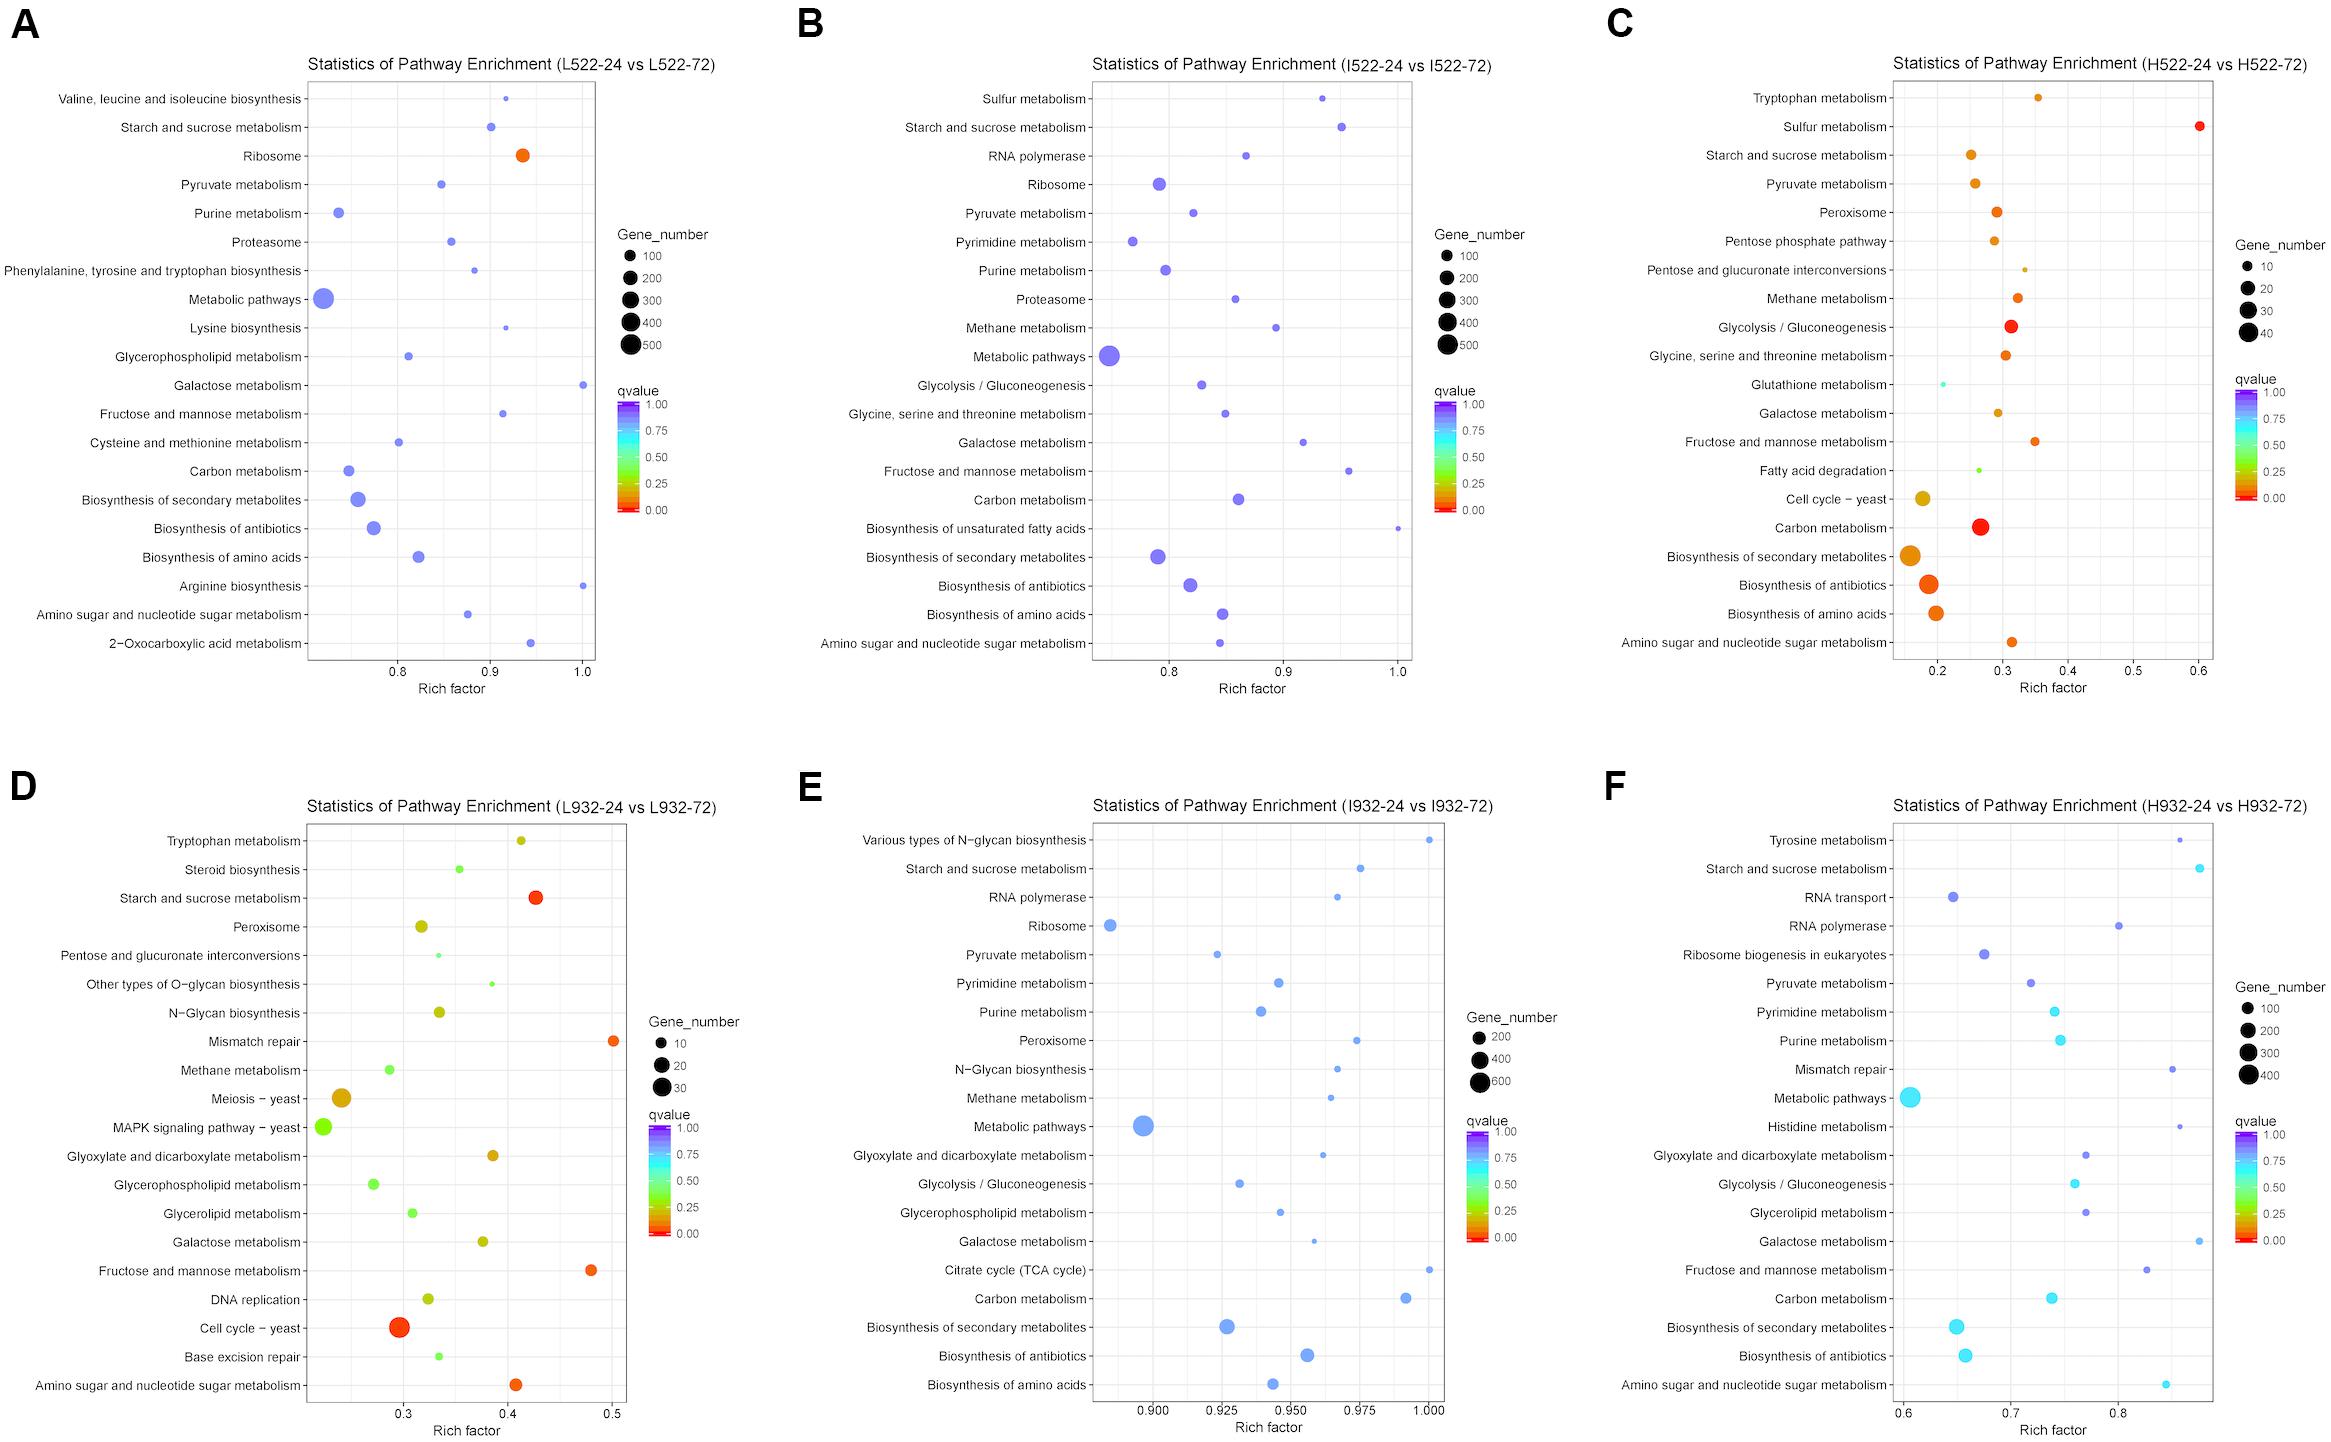
Figure 6. The 20 most enriched (P value < 0.05) Kyoto Encyclopedia of Genes and Genomes (KEGG) pathways associated with Saccharomyces cerevisiae [UCD522 (A–C) or UCD932 (D–F)] genes under three diammonium phosphate (DAP) treatments [Low (22.3 mg L−1) (A,D), Intermediate (144.3 mg L−1) (B,E), and High (369.3 mg L−1) (C,F)] after 24 and 72 h in a cider fermentation.
For UCD932 (P value <0.05), under High treatment “Carbon metabolism,” “Purine metabolism,” “Starch and sucrose metabolism,” “Biosynthesis of secondary metabolites,” and “Metabolic pathways” were the top four enriched pathways (Figure 6). Under Intermediate treatments, “Metabolic pathways” and “Biosynthesis of antibiotics” were the top two most enriched pathways. For the Low treatment, “Cell cycle-yeast,” “Starch and sucrose metabolism,” “Fructose and mannose metabolism,” “Mismatch repair,” “Amino sugar and nucleotide sugar metabolism,” “Meiosis-yeast,” “Glyoxylate and dicarboxylate metabolism,” “Galactose metabolism,” “Peroxisome,” “N-Glycan biosynthesis,” “Tryptophan metabolism,” “DNA replication,” and “MAPK signaling pathway-yeast” were the top 13 most enriched pathways (Figure 6 and Supplementary Table S4).
To better understand metabolic pathways unique to the H2S-producing UCD522 strain, we excluded all UCD932 differentially regulated KEGG pathways from further analysis. For the High treatment under the UCD522 fermentation, sulfur metabolism pathways were enriched (Figure 6 and Supplementary Table S4). Among which, “Sulfur metabolism,” “Glycolysis/Gluconeogenesis,” “Amino sugar and nucleotide sugar metabolism,” “Peroxisome,” “Glycine, serine and threonine metabolism,” “Methane metabolism,” “Fructose and mannose metabolism,” “Biosynthesis of amino acids,” “Pyruvate metabolism,” “Tryptophan metabolism,” “Pentose phosphate pathway,” “Galactose metabolism,” “Cell cycle-yeast,” and “Pentose and glucuronate interconversions” were the most enriched pathways. For the Intermediate treatment, “Biosynthesis of secondary metabolites,” “Carbon metabolism,” and “Biosynthesis of amino acids” were the top three enriched pathways. Under the Low treatment, “Ribosome” was the only pathway that was enriched.
Biosynthesis of amino acids was significantly down-regulated (Figure 6 and Supplementary Table S4). Under the UCD932 fermentation, the KEGG analysis showed that “sulfur metabolism” was not enriched regardless of the DAP treatment. Under the UCD522 fermentation, when we compared the 24- and 72-h time points, 9 and 14 out of the 15 genes involved in the sulfur metabolism pathways were down-regulated for the Intermediate and High treatments, respectively. Sulfite reductase (MET5 and MET10; EC 1.8.1.2), which catalyzes the direct six-electron reduction of sulfite into sulfide, was significantly up-regulated. Additionally, under both the Intermediate and High treatments, cysteine synthase (MET17; EC 2.5.1.47) was significantly up-regulated. Cystathionine gamma-synthase (STR2; EC 2.5.1.48), sulfate adenylyltransferase (MET3; EC 2.7.7.4), and ADP/ATP adenylyltransferase (APA1 and APA2; EC: 2.7.7.53) were down-regulated under the High treatment and up-regulated under the Intermediate treatment.
Discussion
In this study, a transcriptomics-based approach was used to examine how YAN concentration impacted H2S production and subsequently mRNA levels and gene expression for S. cerevisiae yeast strains during a cider fermentation. Specifically, by comparing a natural (UCD522) to a mutated (UCD932) yeast strain under increasing DAP concentrations, we characterized genes involved with H2S production within the sulfate reductase pathway. We found that the DAP treatments affected H2S production and fermentation kinetics. Further, the genome-wide analysis detected a large set of S. cerevisiae genes that were differentially expressed as a result of the DAP treatments.
Moderate DAP supplementation to 208 mg L–1 YAN resulted in a 2.3-fold increase in total H2S production, whereas higher supplementation to 433 mg L–1 decreased total H2S production to a level below the Low (86 mg L–1 YAN) DAP treatment. For UCD522, this curvilinear response is in contrast with the generally accepted paradigm that increasing YAN concentration reduces the H2S production during fermentation (Vos and Gray, 1979; Jiranek et al., 1995). In particular, the early results of Vos and Gray (1979) established the existence of a negative correlation between YAN and H2S production. However, in that study, the average YAN of the tested grape juice was 208 mg L–1, which suggests that their results were based on a YAN concentration much greater than the apple juice in our study.
We examined the gene expression profiles of the two yeast strains to understand their phenotypic diversity and gain insights into the molecular and physiological mechanisms associated with differences in their fermentation capacities. For UCD522 at the two sampling time points, we identified 3,877 (L522-24 vs L522-72), 3554 (I522-24 vs I522-72), and 439 (H522-24 vs H522-72) DEGs in the Low, Intermediate, and High DAP treatments, respectively.
After examining the DEGs using GO terms and KEGG pathways, we investigated which genes or pathways potentially contributed to the differing H2S production in our treatments. At 24 h, the Intermediate and High DAP treatments for UCD522 led to similar gene expression profiles that were both different from the Low DAP treatment expression. This is consistent with other studies (Jiranek et al., 1995; Spiropoulos and Bisson, 2000). However, at 72 h, the Low and Intermediate DAP treatments had similar gene expression. Additionally, the Low and Intermediate treatments released more H2S than the High treatment during the UCD522 fermentations.
As previously reported, H2S production during alcoholic fermentation largely results from enzymatic activity in the SRS pathway (Figure 2). Further, the expression of MET genes are reportedly tightly correlated with yeast growth (Patton, 2000). In our study, at 24 h for UCD522, we found that HOM2 was negatively correlated with the YAN concentration, and HOM3, MET10, MET2, and SAH1 were positively correlated with increasing YAN concentration.
HOM2 is required for O-acetyl-L-homoserine synthesis, and the inability to produce this compound would be expected to result in the production of sulfide similar to the loss of MET17 reported elsewhere. Our results are similar to those reported by Spiropoulos and Bisson (2000) in that MET17 expression levels were not correlated with H2S production. Higher H2S production did not lead to an up-regulation of genes involved in O-acetyl-L-homoserine production, such as MET2 or HOM3. Thus, H2S production is not solely due to the absence of O-acetyl-L-homoserine. Another explanation is that L-aspartyl-4-P is possibly an inducer of the sulfate reduction pathway or otherwise regulates sulfate reduction such that the loss of HOM3 results in a decrease in the pathway activity and compensates for the loss of reduced sulfide incorporation. It is important to note that mRNA levels do not necessarily correlate with protein levels or protein activity, which could also explain the observed discrepancies.
At 72 h, CYS3, GSH1, and MET10 had negative correlations with H2S production. This is possibly because MET5 or MET10 mutations block the conversion of sulfite to sulfide and therefore reduced H2S production (Sutherland-Stacey et al., 2008; Cordente et al., 2009). Overexpression of the cystathionine synthetase (CYS4) may also reduce H2S production by driving sulfide toward amino acid synthesis (Tezuka et al., 1992). MET14 has been shown to limit sulfur assimilation (Donalies and Stahl, 2002), which we also found in our work (Figure 4). Additionally, mutations in MET2 (produces O-acetyl-homoserine) or SKP2 (a potential regulator of sulfur assimilation genes) increases sulfite and H2S production (Hansen and Kielland-brandt, 1996).
Using a preferred nitrogen source, such as DAP, for fermentations, ECM38 expression is repressed through a mechanism involving the Gln-binding protein Ure2/GdhCR (Springael and Penninckx, 2003). Inadequate nitrogen concentration (i.e., less than 140 mg N/L) could induce ECM38 expression, meaning that the L932-24, L932-72, I932-24, L522-24, I522-72, and L522-72 treatments were nitrogen deficient in our study (Figure 4). It is possible that this resulted in the higher expression of MET10, HOM3, HOM2, and MET2 genes, since their activity was correlated with reduced H2S production (Patton, 2000; Spiropoulos et al., 2000; Linderholm et al., 2010; Huang et al., 2013).
We did not find any GO terms enriched in thiamine biosynthesis (Figure 5). Our results were not in agreement with the previous suggestion that greater H2S production is correlated with thiamine biosynthesis gene expression (Bartra et al., 2010). However, for UCD522 sampled at 24 h, there was a positive correlation between the DAP treatments and expression quantity of HOM3, MET10, MET2, and SAH1 genes.
Mendes-Ferreira et al. (2008) reported that, in a model grape juice, MET genes involved in the formation of H2S were specifically down-regulated under nitrogen deficiency (YAN = 66 mg L–1), while supplementation of nitrogen to an initial YAN of 267 mg L–1 resulted in up-regulation of these genes and maximum H2S formation. For UCD522, 83.3% of MET genes involved in the formation of H2S were down-regulated under YAN 86 mg L–1. Unlike previous reports, only three genes (MET1, MET8, and MET28) were up-regulated under the Intermediate DAP treatment in our study, while the High treatment resulted in the up-regulation of half of these genes. Moreover, the Intermediate treatments entered the stationary fermentation phase between day 6 and 7, while H2S was released between day 3 and 4. Therefore, sulfite reductase activity was likely up-regulated during the growth phase when nitrogen was limited. The observation that low YAN juice determines a non-linear dose response for H2S production is particularly relevant in light of generally low nitrogen content for apples (Ma et al., 2018).
Although DAP supplementation is often used by commercial cider producers to reduce H2S production during fermentation, this common practice does not appear to consistently produce this result. In fact, in our study, moderate nitrogen supplementation to a low nitrogen juice was generally associated with increased H2S production. Given the importance of H2S management for the modern cider industry, our results suggest that further research should target additional mechanisms involved with H2S production.
Previous studies report that H2S formed late in fermentation could be responsible for increased residual H2S that affects the sensory quality of fermented beverages (Karagiannis and Lanaridis, 1999). In the UCD522 fermentation, the Low and Intermediate DAP treatments resulted in significantly greater H2S production compared to the High treatment. Furthermore, according to our RNA-Seq data, the expression level of three genes (MET10, HOM3, and HOM2) was correlated with YAN concentration, and two genes (MET10 and CYS3) were correlated with greater H2S production. It is possible that this is the result of the up-regulated expression of MET10, since its activity was correlated with reduced H2S production (Cordente et al., 2009). Overall, it appears that H2S biosynthesis during cider fermentation is under a tight regulatory control by MET10.
The similarity in sulfur metabolism between 24 and 72 h under the Low DAP treatment using the KEGG and GO analyses was possibly due to the very low starting YAN concentration in the apple juice. By comparison, the Intermediate and High treatments started with a concentration above 140 mg YAN⋅L–1 and decreased to below the deficiency level before 72 h. Different nitrogen concentrations at the two time points may have led to the observed H2S production and metabolism findings.
In summary, we confirm a non-linear relationship between YAN and H2S production during cider fermentation, with the low and intermediate YAN levels having greater H2S production than the high YAN level. The RNA-Seq analysis allowed us to uncover a complex coordination between the genes involved with a stress response and H2S production. Our study demonstrates the importance of gene expression analysis in understanding yeast response to YAN concentrations and sheds light on the molecular basis of yeast physiology and H2S production during cider fermentation. Further investigations should be aimed at exploring the management of the nitrogen anabolic requirements in cider fermentation, as well as the effect of organic nitrogen sources, such as amino acids.
Data Availability Statement
The datasets generated for this study can be found in NCBI SRA, accession PRJNA592382, https://www.ncbi.nlm.nih.gov/bioproject/PRJNA592382.
Author Contributions
YS conducted the experiment, performed the RNAseq, analyzed the data, and prepared the manuscript. PG, LC, and SL assisted with data analyses and manuscript preparation. GP developed the experimental design, assisted with data analyses and interpretation, edited the manuscript for submission, and supervised YS. All authors contributed to the article and approved the submitted version.
Funding
This work was financially supported by the Cornell University School of Integrated Plant Science-Horticulture Section, the Major Science and Technology Program of Ningxia Hui Autonomous Region (2016BZ0603), the National Key R&D Program of China (2016YFD0400504), and the China Technology Agriculture Research System (CARS-30-jp-3). YS was supported by the China Scholarship Council as a visiting scholar while conducting this experiment at Cornell.
Conflict of Interest
The authors declare that the research was conducted in the absence of any commercial or financial relationships that could be construed as a potential conflict of interest.
Acknowledgments
We thank Mike Brown for technical assistance.
Supplementary Material
The Supplementary Material for this article can be found online at: https://www.frontiersin.org/articles/10.3389/fmicb.2020.01264/full#supplementary-material
FIGURE S1 | The relative expression levels of selected genes compared between (A) quantitative reverse transcription polymerase chain reaction qRT-PCR and (B) RNA-Seq analysis. Relative expression levels of selected genes in the strains at first place of comparison were set to 1. Regression analysis (C) of the relative expression level of selected genes in UCD932 and UCD522. Each dot represents a single gene.
Footnotes
References
Bartra, E., Casado, M., Carro, D., Campama, C., and Pina, B. (2010). Differential expression of thiamine biosynthetic genes in yeast strains with high and low production of hydrogen sulfide during wine fermentation. J. Appl. Microbiol. 109, 272–281. doi: 10.1111/j.1365-2672.2009.04652.x
Benjamini, Y., and Hochberg, Y. (1995). Controlling the false discovery rate: a practical and powerful approach to multiple testing. J. R. Statist. Soc. Ser. B Methodol. 57, 289–300. doi: 10.1111/j.2517-6161.1995.tb02031.x
Blateyron, L., and Sablayrolles, J. M. (2001). Stuck and slow fermentations in enology: statistical study of causes and effectiveness of combined additions of oxygen and diammonium phosphate. J. Biosci. Bioeng. 91, 184–189. doi: 10.1263/jbb.91.184
Bolger, A. M., Lohse, M., and Usadel, B. (2014). Trimmomatic: a flexible trimmer for Illumina sequence data. Bioinformatics 30, 2114–2120. doi: 10.1093/bioinformatics/btu170
Boudreau, T. F., Peck, G. M., Ma, S., Patrick, N., Duncan, S., O’Keefe, S. F., et al. (2017a). Hydrogen sulphide production during cider fermentation is moderated by pre-fermentation methionine addition: hydrogen sulphide production. J. Instit. Brew. 123, 553–561. doi: 10.1002/jib.449
Boudreau, T. F., Peck, G. M., O’Keefe, S. F., and Stewart, A. C. (2017b). Free amino nitrogen concentration correlates to total yeast assimilable nitrogen concentration in apple juice. Food Sci. Nutr. 6, 119–123. doi: 10.1002/fsn3.536
Brice, C., Sanchez, I., Tesnière, C., and Blondin, B. (2014). Assessing the mechanisms responsible for differences between nitrogen requirements of Saccharomyces cerevisiae wine yeasts in alcoholic fermentation. Appl. Environ. Microbiol. 80, 1330–1339. doi: 10.1128/AEM.03856-3813
Cordente, A. G., Heinrich, A., Pretorius, I. S., and Swiegers, J. H. (2009). Isolation of sulfite reductase variants of a commercial wine yeast with significantly reduced hydrogen sulfide production. FEMS Yeast Res. 9, 446–459. doi: 10.1111/j.1567-1364.2009.00489.x
Crépin, L., Nidelet, T., Sanchez, I., Dequin, S., and Camarasa, C. (2012). Sequential use of nitrogen compounds by saccharomyces cerevisiae during wine fermentation: a model based on kinetic and regulation characteristics of nitrogen permeases. Appl. Environ. Microbiol. 78, 8102–8111. doi: 10.1128/AEM.02294-12
Crépin, L., Sanchez, I., Nidelet, T., Dequin, S., and Camarasa, C. (2014). Efficient ammonium uptake and mobilization of vacuolar arginine by Saccharomyces cerevisiae wine strains during wine fermentation. Microb. Cell Factor. 13:109. doi: 10.1186/s12934-014-0109-100
Donalies, U. E. B., and Stahl, U. (2002). Increasing sulphite formation in Saccharomyces cerevisiae by overexpression ofMET14 andSSU1. Yeast 19, 475–484. doi: 10.1002/yea.849
Dujon, B. A., and Louis, E. J. (2017). Genome Diversity and Evolution in the Budding Yeasts (Saccharomycotina). Genetics 206, 717–750. doi: 10.1534/genetics.116.199216
Freese, S., Vogts, T., Speer, F., Schäfer, B., Passoth, V., and Klinner, U. (2011). C- and N-catabolic utilization of tricarboxylic acid cycle-related amino acids by Scheffersomyces stipitis and other yeasts. Yeast 28, 375–390. doi: 10.1002/yea.1845
Giudici, P. (1994). The effect of nitrogen deficiency and sulfur-containing amino acids on the reduction of sulfate to hydrogen sulfide by wine yeasts. Science 45:6.
Gobert, A., Tourdot-Maréchal, R., Morge, C., Sparrow, C., Liu, Y., Quintanilla-Casas, B., et al. (2017). Non-saccharomyces yeasts nitrogen source preferences: Impact on sequential fermentation and wine volatile compounds profile. Front. Microbiol. 8:2175. doi: 10.3389/fmicb.2017.02175
Godard, P., Urrestarazu, A., Vissers, S., Kontos, K., Bontempi, G., van Helden, J., et al. (2007). Effect of 21 different nitrogen sources on global gene expression in the yeast Saccharomyces cerevisiae. Mol. Cell. Biol. 27, 3065–3086. doi: 10.1128/MCB.01084-1086
Greig, D., and Leu, J.-Y. (2009). Natural history of budding yeast. Curr. Biol. 19, R886–R890. doi: 10.1016/j.cub.2009.07.037
Hansen, J., and Johannesen, P. F. (2000). Cysteine is essential for transcriptional regulation of the sulfur assimilation genes in Saccharomyces cerevisiae. Mol. Gen. Genet. MGG 263, 535–542. doi: 10.1007/s004380051199
Hansen, J., and Kielland-brandt, M. C. (1996). Inactivation of MET2 in brewer’s yeast increases the level of sulfite in beer. J. Biotechnol. 50, 75–87. doi: 10.1016/0168-1656(96)01551-1559
Hansen, R., Cherest, H., and Kielland-Brandt, M. C. (1994). Two divergent MET10 genes, one from Saccharomyces cerevisiae and one from Saccharomyces carlsbergensis, Encode the co Subunit of sulfite reductase and specify potential binding sites for FAD and NADPH. Cell 176:9.
Hittinger, C. T., Rokas, A., Bai, F.-Y., Boekhout, T., Gonçalves, P., Jeffries, T. W., et al. (2015). Genomics and the making of yeast biodiversity. Curr. Opin. Genet. Dev. 35, 100–109. doi: 10.1016/j.gde.2015.10.008
Huang, H., Ceccarelli, D. F., Orlicky, S., St-Cyr, D. J., Ziemba, A., Garg, P., et al. (2013). E2 enzyme inhibition by stabilization of a low-affinity interface with ubiquitin. Nat. Chem. Biol. 10:156. doi: 10.1038/nchembio.1412
Jiranek, V., Langridge, P., and Henschke, P. A. (1995). Regulation of hydrogen sulfide liberation in wine-producing Saccharomyces cerevisiae strains by assimilable nitrogen. Appl. Environ. Microbiol. 61:7.
Kanehisa, M., Araki, M., Goto, S., Hattori, M., Hirakawa, M., Itoh, M., et al. (2007). KEGG for linking genomes to life and the environment. Nucleic Acids Res. 36, D480–D484. doi: 10.1093/nar/gkm882
Karagiannis, S., and Lanaridis, P. (1999). The effect of various vinification parameters on the development of several volatile sulfur compounds in Greek white wines of the cultivars Batiki and Muscat of Hamburg. Am. J. Enol. Vitic. 50, 334–342.
Kim, D., Langmead, B., and Salzberg, S. L. (2015). HISAT: a fast spliced aligner with low memory requirements. Nat. Methods 12, 357–360. doi: 10.1038/nmeth.3317
Landry, C. R., Oh, J., Hartl, D. L., and Cavalieri, D. (2006). Genome-wide scan reveals that genetic variation for transcriptional plasticity in yeast is biased towards multi-copy and dispensable genes. Gene 366, 343–351. doi: 10.1016/j.gene.2005.10.042
Langmead, B., Schatz, M. C., Lin, J., Pop, M., and Salzberg, S. L. (2009). Searching for SNPs with cloud computing. Genome Biol. 10:R134. doi: 10.1186/gb-2009-10-11-r134
Linderholm, A., Dietzel, K., Hirst, M., and Bisson, L. F. (2010). Identification of MET10-932 and characterization as an allele reducing hydrogen sulfide formation in wine strains of Saccharomyces cerevisiae. Appl. Environ. Microbiol. 76, 7699–7707. doi: 10.1128/AEM.01666-1610
Linderholm, A. L., Findleton, C. L., Gagandeep, K., Yeun, H., and Bisson, L. F. (2008). Identification of genes affecting hydrogen sulfide formation in Saccharomyces cerevisiae. Appl. Environ. Microbiol. 74:1418. doi: 10.1128/aem.01758-07
Ljungdahl, P. O., and Daignan-Fornier, B. (2012). Regulation of amino acid, nucleotide, and phosphate metabolism in Saccharomyces cerevisiae. Genetics 190, 885–929. doi: 10.1534/genetics.111.133306
Ma, S., Neilson, A., Lahne, J., Peck, G., O’Keefe, S., Hurley, E. K., et al. (2018). Juice clarification with pectinase reduces yeast assimilable nitrogen in apple juice without affecting the polyphenol composition in cider. J. Food Sci. 83, 2772–2781. doi: 10.1111/1750-3841.14367
Mao, X., Cai, T., Olyarchuk, J. G., and Wei, L. (2005). Automated genome annotation and pathway identification using the KEGG Orthology (KO) as a controlled vocabulary. Bioinformatics 21, 3787–3793. doi: 10.1093/bioinformatics/bti430
Marsit, S., and Dequin, S. (2015). Diversity and adaptive evolution of Saccharomyces wine yeast: a review. FEMS Yeast Res. 15:fov067. doi: 10.1093/femsyr/fov067
Mendes-Ferreira, A., Barbosa, C., Mendes-Faia, A., and Leão, C. (2008). Relationship between H2S production and MET genes expression levels in S. cerevisiae under different assimilable nitrogen status. Am. J. Enolo. Viticu. 59, 335A–335A.
Mortimer, R. K. (2000). Evolution and variation of the yeast (Saccharomyces) genome. Genome Res. 10, 403–409. doi: 10.1101/gr.10.4.403
Mountain, H. A., Byström, A. S., Larsen, J. T., and Korch, C. (1991). Four major transcriptional responses in the methionine/threonine biosynthetic pathway of Saccharomyces cerevisiae. Yeast 7, 781–803. doi: 10.1002/yea.320070804
Nijkamp, J., Winterbach, W., van den Broek, M., Daran, J.-M., Reinders, M., and de Ridder, D. (2010). Integrating genome assemblies with MAIA. Bioinformatics 26, i433–i439. doi: 10.1093/bioinformatics/btq366
Noble, J., Sanchez, I., and Blondin, B. (2015). Identification of new Saccharomyces cerevisiae variants of the MET2 and SKP2 genes controlling the sulfur assimilation pathway and the production of undesirable sulfur compounds during alcoholic fermentation. Microb. Cell Fact. 14:68. doi: 10.1186/s12934-015-0245-241
Patton, E. E. (2000). SCFMet30-mediated control of the transcriptional activator Met4 is required for the G1-S transition. EMBO J. 19, 1613–1624. doi: 10.1093/emboj/19.7.1613
Peck, G. M., Mcguire, M., Thomas Bourreau, I. V., and Stewart, A. (2016). Crop load density affects “York” apple juice and hard cider quality. Hortsci. Public. Am. Soc. Hortic. Sci. 51, 1098–1102. doi: 10.21273/hortsci10962-16
Peter, J., De Chiara, M., Friedrich, A., Yue, J.-X., Pflieger, D., Bergström, A., et al. (2018). Genome evolution across 1,011 Saccharomyces cerevisiae isolates. Nature 556, 339–344. doi: 10.1038/s41586-018-0030-35
Pfaffl, M. W. (2004). Quantification Strategies In Real-Time PCR. La Jolla, CA: International University.
Quast, C., Pruesse, E., Yilmaz, P., Gerken, J., Schweer, T., Yarza, P., et al. (2012). The SILVA ribosomal RNA gene database project: improved data processing and web-based tools. Nucleic Acids Res. 41, D590–D596. doi: 10.1093/nar/gks1219
Rollero, S., Bloem, A., Camarasa, C., Sanchez, I., Ortiz-Julien, A., Sablayrolles, J.-M., et al. (2015). Combined effects of nutrients and temperature on the production of fermentative aromas by Saccharomyces cerevisiae during wine fermentation. Appl. Microbiol. Biotechnol. 99, 2291–2304. doi: 10.1007/s00253-014-6210-6219
Sadhu, M. J., Moresco, J. J., Zimmer, A. D., Yates, J. R., and Rine, J. (2014). Multiple inputs control sulfur-containing amino acid synthesis in Saccharomyces cerevisiae. Mol. Biol. Cell 25, 1653–1665. doi: 10.1091/mbc.e13-12-0755
Spiropoulos, A., and Bisson, L. F. (2000). MET17 and hydrogen sulfide formation in Saccharomyces cerevisiae. Appl. Environ. Microbiol. 66, 4421–4426. doi: 10.1128/AEM.66.10.4421-4426.2000
Spiropoulos, A., Tanaka, J., Flerianos, I., and Bisson, L. F. (2000). Characterization of hydrogen sulfide formation in commercial and natural wine isolates of Saccharomyces. Am. J. Enol. Vitic. 51, 233–248.
Springael, J.-Y., and Penninckx, M. J. (2003). Nitrogen-source regulation of yeast γ-glutamyl transpeptidase synthesis involves the regulatory network including the GATA zinc-finger factors Gln3, Nil1/Gat1 and Gzf3. Biochem. J. 371, 589–595. doi: 10.1042/bj20021893
Steensels, J., Snoek, T., Meersman, E., Nicolino, M. P., Voordeckers, K., and Verstrepen, K. J. (2014). Improving industrial yeast strains: exploiting natural and artificial diversity. FEMS Microbiol. Rev. 38, 947–995. doi: 10.1111/1574-6976.12073
Sung, K., Khan, S. A., Nawaz, M. S., and Khan, A. A. (2003). A simple and efficient Triton X-100 boiling and chloroform extraction method of RNA isolation from Gram-positive and Gram-negative bacteria. FEMS Microbiol. Lett. 229, 97–101. doi: 10.1016/S0378-1097(03)00791-792
Sutherland-Stacey, L., Corrie, S., Neethling, A., Johnson, I., Gutierrez, O., Dexter, R., et al. (2008). Continuous measurement of dissolved sulfide in sewer systems. Water Sci. Technol. 57, 375–381. doi: 10.2166/wst.2008.132
Tezuka, H., Mori, T., Okumura, Y., Kitabatake, K., and Tsumura, Y. (1992). Cloning of a gene suppressing hydrogen sulfide production by Saccharomyces Cerevisiae and its expression in a brewing yeast. J. Am. Soc. Brew. Chem. 50, 130–133. doi: 10.1094/ASBCJ-50-0130
Ugliano, M., Kolouchova, R., and Henschke, P. A. (2011). Occurrence of hydrogen sulfide in wine and in fermentation: influence of yeast strain and supplementation of yeast available nitrogen. J. Indust. Microbiol. Biotechnol. 38, 423–429. doi: 10.1007/s10295-010-0786-786
Vos, P. J. A., and Gray, R. S. (1979). The origin and control of hydrogen sulfide during fermentation of grape must. Am. J. Enol. Vitic. 30:11.
Walker, M. E., Nguyen, T. D., Liccioli, T., Schmid, F., Kalatzis, N., Sundstrom, J. F., et al. (2014). Genome-wide identification of the fermentome; genes required for successful and timely completion of wine-like fermentation by Saccharomyces cerevisiae. BMC Genomics 15:552. doi: 10.1186/1471-2164-15-552
Young, M. D., Wakefield, M. J., Smyth, G. K., and Oshlack, A. (2010). Gene ontology analysis for RNA-seq: accounting for selection bias. Genome Biol. 11:R14.
Zhang, W., Cheng, Y., Li, Y., Du, G., Xie, G., Zou, H., et al. (2018). Adaptive evolution relieves nitrogen catabolite repression and decreases urea accumulation in cultures of the chinese rice wine yeast strain Saccharomyces cerevisiae XZ-11. J. Agric. Food Chem. 66, 9061–9069. doi: 10.1021/acs.jafc.8b01313
Keywords: cider, diammonium phosphate, hydrogen sulfide, Saccharomyces cerevisiae, transcriptomics, yeast assimilable nitrogen
Citation: Song Y, Gibney P, Cheng L, Liu S and Peck G (2020) Yeast Assimilable Nitrogen Concentrations Influence Yeast Gene Expression and Hydrogen Sulfide Production During Cider Fermentation. Front. Microbiol. 11:1264. doi: 10.3389/fmicb.2020.01264
Received: 19 November 2019; Accepted: 18 May 2020;
Published: 24 June 2020.
Edited by:
Giovanna Suzzi, University of Teramo, ItalyReviewed by:
Antoine Gobert, Université de Bourgogne, FranceRosanna Tofalo, University of Teramo, Italy
Copyright © 2020 Song, Gibney, Cheng, Liu and Peck. This is an open-access article distributed under the terms of the Creative Commons Attribution License (CC BY). The use, distribution or reproduction in other forums is permitted, provided the original author(s) and the copyright owner(s) are credited and that the original publication in this journal is cited, in accordance with accepted academic practice. No use, distribution or reproduction is permitted which does not comply with these terms.
*Correspondence: Shuwen Liu, liushuwen@nwsuaf.edu.cn; Gregory Peck, gmp32@cornell.edu