 Tatum S. Katz
 Dayna M. Harhay
 John W. Schmidt
 Tommy L. Wheeler
- U.S. Department of Agriculture, Agricultural Research Service, Roman L. Hruska U.S. Meat Animal Research Center, Clay Center, NE, United States
There is an increasing awareness in the field of Salmonella epidemiology that focusing control efforts on those serotypes which cause severe human health outcomes, as opposed to broadly targeting all Salmonella, will likely lead to the greatest advances in decreasing the incidence of salmonellosis. Yet, little guidance exists to support validated, scientific selection of target serotypes. The goal of this perspective is to develop an approach to identifying serotypes of greater concern and present a case study using meat- and poultry-attributed outbreaks to examine challenges in developing a standardized framework for defining target serotypes.
1 Introduction
In the United States, non-typhoidal Salmonella (NTS) is the leading cause of bacterial foodborne illness (Centers for Disease Control and Prevention, 2023b) with $4.1 billion lost to NTS illness yearly (United States Department of Agriculture Economic Research Service, 2023). Despite numerous improvements in the control of Salmonella cross-contamination in food processing and production environments, NTS illness rates have not decreased in the last 20 years (Centers for Disease Control and Prevention, 2023c). This indicates that scientific understanding of NTS throughout affected food production and processing systems has not reached the level that enables effective control strategies.
A complicating factor in Salmonella control is the diversity of the genus. Consisting of two species and seven subspecies, Salmonella are further subtyped by serotyping, a phenotyping method which determines agglutination of the bacteria with antisera to identify antigenic variants (Grimont and Weill, 2007). Less than 2% of the >2,600 known serotypes consistently appear in reports on U.S. human infections (Issenhuth-Jeanjean et al., 2014; Centers for Disease Control and Prevention, 2023d). New information on genomic differences among Salmonella serotypes (den Bakker et al., 2011; Suez et al., 2013; Cheng et al., 2019; Rakov et al., 2019; Wang et al., 2020) has led to specifically targeting Salmonella that pose the greatest risk to human health, rather than broadly managing all Salmonella contamination. To this end, industry, academia, and government organizations have begun to focus research efforts on determining which serotypes to target and methods for rapidly identifying those serotypes of greater concern (Cohn et al., 2021; Chen et al., 2022; United States Department of Agriculture Food Safety and Inspection Service, 2022; Centers for Disease Control and Prevention, 2023a).
Analysis of epidemiological data may identify Salmonella serotypes with a greater impact on human health. A key original epidemiological analysis determined that there were significant differences among serotypes in their epidemiological outcomes by analysis of 1996 to 2006 FoodNet data (Jones et al., 2008). The Jones study presented a unique and practical approach based on retrospective, epidemiological data, but was limited to data collected from 10 states (representing 10–15% of the US population) over 11 years. Furthermore, FoodNet data consists of sporadic illnesses which are not necessarily part of an identified outbreak, and are not confirmed to be transmitted by food (Centers for Disease Control and Prevention, 2021). Given the evolving Salmonella regulatory landscape and the limitations of the Jones study, we have revisited this epidemiological analysis using new data and with a new goal: identification of serotypes to target for management to improve human health outcomes (which we will refer to throughout as “serotypes of concern” or SoC). In our analyses, we focus on salmonellosis outbreaks across the United States with a confirmed food transmission route utilizing the CDC's National Outbreak Reporting System (Centers for Disease Control and Prevention, 2023d). Accordingly, we present two different methods for analyzing CDC Salmonella outbreak data collected between 2009–2021 and attributed to meat and poultry (8,524 illnesses across 36 serotypes). During these analyses, we also identified several obstacles that complicate the conclusions made. The goals of this perspective, therefore, are to (1) suggest serotypes of concern associated with meat and poultry; (2) outline some of the obstacles and opportunities in determining SoC using epidemiological data.
2 Statistical approaches using epidemiological data
There is no consensus on what constitutes a SoC. The Jones study, while providing a powerful framework for examining differences across serotypes by epidemiological data, did not produce a definitive list of target serotypes (Jones et al., 2008). The USDA FSIS has identified their most commonly-detected serotypes Infantis, Enteritidis, and Typhimurium as Key Performance Indicators (KPIs), yet these together represented just 4.22% of Salmonella positive FSIS samples from 2020 to 2021, and 26% of all-cause sporadic illness isolates in 2020 (United States Department of Agriculture Food Safety and Inspection Service, 2022; Centers for Disease Control and Prevention, 2023a). Furthermore, much of the scientific literature on Salmonella virulence and host-pathogen interaction focuses on two of the highest-incidence serotypes (Typhimurium and Enteritidis), with little study devoted to other serotypes that contribute to most human illnesses in the US each year.
To provide an actionable list of SoC, quantitative validation is key. We define two major challenges to achieving this list: first, the list should be complete enough that targeting the serotypes included would result in decreasing salmonellosis to meet the DHHS Healthy People 2030 goals (U. S. Department of Health and Human Services, 2020) but concise enough to be actionable; and second, the determination of which epidemiological variables are critical for reducing outbreaks and illnesses. We have developed two methods for identifying SoC: a machine learning-based approach and a more classical, outlier-based approach. These approaches represent two extremes of statistical approaches to this problem: the machine learning approach is highly flexible and less constrained by researcher input, while the outlier approach brings together researcher input and quantitative validation in a simple decision rule. The results of both approaches were combined to create a priority SoC list that could be targeted for reducing U.S. illnesses attributed to chicken, turkey, pork, and beef.
2.1 Epidemiological data
Data representing all 50 U.S. states and Puerto Rico were downloaded from Centers for Disease Control's National Outbreak Reporting System (NORS) on 1/18/2023 (Centers for Disease Control and Prevention, 2023d). This dataset contained information on the confirmed or suspected food source, categorized following the Integrated Food Safety Analytics Collaboration (IFSAC) Food Categorization Scheme (Richardson et al., 2017), as well as the year of the first illness, the confirmed or suspected Salmonella serotype(s) responsible, and information on the outbreak including the number ill, number hospitalized, and number of deaths. We focus on outbreak-associated cases because we seek to identify those serotypes which cause systematic illness (i.e., we can examine source attribution as a variable) compared to serotypes which cause sporadic cases, where the source is generally unknown. Following data cleaning, including removal of observations with missing epidemiological, attribution, or etiology data, 694 out of 3042 outbreaks remained for analysis across all attributed sources (Supplementary material).
2.2 Machine learning approach
Detailed methods for both approaches are available in the Supplementary material, and all data and code generated for this study is available for free download at https://github.com/tatumskatz/serotypesOfConcern. Machine learning methods are especially useful for uncovering previously unnoticed trends and patterns in complex biological data since minimal assumptions have to be made about the data generation process (Bzdok et al., 2018). In this approach, we utilized an agglomerative nesting hierarchical cluster analysis (AGNES) to categorize serotypes as SoC or not (Supplementary material). Hierarchical cluster analysis proceeds by calculating the similarity between observations over multiple variables, and then using those similarity scores to group observations. Each observation starts off alone and is iteratively grouped with others based on distance (Altman and Krzywinski, 2017). After groups are created, the optimal number of groups is determined by assessing how similar the observations in a group are to each other and by maximizing within-group similarity while minimizing between-group similarity (Altman and Krzywinski, 2017). Once the optimal number of groups was determined, we then used expert knowledge to identify the group which contains the SoC so that any serotype in that group is classified as a SoC. By using a flexible, pattern-seeking approach and allowing the researcher to only provide input at the very end, this method can potentially reveal new insights in this complex dataset.
2.2.1 Machine learning results
SoC were identified for meat overall and each commodity. In all cases, the Ward cluster method outperformed other methods and so was used to generate all clusters. Optimal number of groups ranged from 3 for meat overall, beef, chicken, and turkey to 4 for pork. Decision rules for categorizing serotypes as SoC varied by commodity: for meat overall, beef, chicken, and turkey “more than one outbreak in at least 2 years”; and for pork, “more than one outbreak in at least 2 years, or one outbreak with at least 7 hospitalizations in at least 2 years”. The SoC lists also varied by commodity: SoC for the four commodities and meat overall are presented in Table 1. Notably, the list for chicken SoC included only Enteritidis (Supplementary Table 1). Further analysis showed that the large number of Enteritidis outbreaks attributable to chicken products appeared to overwhelm other outbreaks so that no other serotypes are identified. Conversely, commodities with fewer outbreaks overall, and beef especially, revealed unanticipated SoC including Dublin and Uganda. Comparisons of the epidemiological data of these serotypes with established outbreak serotypes such as Enteritidis and Typhimurium revealed similar values for outbreaks, illnesses, and hospitalizations within the beef commodity (Table 1, Figure 1).
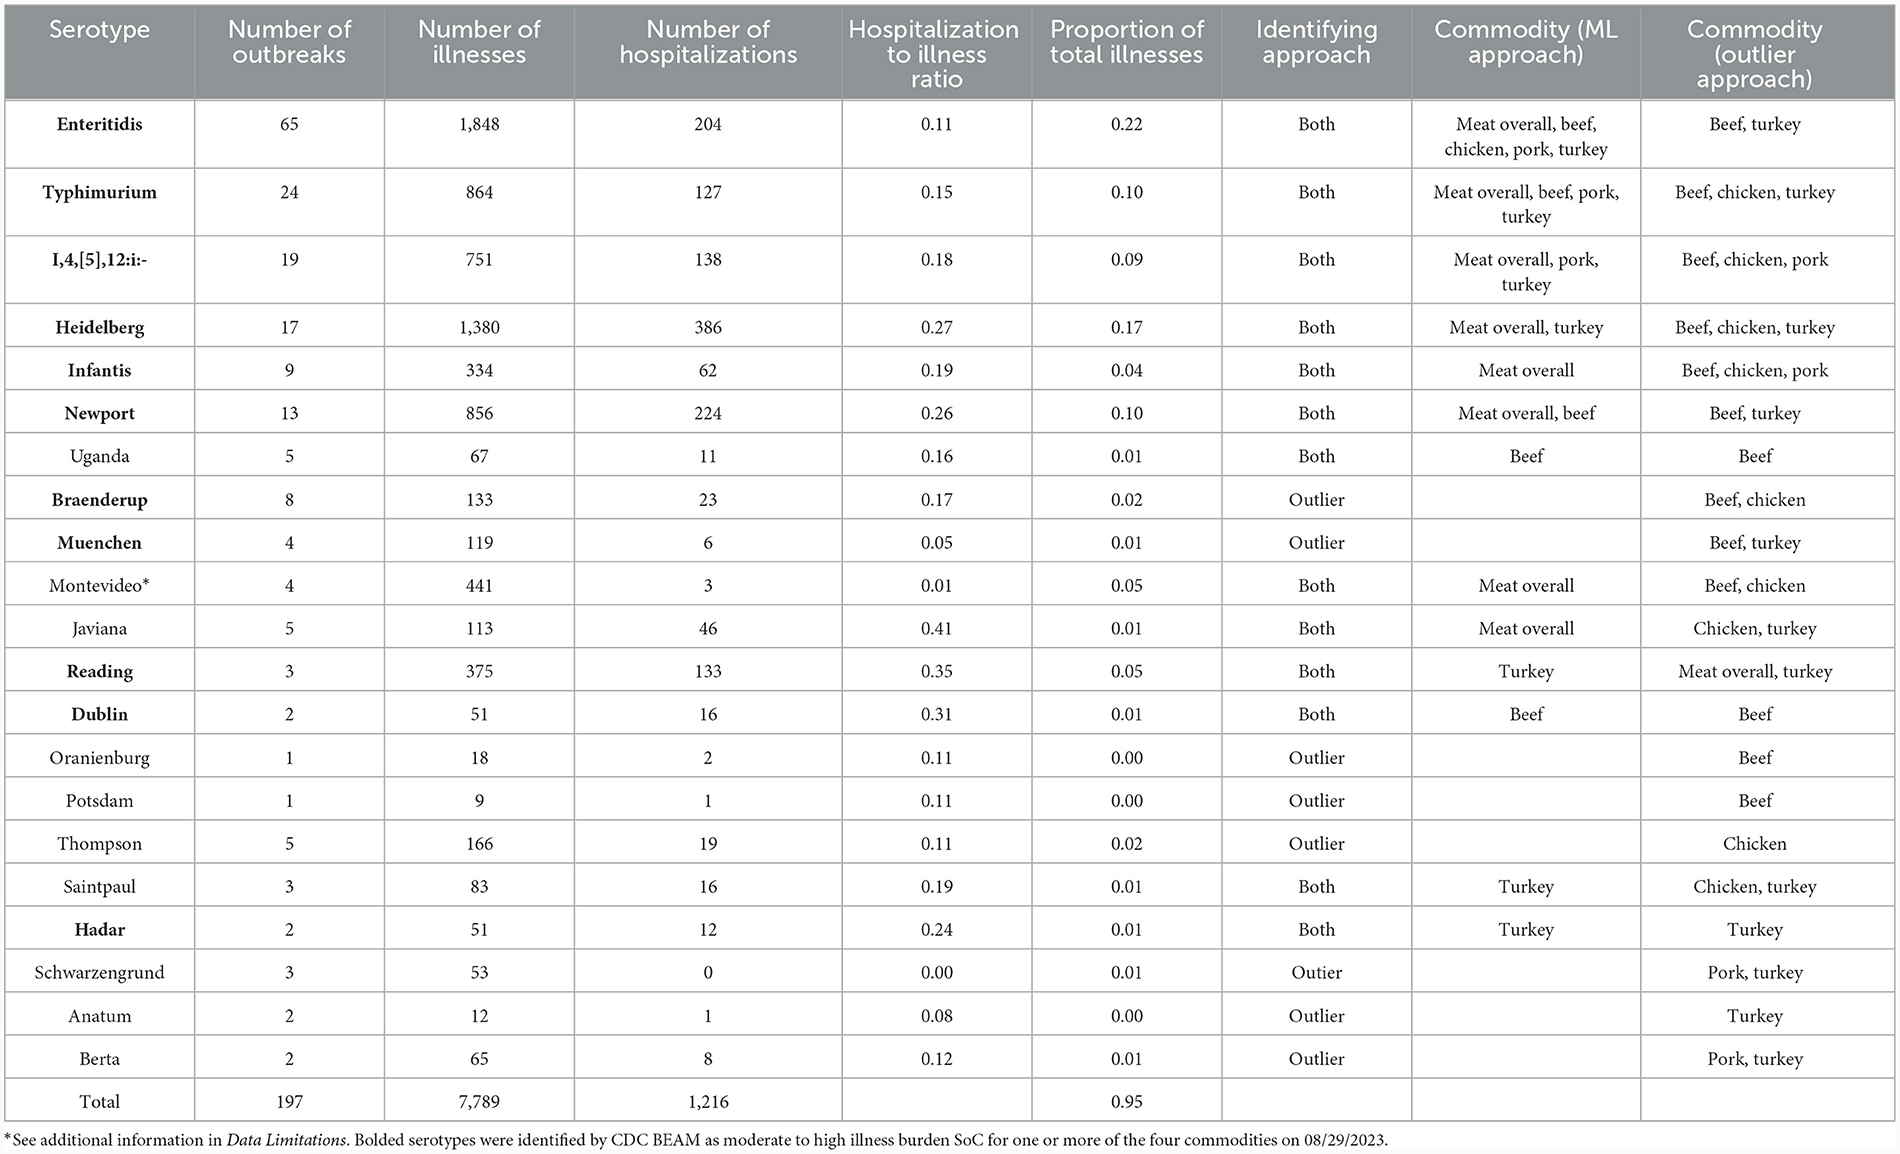
Table 1. Summary statistics for identified serotypes of concern attributed to meat and poultry from the CDC NORS dataset.
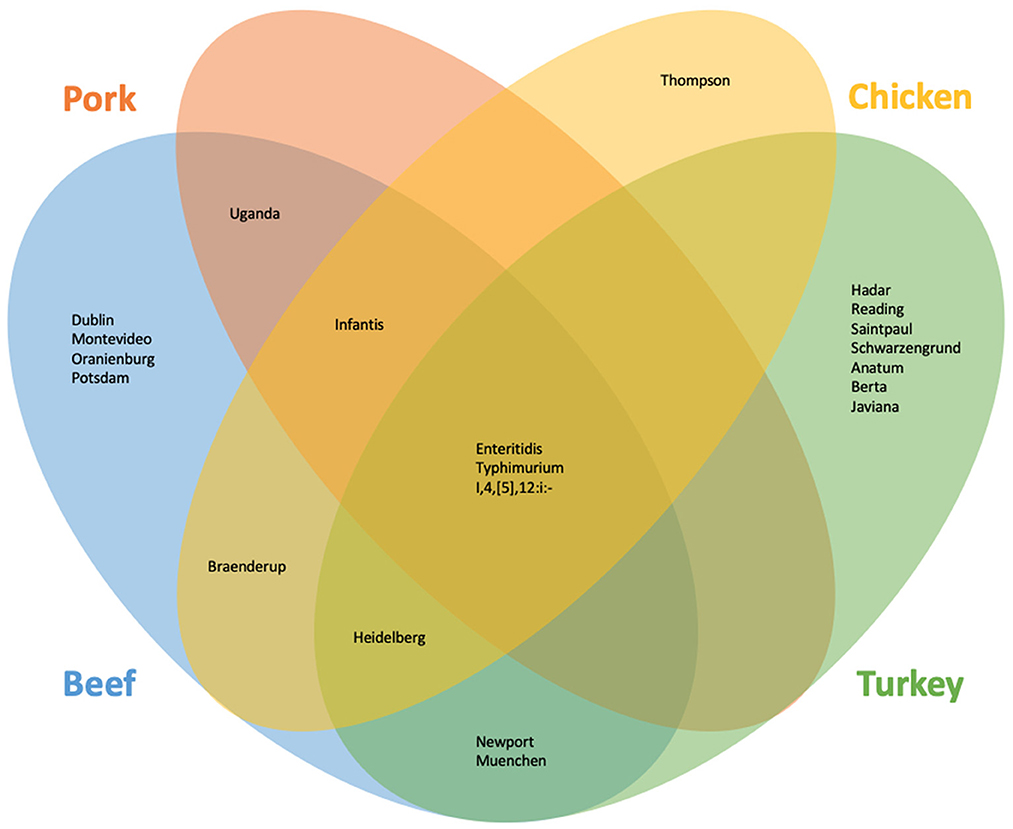
Figure 1. Serotypes identified as of concern using the machine learning and outlier approach for beef, chicken, pork, and turkey.
2.3 Outlier approach
If the machine learning approach produces a “black box” decision rule, the outlier approach produces a “clear box” decision rule. Outliers have no single mathematical definition, but we can intuitively describe them as observations which are so different from the rest of the data that they seem to be generated by an entirely different process (Hawkins, 1980). To define an outlier, we must have an idea of what “normal” observations are; then, we can identify abnormal observations (Aggarwal, 2017). By allowing for an a priori model of a “normal” data generation process (i.e., what a “normal” outbreak looks like), we can incorporate expert knowledge into our SoC definition and still allow quantitative validation by generating a score for how outlied each “abnormal” serotype is. Outlier identification is challenging for a variety of reasons, but we meet a specific challenge for our serotype list: many outlier tests assume only one or two outliers exist (Aggarwal, 2017); yet, we do not want to pre-define the number of outliers. Therefore, we utilized an approach which defines outliers using quartiles. This method avoids specifying a distribution (which is challenging given the nature of the data) or number of outliers and instead calculates how different each observation is from the rest of the data. For our case study, we used the average outbreak size and hospitalization:illness ratio to determine target serotypes. This method is similar, and sometimes identical to, the way one might use a box-and-whisker plot to identify outliers (Aggarwal, 2017).
2.3.1 Outlier results
As with the machine learning method, the outlier method results varied by commodity. Outlier cutoffs for meat overall were an average outbreak size >60.60 individuals and a hospitalization to illness ratio of greater than 0.30; for beef and turkey, any serotype with an average outbreak size and hospitalization to illness ratio >0 were SoC; for chicken, an average outbreak size >14.50 and a ratio of >0; for pork, an average outbreak size >24.50 and a ratio >0.15 were SoC (Supplementary Table 2, Supplementary Figure 2). Serotypes identified as SoC for the four commodities and meat overall are presented in Table 1 and Figure 1.
2.4 Generating the serotypes of concern list
To generate our final list of SoC, any serotype that was identified by either the machine learning approach or the outlier approach was classified as a SoC (Table 1, Figure 1). Additionally, serotypes are marked as SoC for a given commodity if either approach identified it as such for that commodity. Combining the results of both methods results in a more holistic list, in alignment with our goals.
3 Obstacles and opportunities
3.1 Data limitations
Perhaps the most important limitation of our work is that NORS is a dynamic reporting system (reports can be modified, added, or removed at any time), so that future analyses may differ from ours due to the dynamic nature of the database. There are also limitations in the data available at the time of analysis. Outbreaks make up on average 10% of documented illnesses (Scallan et al., 2011; The Interagency Food Safety Analytics Collaboration, 2020), as such, this analysis does not take illnesses attributed to sporadic incidence into account, unlike the Jones study (Jones et al., 2008). Additionally, NORS is a voluntary reporting system and so does not represent all outbreaks in the U.S. Breaking down the data by specific source attribution commodities resulted in low sample sizes for some analyses. Beef and turkey for example, had few outbreak data (noutbreaks = 37 and 31, respectively) and accordingly, more serotypes were identified for beef and turkey than chicken (noutbreaks = 96) and pork (noutbreaks = 63). If these data were parsed at the level of detail required for a business entity wanting to take actions in a specific production system, there are even less data available for analysis. Epidemiological data are naturally imperfect in that they contain information not just about the pathogen, but about the host and the environment as well. For example, Montevideo was identified as a beef SoC, yet the two largest beef-attributed Montevideo outbreaks can be traced back to a single caterer with a backyard chicken flock which may have contributed to the contamination of the beef prepared by the caterer (North Dakota Department of Health - Division of Disease Control, 2009). This final issue is challenging to tackle without parsing all individual outbreak reports, and there is not information at this level of detail for every outbreak. Researchers must be careful to be clear about the limits of their data as they identify SoC.
3.2 Machine learning is not a panacea
As expected, this case study did reveal candidate SoC that may have been “hidden” by traditional approaches. Many machine learning methods are rejected as “black boxes.” That is, the methods are poorly documented to a degree that no critical analysis can be performed. This can be remedied by clearly and accurately explaining the techniques used that resulted in the final output. Machine learning tools should not be treated as a black box, rather, we must focus on replicability and clear communication of research.
3.3 The outlier approach requires many decisions
Unlike the machine learning approach, the outlier approach required two major decisions to be made: what variables to use and how to define an outlier. While these decisions were made using expert knowledge, we have limited tools to quantitatively validate them. This may be the greatest weakness of the outlier approach, but it is also its strength as we can seamlessly incorporate expert knowledge into our methods.
3.4 Other considerations
In addition to the above obstacles, the issues of what data to include and the role of pathogen evolution must be considered. Incidence alone is not enough for the determination of SoCs because most cases of salmonellosis are self-limiting with at-home care, and to improve human health we need to target the most “dangerous” types of Salmonella. Similarly, including death in the SoC definition may also bias results because salmonellosis is usually not the only factor contributing to a death outcome—comorbidities are often present (Cummings et al., 2010). Therefore, we instead propose the inclusion of a measurement of disease severity (i.e., hospitalization to infection ratio) or another metric of pathogenicity other than death in SoC definitions. Furthermore, while this list of SoC represents a snapshot of the current Salmonella epidemiological landscape, pathogens are constantly evolving. For example, the Infantis strain containing the pESI plasmid has become a highly successful strain that now dominates the Salmonella isolated from poultry at harvest in the U.S. (McMillan et al., 2022). In the earlier 20th century, successful control of serotype Gallinarum likely led to the emergence of Enteritidis as a dominant serotype in poultry (Rabsch et al., 2000). When targeting serotypes, we must be cautious to include evolutionary models to understand how best to manage them. Increased surveillance and re-visiting SoC definitions periodically will be required to help us stay ahead of Salmonella evolution. Finally, while serotyping has historically been instrumental in subtyping and understanding the diversity of Salmonella, evidence suggests that there are important differences even within serotypes (Cohn et al., 2021; Chen et al., 2022). As we move away from serotyping as the dominant subtyping method and toward genetics-based subtyping, ensuring “backwards compatibility” of new methods against SoC is key.
4 Conclusions
Defining a list of Salmonella serotypes to target to improve public health outcomes is a challenging yet critical task. Current approaches may oversimplify the true complexity of the Salmonella problem, leaving us to target only the most common serotypes. Yet, little evidence exists to suggest that control of the premier serotypes, such as Enteritidis or Typhimurium, will achieve the goal of decreasing Salmonella infection in humans. We developed frameworks for a quantitative, epidemiological method to define target serotypes for management and control and have produced a list of serotypes of concern (SoC) for the meat and poultry industry. The serotypes identified can be utilized by industry to target specific Salmonella and improves upon existing Key Performance Indicators by being epidemiologically validated. The development of rapid testing technologies, which target a suite of Salmonella serotypes based on shared features, could use this list as validation to ensure the tool will bring about the desired human health improvements. Further, using the code generated during this study and the CDC National Outbreak Reporting system, researchers and industry alike can tailor this analysis to their specific needs or update the analysis with new data over time.
New approaches to defining SoC must consider the holistic scope of host-pathogen-environment interactions, evolution, and comorbidities in the host while remaining scientifically and statistically supported. By incorporating these factors into new definitions of target serotypes, we believe there is great opportunity for advancing the control of Salmonella for the betterment of public health.
Data availability statement
Publicly available datasets were analyzed in this study. These data can be found here: Centers for Disease Control National Outbreak Reporting System and https://github.com/tatumskatz/serotypesOfConcern.
Author contributions
TK: Data curation, Formal analysis, Investigation, Methodology, Software, Visualization, Writing – original draft, Writing – review & editing. DH: Conceptualization, Methodology, Validation, Writing – review & editing. JS: Conceptualization, Writing – review & editing. TW: Conceptualization, Supervision, Writing – review & editing.
Funding
The author(s) declare financial support was received for the research, authorship, and/or publication of this article. This work was supported by funds from U.S. Department of Agriculture, Agricultural Research Service CRIS project 3040-42000-020-00D. This research was supported in part by an appointment to the Agricultural Research Service (ARS) Research Participation Program administered by the Oak Ridge Institute for Science and Education (ORISE) through an interagency agreement between the U.S. Department of Energy (DOE) and the U.S. Department of Agriculture (USDA). ORISE is managed by ORAU under DOE contract number DE-SC0014664.
Acknowledgments
The authors would like to thank Dr. Taylor Eisenstein with the Centers for Disease Control and Prevention, for assistance with accessing NORS data and review of the manuscript draft. We wish to thank Jody Gallagher for administrative support. We also thank the USDA-ARS Salmonella Grand Challenge. The use of product and company names is necessary to accurately report the methods and results; however, the United States Department of Agriculture (USDA) neither guarantees nor warrants the standard of the products, and the use of names by the USDA implies no approval of the product to the exclusion of others that may also be suitable. The USDA is an equal opportunity provider and employer.
Conflict of interest
The authors declare that the research was conducted in the absence of any commercial or financial relationships that could be construed as a potential conflict of interest.
Publisher's note
All claims expressed in this article are solely those of the authors and do not necessarily represent those of their affiliated organizations, or those of the publisher, the editors and the reviewers. Any product that may be evaluated in this article, or claim that may be made by its manufacturer, is not guaranteed or endorsed by the publisher.
Author disclaimer
All opinions expressed in this paper are the author's and do not necessarily reflect the policies and views of USDA, DOE, or ORAU/ORISE.
Supplementary material
The Supplementary Material for this article can be found online at: https://www.frontiersin.org/articles/10.3389/fmicb.2024.1307563/full#supplementary-material
References
Aggarwal, C. C. (2017). Outlier Analysis. 2nd ed. Yorktown Heights, New York: Springer. doi: 10.1007/978-3-319-47578-3
Altman, N., and Krzywinski, M. (2017). Points of significance: clustering. Nat. Methods 14, 545–546. doi: 10.1038/nmeth.4299
Bzdok, D., Altman, N., and Krzywinski, M. (2018). Points of significance: statistics versus machine learning. Nat. Methods 15, 233–234. doi: 10.1038/nmeth.4642
Centers for Disease Control and Prevention (2023c). FoodNet Fast. Available online at: https://www.cdc.gov/foodnet/foodnet-fast.html (accessed July 31, 2023).
Centers for Disease Control and Prevention (2021). FoodNet Fast: Pathogen Surveillance Tool FAQ. Available online at: https://www.cdc.gov/foodnet/foodnet-fast/faq-pathogen-surveillance.html (accessed December 13, 2023).
Centers for Disease Control and Prevention (2023a). BEAM (Bacteria, Enterics, Amoeba, and Mycotics) Dashboard. Available online at: https://www.cdc.gov/ncezid/dfwed/BEAM-dashboard.html (accessed August 31, 2023).
Centers for Disease Control and Prevention (2023d). National Outbreak Reporting System. Available online at: https://www.cdc.gov/nors/index.html (accessed August 31, 2023).
Centers for Disease Control and Prevention (2023b). Foodborne Germs and Illnesses. Available online at: https://www.cdc.gov/foodsafety/foodborne-germs.html (accessed August 31, 2023).
Chen, R., Cheng, R. A., Wiedmann, M., and Orsi, R. H. (2022). Development of a genomics-based approach to identify putative hypervirulent nontyphoidal salmonella isolates: salmonella enterica serovar saintpaul as a model. mSphere 7:e00730–21. doi: 10.1128/msphere.00730-21
Cheng, R. A., Eade, C. R., and Wiedmann, M. (2019). Embracing diversity: differences in virulence mechanisms, disease severity, and host adaptations contribute to the success of nontyphoidal salmonella as a foodborne pathogen. Front. Microbiol. 10:1368. doi: 10.3389/fmicb.2019.01368
Cohn, A. R., Cheng, R. A., Orsi, R. H., and Wiedmann, M. (2021). Moving past species classifications for risk-based approaches to food safety: salmonella as a case study. Front. Sustain. Food Syst. 5:652132. doi: 10.3389/fsufs.2021.652132
Cummings, P. L., Sorvillo, F., and Kuo, T. (2010). Salmonellosis-related mortality in the United States, 1990-2006. Foodborne Pathog. Dis. 7, 1393–1399. doi: 10.1089/fpd.2010.0588
den Bakker, H. C., Moreno Switt, A. I., Govoni, G., Cummings, C. A., Ranieri, M. L., Degoricija, L., et al. (2011). Genome sequencing reveals diversification of virulence factor content and possible host adaptation in distinct subpopulations of Salmonella enterica. BMC Genom. 12, 1–11. doi: 10.1186/1471-2164-12-425
Grimont, P. A. D., and Weill, F.-X. (2007). “Antigenic formulae of the Salmonella serovars,” in WHO Collaborating Centre for Reference and Research on Salmonella, 1–166.
Hawkins, D. M. (1980). Identification of Outliers. Dordrecht: Springer Netherlands doi: 10.1007/978-94-015-3994-4
Issenhuth-Jeanjean, S., Roggentin, P., Mikoleit, M., Guibourdenche, M., De Pinna, E., Nair, S., et al. (2014). Supplement 2008-2010 (no. 48) to the White-Kauffmann-Le Minor scheme 2 3 4. Available online at: http://www.pasteur.fr/sante/clre/cadrecnr/salmoms/WKLM_En.pdf (accessed July 18, 2023).
Jones, T. F., Ingram, L. A., Cieslak, P. R., Vugia, D. J., Tobin-D'Angelo, M., Hurd, S., et al. (2008). Salmonellosis outcomes differ substantially by serotype. J. Infect. Dis. 198, 109–114. doi: 10.1086/588823
McMillan, E. A., Weinroth, M. D., and Frye, J. G. (2022). Increased prevalence of salmonella infantis isolated from raw chicken and Turkey products in the united states is due to a single clonal lineage carrying the pESI Plasmid. Microorganisms 10:1478. doi: 10.3390/microorganisms10071478
North Dakota Department of Health - Division of Disease Control (2009). The Pump Handle Archives. Available online at: https://gcc02.safelinks.protection.outlook.com/?url=http%3A%2F%2Fndhealth.gov%2Fdisease%2FNewsletters%2FPumpHandleArchives%2F06-09.pdfanddata=05%7C01%7CTatum.Katz%40usda.gov%7C2f873ab009eb4b191fff08dbaa5a62f5%7Ced5b36e701ee4ebc867ee03cfa0d4697%7C1%7C0%7C638291077910762205%7CUnknown%7CTWFpbGZsb3d8eyJWIjoiMC4wLjAwMDAiLCJQIjoiV2luMzIiLCJBTiI6Ik1haWwiLCJXVCI6Mn0%3D%7C3000%7C%7C%7Candsdata=loqvhtb1nFkGPuLNQwMiJPHGgUEDsKFRY%2BSwnz7Rwm8%3Dandreserved=0 (accessed August 31, 2023).
Rabsch, W., Hargis, B. M., Tsolis, R. M., Kinglsey, R. A., Hinz, K.-H., Tschäpe, H., et al. (2000). Competitive exclusion of Salmonella enteritidis bysalmonella gallinarum in poultry. Emerg. Infect. Dis. 6:443. doi: 10.3201/eid0605.000501
Rakov, A. V., Mastriani, E., Liu, S. L., and Schifferli, D. M. (2019). Association of Salmonella virulence factor alleles with intestinal and invasive serovars. BMC Genom. 20, 1–14. doi: 10.1186/s12864-019-5809-8
Richardson, L. C., Bazaco, M. C., Parker, C. C., Dewey-Mattia, D., Golden, N., Jones, K., et al. (2017). An updated scheme for categorizing foods implicated in foodborne disease outbreaks: a tri-agency collaboration. Foodborne Pathog. Dis. 14, 701–710. doi: 10.1089/fpd.2017.2324
Scallan, E., Hoekstra, R. M., Angulo, F. J., Tauxe, R. V., Widdowson, M.-A., Roy, S. L., et al. (2011). Foodborne illness acquired in the United States—major pathogens. Emerg. Infect. Dis. 17, 7–15. doi: 10.3201/eid1701.P11101
Suez, J., Porwollik, S., Dagan, A., Marzel, A., Schorr, Y. I., Desai, P. T., et al. (2013). Virulence gene profiling and pathogenicity characterization of non-typhoidal salmonella accounted for invasive disease in humans. PLoS ONE 8:e58449. doi: 10.1371/journal.pone.0058449
The Interagency Food Safety Analytics Collaboration (2020). Foodborne illness source attribution estimates for 2018 for Salmonella, Escherichia coli O157, Listeria monocytogenes, and Campylobacter using multi-year outbreak surveillance data, United States. GA and D.C. Available online at: https://www.cdc.gov/foodsafety/ifsac/projects/index.html (accessed July 19, 2023).
United States Department of Agriculture Economic Research Service (2023). Cost Estimates of Foodborne Illness. Available online at: https://www.ers.usda.gov/data-products/cost-estimates-of-foodborne-illnesses/ (accessed July 31, 2023).
United States Department of Agriculture Food Safety and Inspection Service (2022). USDA FY 2022-2026 Food Safety Key Performance Indicator. Available online at: https://www.fsis.usda.gov/sites/default/files/media_file/2022-06/FY2022-2026_Salmonealla_KPI_One-Pager.pdf (accessed December 19, 2023).
U. S. Department of Health and Human Services (2020). Reduce infections caused by Salmonella—FS-04. Heal. People 2030. Available online at: https://health.gov/healthypeople/objectives-and-data/browse-objectives/foodborne-illness/reduce-infections-caused-salmonella-fs-04 (accessed August 29, 2023).
Keywords: non-typhoidal salmonellosis, Salmonella enterica, serotypes, machine learning, public health, epidemiology
Citation: Katz TS, Harhay DM, Schmidt JW and Wheeler TL (2024) Identifying a list of Salmonella serotypes of concern to target for reducing risk of salmonellosis. Front. Microbiol. 15:1307563. doi: 10.3389/fmicb.2024.1307563
Received: 05 October 2023; Accepted: 25 January 2024;
Published: 12 February 2024.
Edited by:
Sébastien Holbert, INRA Centre Val de Loire, FranceReviewed by:
Nandkishor Bankar, Datta Meghe Institute of Medical Sciences, IndiaCopyright This work is authored by Tatum Katz, Dayna Harhay, John W. Schmidt and Tommy Wheeler on behalf of the U.S. Government and as regards Dr. Katz, Dr. Harhay, Dr. Schmidt and Dr. Wheeler, and the U.S. Government, is not subject to copyright protection in the United States. Foreign and other copyrights may apply. This is an open-access article distributed under the terms of the Creative Commons Attribution License (CC BY). The use, distribution or reproduction in other forums is permitted, provided the original author(s) and the copyright owner(s) are credited and that the original publication in this journal is cited, in accordance with accepted academic practice. No use, distribution or reproduction is permitted which does not comply with these terms.
*Correspondence: Dayna M. Harhay, dayna.harhay@usda.gov