 Yuanjiang Tang1†Sixuan Zhou1*†Yuanpin Xiao2Tao Zhang1Xiaoyan Tao1Kaizhi Shi1Yuxi Lu1Yueqian Yang1Yu Zhao1Tian Zhao1
- 1Institute of Animal Husbandry and Veterinary Research, Guizhou Academy of Agricultural Sciences, Guiyang, China
- 2Guizhou Institute of Technology, Guiyang, China
Endophytic and rhizospheric microorganisms associated with plants play a crucial role in plant health, pest and disease defense, and fruit yield by actively participating in the plant’s adaptation to its environment. In this study, high–throughput sequencing technology was employed to analyze the community structure and diversity of endophytic and rhizospheric soil microorganisms in Berchemia polyphylla var. leioclada. The results revealed significant differences in microbial diversity and community structure between the soil and plant compartments within the same geographic region. Microbial diversity and species composition varied among different geographic locations. The dominant bacteria in plants were Cyanobacteria and Proteobacteria, with dominant genera including Methylobacterium-Methylorubrum, Escherichia-Shigella and Sphingomonas. In contrast, the dominant bacteria in soil were Proteobacteria, Acidobacteriota, and Actinobacteriota, with dominant genera such as Sphingomonas, Conexibacter and Vicinamibacteraceae, with Sphingomonas was considered core groups present in all plant and soil samples. As for fungi, the dominant phyla in both plants and soil were Ascomycota, Basidiomycota, and Mortierellomycota, with different dominant genera between the two compartments, including Fusarium, Septoria, and Mortierella, totaling 59 genera. Linear discriminant analysis at the genus level identified 102 bacterial and 54 fungal indicator taxa associated with plants and soil. Co-occurrence network analysis indicated close interactions among soil bacterial microorganisms. Functional prediction of the top 10 microbial genes revealed three bacterial metabolic pathways shared between soil and plants, while the predominant fungal metabolic types were similar between the two compartments but with varying abundances. This study elucidates the diversity and interplay of endophytic and rhizospheric microorganisms in Berchemia polyphylla var. leioclada across diverse geographical regions, providing insights crucial for the plant’s conservation and development.
1 Introduction
Plant endophytes comprise fungi and bacteria that reside within the healthy tissues of plants in a symbiotic relationship, without causing obvious disease symptoms to the host (Wang et al., 2021). Endophytes produce secondary metabolites that resemble the physiological activities of their host plants. These compounds not only enhance the host plants’ tolerance to external stressors but also support their growth and development (Deng et al., 2021). Moreover, the rich array of secondary metabolites produced by endophytes can be utilized in the development of animal feed additives or new pharmaceuticals, thereby offering a valuable source for enriching medicinal and other resources (Yu et al., 2010).
The rhizosphere is the narrow region of soil that is directly influenced by root secretions and associated soil microorganisms. It is the zone of soil that surrounds the roots of plants, where complex interactions occur between the plant roots, soil, and microorganisms (Pinton et al., 2007). Rhizospheric soil microorganisms play roles in enhancing plant disease resistance and regulating rhizosphere nutrient cycling, among other functions, so they have a significant impact on plant growth and development (Hakim et al., 2020; Liu et al., 2021; Zhang et al., 2023). Rhizosphere microbes also have broader environmental roles including, soil nutrient cycling, energy flow and soil pollution remediation.
Berchemia is a member of the Rhamnaceae family. It is diverse range of species including shrubs, trees, and climbing plants, growing in temperate and tropical regions in Asia, Africa, and North America (Li, 2007). Several species of Berchemia have been used in traditional medicine, and different parts of these plants, including the leaves, roots, bark, and fruits, are used for their medicinal properties. This plant contains various chemical compounds, including glycosides, quinones, lignans, terpenoids, flavonoids, and dimers, with flavonoids being the predominant chemical constituents within this genus (Shuai et al., 2021). Berchemia polyphylla has significant medicinal value and is used for its roots, stems, and leaves it has been found to be effective in treating conditions such as rheumatoid arthritis, diarrhea, acute and chronic bronchitis, among others (Jing et al., 2011; Tang et al., 2018; Zhou et al., 2022).
Plant endophytic microorganisms can enhance a plant’s resistance to environmental stress and pest/pathogen attacks, while soil microorganisms play a crucial role in soil nutrient cycling and are essential participants in a plant’s nutrient utilization processes. However, due to the complex relationships between host plant endophytes and their hosts, it is necessary to study the diversity of endophytic and rhizospheric soil microorganisms associated with Berchemia polyphylla var. leioclada.
In this study, Illumina NovaSeq sequencing technology targeting the 16S rRNA gene V3–V4 region and the ITS1 region was employed to analyze the diversity of endophytic from Berchemia polyphylla var. leioclada and the corresponding rhizospheric soil microbial communities in five different regions of Guizhou. The aim is to elucidate the spatial dynamics of diversity and the relationships between endophytic and rhizospheric soil microorganisms associated with Berchemia polyphylla var. leioclada. This research provides a theoretical basis for the discovery and resource development of functional microorganisms associated with this plant.
2 Materials and methods
2.1 Sampling area description and sample collection
Samples were collected primarily in July–August 2022 from mountainous regions located across five distinct regions in Guizhou: Nanming District, Guiyang City; Qianxi County, Bijie City; Weng’an County, Qiannan Prefecture; Xixiu District, Anshun City; and Yuqing County, Zunyi City. This time period is characterized by abundant rainfall, warm temperatures, and ample sunlight, all of which favor robust plant growth and drive the multiplication of endophytic microorganisms (Rúa et al., 2014; Oita et al., 2021). The samples included whole healthy plants (without lesions) of Berchemia polyphylla var. leioclada and rhizospheric soil collected from each of the five above-mentioned regions. Plants were uprooted and the soil adhering to the roots (rhizospheric soil) was dislodged and placed in bags (one bag per rhizospheric soil sample), while the plants were placed in separate plastic bags. Specifically, six plants and six rhizospheric soil samples were collected from each region and transported to the laboratory within 1 h of collection in ice boxes. Information about the sample collection sites and groupings is provided in Table 1.
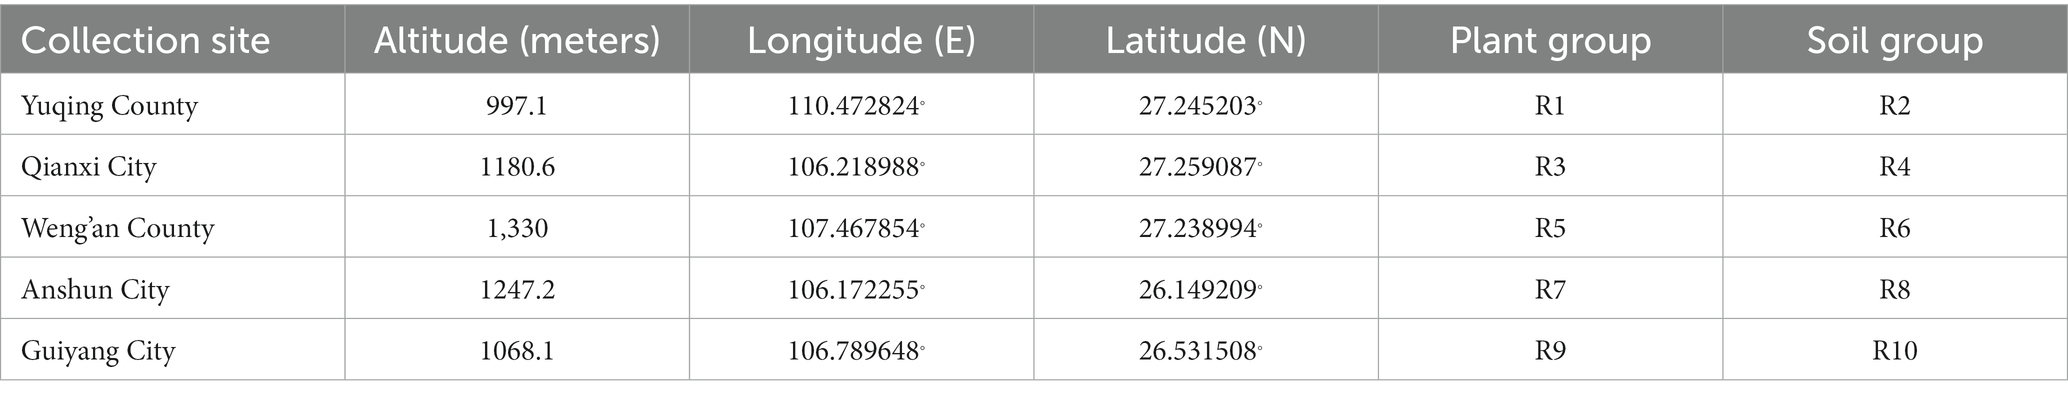
Table 1. General information of the collection sites in this study.
2.2 Plant sample processing
Plants were processed while still fresh. Tissue samples from roots, stems and leaves were randomly selected from different plant regions and rinsed thoroughly. After air–drying, the roots (primary, middle, and end) and stems (main, secondary, primary) were cut into 0.5–1.0 cm segments, while the leaves were cut into 0.5 cm × 0.5 cm squares. Tissues were surface–sterilized to clean them off epiphytes and bacterial contaminants as follows: activated with 0.1% tween for 3–5 min, rinsed three times with sterile water, soaked in 75% ethanol for 3 min, rinsed three times with sterile water, and excess surface moisture was absorbed with sterile filter paper. Subsequently, tissues were disinfected with a mixture of 70% ethanol and 3% H2O2, rinsed three times with sterile water, dried with sterile filter paper, and stored at −80°C in sterile 50 mL centrifuge tubes for later use (Shi et al., 2021a,b).
2.3 Sample DNA extraction and PCR amplification
Total genomic DNA from samples was extracted using the CTAB method (Doyle and Doyle, 1987). DNA concentration and purity were assessed on 1% agarose gels. Based on the concentration, DNA was diluted to 1 ng/μL with sterile water for PCR amplification. Specific primers were employed for amplification: Primers 341F (5’-CCT AYGGGRBGCASCAG-3′) and 806R (5’-GGACTACNNGGGT ATCTAAT-3′) targeted the V3/V4 hypervariable regions of the 16S rRNA gene, producing a ~ 460 bp fragment (Klindworth et al., 2013). For fungal ITS1 region amplification, ITS–1F (5’-CTTGGTCAT TTAGAGGAAGTAA-3′) and ITS2 (5’-GCTGCGTTCTTCATC GATGC-3′) primers were used (White et al., 1990).
2.4 PCR products quantification and library sequencing
PCR products were mixed with an equal volume of 1X loading buffer (containing SYBR Green) and subjected to electrophoresis on a 2% agarose gel for DNA visualization. Equal proportions of PCR products were pooled and purified using the Qiagen Gel Extraction Kit (Qiagen, Germany). Sequencing libraries were prepared following the NEBNext® Ultra™ II DNA Library Prep Kit (Cat No. E7645) protocol. Library quality was assessed using the Qubit® 2.0 Fluorometer (Thermo Scientific) and the Agilent Bioanalyzer 2100 system. Libraries were sequenced on an Illumina NovaSeq platform, generating 250 bp paired-end reads. Sequencing services were provided by Novogene (Beijing) using a MiSeq (Illumina) instrument.
2.5 Sequencing data processing
Sequencing data (Accession number: SAMN39214997, SAMN39245783) were split into individual sample data based on barcode and PCR primer sequences. After removing the barcode and primer sequences, FLASH software (Version 1.2.11) was used to assemble reads into raw tags (Magoč and Salzberg, 2011). The resulting raw tags were subjected to quality control using fastQ software (Version 0.20.0) to obtain high–quality clean reads. Subsequently, Vsearch (Version 2.15.0) software was used to align clean tags with databases to detect chimeras, which were then removed, yielding effective tags (Rognes et al., 2016).
The QIIME2 software (Version QIIME2-202006) was used for denoising and filtering. Sequences with an abundance of less than 5 were removed, resulting in Amplicon Sequence Variants (ASV) and a feature table. ASV was taxonomically annotated against a reference database (Brian et al., 2011).
2.6 Bioinformatics analysis
QIIME2 software was used for ASV clustering analysis. Alpha diversity was estimated using Observed_OTUs, Shannon, Simpson, and Chao1 indices. Beta diversity analysis was performed based on Unifrac distances, and PCoA was used to analyze the significance of differences in community structure between groups. LEfSe software was employed for differential species analysis between groups. p-values less than 0.05 were considered significantly different. Co-occurrence network analysis was conducted to illustrate microbial community relationships using spearman correlation index calculation. Functional prediction of bacteria and fungi was performed using the PICRUSt2 software package, and bar plots depicting the abundance of metabolic pathways in each sample group were generated. Cluster analysis was also performed based on functional differences (Douglas et al., 2018).
3 Results and analysis
3.1 ASV clustering analysis of samples
ASVs were clustered at a similarity threshold of 97%. Venn diagrams were generated to depict the shared and unique ASVs among different groupings (Figure 1). Among plant samples from the five different regions, there were 13 shared bacterial ASVs. In terms of unique ASVs R9 had the most followed by R1 > R5 > R3 > R7 (Figure 1A). For fungi, there were 159 shared ASVs among plant samples from the five regions. In terms of unique ASVs R9 had the most, followed by R7 > R1 > R3 > R5 (Figure 1C). Among soil samples, there were 589 shared bacterial ASVs. In terms of unique ASVs R8 had the most followed by R10 > R2 > R6 > R4 (Figure 1B), while for fungi, there were 146 shared ASVs, with R10 > R8 > R2 > R4 > R6 in terms of unique ASVs (Figure 1D). The number of ASVs varied significantly between plant and soil samples collected from each site (Table 2). Specifically, the number of bacterial ASVs in soil samples was greater than those in plant samples, with only a few shared between plants and soil from the same location. However, plants and soil shared proportionately more fungal ASVs, with R1 and R2 sharing the most. Hence, soil harbors a higher diversity of microbial species than plants. Plants and soil shared relatively few bacterial ASVs, while the two shared proportionately more fungal ASVs. Hence, in this study there is less overlap in bacterial ASVs between plants and soil, whereas there is greater overlap or similarity in terms of fungal ASVs.
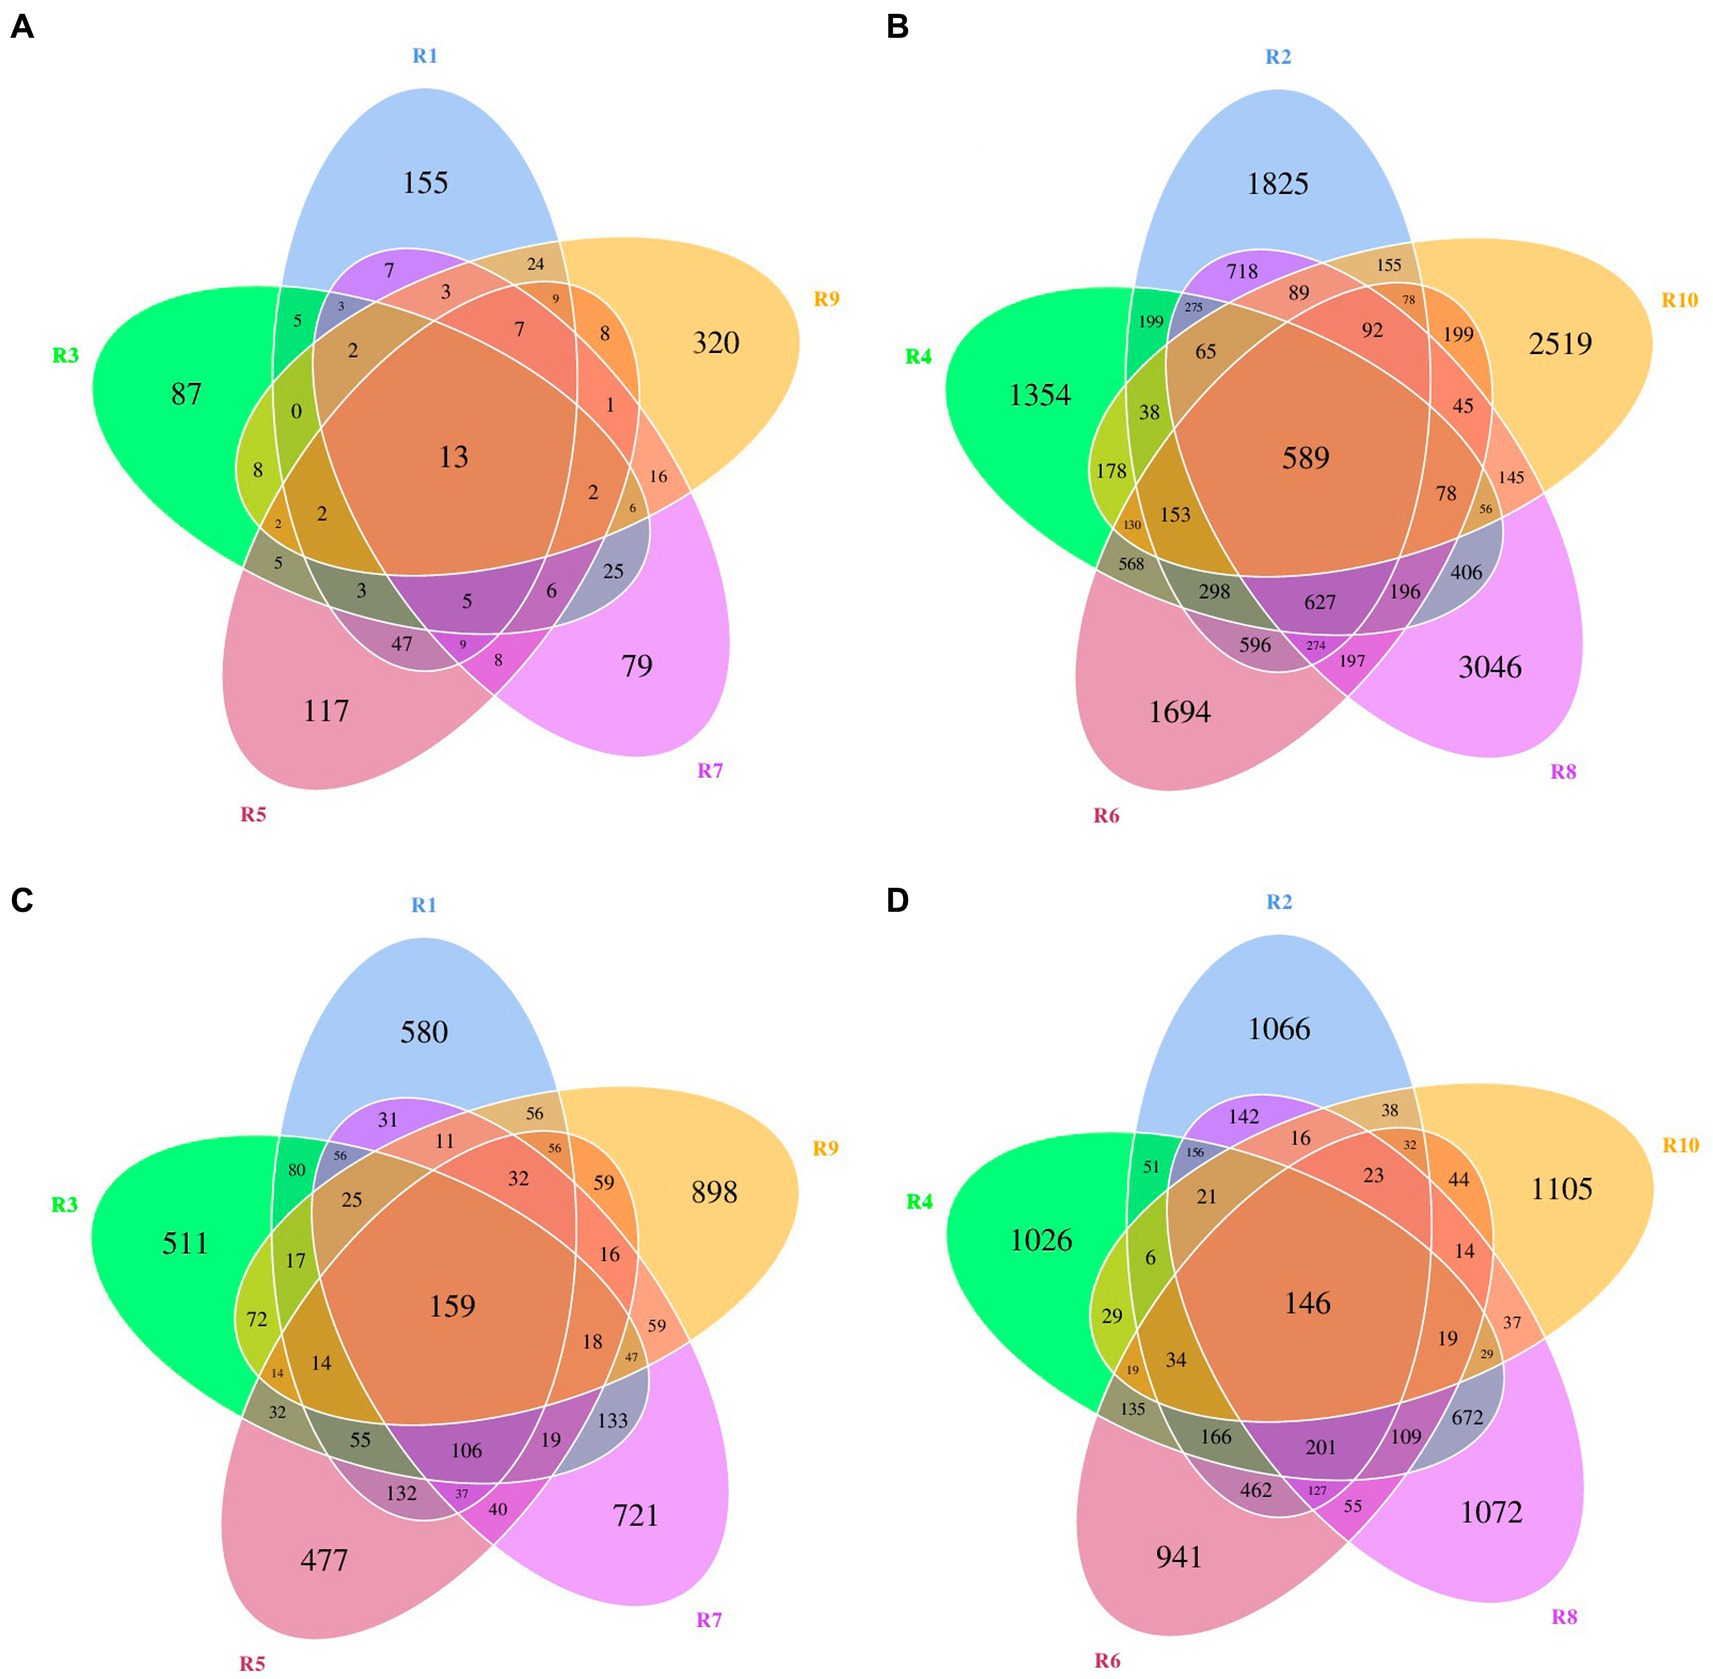
Figure 1. Venn diagrams of bacterial and fungal amplicon sequencing variants (ASVs) of plants and rhizospheric soil from five regions of China. (A) Bacterial ASVs in plants from five locations. (B) Bacterial ASVs in soil from five locations. (C) Fungal ASVs in plants from five locations. (D) Fungal ASVs in rhizospheric soil from five locations.
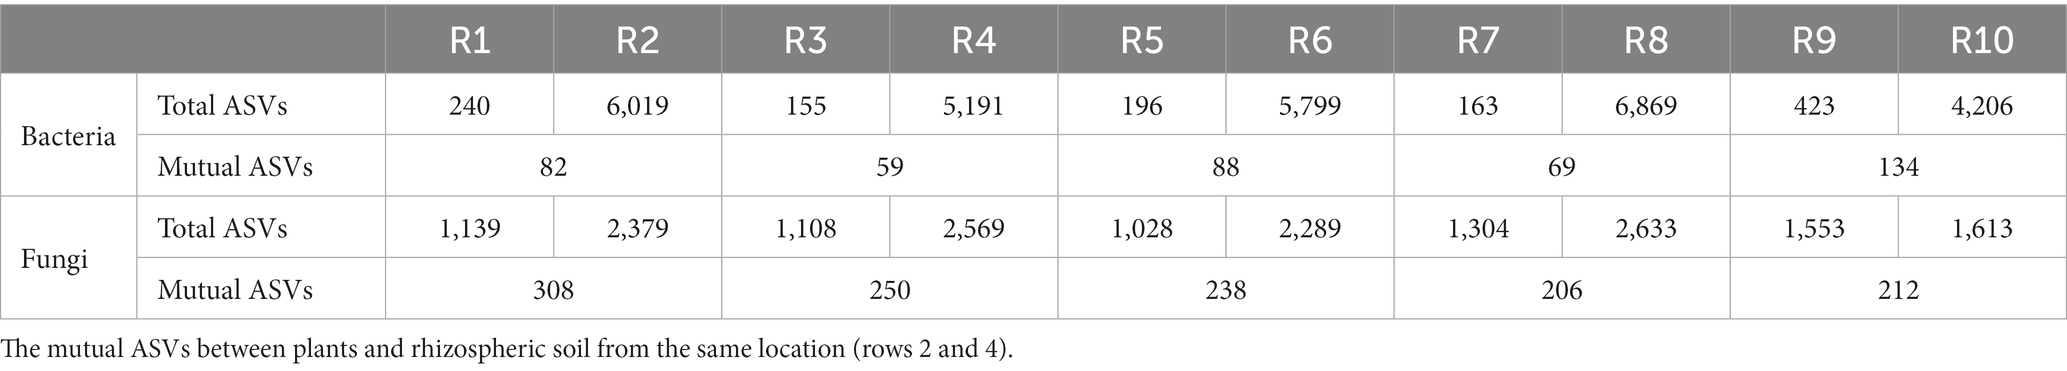
Table 2. Total bacterial and fungal ASV clustering counts for plants and rhizospheric soil samples from five locations (rows 1 and 3).
3.2 Analysis of microbial alpha diversity
The rarefaction curves tended to flatten out, suggesting that the sample sizes are sufficient, and the sequencing depth has covered the majority of diversity present. To understand the compositional changes in microbial communities within samples from the same geographical region, alpha diversity indices, including Chao1, Observed_OTUs, Shannon, and Simpson, were analyzed for both endophytic bacteria and rhizospheric soil microbial communities (Figure 2).
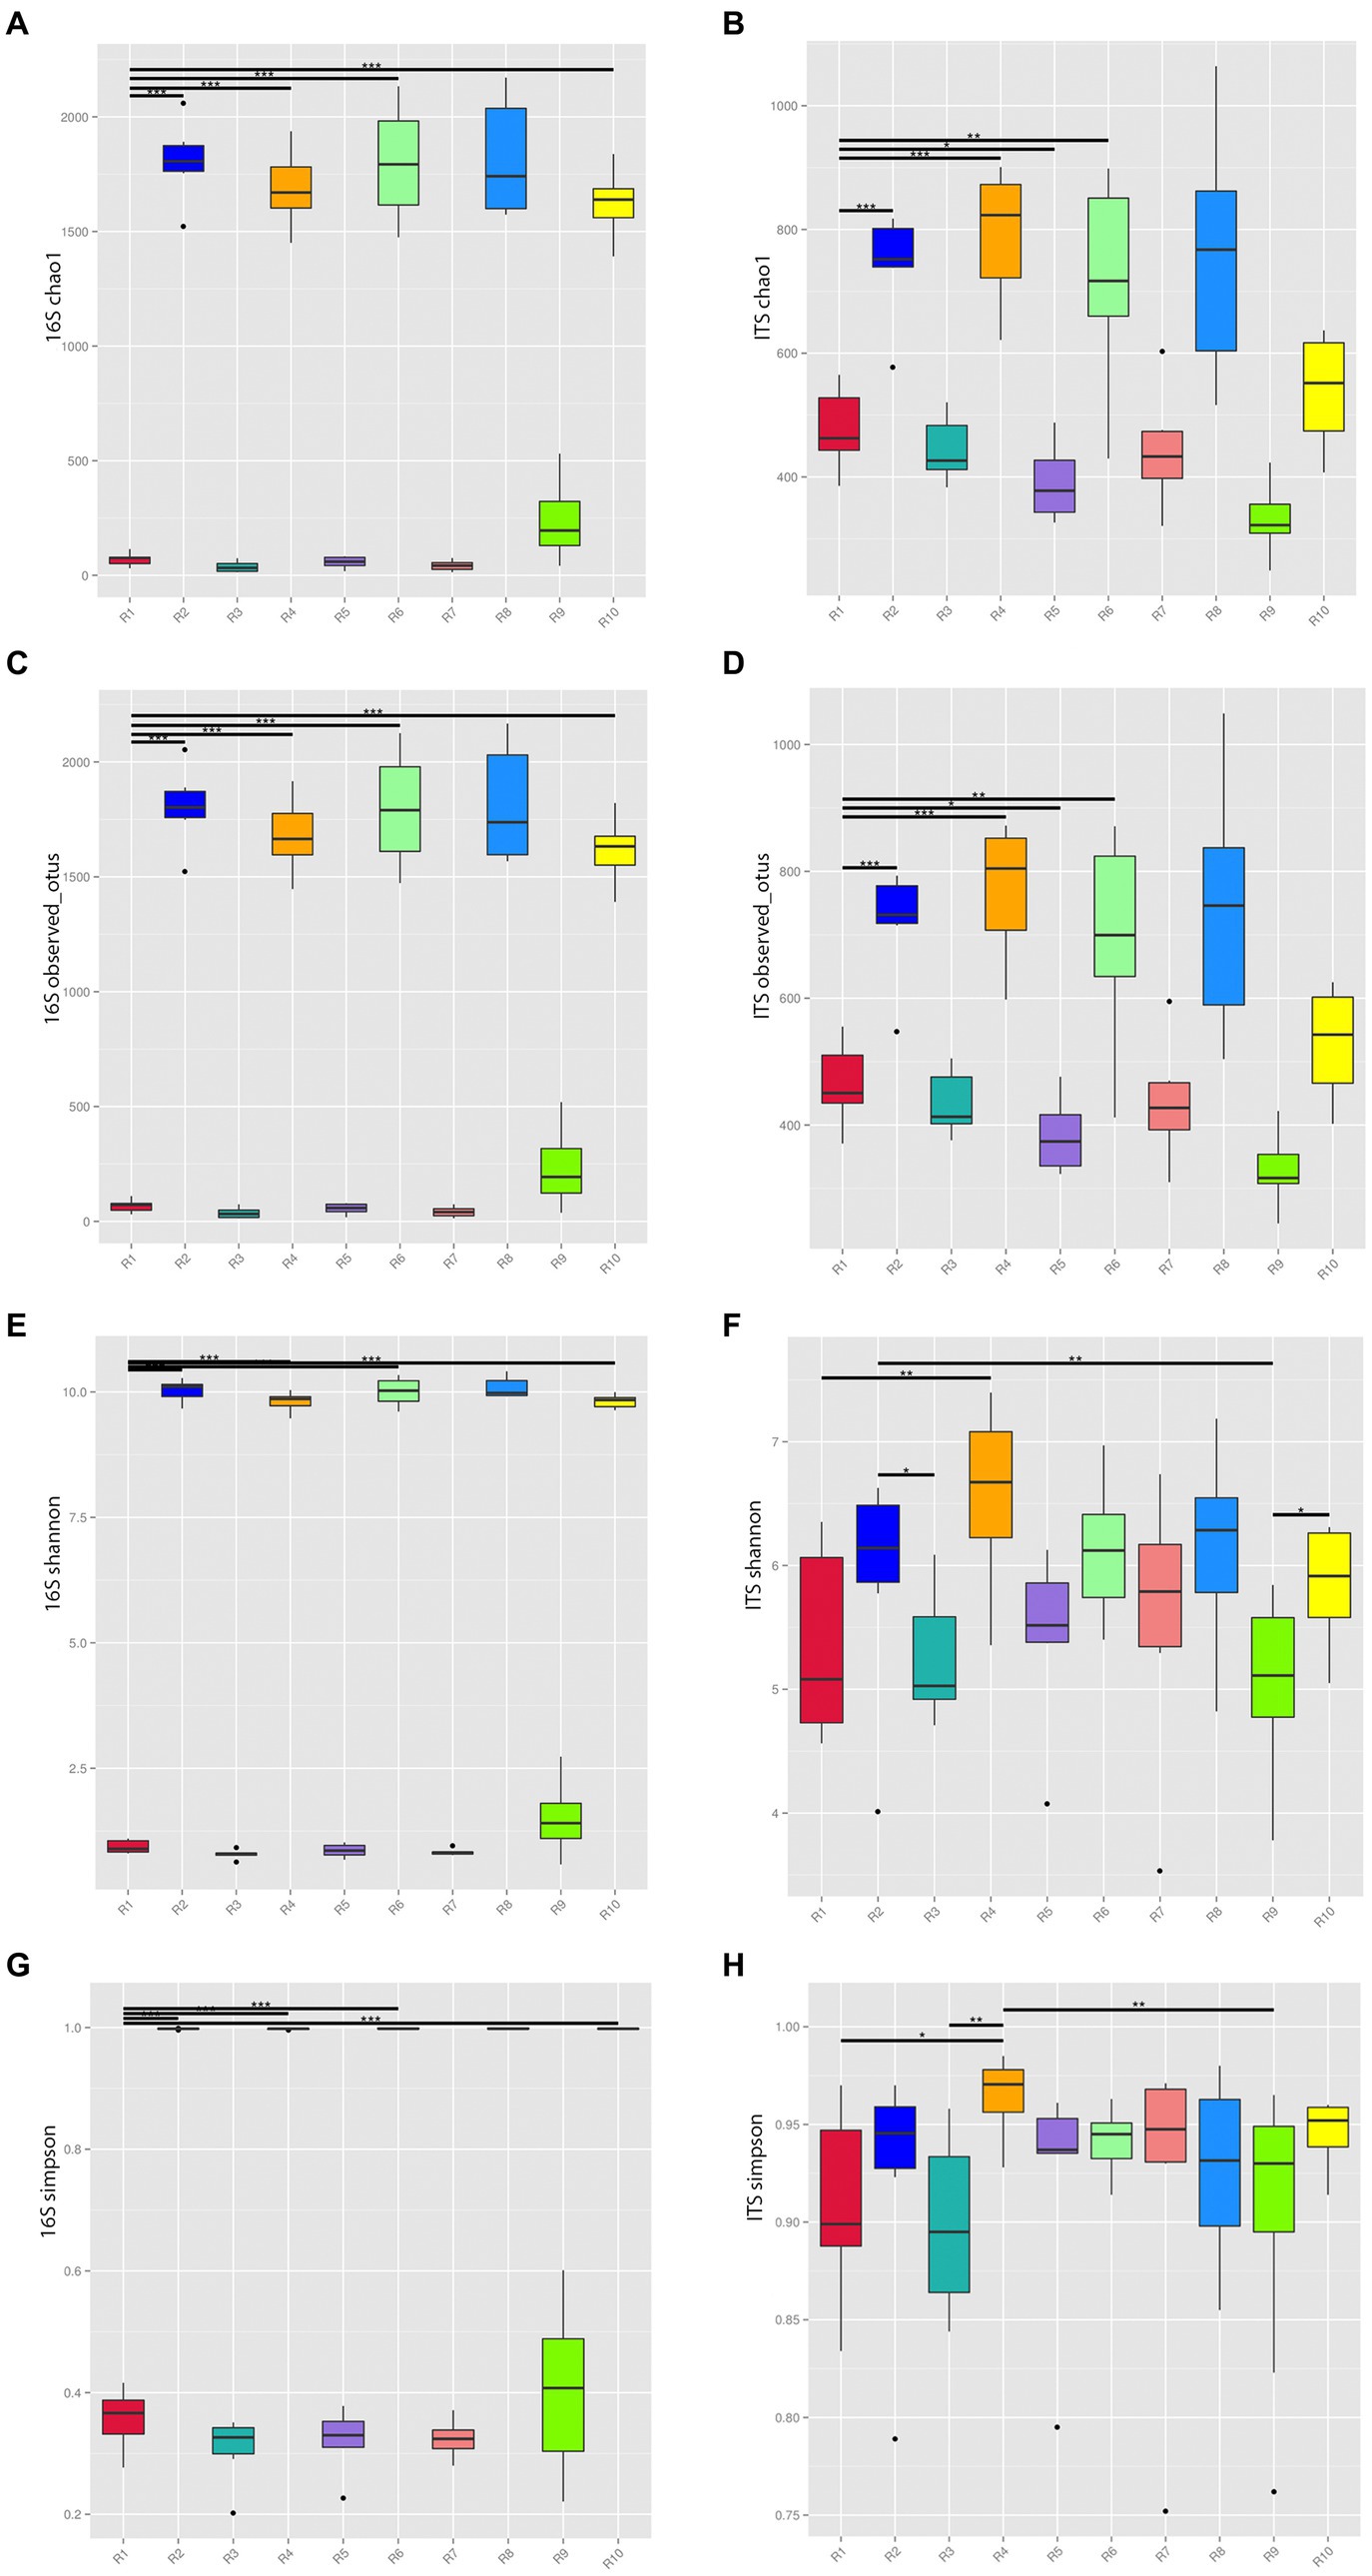
Figure 2. Alpha diversity indices of microbial communities from plants and rhizospheric soil from five locations in China. (A) Chao 1 of bacterial communities. (B) Chao 1 of fungal communities. (C) 16S of Observed OTUs of bacterial communities. (D) Observed OTUs of fungal communities. (E) Shannon index of bacterial communities. (F) Shannon index of fungal communities. (G) Simpson index of bacterial communities. (H) Simpson index of fungal communities. *p ≤ 0.05, **p ≤ 0.01, ***p ≤ 0.001. R1, R3, R5, R7, R9 represent plant samples. R2, R4, R6, R8, R10 represent soil samples.
The Chao1 and Observed_OTUs indices of soil communities in the same region were significantly higher than the corresponding indices of plant communities reflecting the greater richness of the former. The Shannon index for bacteria and fungi in soil communities from the same region were significantly higher than their corresponding plant communities. The Simpson index of soil communities was higher than that of plants with the exception of the Anshun fungal samples (R7, R8), where the reverse was true confirming the greater microbial diversity of soil microbial communities.
The richness and diversity of microbial species varied among different sampling locations. Considering the bacterial communities of plants, the R9 sample has the highest Chao1, Observed_OTUs, Shannon, and Simpson indices, while within rhizospheric soil communities, R8 has the highest indices. For the corresponding fungal communities of plants, R1 and R7 had relatively high indices, while for soil, R4 has the highest indices.
3.3 Analysis of microbial beta diversity
PCoA analysis based on weighted Unifrac distances was conducted to assess the similarity of microbial community composition among samples. As shown in Figure 3, for bacteria, the contributions of the first two principal components, PC1 and PC2, are 93.82 and 1.15% of the total variance, respectively. For fungi, the contributions of PC1 and PC2 are 36.31 and 7.7%, respectively. The samples from plant and soil communities cluster separately, with no distinct clustering among samples within each group. This indicates significant differences in microbial community composition between plant and soil samples. ANOSIM analysis results (Table 3) suggest that the differences in bacterial and fungal community diversity within plant samples are not significant, whereas the differences within soil samples are highly significant (p ≤ 0.01).
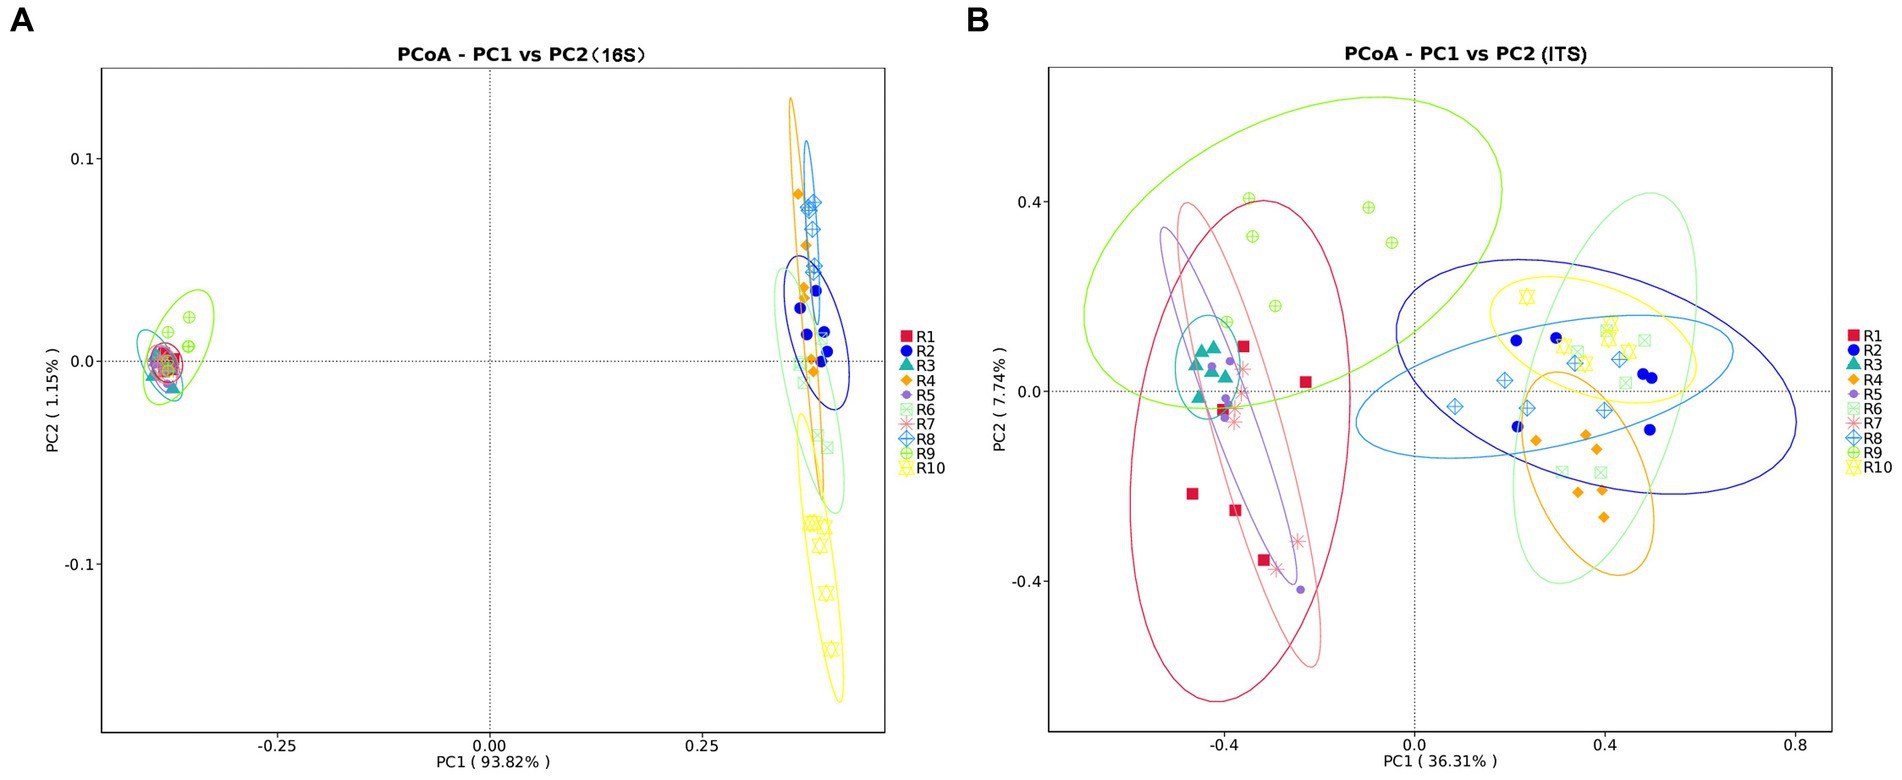
Figure 3. Principal coordinates analysis (PCoA) plots of microbial communities of plants and rhizospheric soil samples from five regions, using unweighted UniFrac. (A) PCoA plot of bacterial communities. (B) PCoA plot of fungal communities. Significance level: *p ≤ 0.05, **p ≤ 0.01. R1, R3, R5, R7, R9 represent plant samples. R2, R4, R6, R8, R10 represent soil samples.
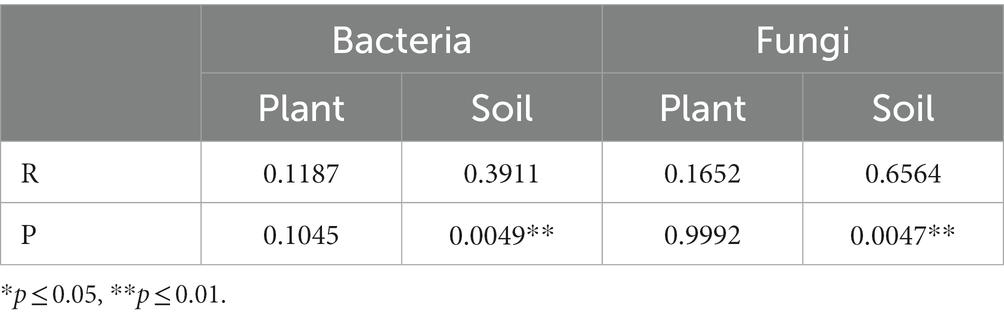
Table 3. ANOSIM analysis of bacterial and fungal communities from plant and rhizospheric soil samples.
3.4 Analysis of microbial community composition
3.4.1 Analysis of bacterial community composition
Clustering analysis was performed at different taxonomic levels based on a 97% similarity threshold. Overall, the endophytic bacteria in Berchemia polyphylla var. leioclada belong to 25 phyla, 35 classes, 56 orders, 77 families and 90 genera. On the other hand, soil bacteria belong to 46 phyla, 92 classes, 210 orders, 343 families and 542 genera. The dominant bacterial phyla were Cyanobacteria (73.79 to 81.21%) and Proteobacteria (18.19 to 22.34%) (Figure 4A), while the dominant genera include Methylobacterium-Methylorubrum (1.57 to 38.89%), Escherichia-Shigella (4.21 to 6.48%) and Sphingomonas (4.28 to 12.18%) (Figure 4B) were the dominant genera.
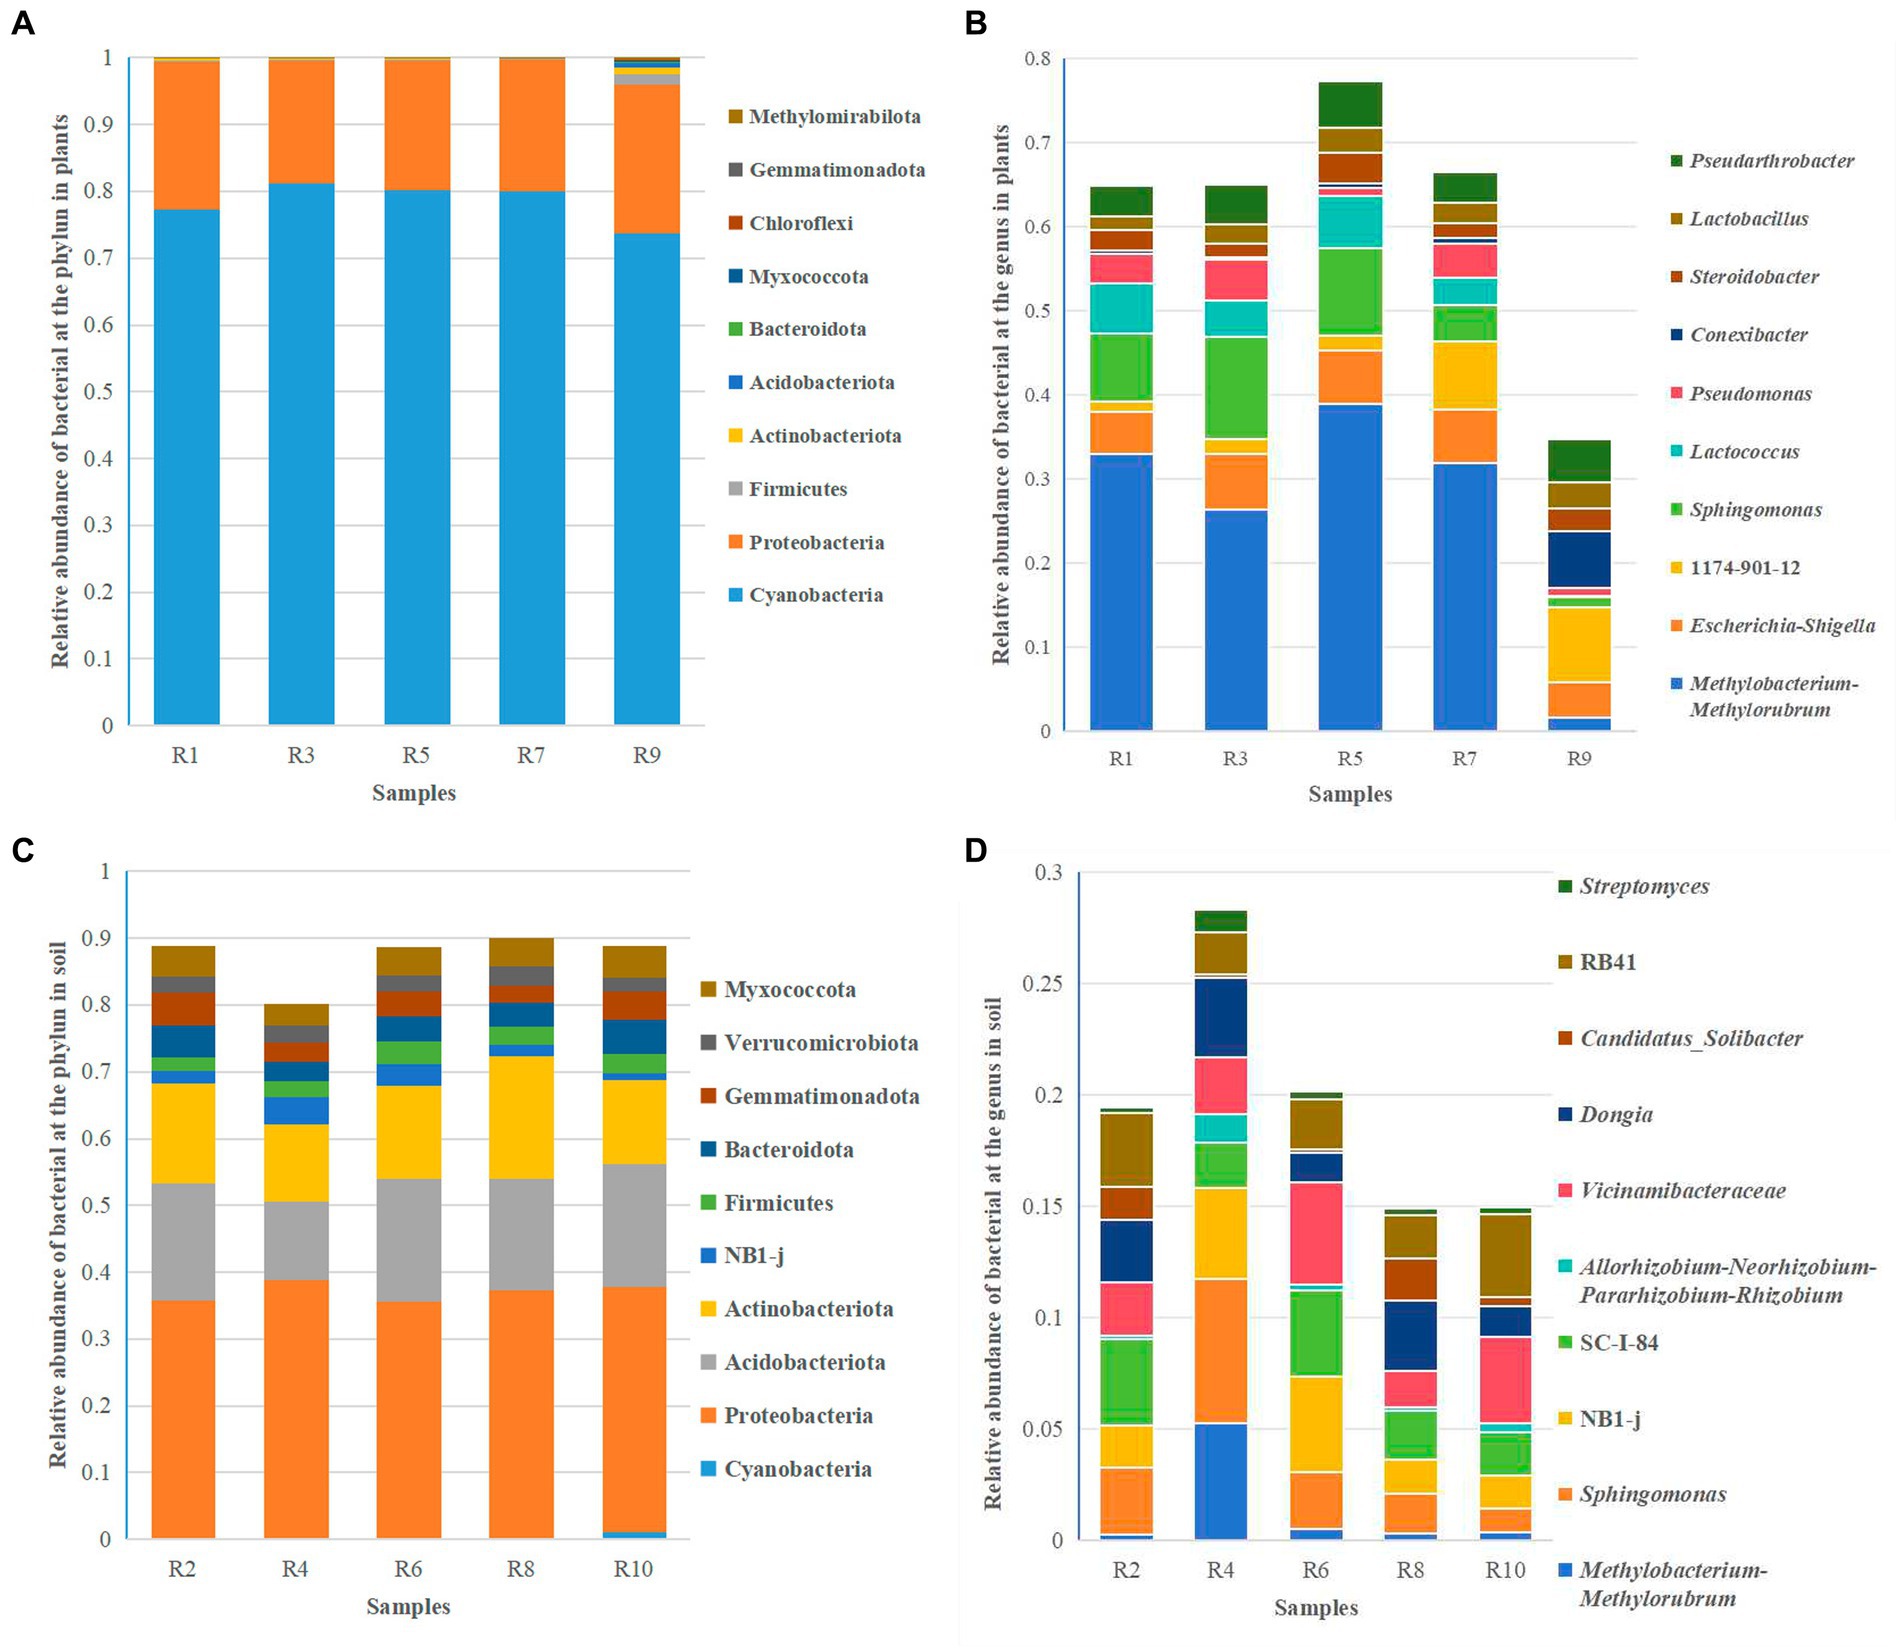
Figure 4. Relative abundance of the top 10 bacterial species at the phylum and genus levels. (A) Relative abundance of bacterial at the phylum level in plants. (B) Relative abundance of bacterial at the genus level in plants. (C) Relative abundance of bacterial at the phylum level in soil. (D) Relative abundance of bacterial at the genus level in soil.
In soil, the dominant bacterial phyla were Proteobacteria (35.51 to 41.20%), Acidobacteriota (13.80 to 18.36%), and Actinobacteriota (12.58 to 18.31%) (Figure 4C). The dominant genera include Sphingomonas (1.04 to 6.52%), Dongia (1.33 to 4.61%) and SC-I-84 (1.93 to 3.89%) (Figure 4D). This analysis provides insights into the taxonomic composition of endophytic and soil bacteria in Berchemia polyphylla var. leioclada, highlighting differences in dominant phyla and genera between the two environments.
3.4.2 Analysis of fungal community composition
Based on ITS sequencing, the fungal communities in Berchemia polyphylla var. Leioclada belong to 11 phyla, 27 classes, 75 orders, 152 families and 269 genera. Soil fungi, had an overall higher diversity across all taxa representing 16 phyla, 35 classes, 83 orders, 183 families and 357 genera. At the phylum level, Ascomycota (77.89 to 89.47% in Berchemia, 37.25 to 50.04% in soil), Basidiomycota (3.26 to 6.48% in Berchemia, 14.88 to 31.82% in soil), and Mortierellomycota (0.35 to 0.77% in Berchemia, 7.45 to 19.16% in soil) were the dominant phyla shared between plant and soil samples (Figures 5A,C). At the genus level, different sampling locations exhibited varying dominant genera in Berchemia polyphylla var. leioclada. For example, Uwebraunia (8.69%), Dissoconium (13.81%), and Neoceratosperma (9.84%) were the dominant genera in R1, while Cladosporium (8.70%) and Septoria (8.88%) were dominant in R3 (Figure 5B).
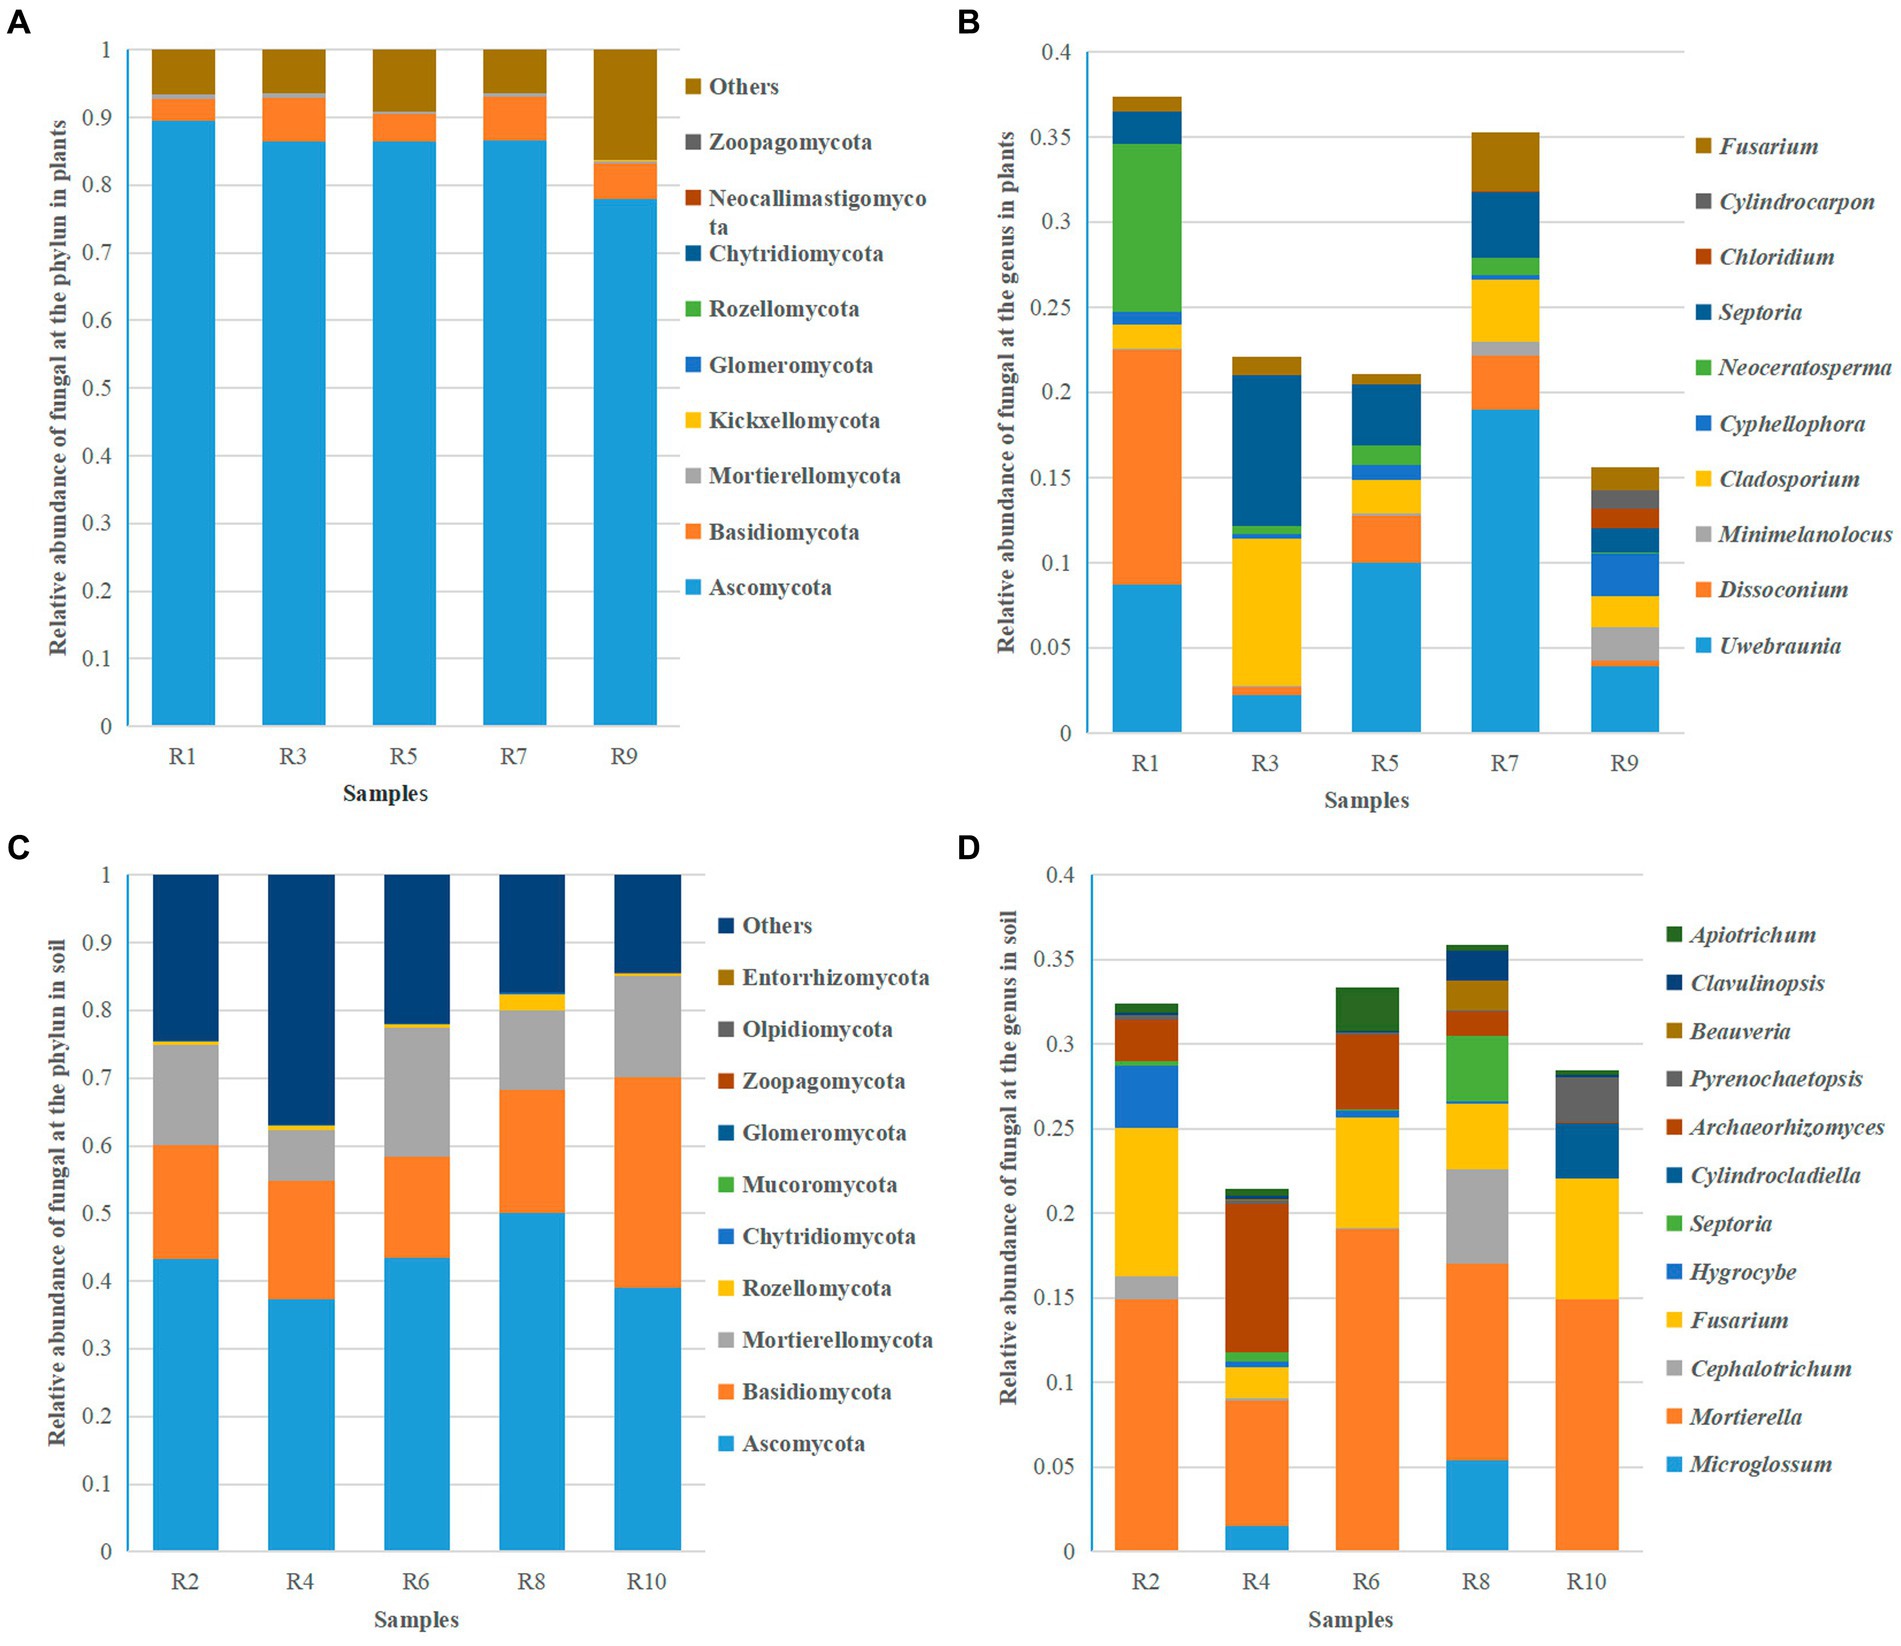
Figure 5. Relative abundance of the top 10 fungal species at the phylum and genus levels. (A) Relative abundance of fungi at the phylum level in plants. (B) Relative abundance of fungi at the genus level in plants. (C) Relative abundance of fungi at the phylum level in soil. (D) Relative abundance of fungi at the genus level in soil.
Mortierella (7.43 to 19.11%) was the dominant genus in all soil samples. Besides Mortierella, each group of samples has different dominant genera. For instance, Fusarium (8.90%) and Hygrocybe (3.63%) were dominant in R2, Archaeorhizomyces (8.79%) and Fusarium (1.80%) in R4, Fusarium (6.56%) and Archaeorhizomyces (4.42%) in R6, Microglossum (5.41%), Cephalotrichum (5.58%), Fusarium (3.87%), and Septoria (3.84%) in R8, and Fusarium (7.18%), Cylindrocladiella (3.26%), and Pyrenochaetopsis (2.46%) in R10 (Figure 5D). This detailed analysis provides insights into the taxonomic composition of fungal communities in Berchemia polyphylla var. leioclada and the associated soil, highlighting differences in dominant phyla and genera between the two environments.
3.5 Differential analysis of microbial community composition
3.5.1 Differential analysis of bacterial community composition
LEfSe analysis was conducted separately for the plant, soil, and total samples (plant and soil together). Using the LDA threshold greater than 2.6 (p ≤ 0.05), 60 bacterial indicator taxa were detected in the plant microbial communities. These taxa belonged to 7 Classes, 9 orders, 16 families, and 20 genera. Among them, sample R1 had the highest number of differential species, with dominant genera including Nocardioides, Klenkia and Aureimonas (Figure 6A). In the soil, 55 differential bacterial groups were detected (LDA ≥ 3, p ≤ 0.05), which were classified into 7 Classes, 12 orders, 19 families, and 17 genera. Dominant genera or families included Rokubacteriales, Pseudomonas and Microlunatus (Figure 6B). In both the plant and soil samples, 102 differential groups were detected (LDA ≥ 4, p ≤ 0.05), classified into 14 Classes, 25 orders, 34 families, and 29 genera. With dominant genera including Conexibacter, Methylobacterium-Methylorubrum, Sphingomonas and Lactococcu (Figure 6C).
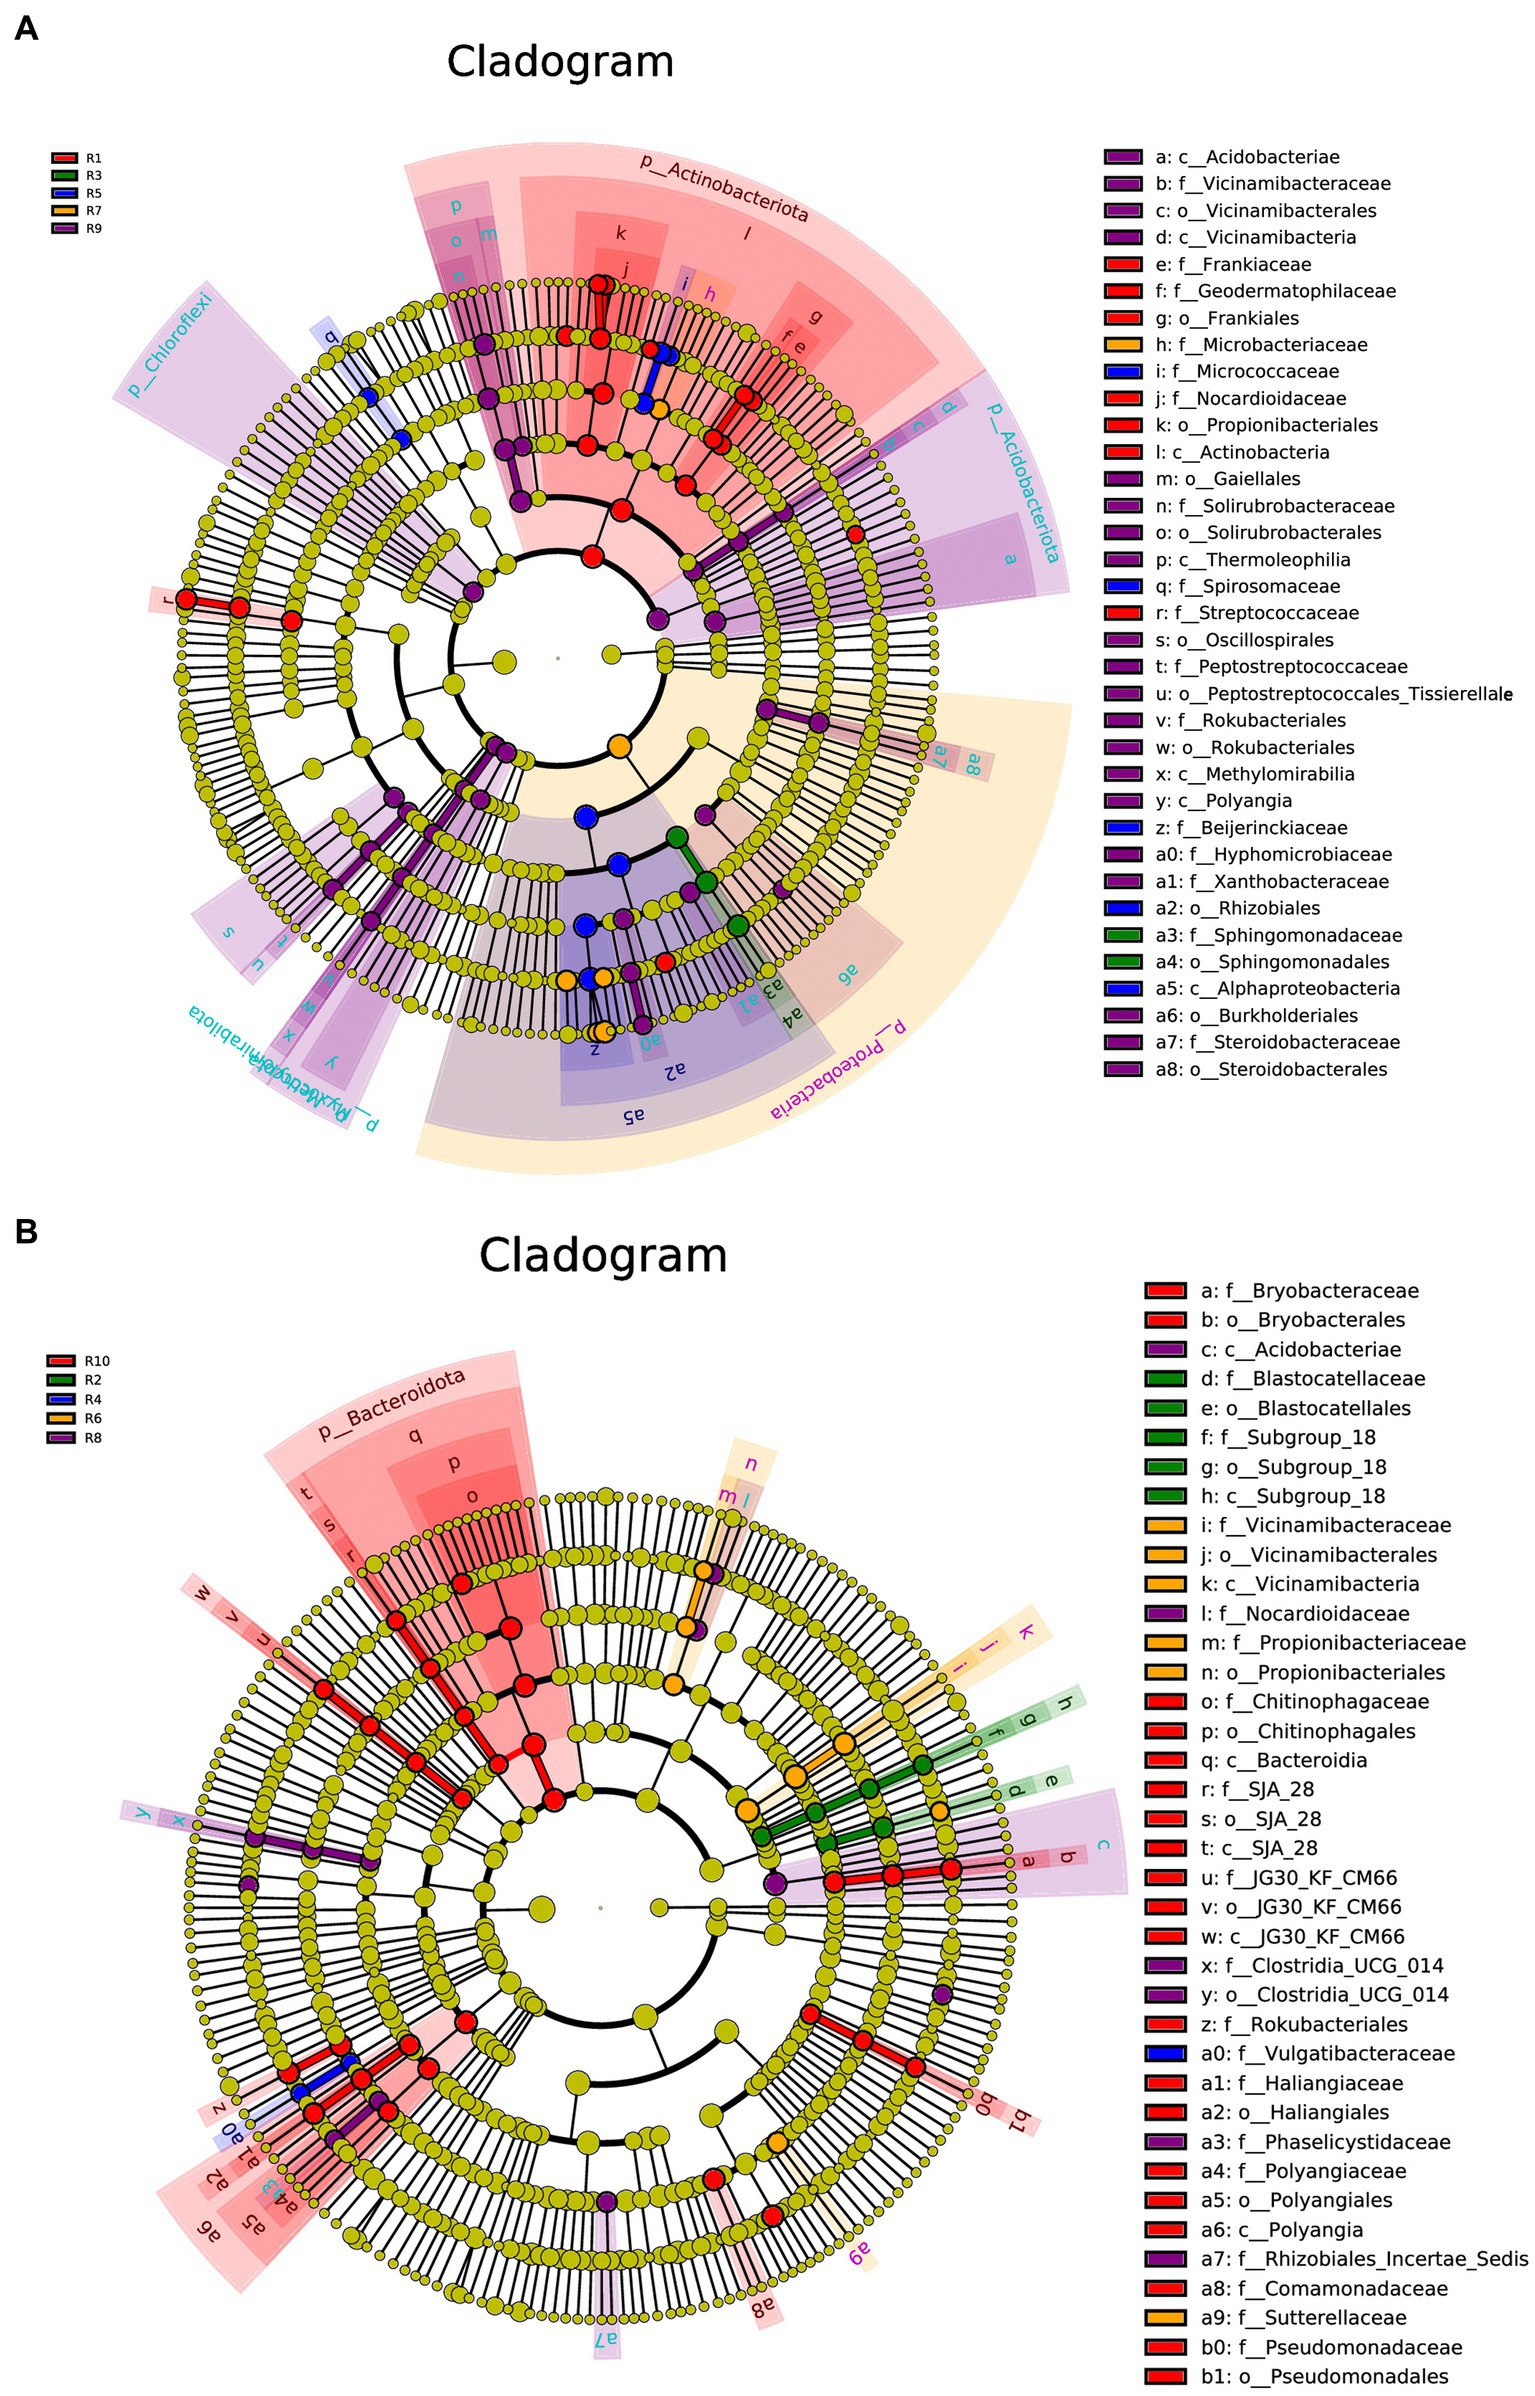
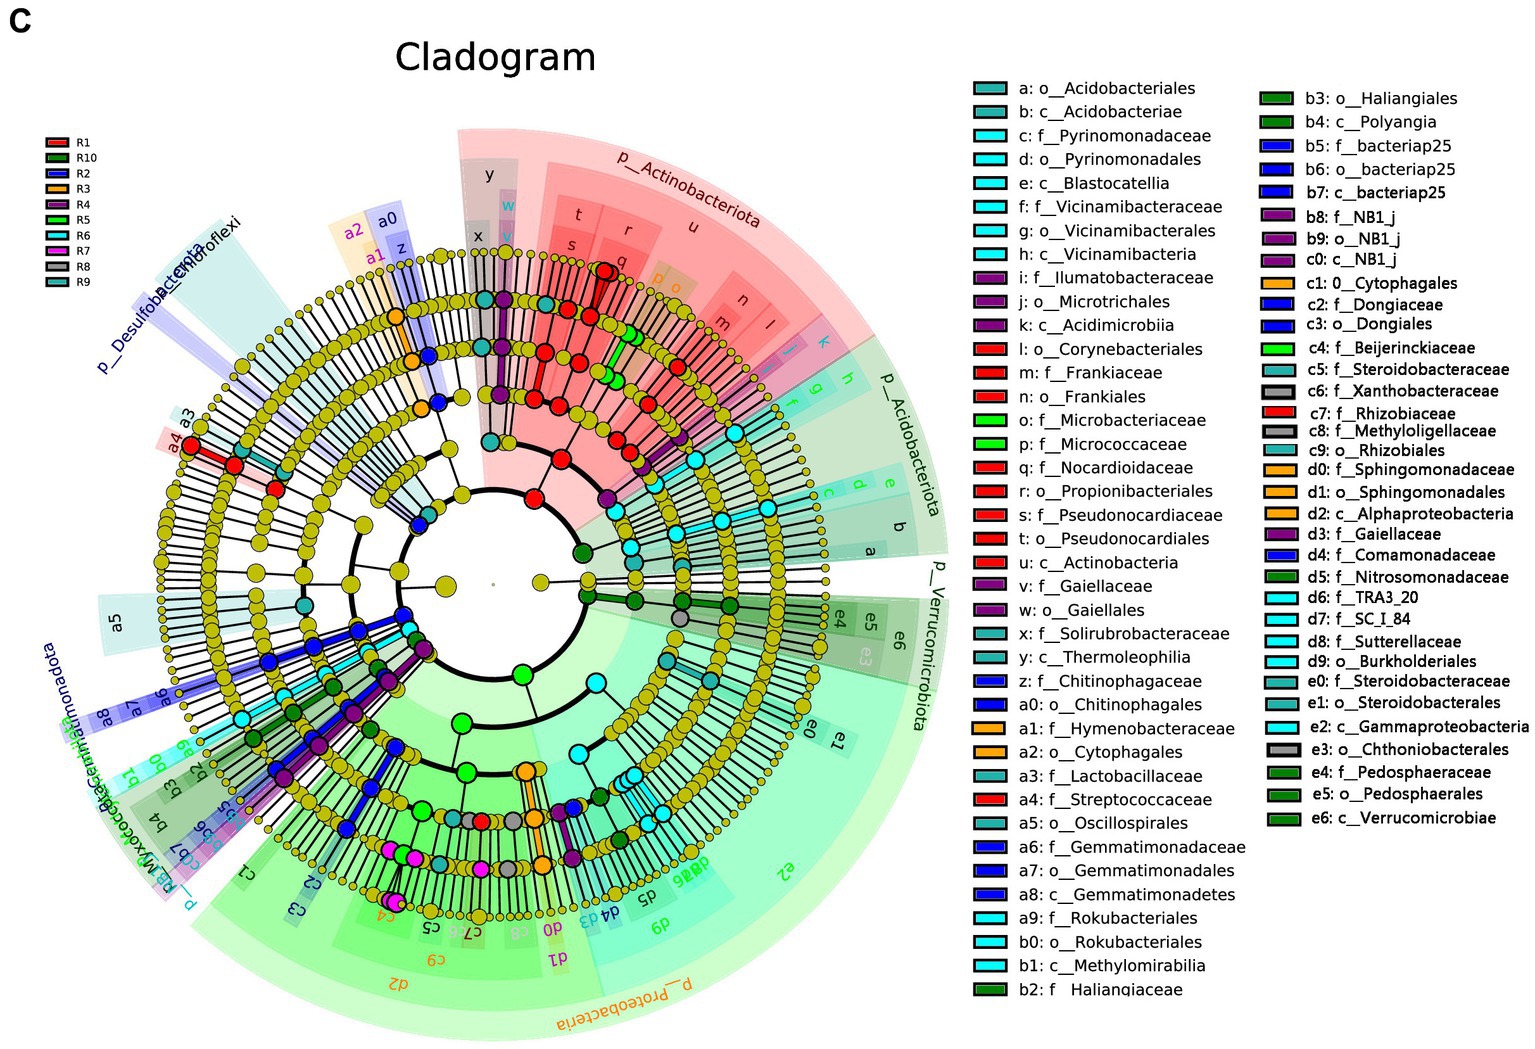
Figure 6. LEfSe cladograms display significantly abundant taxa in plants (A), soil (B), and total samples (C). Taxa from various sites are depicted as colored dots. These taxonomic cladograms include only taxa that meet an LDA significance threshold of 3 for bacterial communities. The cladogram comprises seven rings, representing the domain, phylum, class, order, family, and genus, respectively.
3.5.2 Differential analysis of fungal community composition
Under the condition of an LDA threshold greater than 4, a total of 35 fungal differential indicator taxa were detected in the plant samples, belonging to 4 classes, 4 orders, and 7 families (Figure 7A). Some of the dominant genera among these differential indicators include Dissoconium, Neoceratosperma, Septoria, and Devriesia. In the soil samples, 42 differential indicator taxa were identified (Figure 7B), belonging to 2 classes, 5 orders, and 12 families. Some of the dominant genera in the soil samples include Microglossum, Archaeorhizomyces, Fusarium, and Cephalotrichum. When comparing both plant and soil samples, a total of 54 fungal indicator taxa were detected (Figure 7C), spanning 4 classes, 4 orders, and 27 families. These indicators showed distinct differences at the genus level between plant and soil samples (LDA ≥ 4, p ≤ 0.05). In plant samples, some of the indicator genera include Devriesia, Dissoconium, Neoceratosperma, and Golubevia, while in soil samples, dominant group include Hygrocybe, Archaeorhizomyces, Apiotrichum, Cylindrocarpon, and Mortierella, among others.
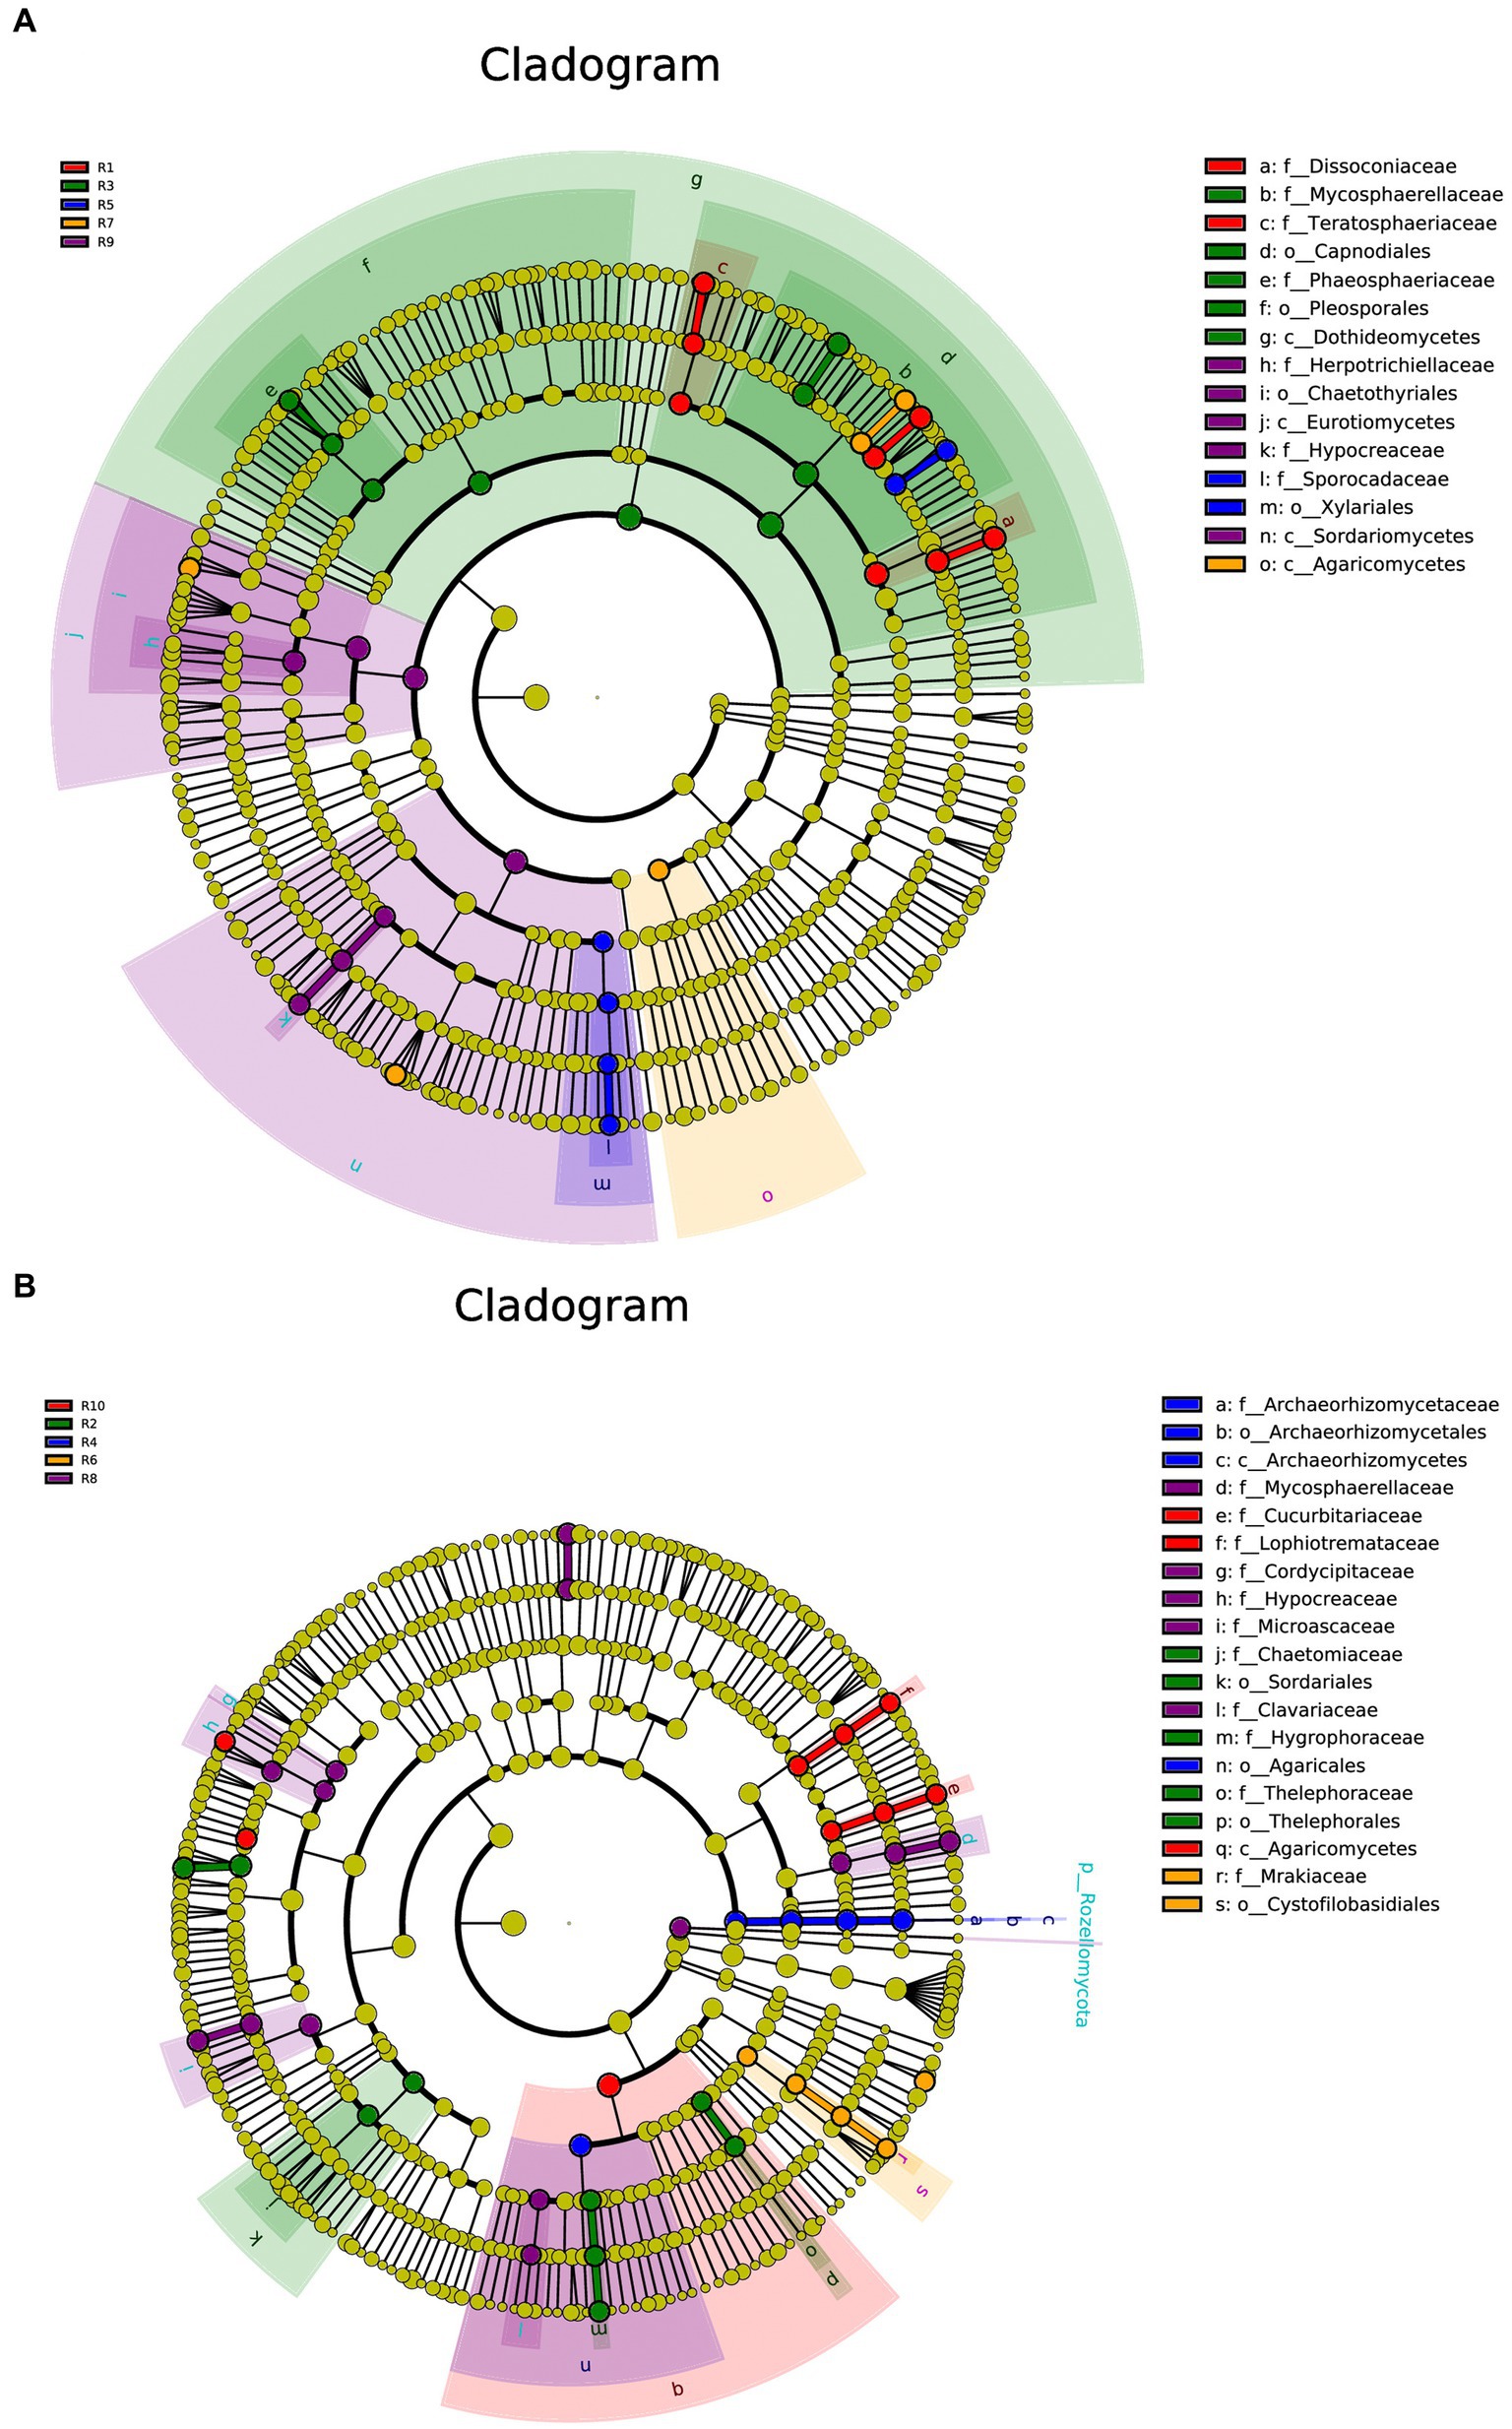
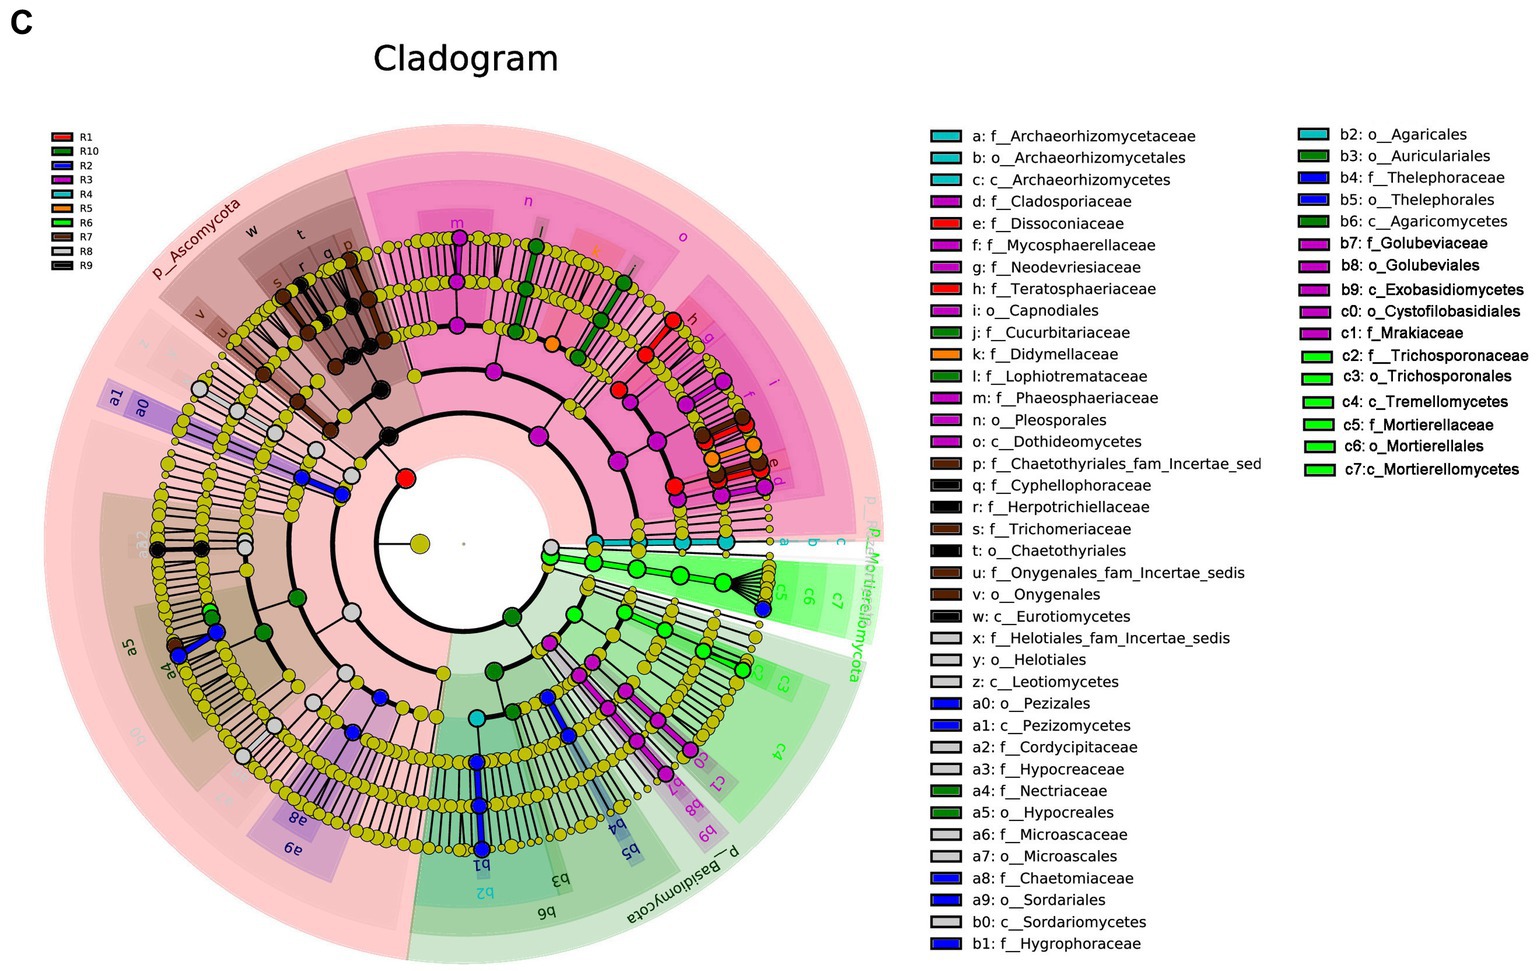
Figure 7. LEfSe cladograms display significantly abundant taxa in plants (A), soil (B), and total samples (C). Taxa from various sites are depicted as colored dots. These taxonomic cladograms include only taxa that meet an LDA significance threshold of 3 for fungal communities. The cladogram comprises seven rings, representing the domain, phylum, class, order, family, and genus, respectively.
3.6 Microbial co-occurrence network analysis
3.6.1 Bacterial co-occurrence network analysis
To compare the differences in co-occurrence patterns between Berchemia polyphylla var. Leioclada plants and soil microbial communities, the R9 plant samples, which had relatively high bacterial community diversity, and the corresponding R10 soil samples were selected. Statistical analysis of network properties is presented in Table 4. Both networks exhibited significant modularity with modularity coefficients exceeding 0.4. R9 had higher clustering coefficients, network density, and average connectivity than R10. A shorter average path length in the network indicates higher level of connections among units. The number of edges and network density in the network graph reflects its complexity and connectivity. Comparison of the two networks revealed that the soil network had higher complexity and natural connectivity compared to the plant network.
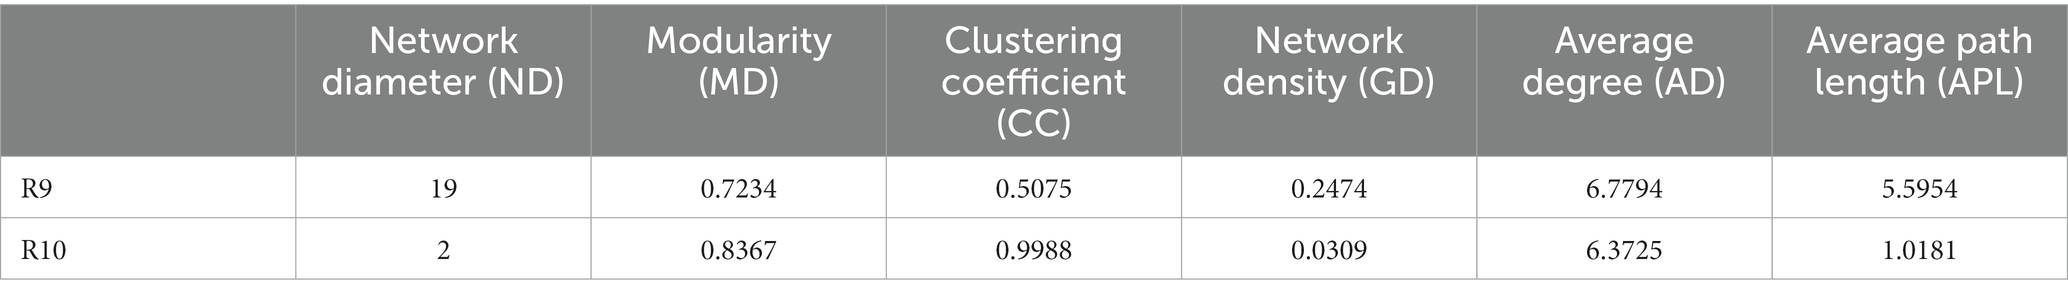
Table 4. Network property statistics for bacterial networks in plant (R9) and soil (R10).
The nodes with the highest betweenness centrality are considered key taxa. Larger nodes in the network graph correspond to higher betweenness centrality values. Based on betweenness centrality scores, key genera identified in the plant network were Corynebacterium, Limnobacter and Pseudomonas (Figure 8A). In the soil network, key genera included Vicinamibacteraceae, RB41, and Rokubacteriales (Figure 8B).
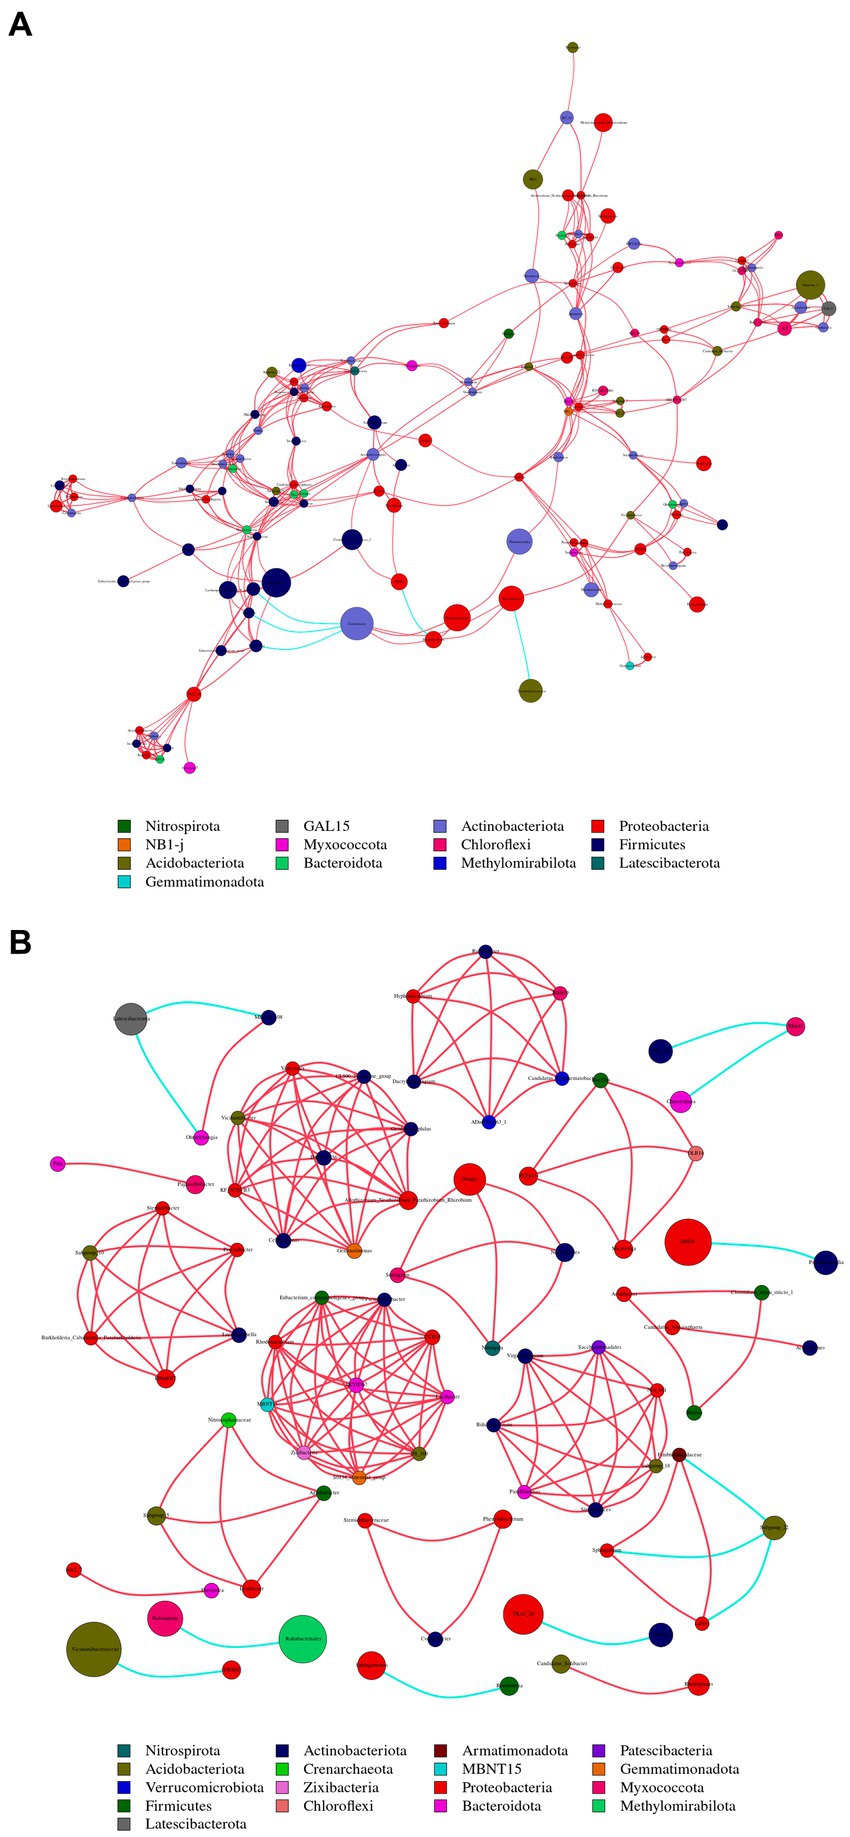
Figure 8. Illustrates the co-occurrence networks at the genus (taxonomic level) within plant (A) and soil (B) samples. The size and color of the nodes, as well as the color of the edges, provide insights into the relationships and interactions between different microbial taxa within the samples. Node color represents different phyla. Node size is proportional to their average relative abundance; edges (lines) in red and green denote positive and negative correlations.
There were 13 shared phyla between plant and soil samples, including Proteobacteria, Acidobacteriota, and Actinobacteriota. Additionally, 65 shared genera, such as Sphingomonas, Conexibacter and Vicinamibacteraceae, were identified. The Sphingomonas had relatively high abundances and was considered core groups present in all plant and soil samples. These findings suggest that interactions between soil bacterial communities are more active, and dominant genera in both plant and soil communities are associated with each other.
3.6.2 Fungal co-occurrence network analysis
To compare the co-occurrence patterns of highly diverse Berchemia polyphylla var. leioclada plant fungal communities, this study selected the R7 plant samples and their corresponding R8 soil samples to construct co-occurrence networks. The statistical analysis of network properties is presented in Table 5. R8 had a smaller clustering coefficient and average path length compared to R7, while its modularity coefficient, network density, and average connectivity were higher than those of R7. This indicates that the soil network had a higher degree of modularity, complexity, and natural connectivity compared to the plant network, suggesting that interactions among soil microbial communities may be stronger than those in the plant communities.
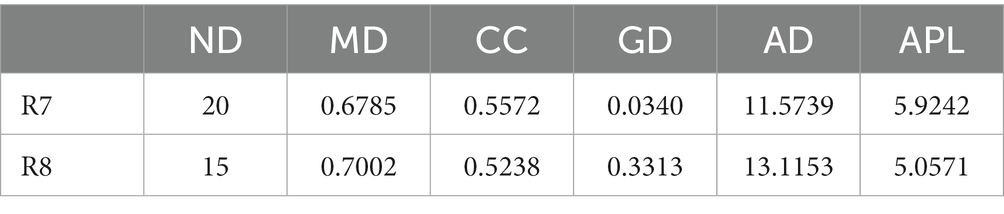
Table 5. Network property statistics for plant (R7) and soil fungal (R8) networks.
Key genera identified in the plant network included Trichoderma, Septoria, Uwebraunia, Dissoconium, and Cladosporium (Figure 9A). In the soil network, key genera included Mortierella, Cephalotrichum, Microglossum, Septoria, and Fusarium (Figure 9B). When considering all shared microorganisms in plant and soil samples, key genera were found to include Ascomycota, Basidiomycota, and Mortierellomycota. There was a total of 59 key genera, among which Fusarium, Septoria, Mortierella, Cladosporium, Strelitziana, Phaeosphaeria, Devriesia, Trichoderma, and Cyphellophora, which had relatively high abundances, could be identified as core groups. These results suggest that interactions among soil bacterial communities are tightly interconnected, and both plant and soil communities have dominant and closely interacting microbial groups.
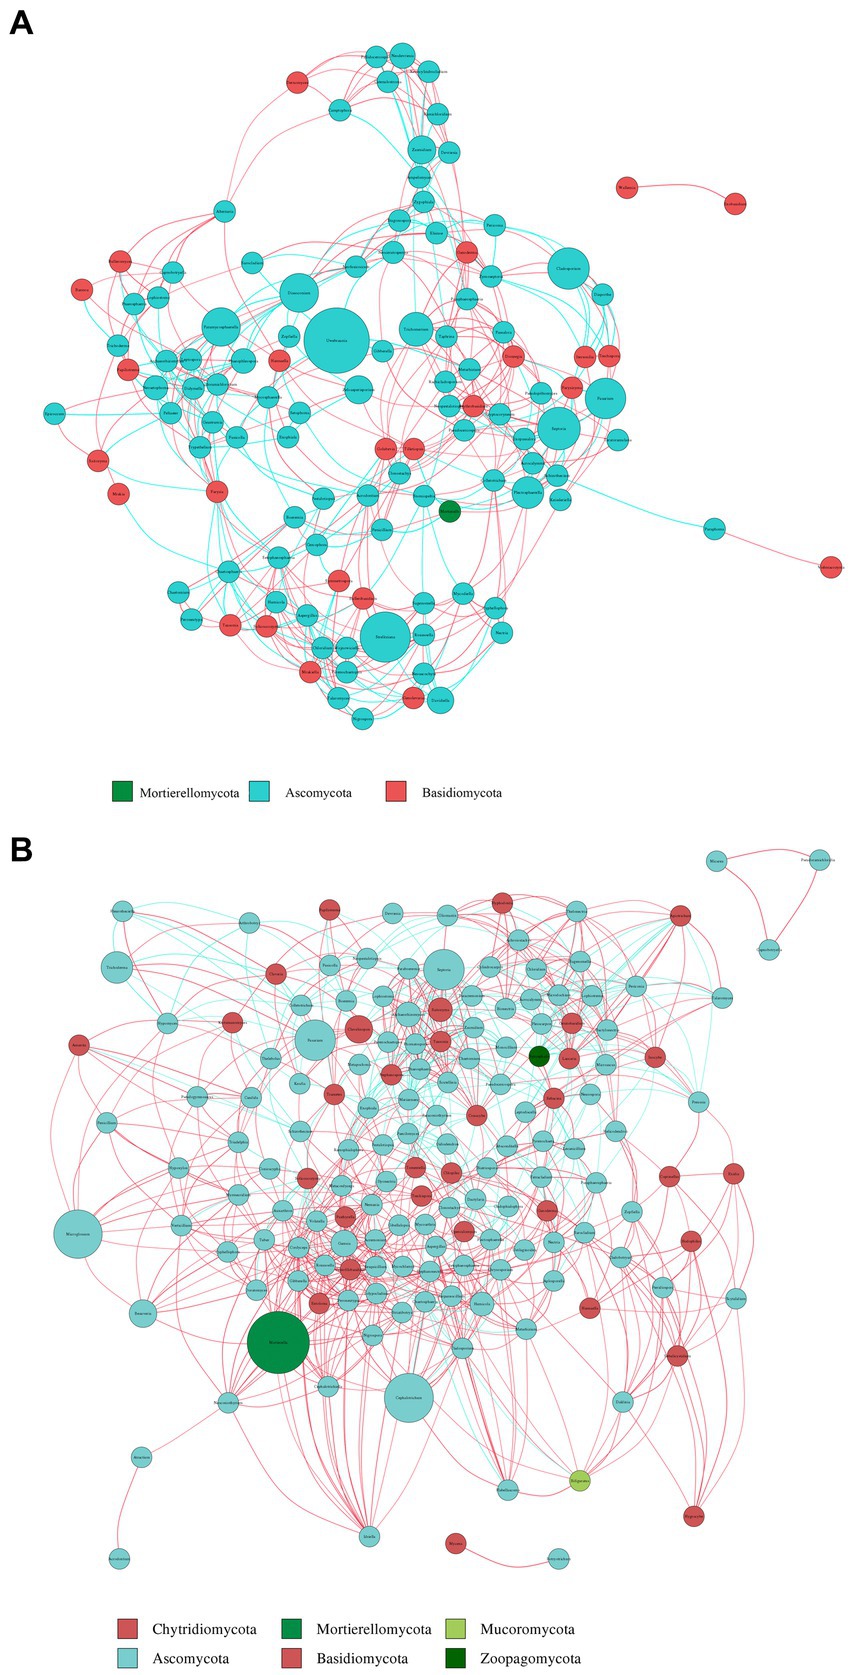
Figure 9. Co-occurrence network analysis of fungi in plants (A) and soil (B) at the genus level. The size and color of the nodes, as well as the color of the edges, provide insights into the relationships and interactions between different microbial taxa within the samples. Node color represents different phyla. Node size is proportional to their average relative abundance; edges (lines) in red and green denote positive and negative correlations.
3.7 Microbial gene function prediction
3.7.1 Bacterial gene function prediction
Based on the KEGG pathway second–level functional predictions, bar graphs were created to illustrate the abundance of the top 10 microbial gene functions. The results revealed 10 main metabolic pathways, with PWY–3781 (Aerobic respiration I – cytochrome c) (2.23% ~ 2.41%), PWY0–1586 (Peptidoglycan maturation) (1.28% ~ 1.43%), and PWY–7111 (Pyruvate fermentation to isobutanol—engineered) (1.15% ~ 1.22%) being the major metabolic pathways for plant-associated bacteria (Figure 10A). On the other hand, PWY–3781 (1.74% ~ 1.77%), PWY–7111 (0.96% ~ 1.07%), and PWY–5101 (L–isoleucine biosynthesis II) (1.00% ~ 1.05%) were the primary metabolic pathways for soil bacteria (Figure 10B).
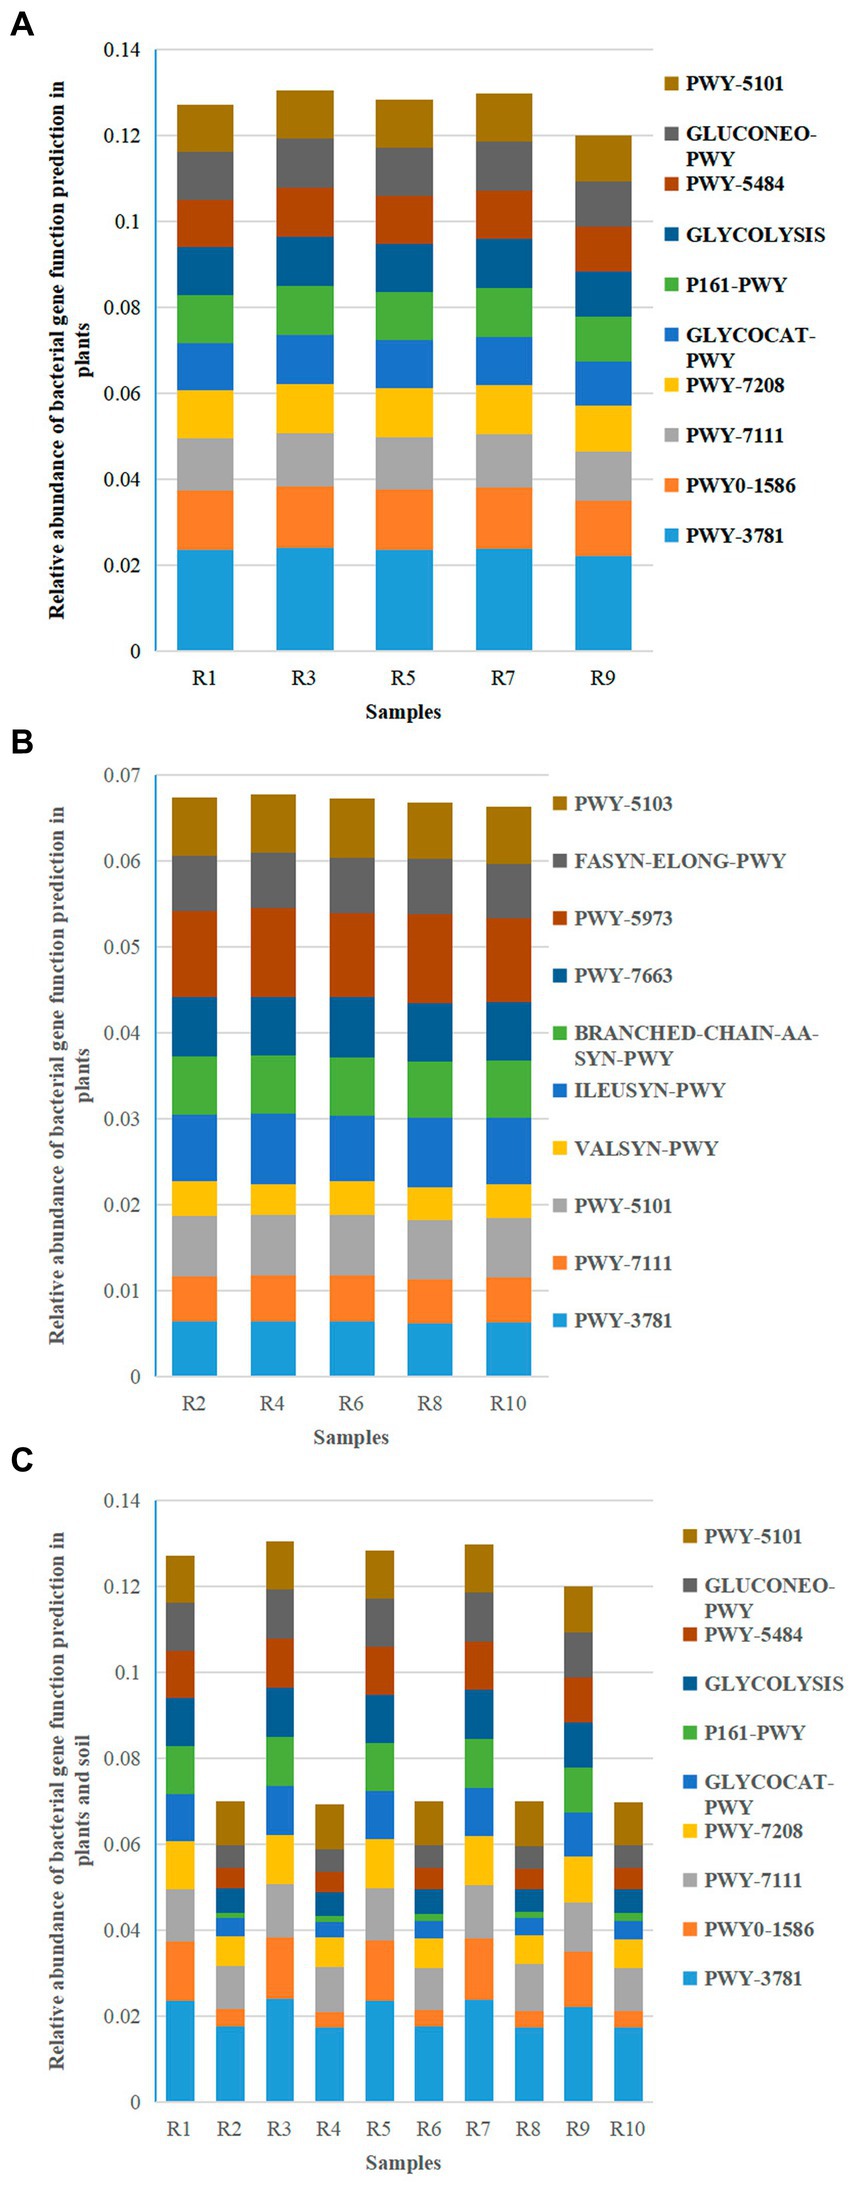
Figure 10. Relative abundance chart of bacterial gene function predictions. (A) Relative abundance of bacterial gene function predictions in plants. (B) Relative abundance of bacterial gene function predictions in soil. (C) Relative abundance of bacterial gene function predictions in all samples.
The shared metabolic pathways between plants and soil included PWY–3781 (1.74% ~ 2.41%), PWY0–1586 (0.36% ~ 1.43%), PWY–7111 (0.96% ~ 1.22%), and PWY–7208 (Superpathway of pyrimidine nucleobases salvage) (0.67% ~ 1.15%) (Figure 10C). While the metabolic pathways in the plant group were the same as the shared pathways, the soil group had three metabolic pathways (PWY–3781, PWY–7111, and PWY–5101) in common with the shared pathways. This suggests that the main metabolic pathways in plants and three specific pathways in soil are involved in plant growth.
3.7.2 Fungal gene function prediction
Functional predictions of fungal taxa in both soil and plants were conducted using FunGuild. The results revealed that the major metabolic types in both plants and soil included Saprotroph, Unassigned, Pathotroph, and Pathotroph–Symbiotroph (Figures 11A,B). Unassigned were omitted from the figures. These shared metabolic types were similar between plants and soil (Figure 11C), although the relative abundances varied. In addition to these shared metabolic types, there was also Saprotroph–Pathotroph–Saprotroph in both soil and shared pathways. The results suggest that while the major shared metabolic types in plants and soil are similar, their distribution and relative abundance differ.
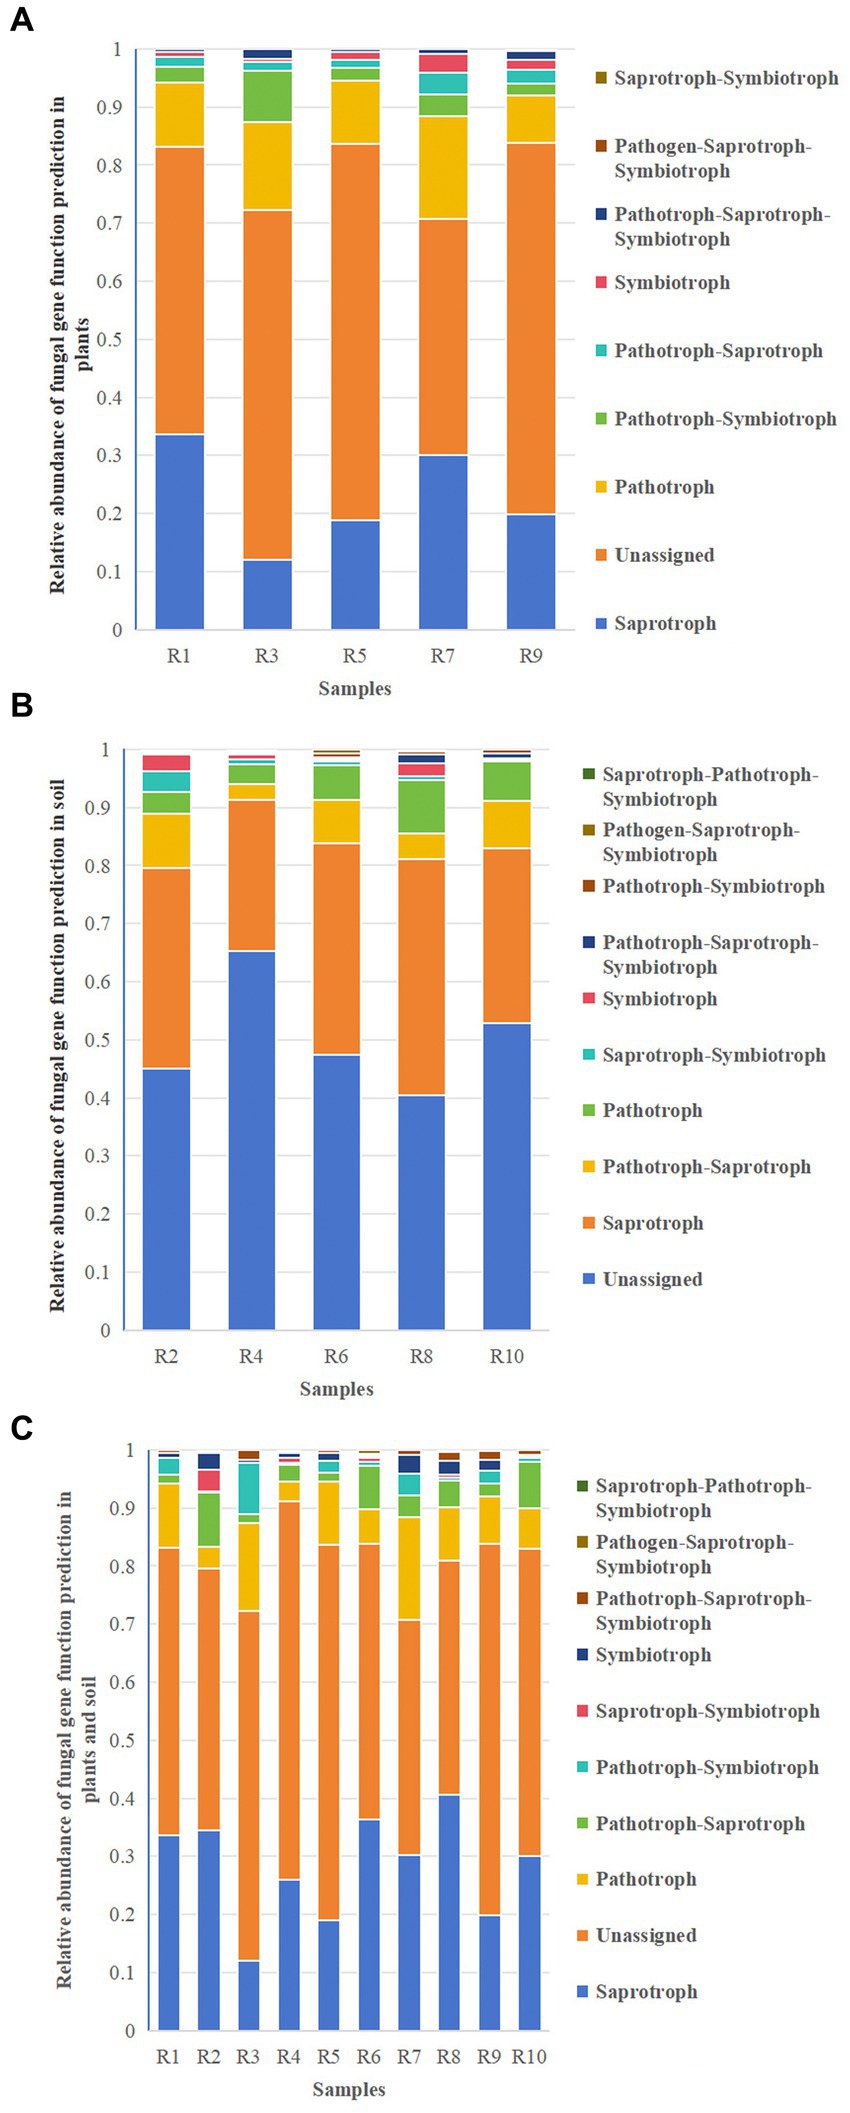
Figure 11. Relative abundance chart of fungal gene function predictions. (A) Relative abundance of fungal gene function predictions in plants. (B) Relative abundance of fungal gene function predictions in soil. (C) Relative abundance of fungal gene function predictions in all samples.
4 Discussion
The comprehensive analysis of microbial diversity in both endophytic and rhizospheric soil environments of Berchemia polyphylla has yielded valuable insights into the complex interactions between this plant species and its associated microorganisms.
This study employed high-throughput sequencing technology to analyze for the first time the diversity of endophytic and rhizosphere soil microbial communities of Berchemia polyphylla var. leioclada, as well as their community structure and composition. The results on community composition showed that the dominant bacterial phyla in the plant were Cyanobacteria, Proteobacteria, and Acidobacteriota, consistent with other studies on plant endophytes, indicating a similarity in endophytic bacteria at higher taxonomic levels (Luo and Yu, 2021). The dominant bacterial phyla in the soil were Proteobacteria, Acidobacteriota, and Actinobacteriota, the same as those in the rhizosphere soil of Root-rot Corydalis tomentella Franch (Liu et al., 2023). At the phylum level of fungal communities, both plant and soil were dominated by Ascomycota, Basidiomycota, and Mortierellomycota, which is consistent with many reports that Ascomycota and Basidiomycota are the dominant groups in a wide variety of plant endophytic and rhizosphere soil fungi (Karthikeyan et al., 2008; Horinouchi, 2009; Egidi et al., 2019).
The study found variations in the microbial community Alpha diversity index at different sampling points, with the highest bacterial diversity in plant sample R9, and the highest fungal diversity in R1 and R7, while the highest bacterial diversity in soil was in R8, and the highest fungal diversity in R4. There were significant differences in microbial community and species composition between plant and soil samples, suggesting that the microbial diversity within Gastrodia elata f. glauca may be influenced by environmental factors such as temperature, humidity, oxygen content, and soil properties in different regions (Zheng et al., 2023). The sampling sites varied in altitude and climate conditions, and the plants showed different growth states, which is consistent with reports that geographical environment and plant physiological status can affect the composition of endophytic microbes in Cymbidium goeringii and cotton (Gossypium sp.) (Chen et al.; Shi et al.), thus explaining the significant differences in microbial diversity and composition in Berchemia polyphylla var. leioclada endophytes and rhizosphere soil across different geographic regions.
In microbial diversity and community structure, this study revealed variations in the microbial diversity and community structure of endophytic bacteria and fungi across different plant samples and rhizospheric soils. These variations can be attributed to the influence of environmental factors such as temperature, humidity, oxygen content, and soil properties in different geographical regions. Such findings align with previous research, indicating that geographical and physiological factors play a pivotal role in shaping the composition of endophytic and rhizospheric microbial communities in plants (Shi et al., 2021a,b; Chen et al., 2023; Zheng et al., 2023).
In microbial Co-occurrence networks, the analysis of microbial co-occurrence networks revealed differences in the topological structure between microbial communities within Berchemia polyphylla plants and the surrounding soil. Notably, soil microbial networks exhibited higher complexity and natural connectivity compared to plant networks, suggesting stronger interactions and a more diverse ecosystem within the soil. The presence of shared bacterial and fungal genera between plant and soil communities underscores the potential for mutualistic relationships and interdependencies between these environments. For example, Vicinamibacteraceae can maintain the inherent ecological functions of soil (Zhang, Y. et al., 2020), and Cladosporium can improve the medicinal value and disease resistance of plants (Wu et al., 2019; Zhang, X. Y. et al., 2020).
Through microbial co-occurrence network analysis, it was found that the topological structure of the co-occurrence networks of Glehnia littoralis plant and soil microbial communities showed certain differences. The soil network’s complexity and natural connectivity, as well as the efficiency of information, energy, and material transfer, were higher than those of the plant network, indicating that soil microbes have a stronger resilience.
The functional predictions of microbial communities indicated that both plant and soil environments are engaged in various metabolic pathways. For plants, metabolic pathways such as aerobic respiration, peptidoglycan maturation, and pyruvate fermentation are prominent. These pathways may contribute to plant growth, development, and the production of bioactive compounds. In contrast, soil microbial communities also engage in metabolic pathways associated with soil health and organic matter decomposition.
Futhermore, understanding the diversity, composition, and functional roles of microbial communities in Berchemia polyphylla holds significant implications. It can inform future research endeavors aimed at uncovering the specific roles of microbial taxa in plant health, ecological sustainability, and medicinal product quality. The identification of core microbial genera that are shared between plants and soil highlights their potential importance in maintaining the health of Berchemia polyphylla and its ecosystems.
5 Conclusion
This study forms the basis for more focused investigations into the functions and applications of specific microbial taxa associated with Berchemia polyphylla. Researchers can delve deeper into the specific roles of dominant genera such as Vicinamibacteraceae, Donga, RB41, Fusarium, Trichoderma, Mortierella, and Cladosporium, and assess their impacts on plant health and product quality. Further exploration of these microbial interactions and functions may lead to improved plant management, agricultural practices, and the development of high-quality medicinal products derived from Berchemia polyphylla.
In conclusion, this research contributes to our understanding of the complex relationships between Berchemia polyphylla and its associated microorganisms, shedding light on the ecological and medicinal significance of these interactions. It offers valuable insights for the scientific community, plant growers, and conservation efforts related to this plant species and its associated microorganisms.
Data availability statement
The original contributions presented in the study are included in the article/supplementary material, further inquiries can be directed to the corresponding author.
Author contributions
YT: Data curation, Formal analysis, Methodology, Writing – original draft. SZ: Supervision, Visualization, Writing – review & editing. YX: Software, Validation, Writing – review & editing. TaZ: Formal analysis, Supervision, Validation, Writing – review & editing. XT: Resources, Software, Writing – review & editing. KS: Methodology, Project administration, Writing – review & editing. YL: Investigation, Methodology, Writing – review & editing. YY: Data curation, Formal analysis, Writing – review & editing. YZ: Conceptualization, Validation, Writing – review & editing. TiZ: Conceptualization, Methodology, Resources, Writing – review & editing.
Funding
The author(s) declare financial support was received for the research, authorship, and/or publication of this article. This work was funded by the National Natural Science Foundation of China (NSFC grant no. 31960716), Post-grant of the National Natural Science Foundation of China, Guizhou Academy of Agricultural Science (grant no. [2021] 49), and the Science and Technology Project of Guizhou Province (Qian Kehe Support [2021] General 226).
Acknowledgments
We extend our sincere gratitude to Eleni Gentekaki for her valuable advice and guidance in improving this article. We also wish to acknowledge all the coworkers at the Guizhou Institute of Animal Husbandry and Veterinary Research for their assistance in fieldwork.
Conflict of interest
The authors declare that the research was conducted in the absence of any commercial or financial relationships that could be construed as a potential conflict of interest.
Publisher’s note
All claims expressed in this article are solely those of the authors and do not necessarily represent those of their affiliated organizations, or those of the publisher, the editors and the reviewers. Any product that may be evaluated in this article, or claim that may be made by its manufacturer, is not guaranteed or endorsed by the publisher.
References
Brian, J. H., Dirk, G., Ashlee, M. E., Mike, F., Doyle, V. W., Georgia, G., et al. (2011). Chimeric 16S rRNA sequence formation and detection in sanger and 454-pyrosequenced PCR amplicons. Genome Res. 21, 494–504. doi: 10.1101/gr.112730.110
Chen, J. X., Tang, J., Wei, Y. Q., Ma, H. C., and Wu, J. R. (2023). Diversity of endophytic microbes in roots of wild cymbidium goeringii in Yunnan. Acta Microbiol Sin. 63, 156–169. doi: 10.13343/j.cnki.wsxb.20220258
Deng, Y., Huang, H., Lei, F., Fu, S. D., Zou, K., Zhang, S. F., et al. (2021). Endophytic bacterial communities of Ginkgo biloba leaves during leaf developmental period. Front. Microbiol. 12, 698–703. doi: 10.3389/fmicb.2021.698703
Douglas, G. M., Beiko, R. G., and Langille, M. G. I. (2018). Predicting the functional potential of the microbiome from marker genes using PICRUSt. Microbiome Anal. 1849, 169–177. doi: 10.1007/978-1-4939-8728-3_11
Doyle, J. J., and Doyle, J. L. (1987). A rapid DNA isolation procedure for small quantities of fresh leaf tissue. Photochem. Bull. 19, 11–15.
Egidi, E., Delgado-Baquerizo, M., Plett, J. M., Wang, J., Eldridge, D. J., Bardgett, R. D., et al. (2019). A few ascomycota taxa dominate soil fungal communities worldwide. Nat. Commun. 10, 2369–6511. doi: 10.1038/s41467-019-10373-z
Hakim, S., Mirza, B. S., Imran, A., Zaheer, A., Yasmin, S., Mubeen, F., et al. (2020). Illumina sequencing of 16S r RNA tag shows disparity in rhizobial and non-rhizobial diversity associated with root nodules of mung bean (Vigna radiate L) growing in different habitats in Pakistan. Microbiol. Res. 231:126356. doi: 10.1016/j.micres.2019.126356
Horinouchi, S. (2009). Combinatorial biosynthesis of plant medicinal polyketides by microorganisms. Curr. Opin. Chem. Biol. 13, 197–204. doi: 10.1016/j.cbpa.2009.02.004
Jing, Y., Yang, J., Wu, L., Zhang, Z., and Fang, L. (2011). Rubrofusarin glucosides of Berchemia polyphylla var. leioclada and their scavenging activities for DPPH radical. China J Chin. Materia Medica 36, 2084–2087. doi: 10.4268/cjcmm20111515
Karthikeyan, B., Abdul Jaleel, C., Lakshmanan, G. A. M., and Deiveekasundaram, M. (2008). Studies on rhizosphere microbial diversity of some commercially important medicinal plants. Colloids and Surfaces B: Biointerfaces, 62, 143–145. doi: 10.1016/j.colsurfb.2007.09.004
Klindworth, A., Pruesse, E., Schweer, T., Peplies, J., Quast, C., Horn, M., et al. (2013). Evaluation of general 16S ribosomal RNA gene PCR primers for classical and next-generation sequencing-based diversity studies. Nucleic Acids Res. 41:e1. doi: 10.1093/nar/gks808
Liu, Y. S., Li, H. Q., He, Y., Huang, Y. Y., Qiu, K. Y., and Xie, Y. Z. (2021). Research progress on the interaction regulation of plant and soil by rhizosphere microbiome. Soils Fert. Sci. China 5, 318–327. doi: 10.11838/sfsc.1673-6257.20292
Liu, Y., Lu, S., Zhuo, W., and Ren, F. M. (2023). Diversity and Structure of the Microbial Community in Rhizosphere Soil of Root-rot Corydalis tomentella Franch. Chinese Wild Plant Resources, 2023, 20–55. doi: 10.3969/j.issn.1006-9690.2023.04.010
Luo, X., and Yu, C. (2021). Diversity of endophytic fungi from Pinus massoniana in Guizhou Province, southwestern China. Mycosystema 40, 531–546. doi: 10.13346/j.mycosystema.200251
Magoč, T., and Salzberg, S. L. (2011). FLASH: fast length adjustment of short reads to improve genome assemblies. Bioinformatics 27, 2957–2963. doi: 10.1093/bioinformatics/btr507
Oita, S., Ibáñez, A., Lutzoni, F., Miadlikowska, J., Geml, J., Lewis, L. A., et al. (2021). Climate and seasonality drive the richness and composition of tropical fungal endophytes at a landscape scale. Commun. Biol. 4:313. doi: 10.1038/s42003-021-01826-7
Pinton, R., Varanini, Z., and Nannipieri, P. (Eds.). (2007). The rhizosphere: biochemistry and organic substances at the soil-plant interface. Boca Raton, FL: CRC Press
Rognes, T., Flouri, T., Nichols, B., Quince, C., and Mahe, F. (2016). VSEARCH: a versatile open source tool for metagenomics. PeerJ 4:e2584. doi: 10.7717/PEERJ.2584
Rúa, M. A., McCulley, R. L., and Mitchell, C. E. (2014). Climate drivers, host identity and fungal endophyte infection determine virus prevalence in a grassland ecosystem. J. Ecol. 102, 690–699. doi: 10.1111/1365-2745.12238
Shi, Y. W., Yang, H. M., Chu, M., Niu, X. X., Huo, X. D., Gao, Y., et al. (2021a). Endophytic bacterial communities and spatiotemporal variations in cotton roots in Xinjiang, China. Can. J. Microbiol. 67, 506–517. doi: 10.1139/cjm-2020-0249
Shi, Y. W., Yang, H., Chu, M., Niu, X., Wang, N., Qin, L., et al. (2021b). Differentiation and variability in the rhizosphere and endosphere microbiomes of healthy and diseased cotton (Gossypium sp.). Front. Microbiol. 12:765269. doi: 10.3389/fmicb.2021.765269
Shuai, L., Liu, H., Liao, L., Lai, T., Lai, Z., and Du, X. (2021). Widely targeted metabolic analysis revealed the changed pigmentation and bioactive compounds in the ripening Berchemia floribunda (wall.) Brongn. fruit. Food Sci. Nutr. 9, 1375–1387. doi: 10.1002/fsn3.2093
Tang, Y. J., Shang, Y. S., Zhou, S. X., Yang, Y. Q., Yu, B., and Yang, H. (2018). Research progress of Berchemia polyphylla var. Leioclada. Heilongjiang Anim. Sci. Vet. Med. 6, 164–167. doi: 10.13881/j.cnki.Hljxmsy.2017.02.0176
Wang, N., Su, Y., Liu, W. J., Feng, M., Mao, Y., and Zhang, X. G. (2021). Research progress on active compounds against drug-resistant microorganism from plant endophytes. Biotechnol. Bull. 37, 263–274. doi: 10.13560/j.cnki.biotech.bull.1985.2020-1471
White, T. J., Bruns, T., Lee, S., and Taylor, J. (1990). “Amplification and direct sequencing of fungal ribosomal RNA genes for phylogenetics” in PCR protocols: a guide to methods and applications, vol. 18. eds. M. A. Innis, D. H. Gelfand, J. J. Sninsky, and T. J. White (London, United Kingdom: Academic Press), 315–322.
Wu, J. T., Zheng, C. J., Zhang, B., Zhou, X. M., Zhou, Q., Chen, G. Y., et al. (2019). Two new secondary metabolites from a mangrove-derived fungus Cladosporium sp. JJM22. Nat. Prod. Res. 33, 34–40. doi: 10.1080/14786419.2018.1431634
Yu, H., Zhang, L., Li, L., Zheng, C., and Qin, L. (2010). Recent developments and future prospects of antimicrobial metabolites produced by endophytes. Microbiol. Res. 165, 437–449. doi: 10.1016/j.micres.2009.11.009
Zhang, Y., Wu, X. H., Li, X. G., Duan, T. T., Xu, J., Dong, F. S., et al. (2020). The response of soil microbial community to repeated application Clomazone. Biotechnol. Bull. 36, 64–74. doi: 10.13560/j.cnki.biotech.bull.1985.2020-1252
Zhang, H. X., Xu, X. T., Zheng, Y. T., and Xiao, C. Q. (2023). Roles of phosphate-solubilizing microorganisms in the passivation and phytoremediation of heavy metal contaminated soil. Biotechnol. Bull. 39, 52–58. doi: 10.13560/j.cnki.biotech.bull.1985.2022-0784
Zhang, X. Y., Zhao, L. H., Feng, H. J., Wei, F., Zhang, Y. L., Zhu, H. Q., et al. (2020). Control effect of endophytic fungus Acremonium sp. CEF-193 against Verticillium wilt in Gossypium hirsutum. China Cotton 47, 20–22, 26. doi: 10.11963/1000-632X.zxyfzl.20200909
Zheng, H., Zhang, P., Qin, J., Guo, J. N., and Deng, J. (2023). High-throughput sequencing-based analysis of the composition and diversity of endophytic bacteria community in tubers of Gastrodia elata f.glauca. Front. Microbiol. 13:1092552. doi: 10.3389/fmicb.2022.1092552
Keywords: Berchemia polyphylla var. leioclada, rhizospheric soil, endophytic, microorganisms, diversity
Citation: Tang Y, Zhou S, Xiao Y, Zhang T, Tao X, Shi K, Lu Y, Yang Y, Zhao Y and Zhao T (2024) Exploring the microbial ecosystem of Berchemia polyphylla var. leioclada: a comprehensive analysis of endophytes and rhizospheric soil microorganisms. Front. Microbiol. 15:1338956. doi: 10.3389/fmicb.2024.1338956
Edited by:
Lucia Zifcakova, Okinawa Institute of Science and Technology Graduate University, JapanReviewed by:
Shivankar Agrawal, Indian Council of Medical Research (ICMR), IndiaCuong Tu Ho, Vietnam Academy of Science and Technology, Vietnam
Copyright © 2024 Tang, Zhou, Xiao, Zhang, Tao, Shi, Lu, Yang, Zhao and Zhao. This is an open-access article distributed under the terms of the Creative Commons Attribution License (CC BY). The use, distribution or reproduction in other forums is permitted, provided the original author(s) and the copyright owner(s) are credited and that the original publication in this journal is cited, in accordance with accepted academic practice. No use, distribution or reproduction is permitted which does not comply with these terms.
*Correspondence: Sixuan Zhou, kerrybaiye@163.com
†These authors have contributed equally to this work