 Laura Steingruber
 Patrick Ruess1
 Maria Hammer
 Stephan Raab
 Marco Koch
- 1Department of Anatomy and Cell Biology, Institute of Theoretical Medicine, Faculty of Medicine, University of Augsburg, Augsburg, Germany
- 2Centre for Interdisciplinary Health Research (CIHR), University of Augsburg, Augsburg, Germany
- 3Centre for Advanced Analytics and Predictive Sciences (CAAPS), University of Augsburg, Augsburg, Germany
- 4Experimental Orthopaedics University Hospital Jena, Campus Eisenberg, Friedrich Schiller University Jena, Eisenberg, Germany
- 5Institute for Modelling and Simulation of Biomechanical Systems, University of Stuttgart, Stuttgart, Germany
- 6Department for Cardiothoracic Surgery, Faculty of Medicine, University of Augsburg, Augsburg, Germany
Background: Intercostal muscles (ICM) are essential for thoracic stability and respiratory mechanics. In musculoskeletal disorders and respiratory dysfunction, alterations in ICM structure and function may contribute to impaired ventilatory performance and reduced clinical capacity. Despite their physiological importance, fundamental properties of internal and external ICM fascicles—such as fascicle length, muscle volume, and interfascicular spacing—remain insufficiently described. This is mainly due to the limited spatial resolution of conventional imaging techniques such as ultrasound, computed tomography (CT), and electromyography (EMG), which cannot resolve individual ICM fascicles with sufficient detail for quantitative analysis.
Methods: This study aimed to address this gap. Eleven high-resolution thoracic T1- and T2-weighted magnetic resonance imaging (MRI) datasets were manually segmented using 3D Slicer software to characterize internal and external ICM fascicles. Standardized coronal, sagittal, and para-axial sequences were used to extract fascicle-specific parameters, including length, orientation relative to muscle course, volume, physiological cross-sectional area (PCSA), and interfascicular distance.
Results: Coronal imaging allowed reliable measurement of fascicle length and orientation for internal ICM. However, assessment of external ICM required additional para-axial sequence analysis to identify fascicle layers and attachment sites. Volumetric analysis and PCSA calculation for both internal and external ICM were feasible only through combined coronal and para-axial imaging. Results demonstrated that fascicle volume and length were proportionally related to calculated PCSA values.
Conclusion: Manual segmentation enabled detailed physiological assessment of ICM and demonstrated both the potential and limitations of current imaging modalities. Quantification of volume, PCSA, and especially external ICM remains challenging due to the structural complexity of the thoracic wall and reliance on axial planes. Nevertheless, this study presents a practical imaging protocol for thoracic musculoskeletal assessment. It enables refined morphometric analysis using high-resolution imaging and establishes a foundation for future biomechanical modeling and individualized therapeutic approaches. Importantly, it provides the first successful example of quantitative analysis of parasternal intercostal muscle morphology in healthy individuals, forming a basis for comparative studies in patient populations with respiratory impairment.
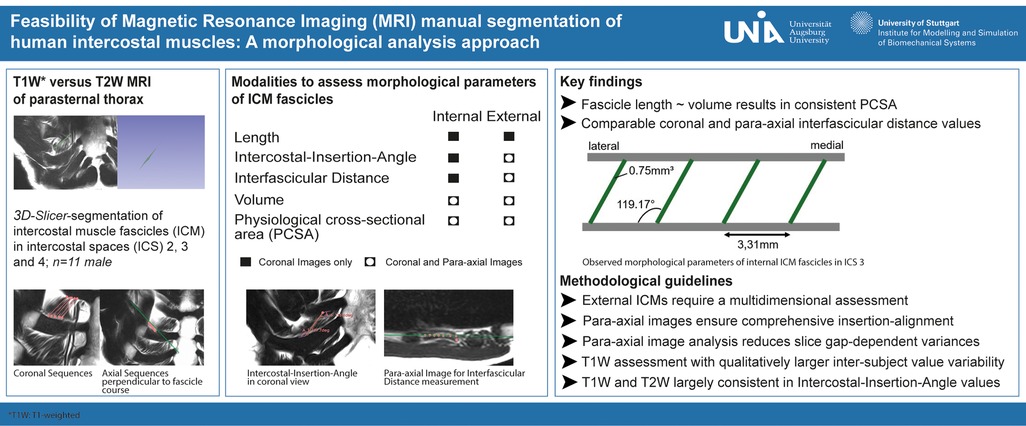
Graphical Abstract.
Introduction
Intercostal muscles (ICM) play a critical role in thoracic stabilization (1) and respiration (2, 3). The physiological integrity of skeletal muscle, particularly intercostal musculature, is essential for generating and modulating the dynamic mechanical forces required for effective ventilation. Respiratory muscle dysfunction, whether induced by injury, neuromuscular disease, or chronic respiratory pathology, can significantly impair breathing mechanics and oxygen exchange. As such, compromised ICM function may contribute to progressive ventilatory insufficiency, increased work of breathing, and reduced respiratory capacity, along with potentially severe clinical consequences. Under pathological conditions such as traumatic rib fractures, the ICM can also lead to secondary complications, as malunited or dislocated bone fragments compromise the chest wall integrity. Consequently, operative stabilization of the thorax is often necessary (4) in cases of progressively dislocating rib fractures (5), which ultimately worsen thorax instability (6) and are accompanied by increased nociception (7), emotional distress, and impaired breathing (8, 9). Moreover, reduced respiratory capacity may not only result from thoracic instability but also from impaired activation or mechanical restriction of ICM (10). Thus, respiration severely depends on ICM integrity and intact intercostal space (ICS) stability. Given the opposite topographical orientation of internal and external ICM, the precise distinction of ICM groups may also play a decisive role in the understanding of rib fracture dislocation, thoracic integrity, and respiratory efficiency. Overall, the physiological properties of ICM warrant particular attention, but key characteristics of distinct ICM groups, such as fascicle volume, length, and physiological cross-sectional area (PCSA), remain experimentally underexplored. Thus, basic morphological and physiological examination of ICM groups is essential to estimate the force-generating capacity and to facilitate precise biomechanical modeling as well as the development of custom rehabilitative therapies for respiratory diseases (11, 12).
Existing methods, such as ultrasound (13, 14), computed tomography (CT) (2, 15), and electromyography (16), provide general insights based on in vivo- or cadaver-based applications but fail to differentiate individual ICM fascicles or ICM groups. T2-weighted (T2W) magnetic resonance imaging (MRI) mapping of large muscle structures has been previously assessed; however, a dedicated methodological approach for ICM analysis is still lacking (17–19). To overcome this limitation, we conducted a non-clinical trial using manual segmentation of ICM in high-resolution T2W and T1-weighted (T1W) MRI data sets, specifically assessing internal and external ICM fascicles separately. This approach demonstrates initial insights into acquisition parameters assessing ICM groups based on conventional T1W in the coronal plane and T2W with coronal, sagittal, and para-axial planes. This novel methodological approach allows a detailed quantification of fascicle-specific parameters of distinct ICM groups, including volume, length, PCSA, topographic orientation, and density, considering the most suitable planes. Additionally, we provide MRI sequence criteria necessary for reliable technical assessment of single fascicles. This procedure not only enhances our basic anatomical understanding of ICM but also provides a reliable manual method to further evaluate physiological traits of defined ICM groups, their specific function, and anatomical distribution in various thoracic regions and intercostal spaces. An advanced analysis of ICM enables a more comprehensive assessment of thoracic musculoskeletal interactions in terms of both force and stability, facilitating their effective integration into physiological as well as pathophysiological frameworks.
Materials and methods
Patient collective
The present study included ambulatory care patients (N = 11) who were radiologically examined for clinical trials at the ÜBAG Radiology Augsburg-Friedberg, Augsburg, Germany, in 2024. The radiological examination of the thorax mainly consisted of the intercostal space (ICS) 2–4 for sternal imaging. No written consent from the patients was required for the retrospective study analysis with anonymized data. The composition of the collective was subject to an ethics vote (project number 23-0306, Ethics Committee of Ludwigs-Maximilians-Universität München, Munich, Germany) with exclusion criteria of lung-related disease, major injuries of the thorax, scoliosis, aged over 60 years, and professional athletes.
The patient collective comprised 11 male patients (Table 1) with a mean age of 25.45 years with a standard deviation (SD) of 2.93 years, a mean height of 1.82 m (±0.09 m), a mean weight of 78.18 kg (±10.75 kg), and a mean BMI of 23.62 kg/m3 (±2.06 kg/m3).
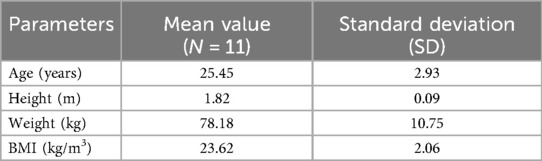
Table 1. Metadata analysis of patient collective graded to biographical data (age, height, weight, BMI).
MRI data collection
Radiological examination using MR scans was applied for diagnostic reasons and consecutively anonymized for further project-related analysis. T2W MRI sequences with coronal, sagittal, and axial course comprised patients 1–3 (subgroup T2W, Table 2), whereas T1W MRI sequences with coronal course for sternal imaging comprised patients 4–11 (subgroup T1W, Table 3). All patients were scanned with a 3.0 T Philips Ingenia (Philips Medical Systems, Hamburg, Germany). The patients were examined in a standardized supine position with the MRI coil lying on their chest under breath-holding commands to reduce image artifacts.
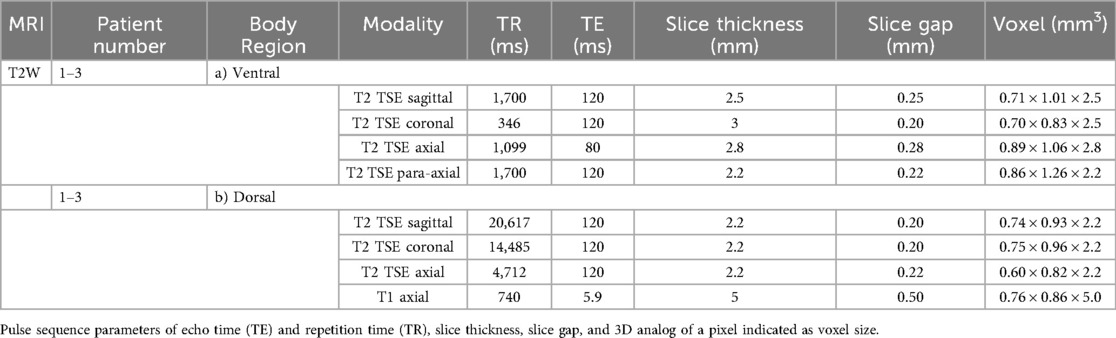
Table 2. List of scanning parameters of MRI coronal, axial, and para-axial sequences for ventral (a) and dorsal (b) body region of patients 1–3.
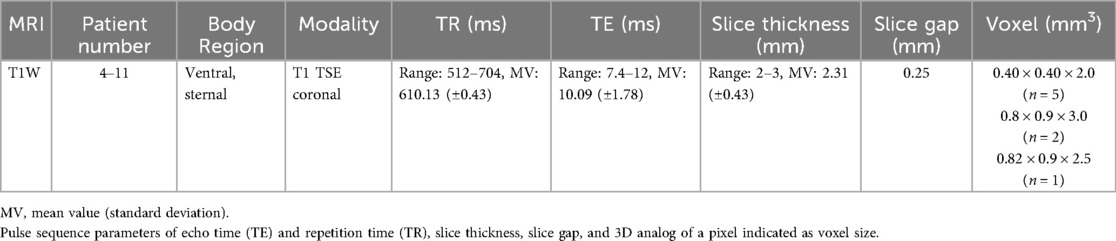
Table 3. List of scanning parameters of MRI coronal sequences for the ventral body region of patients 4–11.
T2W coronal, sagittal, and (para-)axial sequences
The sequences were performed for ventral and dorsal body region scanning (Table 2). Routinely, the coronal images showed the most precise course of ICM in ICS 3. Therefore, ICS 3 was used as a reference for axial imaging of both ICM groups, resulting in two para-axial image series along the direction of cross-sectioned internal and external ICM, respectively (Figure 1). The para-axial image planes were chosen to be perpendicular (tilted 90 °) to the coronal plane at the level of the ICS midpoint and captured the entire origin to insertion of fascicles related to the set midpoint (Figures 3B,C). In addition, sagittal images were routinely prepared (Figure 1A1, B1).
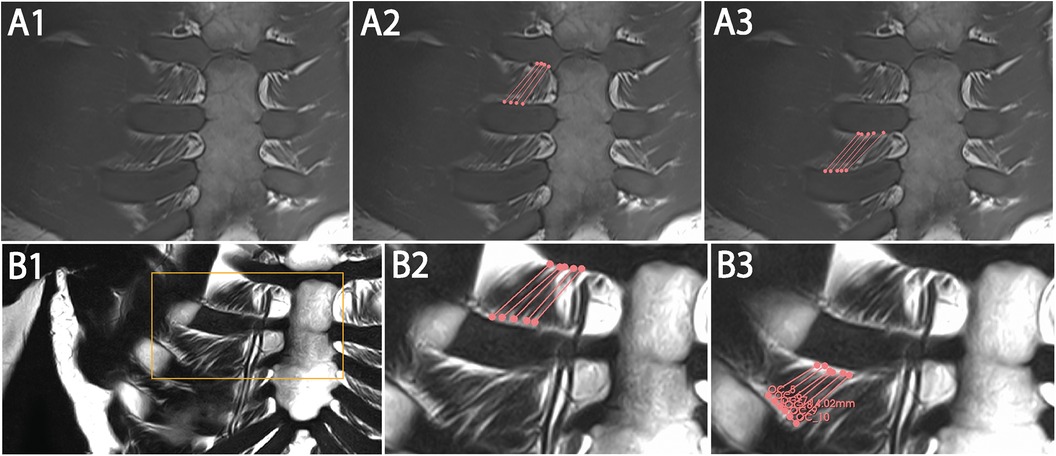
Figure 1. Representative images with coronal T1W (A1–A3) and T2W (B1–B3) MRI view and 3D Slicer segmentation (A2,A3,B2,B3) of single costosternal internal ICM fascicles of ICS 2 and 3. (A1) Original image of coronal T1W costosternal region. (A2) T1W image of marked fascicles of ICS 2 with insertion points (dots) and marked course (lines). (A3) T1W Image of marked fascicles of ICS 3 with insertion points (dots) and marked course (lines). (B1) Original image of coronal T2W costosternal region. (B2) T2W image of marked fascicles of ICS 2 with insertion points (dots) and marked course (lines). (B3) T2W Image of marked fascicles of ICS 3 with insertion points (dots) and marked course (lines).
T1W coronal sequences
Scanning parameters are listed in Table 3.
MRI weighting modalities
To qualitatively assess physiological parameters of ICM, T1W and T2W MRI sequences were included. T1W imaging is routinely used for diagnostics of sternal fractures due to its high signal contrast between fat and water. In contrast, T2W imaging is primarily used for the sensitive visualization of water-rich structures and for the evaluation of anatomical architecture. To capture the qualitative and quantitative differences between the two imaging modalities and to account for limitations in the assessment of ICM physiology, a homogenous cohort was preselected for this study.
Determination of physiological parameters
MRI images were transferred as Digital Imaging and Communications in Medicine (DICOM) format into the open-source software application 3D Slicer (http://www.slicer.org) (20) for muscle tissue measurement. By reason of the clearest single fascicle contours, the costosternal region, comprising parasternal and ventral rib segments, was used for quantification of fascicle length, topographical fascicle orientation of muscle insertion points, and its course, volume, PCSA, and interfascicular distance of adjacent fascicles. In case of additionally available para-axial imaging, the analysis of a single patient dataset required several hours to days. This period included the evaluation of the imaging data, assessment of ICM within respective ICS, distinguishing internal and external ICM groups as well as their muscle layers, the definition of muscle fascicle origins and insertions, and the measurement of length, course, angle, and interfascicular distance.
Fascicle length
The insertion points of single ICM fascicles at two adjacent ribs were set as end points for the determination of total fascicle length, describing a calculated distance value. The costosternal region of ICM groups in ICS 2, 3, and 4 was evaluated for all included patients. Manual segmentation of fascicles was conducted according to available protocols for thoracic structure annotation (21, 22) and proceeded as follows. If available, the para-axial cross-sectional images were primarily used to annotate the fascicle length. Segmentation was conducted in 3D Slicer by manually selecting each voxel representing a muscle portion. All voxels identified as muscle tissue of single ICM fascicles were further adjusted and verified using the remaining two imaging planes (sagittal and coronal). The 3D Slicer program automatically calculated the distance between the two outermost marked voxel points, corresponding to the fascicle's origin and insertion points, which were subsequently verified in both sagittal and coronal planes.
The para-axial images displayed the relevant muscle tissue in cross-section most consistently and thus, offering the most straightforward and accurate view for analysis. The coronal images provided a clear visualization of both the fascicle course and the length, allowing precise delineation of single fascicles. The combination of all three planes (para-axial, coronal, and sagittal) ensured the highest measurement accuracy.
Besides, the “IMAIOS” MRI data set (SAS IMAIOS, Castelnau-le-Lez, France) provided exemplarily annotated ICM in scans and served as orientation for the manual segmentation process of fascicles. The determined fascicle length was considered as full muscle length, since the distance between origin and insertion was hardly separable into a tendinous and a muscular compartment. This assumption was supported by evidence since aponeurosis and tendon lengths are negligible compared with muscle fascicle length in ICM (23).
Fascicle length of internal ICM was calculated in coronal sequence assessment of both T1W and T2W (Figure 2). However, external ICM required combined coronal and para-axial image analysis for accurate fascicle-specific course tracing, coherent muscle layer differentiation, and precise insertion point verification with additional review in the sagittal view. Overall, integration of more than one MRI plane sequence in the segmentation process guaranteed a precise determination of insertion points with a reduced deviation of sequence-dependent gap of 0.25–0.5 mm. Radiologists of “ÜBAG Radiology Augsburg-Friedberg,” with over 10 years of practical experience each and being experts of the German Society of Musculoskeletal Radiology (DGMSR), finally reviewed and conducted annotations. In total, three fascicles of each ICM group and ICS were defined per patient.
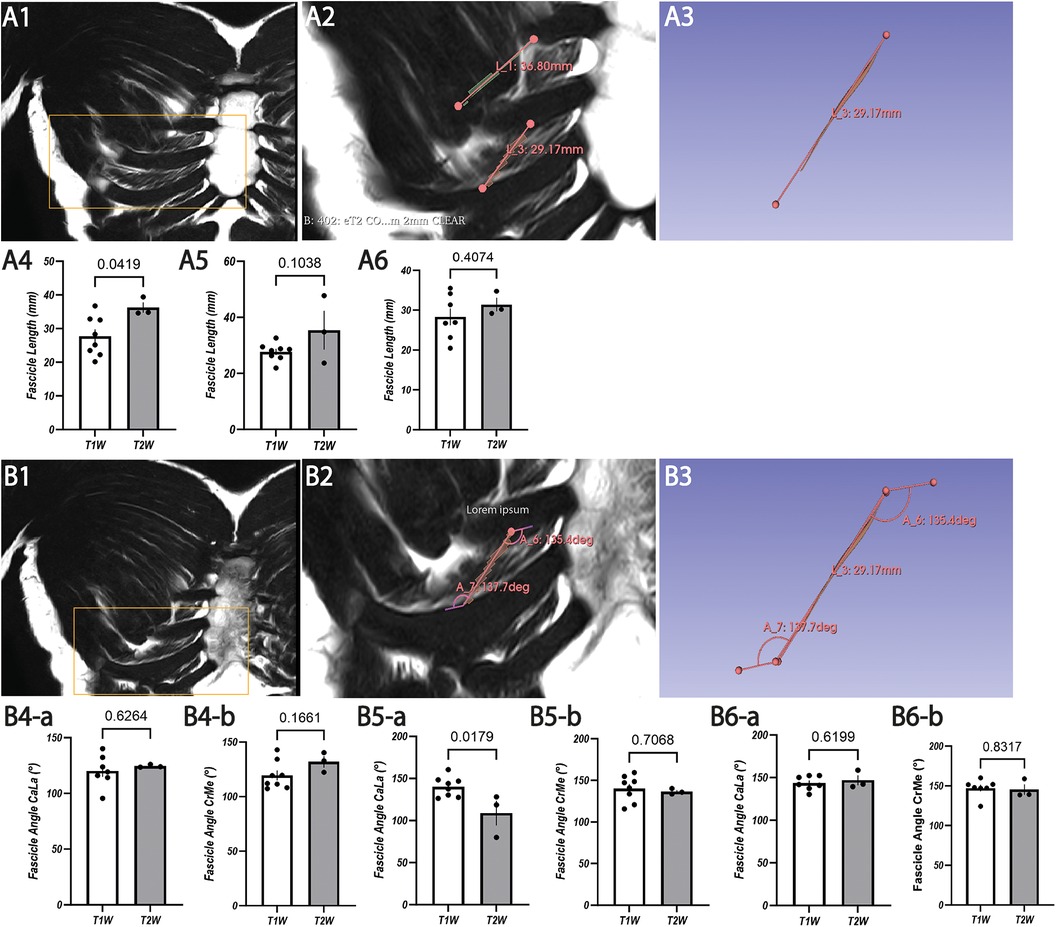
Figure 2. Representative images with coronal T2W MRI view (A1,A2,B1,B2) and 3D Slicer segmentation (A3,B3) for fascicle length and IIA measurement of costosternal internal ICM fascicles with statistical analysis of T1W and T2W for ICS 2 (A4,B4), ICS 3 (A5,B5), and ICS 4 (A6,B6). (A1) Original image of coronal T2W resembling a lower magnification of the segmented image of (A2). (A2) Segmented fascicles of ICS 3 and ICS 4 with insertion points (dots) and marked course (line) with higher magnification of (A1). (A3) Isolated image of (A2) segmented fascicle of ICS 4 with insertion points (dots) and marked course (line). (A4) Analysis of fascicle length in ICS 2 based on T1W and T2W with SEM (lines). (A5) Analysis of fascicle length in ICS 3 based on T1W and T2W with SEM (lines). (A6) Analysis of fascicle length in ICS 4 based on T1W and T2W with SEM (lines). (B1) Original image of coronal T2W resembling the lower magnification of the segmented image of (B2). (B2) Segmented fascicle of ICS4 with insertion points (dots), CaLA (lower angle), and CrMA (upper angle). (B3) Isolated image of (B2) segmented fascicle with insertion points (dots), CaLA, and CrMA. (B4) Analysis of IIA (B4-a, CaLA; B4-b, CrMe) in ICS 2 based on T1W and T2W with SEM (lines). (B5) Analysis of IIA (B5-a, CaLA; B5-b, CrMe) in ICS 3 based on T1W and T2W with SEM (lines). (B6) Analysis of IIA (B6-a, CaLA; B6-b, CrMe) in ICS 4 based on T1W and T2W with SEM (lines).
Fascicle orientation
Topographical orientation of the costosternal internal and external ICM was assessed by defining the intercostal-insertion angle (IIA) within each ICS. The IIA was measured between the anatomical course of the muscle and its insertion points aligned to the rib surface along the ICS. The vector connecting previously defined muscle insertion points according to fascicle length determination served as one arm of the angle, while the ICS-limiting rib surface line formed the second. For internal ICM, a caudo-lateral angle (CaLA) of the superior surface of the lower rib to muscle course and a cranio-medial angle (CrMA) of the inferior surface of the upper rib to muscle course were defined. Conversely, external ICM were characterized by a caudo-medial angle (CaMA) and a cranio-lateral angle (CrLA). Using the three-point-angle measurement tool in 3D Slicer, IIAs of internal ICM were quantified in coronal sequences, whereas external ICM required combined coronal and para-axial sequence analysis in terms of limited fascicle contours and spatial differentiation in the coronal plane. The sagittal view, if available, was used to precisely align IIA measurements with the predetermined fascicle course.
Fascicle volume and PCSA
3D Slicer’s built-in voxel count determined the muscle volume (V) of manually segmented fascicles (mm3) based on previously verified marked voxels. Relying on limited fascicle differentiation in the coronal plane, the morphological characterization of fascicle volume required additional para-axial images for both ICM groups. After identifying the fascicles in the corresponding images, the voxels of the fascicles were manually marked using the 3D Slicer function “Paint” in the “Segmentation” module with a diameter of 0.5 mm. 3D Slicer built-in-function “Quantification” automatically calculates the volume based on all marked voxels. The sagittal view, if available, was used to verify spatial differentiation between fascicles and muscle layers within the respective ICS. Single fascicles of ICS 2, 3, and 4 with the clearest contours were included to determine volume values.
Based on the measured fascicle volume and length properties, the fascicles' strength was characterized by the PCSA value and was calculated as follows:
As previously described, the determined fascicle length (Lf) was considered as full muscle length. The pennation angle was considered as zero for all muscle fascicles (23) and was not included in the conducted PCSA calculations. In this reference, pennation angles of above 30° are considered as significantly affecting PCSA values (23).
Interfascicular distance
The distribution of internal ICM within costosternal ICS 2 and 3 was assessed by quantifying the interfascicular distance of five adjacent fascicles using coronal and axial MRI sequences. In the coronal view of ICS 4, clear identification of more than two adjacent fascicles was limited and therefore excluded.
Interfascicular distance was calculated through two sequence-associated measurements: the coronal plane, highlighting the applicability in standardized sternal MRI, and the para-axial images, aligned to the cross-sectional view of the in coronal view determined fascicles with perpendicular orientation to the coronal plane. The para-axial images minimized potential spatial deviations, which were not detectable in coronal views and enabled allocation of fascicles to muscle layers.
Statistical analysis
The data were compiled in tabular form as an Excel spreadsheet with standard deviations (SD). Values of internal ICM were processed using GraphPad Prism (version 10.1.2). To calculate p-values and standard error of the mean (SEM), an unpaired two-tailed t-test and two-way ANOVA were performed. The unpaired two-tailed t-test was performed using the mean values calculated for each patient, derived from three measurements (fascicles). The two-way ANOVA was performed with mean values, each derived from mean values of five fascicle-distance measurements per patient, based on variable (ICS) and group (sequence). The threshold for significant differences was considered as p < 0.05.
Results
Internal ICM
Fascicle length based on T2W and T1W coronal sequences
Exemplary annotation and 3D Slicer analysis for muscle fascicle length are shown in Figures 1 and 2. Costosternal internal ICM fascicle length (Table 4) of at least 30 measured fascicles in each ICS demonstrated no significant differences in ICS 2 (30.02 ± 6.40 mm), ICS 3 (29.74 ± 7.04 mm), and ICS 4 (29.23 ± 5.27 mm). In subgroup T2W, qualitatively higher values (ICS 2, 36.27 ± 2.21 mm; ICS 3, 36.07 ± 10.68 mm; ICS 4, 31.37 ± 2.42 mm) were observed when compared with subgroup T1W (ICS 2, 26.68 ± 5.52 mm; ICS 3, 27.67 ± 2.94 mm; ICS 4, 28.21 ± 5.19 mm) with significant differences in IC 2 and ICS 4 (ICS2, p = 0.0419, ICS 4, p = 0.04074; Figures 2A4,A6), but not in ICS 3 (p = 0.1038, Figure 2A5).
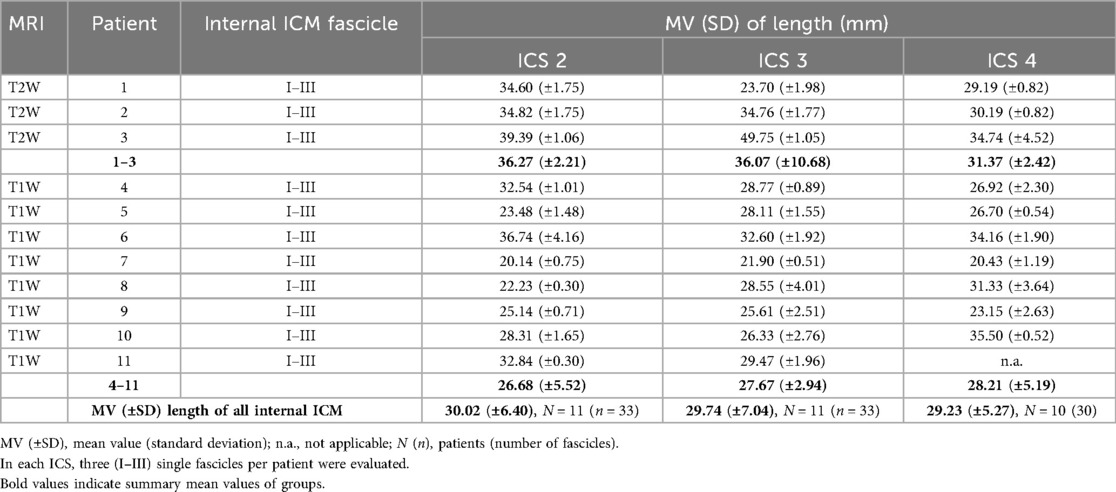
Table 4. Determined fascicle lengths of costosternal internal ICM in intercostal spaces (ICS) 2, 3, and 4.
IIA based on T2W and T1W coronal sequences
The two IIAs, CaLA and CrMA (Table 5), were determined for internal ICM in all subjects (N = 11; T2W, N = 3; T1W, N = 8). Exemplary annotation and 3D Slicer analysis are shown in Figure 2. The mean values of IIA were measured for more than 30 fascicles of each ICS. The values in ICS 2 (CaLA, 120.14° ± 2.43°; CrMA, 122.77° ± 13.45°), ICS 3 (CaLA, 134.67° ± 14.96°; CrMA, 139.15° ± 13.59°), and ICS 4 (CaLA, 144.62° ± 10.55°; CrMA, 146.65° ± 11.20°) were progressively increasing from ICS 2 to ICS 4 as reflected in the observed angle gradients of CaLA and CrMA, respectively.
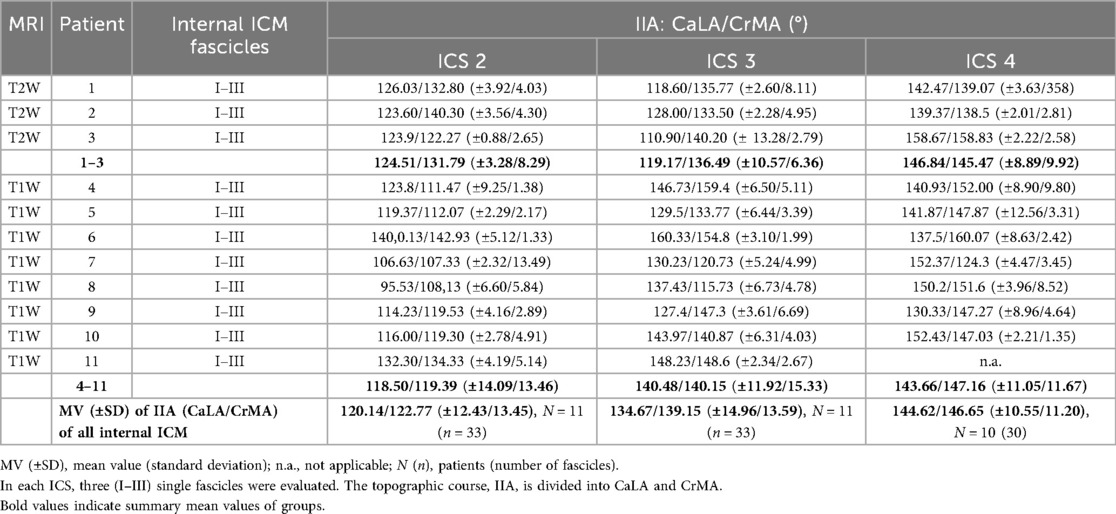
Table 5. Determined fascicle orientation of costosternal internal ICM in intercostal spaces (ICS) 2, 3, and 4.
The mean values in the subgroup T2W were qualitatively higher in ICS 2 and ICS4 than those observed in the subgroup T1W (Table 4). No significant difference was observed in CaLA and CrMe of ICS 2 (ICS 2, p = 0.6264, p = 0.1661, Figures 2B4-a,B4-b; ICS 4, p = 0.6199, p = 0.8317, Figures 2B6-a, B6-b). IIA CaLA conversely, the mean values in ICS 3 were higher in the subgroup T1W (T2W: CaLA, 119.17° ± 10.57°; CrMA, 136.49° ± 6.36°, T1W: CaLA, 140.48° ± 11.92°; CrMA, 140.15° ± 15.33°). Here, differences in CaLA were significant (p = 0.0179, Figure 2B5-a). SD values of subgroup T1W (SD, 3.28°–10.57°) showed a smaller intersubject range compared with subgroup T2W (11.05°–15.33°), which was also observed in SEM (Figure 2B5-a). The IIA CrMe in ICS 3 was not significantly different comparing T1W and T2W (p = 0.7068, Figure 2B5-b).
Volume and PCSA based on T2W coronal and para-axial sequences
Exemplary coronal, sagittal, and para-axial sequences are shown in Figure 3. The mean value of fascicle volume in ICS 3 (Table 5) out of three subjects comprising eight evaluated fascicles was 0.75mm3 with an intersubject SD of 0.017 mm3. The intersubject comparison of mean values showed a range (0.55–0.97 mm3) with an intra-subject range of SD (0.03–0.06 mm3).
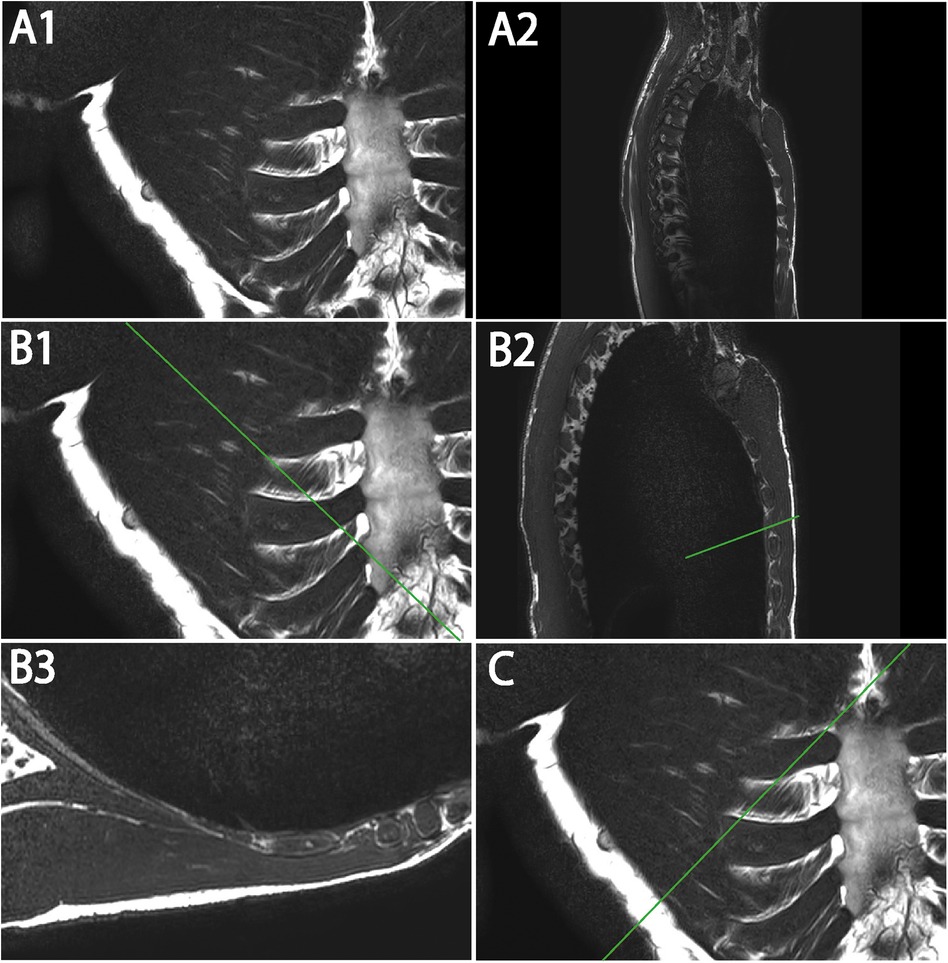
Figure 3. Representative T2W MRI views (A–C) illustrating coronal (A1) and sagittal (A2) images with marked para-axial plane (line) (B1,B2,C) and exemplary para-axial image (B3). (A1) Original image of coronal T2W. (A2) Original image of sagittal T2W. (B1) Coronal T2W with marked para-axial plane (line) for internal ICM analysis. (B2) Sagittal T2W with marked para-axial plane (line) corresponding to (B) (B3) Original image of para-axial T2W. (C) Coronal T2W with marked para-axial plane (line) for external ICM analysis.
Based on determined fascicle length and volume, a PCSA value (Table 6) was calculated for ICS 3 of subgroup T2W. Intersubject mean value differences demonstrated a small range (MV, 0.18–0.23 mm2; SD, 0.00–0.06 mm2) and comparable PCSA values in ICS 3.
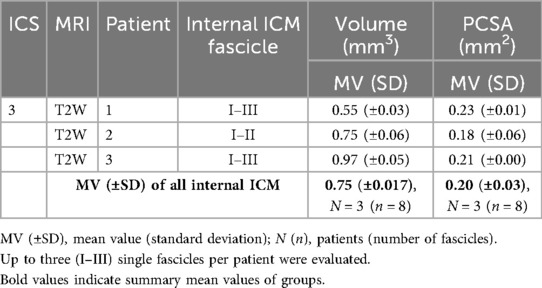
Table 6. Determined fascicle volume and calculated PCSA of costosternal internal ICM in ICS 3.
Interfascicular distance based on T2W coronal and para-axial sequences
The distance between five adjacent fascicles (I–V, Table 7) of internal ICM in ICS 2 and 3 was quantified. Exemplary annotation and 3D Slicer analysis are shown in Figure 4, following the approach of Figure 3. Quantified coronal interfascicular distance of 15 measured fascicles in each ICS showed a smaller mean value in ICS 2 (3.00 ± 0.30 mm) compared with ICS 3 (3.21 ± 0.68 mm). However, para-axial interfascicular distance demonstrated in ICS 2 (3.47 ± 0.71 mm) and ICS 3 (3.41 ± 0.60 mm) higher values compared with coronal assessment and demonstrated a higher overall mean value of 3.44 mm and a higher intersubject SD of 0.66. Comparing coronal and para-axial approach value differences were not significant (ICS 2, p = 0.1256; ICS 3, p = 0.6087). The summed interfascicular distance of internal ICM values in ICS 2 (3.11 ± 0.54 mm) and ICS 3 (3.44 ± 0.67 mm) showed comparable mean values.
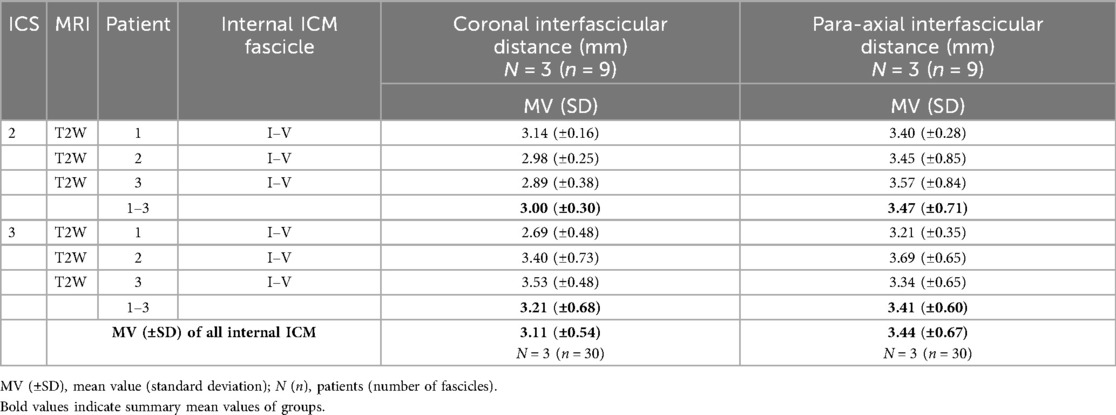
Table 7. Determined interfascicular distance of five adjacent costosternal internal ICM graded in ICS 2 and 3.
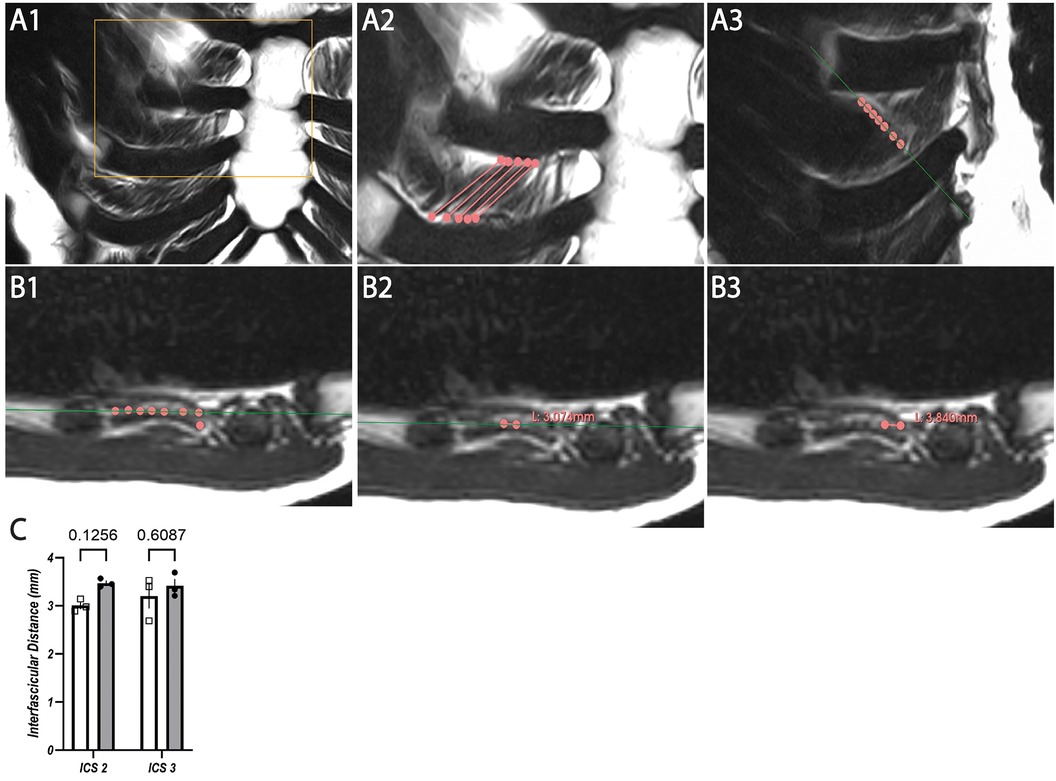
Figure 4. Representative T2W MRI images with coronal (A1–A3) and para-axial view (B1–B3) for interfascicular distance measurement in ICS 3 with statistical analysis based on coronal and para-axial sequences of ICS 2 and ICS 3 (C). (A1) Original image of coronal T2W. (A2) Segmented internal ICM fascicles with insertion points (dots) and marked course (lines) of ICS3. (A3) Marked fascicles (dots) of A2 with indicated para-axial plane (green line) corresponding to (B). (B1) Marked fascicles (dots) corresponding to (A3) aligned to para-axial plane (line) within the same muscle layer. (B2) Exemplary para-axial interfascicular distance measurement of two fascicles (dots) within the same muscle layer and para-axial plane (line). (B3) Exemplary para-axial interfascicular distance measurement of two fascicles (dots) within the same muscle layer. (C) Analysis of mean values of T2W images derived from interfascicular distance measurement based on coronal (rectangles, white columns) and para-axial (dots, gray columns) planes in ICS 2 and ICS 3 with SEM (lines).
External ICM
External ICM quantification relied on combined coronal and axial imaging, wherefore the subgroup T2W providing para-axial images (Figure 3C) was evaluated.
Fascicle length based on T2W coronal and para-axial sequences
Costosternal external ICM fascicle length (Table 8) was evaluated. The mean values demonstrated in ICS 2 (25.5 ± 2.9 mm), ICS 3 (41.7 ± 3.0 mm), and ICS 4 (21.7 ± 4.7 mm), comprising three measured fascicles in each ICS, with distinct differences with a maximum length value in ICS 3 (41.7 mm).
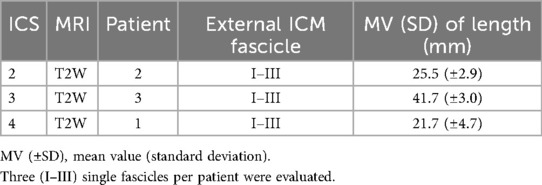
Table 8. Determined fascicle length of costosternal external ICM graded in ICS 2, 3, and 4.
IIA based on T2W coronal and para-axial sequences
The two IIAs, CaMA and CrLA (Table 9), were determined for external ICM fascicles. The mean values showed in ICS 2 (CaMA, 119.57° ± 3.17°; CrLA, 129.97 ± 2.95), ICS 3 (CaMA, 102.5° ± 1.19°; CrLA, 136.33 ± 2.8), and ICS 4 (CaMA, 140.67° ± 16.51°; CrLA, 155.37 ± 1.9), comprising three measured fascicles each ICS, distinct differences with observed maximum values in ICS 4 in both CaMA and CrLA.
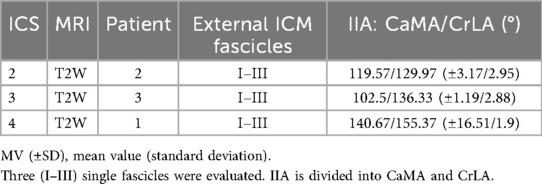
Table 9. Determined fascicle orientation of costosternal external ICM graded in ICS 2, 3, and 4.
Volume and PCSA based on T2W coronal and para-axial sequences
The mean values of fascicle volume (Table 10) per ICS (each N = 1 with three fascicles) showed in ICS 2 (0.55 ± 0.017 mm3), ICS 3 (0.75 ± 0.05 mm3), and ICS 4 (0.97 ± 0.05 mm3) distinct differences with ascending gradient from ICS 2 to ICS 4.
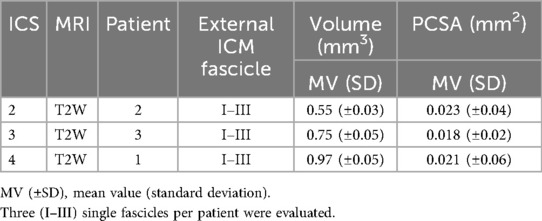
Table 10. Determined fascicle volume and calculated PCSA of costosternal external ICM graded in ICS 2, 3, and 4.
Based on determined fascicle length and volume, a PCSA (mm2, Table 9) was calculated and demonstrated comparable PCSA values for ICS 2 (0.023 ± 0.04 mm2), ICS 3 (0.018 ± 0.02 mm2), and ICS 4 (0.021mm ± 0.06 mm2).
Discussion
Various studies have non-invasively explored the morphology of distinct muscle types to quantify both pathological (3, 11, 14) and training-related (2, 10, 24) adaptations. Additionally, structural measurements provide information about the functional impact of ICM and its force-generating potential. Common methods include segmentation of MRI (19), ultrasound (14, 25), or computed tomography (CT) (26) but often focus on large, well-delineated muscle groups such as the diaphragm (11) or leg muscles (19). MRIs of the soleus muscle and gastrocnemius compartments were examined with a combination of semiautomated (Sashimi Segmentation V1.1; Bolsterlee) and manual segmentation (ITK-SNAP v3.8.0, NIH, USA). Here, particularly CT scans demonstrate the potential to examine smaller structures such as ICM (26), although they lack sufficient resolution to differentiate between internal and external ICM, their muscle layers, and even single fascicles. So far, CT complements and validates the obtained ultrasound measurements of ICM (26), which thus remains a key modality to quantify ICM. In a pilot study, we applied the built-in 3D Slicer automated segmentation tool and failed to accurately identify the fascicle's course in ICM and its insertion points. A consecutive volumetric analysis was unfeasible. Consequently, we developed an approach of manual segmentation using T1W and T2W coronal as well as T2W para-axial and sagittal MRI scans, focusing on parasternal fascicles of ICM, which were already part of various studies (14, 26–29). While T1W coronal images are used in everyday medical practice for conventional diagnostics, T2W para-axial images are sparsely available and used to identify neural and muscular structures or the inner thoracic layers. Our study provides a detailed anatomical characterization of single internal and external ICM fascicles in length, volume, and topographic orientation within ICS 2, 3, and 4. Furthermore, we demonstrate the fascicle distribution of internal ICM in the parasternal region. The study intends to present anatomically reliable structures and, hence, selected single fascicles with the clearest contours in MRI. The potential for sampling bias was aimed to be reduced by analyzing multiple individual fascicles per ICS and multiple ICS per patient. A fully randomized selection of fascicles for segmentation was not feasible given the available MRI data, nor was it possible to consistently identify five adjacent fascicles objectively for calculating the interfascicular distance values. Overall, the study poses an initial approach of identifying single ICM fascicles based on T1W and T2W scans.
T1W and T2W coronal imaging enabled measurements of internal ICM fascicle length and orientation in ICS, facilitating topographic characterization using standard sternal MRIs. However, external ICM required a multidimensional assessment because of poor resolution in T1W and T2W coronal views, despite the patients being examined in the prone position, with the parasternal region being closest to the coil. Therefore, T2 para-axial imaging enabled muscle layer distinction and precise fascicle segmentation. By choosing a para-axial view, the entire fascicle from origin to insertion point could be tracked in a cross-sectional view, due to a 90° tilted relative perspective of the coronal fascicle course. A notable limitation in this study was the absence of para-axial MRI sequences in most of the patients, which prohibited accurate identification of fascicles aligned within the same muscle layer and diminished the study group size. So far, para-axial sequences are not standardized in sternal MRI setups because they lack diagnostic relevance, and para-axial sequences require a specialized framework, meaning extended scanning times. Future studies may evaluate a larger cohort and segment a higher number of muscle fascicles for extended statistical analysis. Clinical trials may include MRIs matching the intention of ICM analysis, which require longer image durations for high-resolution para-axial plane, and may additionally apply this procedure to lateral and dorsal regions of the thorax for comprehensive ICS characterization. To determine the total PCSA for an intercostal space, the total number of all fascicles in the circumference is required. Since differences in fascicle length, angle, or volume can be expected, defined and validated parameters of lateral, dorsal, and paravertebral fascicles are required prior to reliable total PCSA calculation of ICS. The same considerations apply to the different intercostal spaces. Once the location-specific fascicle parameters are known, the total PCSA for the ICM in each intercostal space and ultimately for the entire ICM can be determined by summing the individual values.
MRI protocols for diffusion tensor imaging (DTI) reconstruct skeletal muscle fibers to assess length and orientation (30) but demonstrate sparse and inaccurate measurements. Here, we assessed a manual segmentation to precisely examine morphological properties of single ICM fascicles. Determined internal ICM fascicle lengths differed slightly when comparing coronal T1W and T2W sequences, with a higher mean value observed in T2W but remaining insignificantly different. Overall, an approximate mean length of 30 mm was observed in all ICS and both ICM groups regardless of the imaging-sequence. Despite the small cohort, a similar age, BMI, and height suggest that findings may be generalized for this represented group. Interestingly, external ICM fascicle lengths showed a greater variability, with mean values ranging from 21.7 to 40 mm, corroborated by a profound verification with multidimensional image analysis. Regarding the topographical orientation, fascicle angle measurements revealed particularly steep courses in ICS 4 for both ICM groups. When comparing the measured angles, there was no indication of the exact perpendicular orientation of external to internal ICM; instead, a sharper angle than 90° between crossing fascicle courses was shown. Larger studies may clarify these functional implications in assessing directly crossing internal and external ICM fascicles and their constituted angle. Several studies linked ICM function to thoracic mechanics (1, 10, 31, 32) and stability (33, 34), in which both fascicle orientation and localization are critical to contraction force and functional impact. The present data refine this understanding of muscle-specific force direction and support future approaches to characterize ICM biomechanically. Comprehensive mapping of ICM length and orientation may advance digital models for thoracic simulation (35).
Previous studies have demonstrated that ageing and disease are associated with progressive intramuscular fat infiltration (36, 37), which can distort measurements of true muscle volume. As a result, the subsequent calculation of PCSA may be subject to bias. The MRI data of this study were obtained from patients of younger age and comprise presumably minimal fat infiltration (37). Consequently, the calculated morphometric parameters, including muscle volume and PCSA, can serve as a valuable reference dataset for future investigations. The volumetric analysis and PCSA calculations require a full-dimensional analysis. Here, exemplary segmentation of internal and external ICM is demonstrated. While ultrasound-based volume calculation and layer thickness measurements (24, 26) were previously performed, those provide values including non-discriminating ICM groups. Here, manual segmentation enabled group-specific measurements with regard to single fascicle properties. This approach may advance the reconstruction of fascicle volume and length proportionally scale with calculated PCSA values, comparable in both ICM groups. Knowledge about PCSA enables estimation of fascicle force vectors and even summed up whole ICM group values of an ICS. This approach advances the reconstruction of biomechanics in respiratory motion and thoracic stabilization in multidimensional digital simulations and improves the understanding of pathophysiological mechanisms. The latter is addressed in studies about rib fracture displacements with worsening over time (5), which may be enhanced by the regionally involved function of ICM. Knowledge about the force-generating potential (PCSA value determination) facilitates the comprehensive analysis of musculoskeletal interactions.
To precisely assess the biomechanical forces of muscle fascicles or groups, detailed information about their distribution is obligatory but is currently not provided. Coronal T1W and T2W as well as T2W para-axial images provide sufficient resolution of internal ICM and were examined in ICS 2 and 3 to assess the interfascicular distance of five adjacent fascicles. Slight value variabilities between coronal and para-axial image-assessment were observed, with greater values in para-axial analysis. Nonetheless, the mean values remain comparable when including standard deviations, demonstrating a mean interfascicular distance of approximately 3.31 mm of parasternal internal ICM. Spatial distribution values provide insight into muscular ICS organization and refine the assessment of ICS-dependent PCSA calculations.
When comparing qualitative differences between T1W and T2W coronal image evaluations, a general qualitatively greater inter-patient variability was observed in T1W, particularly in topographic orientation measurements. Determined angles of T1W were largely consistent with those obtained from T2W images. A limitation of standardized T1W coronal sequences was the greater slice thickness in MRIs, which diminished the clear identification of external ICM and their layers. Furthermore, generally high standard deviation values of fascicle length and volume can be attributed to distinct causes: assigned technical parameters of voxel size, variations in intercostal space diameters depending on the parasternal thorax, variable muscle architecture, and minimal movements caused by heartbeat and breathing leading to discrepancies between imaging sequences. Thus, future studies may adjust parameters accordingly.
Our presented data provides a first approach to adequately identify and measure ICM fascicles in MRI. While we cannot provide a gold standard, we aim to complement the anatomical knowledge. Future studies with larger cohorts may integrate the data and procedure provided to develop generalizable standard segmentation, which could include semiautomated and automated segmentation methods. Further improvements of ICM muscle segmentation could be achieved by the transverse mask propagation method, which enables the semiautomated extension of manually delineated masks across adjacent MRI slices (38, 39). As this propagation method depends on intensity and shape similarity, its reliability for isolating single ICM fascicles remains to be validated, particularly given the limited separability of adjacent muscle layers within ICM groups as addressed in this study. In addition, graph-based random walk algorithms (40) provide a probabilistic framework in which each voxel is represented as a node within a weighted graph, allowing segmentation boundaries to be inferred based on intensity similarity and spatial connectivity. This method can yield anatomically coherent and robust delineations even in the presence of low contrast, when complemented by sufficient muscle geometric values such as fiber orientation, spatial configuration, and volume. To prevent misclassification of the slight structural boundaries of individual ICM fascicles, the automated segmentation should be subjected to subsequent manual validation. Alternatively, the atlas-based registration approach (41, 42), which utilizes anatomically annotated reference datasets that are aligned to individual scans, enables the transfer of muscle labels from a database to new images. Nonetheless, atlas-based segmentation renders a validation with ICM fascicles concerning robustness, reproducibility, and anatomical precision. The presented muscle segmentation method is based on objectively conducted MRI scans comprising defined voxel volumes, which are identified and processed in an automated computational framework (3D Slicer), and provides an initial approach to manually segment ICM, focusing on anatomical precision. All in all, semiautomated and automated segmentation requires precise anatomical knowledge prior to its application, which is currently unavailable in the literature. The presented data are of high significance for future studies, where an objective and standardized method for muscle segmentation could be further elaborated. To enable even better reproducibility and reliability of manual segmentation, subsequent studies could use an interrater reliability metric (e.g., Dice or Jaccard coefficients) in addition to another rater.
Overall, MRI-based assessment of anatomical ICM properties offers a complementary and objective method to extract multiple morphological and physiological parameters from a single dataset with high spatial resolution. This approach not only enables detailed characterization of individual intercostal muscle groups in healthy individuals but also provides a methodological foundation for comparative analyses in pathological conditions, such as neuromuscular dysfunction, chronic respiratory diseases, or post-traumatic alterations of the thoracic wall. Supplementation with semiautomated or automated segmentation methods indicates a promising direction toward objective and scalable approaches with reduced observer bias and improved cross-study comparability. Quantified and validated ICM characteristics integrated in a physiological context improve pathophysiology-oriented research studies significantly. Ultimately, the incorporation of such imaging-based assessments into clinical or translational research workflows may support the development of patient-specific therapeutic strategies and enhance biomechanical modeling of thoracic function in both health and disease.
Data availability statement
The data analyzed in this study are subject to the following licenses/restrictions: the data that support the findings of this study are not openly available due to reasons of sensitivity and are available from the corresponding author upon reasonable request. Requests to access these datasets should be directed tobGF1cmEuc3RlaW5ncnViZXJAbWVkLnVuaS1hdWdzYnVyZy5kZQ==.
Ethics statement
The studies involving humans were approved by Ludwigs-Maximilian-Universität München. The studies were conducted in accordance with the local legislation and institutional requirements. Written informed consent for participation was not required from the participants or the participants' legal guardians/next of kin because the data was completely anonymized and retrospectively collected after routinely conducted clinical trials.
Author contributions
LS: Conceptualization, Data curation, Formal analysis, Project administration, Validation, Visualization, Writing – original draft, Writing – review & editing. PR: Conceptualization, Data curation, Investigation, Methodology, Software, Validation, Writing – original draft, Writing – review & editing. MH: Conceptualization, Formal analysis, Validation, Writing – review & editing. PM: Conceptualization, Formal analysis, Writing – review & editing. SR: Formal analysis, Supervision, Validation, Writing – review & editing. MK: Conceptualization, Formal analysis, Supervision, Validation, Writing – review & editing.
Funding
The author(s) declared that financial support was not received for this work and/or its publication.
Acknowledgments
We would like to thank the radiologists Lorenz Ertl and Amadeus Altenburger of “ÜBAG Radiology Augsburg-Friedberg,” Augsburg, Germany, for excellent technical and diagnostic expertise.
Conflict of interest
The author(s) declared that this work was conducted in the absence of any commercial or financial relationships that could be construed as a potential conflict of interest.
Generative AI statement
The author(s) declared that generative AI was not used in the creation of this manuscript.
Any alternative text (alt text) provided alongside figures in this article has been generated by Frontiers with the support of artificial intelligence, and reasonable efforts have been made to ensure accuracy, including review by the authors wherever possible. If you identify any issues, please contact us.
Publisher's note
All claims expressed in this article are solely those of the authors and do not necessarily represent those of their affiliated organizations, or those of the publisher, the editors and the reviewers. Any product that may be evaluated in this article, or claim that may be made by its manufacturer, is not guaranteed or endorsed by the publisher.
References
1. Liebsch C, Graf N, Appelt K, Wilke HJ. The rib cage stabilizes the human thoracic spine: an in vitro study using stepwise reduction of rib cage structures. PLoS One. (2017) 12(6):e0178733. doi: 10.1371/journal.pone.0178733
2. Chan JS, Mann LM, Doherty CJ, Angus SA, Thompson BP, Devries MC, et al. The effect of inspiratory muscle training and detraining on the respiratory metaboreflex. Exp Physiol. (2023) 108(4):636–49. doi: 10.1113/ep090779
3. Pietton R, David M, Hisaund A, Langlais T, Skalli W, Vialle R, et al. Biomechanical evaluation of intercostal muscles in healthy children and adolescent idiopathic scoliosis: a preliminary study. Ultrasound Med Biol. (2021) 47(1):51–7. doi: 10.1016/j.ultrasmedbio.2020.09.011
4. Fowler TT, Taylor BC, Bellino MJ, Althausen PL. Surgical treatment of flail chest and rib fractures. J Am Acad Orthop Surg. (2014) 22(12):751–60. doi: 10.5435/jaaos-22-12-751
5. Bauman ZM, Grams B, Yanala U, Shostrom V, Waibel B, Evans CH, et al. Rib fracture displacement worsens over time. Eur J Trauma Emerg Surg. (2021) 47(6):1965–70. doi: 10.1007/s00068-020-01353-w
6. Seok J, Jeong ST, Yoon SY, Lee JY, Kim S, Cho H, et al. Novel nomogram for predicting paradoxical chest wall movement in patients with flail segment of traumatic rib fracture: a retrospective cohort study. Sci Rep. (2023) 13(1):20251. doi: 10.1038/s41598-023-47700-w
7. Sermonesi G, Bertelli R, Pieracci FM, Balogh ZJ, Coimbra R, Galante JM, et al. Surgical stabilization of rib fractures (SSRF): the WSES and CWIS position paper. World J Emerg Surg. (2024) 19(1):33. doi: 10.1186/s13017-024-00559-2
8. Vana PG, Neubauer DC, Luchette FA. Contemporary management of flail chest. Am Surg. (2014) 80(6):527–35. doi: 10.1177/000313481408000613
9. Schulz-Drost S, Kloesel S, Kühling JC, Ekkernkamp A, Bakir MS. Combined disruption of the thoracic spine and costal arch fracture: an indicator of a severe chest trauma. Diagnostics (Basel). (2022) 12(9):2206. doi: 10.3390/diagnostics12092206
10. Yokoyama Y, Kodesho T, Kato T, Nakao G, Saito Y, Taniguchi K. Effect of chest mobilization on intercostal muscle stiffness. Curr Res Physiol. (2022) 5:429–35. doi: 10.1016/j.crphys.2022.10.002
11. Gürün Kaya A, Öz M, Erol S, Arslan F, Çiledağ A, Kaya A. Intercostal muscle function during noninvasive ventilation and acute hypercapnic respiratory failure. Respir Care. (2024) 69(8):982–9. doi: 10.4187/respcare.11676
12. Fauroux B, Griffon L, Amaddeo A, Stremler N, Mazenq J, Khirani S. Respiratory management of children with spinal muscular atrophy (SMA). Arch Pediatr. (2020) 27(7S):7S29–34. doi: 10.1016/s0929-693x(20)30274-8
13. Formenti P, Umbrello M, Dres M, Chiumello D. Ultrasonographic assessment of parasternal intercostal muscles during mechanical ventilation. Ann Intensive Care. (2020) 10(1):120. doi: 10.1186/s13613-020-00735-y
14. Dres M, Dubé BP, Goligher E, Vorona S, Demiri S, Morawiec E, et al. Usefulness of parasternal intercostal muscle ultrasound during weaning from mechanical ventilation. Anesthesiology. (2020) 132(5):1114–25. doi: 10.1097/aln.0000000000003191
15. Casha AR, Camilleri L, Manché A, Gatt R, Attard D, Gauci M, et al. External rib structure can be predicted using mathematical models: an anatomical study with application to understanding fractures and intercostal muscle function. Clinical Anatomy (New York, N.Y.). (2015) 28(4):512–9. doi: 10.1002/ca.22513
16. Yoshida R, Tomita K, Kawamura K, Setaka Y, Ishii N, Monma M, et al. Investigation of inspiratory intercostal muscle activity in patients with spinal cord injury: a pilot study using electromyography, ultrasonography, and respiratory inductance plethysmography. J Phys Ther Sci. (2021) 33(2):153–7. doi: 10.1589/jpts.33.153
17. Fu C, Xia Y, Wang B, Zeng Q, Pan S. MRI T2 mapping and shear wave elastography for identifying main pain generator in delayed-onset muscle soreness: muscle or fascia? Insights Imaging. (2024) 15(1):67. doi: 10.1186/s13244-024-01619-6
18. LeBlanc A, Lin C, Shackelford L, Sinitsyn V, Evans H, Belichenko O, et al. Muscle volume, MRI relaxation times (T2), and body composition after spaceflight. J Appl Physiol. (2000) 89(6):2158–64. doi: 10.1152/jappl.2000.89.6.2158
19. Muzic SI, Paoletti M, Solazzo F, Belatti E, Vitale R, Bergsland N, et al. Reproducibility of manual segmentation in muscle imaging. Acta Myol. (2021) 40(3):116–23. doi: 10.36185/2532-1900-052
20. Fedorov A, Beichel R, Kalpathy-Cramer J, Finet J, Fillion-Robin JC, Pujol S, et al. 3D Slicer as an image computing platform for the quantitative imaging network. Magn Reson Imaging. (2012) 30(9):1323–41. doi: 10.1016/j.mri.2012.05.001
21. Bartschat NI, Fatemi N, Westermann R, Davison J, Goetz JE, Paulson AC, et al. Changes in muscle volume and composition after treatment of hip dysplasia with periacetabular osteotomy. Iowa Orthop J. (2021) 41(2):34–9. 34924868
22. Franettovich Smith MM, Elliott JM, Al-Najjar A, Weber KA 2nd, Hoggarth MA, Vicenzino B, et al. New insights into intrinsic foot muscle morphology and composition using ultra-high-field (7-tesla) magnetic resonance imaging. BMC Musculoskelet Disord. (2021) 22(1):97. doi: 10.1186/s12891-020-03926-7
23. Martin ML, Travouillon KJ, Fleming PA, Warburton NM. Review of the methods used for calculating physiological cross-sectional area (PCSA) for ecological questions. J Morphol. (2020) 281(7):778–89. doi: 10.1002/jmor.21139
24. Yoshida R, Tomita K, Kawamura K, Nozaki T, Setaka Y, Monma M, et al. Measurement of intercostal muscle thickness with ultrasound imaging during maximal breathing. J Phys Ther Sci. (2019) 31(4):340–3. doi: 10.1589/jpts.31.340
25. Hodges PW, Gandevia SC. Pitfalls of intramuscular electromyographic recordings from the human costal diaphragm. Clin Neurophysiol. (2000) 111(8):1420–4. doi: 10.1016/S1388-2457(00)00341-2
26. Wallbridge P, Parry SM, Das S, Law C, Hammerschlag G, Irving L, et al. Parasternal intercostal muscle ultrasound in chronic obstructive pulmonary disease correlates with spirometric severity. Sci Rep. (2018) 8(1):15274. doi: 10.1038/s41598-018-33666-7
27. Cappello M, de Troyer A. Interaction between left and right intercostal muscles in airway pressure generation. J Appl Physiol. (2000) 88(3):817–20. doi: 10.1152/jappl.2000.88.3.817
28. Fayssoil A, Behin A, Lofaso F, Fernandez G, Stojkovic T. High parasternal intercostal muscle thickening associated with diaphragm dysfunction in myofibrillar myopathy: a case study. Respir Med Case Rep. (2023) 41:101788. doi: 10.1016/j.rmcr.2022.101788
29. MacBean V, Jolley CJ, Sutton TG, Deep A, Greenough A, Moxham J, et al. Parasternal intercostal electromyography: a novel tool to assess respiratory load in children. Pediatr Res. (2016) 80(3):407–14. doi: 10.1038/pr.2016.89
30. Bolsterlee B, D’Souza A, Herbert RD. Reliability and robustness of muscle architecture measurements obtained using diffusion tensor imaging with anatomically constrained tractography. J Biomech. (2019) 86:71–8. doi: 10.1016/j.jbiomech.2019.01.043
31. De Troyer A, Kirkwood PA, Wilson TA. Respiratory action of the intercostal muscles. Physiol Rev. (2005) 85(2):717–56. doi: 10.1152/physrev.00007.2004
32. Zhang G, Chen X, Ohgi J, Jiang F, Sugiura S, Hisada T. Effect of intercostal muscle contraction on rib motion in humans studied by finite element analysis. J Appl Physiol. (2018) 125(4):1165–70. doi: 10.1152/japplphysiol.00995.2017
33. Khabyuk J, Pröls F, Draga M, Scaal M. Development of ribs and intercostal muscles in the chicken embryo. J Anat. (2022) 241(3):831–45. doi: 10.1111/joa.13716
34. Szczygieł E, Blaut J, Zielonka-Pycka K, Tomaszewski K, Golec J, Czechowska D, et al. The impact of deep muscle training on the quality of posture and breathing. J Mot Behav. (2018) 50(2):219–27. doi: 10.1080/00222895.2017.1327413
35. Zhang G, Chen X, Ohgi J, Miura T, Nakamoto A, Matsumura C, et al. Biomechanical simulation of thorax deformation using finite element approach. Biomed Eng Online. (2016) 15:18. doi: 10.1186/s12938-016-0132-y
36. Csapo R, Malis V, Sinha U, Du J, Sinha S. Age-associated differences in triceps surae muscle composition and strength – an MRI-based cross-sectional comparison of contractile, adipose and connective tissue. BMC Musculoskelet Disord. (2014) 15(1):209. doi: 10.1186/1471-2474-15-209
37. Pinel S, Kelp NY, Bugeja JM, Bolsterlee B, Hug F, Dick TJM. Quantity versus quality: age-related differences in muscle volume, intramuscular fat, and mechanical properties in the triceps surae. Exp Gerontol. (2021) 156:111594. doi: 10.1016/j.exger.2021.111594
38. Decaux N, Conze PH, Ropars J, He X, Sheehan FT, Pons C, et al. Semi-automatic muscle segmentation in MR images using deep registration-based label propagation. Pattern Recognit. (2023) 140. doi: 10.1016/j.patcog.2023.109529
39. Zheng Q, Delingette H, Duchateau N, Ayache N. 3-D Consistent and robust segmentation of cardiac images by deep learning with spatial propagation. IEEE Trans Med Imaging. (2018) 37(9):2137–48. doi: 10.1109/TMI.2018.2820742
40. Baudin PY, Azzabou N, Carlier PG, Paragios N. Prior knowledge, random walks and human skeletal muscle segmentation. Med Image Comput Comput Assist Interv. (2012) 15:569–76. doi: 10.1007/978-3-642-33415-3_70
41. Del Re EC, Gao Y, Eckbo R, Petryshen TL, Blokland GA, Seidman LJ, et al. A new MRI masking technique based on multi-atlas brain segmentation in controls and schizophrenia: a rapid and viable alternative to manual masking. J Neuroimaging. (2016) 26(1):28–36. doi: 10.1111/jon.12313
Keywords: fascicle distribution, intercostal muscle fascicle, manual segmentation, MRI, muscle volume, physiological cross-sectional area, topographic orientation
Citation: Steingruber L, Ruess P, Hammer M, Moll P, Raab S and Koch M (2026) Feasibility of magnetic resonance imaging manual segmentation of human intercostal muscles: a morphological analysis approach. Front. Musculoskelet. Disord. 3:1677352. doi: 10.3389/fmscd.2025.1677352
Received: 31 July 2025; Revised: 11 December 2025;
Accepted: 11 December 2025;
Published: 12 January 2026.
Edited by:
Donnie Cameron, Radboud University Medical Centre, NetherlandsReviewed by:
Nicolau Beckmann, Novartis Institutes for BioMedical Research, SwitzerlandChristian Bohringer, UC Davis Medical Center, Sacramento, United States
Copyright: © 2026 Steingruber, Ruess, Hammer, Moll, Raab and Koch. This is an open-access article distributed under the terms of the Creative Commons Attribution License (CC BY). The use, distribution or reproduction in other forums is permitted, provided the original author(s) and the copyright owner(s) are credited and that the original publication in this journal is cited, in accordance with accepted academic practice. No use, distribution or reproduction is permitted which does not comply with these terms.
*Correspondence: Laura Steingruber, bGF1cmEuc3RlaW5ncnViZXJAbWVkLnVuaS1hdWdzYnVyZy5kZQ==