


- 1 McMaster Integrative Neuroscience Discovery and Study Program, McMaster University, Hamilton, ON, Canada
- 2 Psychology, Neuroscience & Behaviour, McMaster University, Hamilton, ON, Canada
Neurobiological studies of aging are beginning to link functional changes with a loss of experience-dependent plasticity. In the visual system, age-related functional changes include decreases in visual acuity, orientation selectivity, motion perception, and ocular dominance plasticity. A recent paper has shown that Ube3A, an E3 ubiquitin ligase that is absent in Angelman’s syndrome, is required for experience-dependent plasticity during development of the visual cortex. Knocking out Ube3A during development leads to rigidity of ocular dominance plasticity that is strikingly similar to the reduced plasticity seen in older animals. Furthermore, ubiquitin ligases have been linked with age-related neurodegenerative disorders and longevity. Ubiquitin ligases selectively mark proteins for degradation, and a balance between synaptic proteins and their degradation is important for neural transmission and plasticity. This led us to ask whether normal aging is characterized by a loss of Ube3A in the cortex. We used Western blot analysis in order to quantify Ube3A expression across the life span of humans, macaque monkeys, and cats. We found that Ube3A expression declines across the lifespan in human, monkey, and cat cortex. The losses were substantial (50–80%) in all areas studied which includes V1, V3, V4, frontal, and auditory cortex. In addition, when compared with other synaptic proteins there was a selective loss of Ube3A in human cortex. The progressive loss of Ube3A expression during cortical aging is an important new finding. Furthermore, the selective loss of Ube3A in human cortex highlights a specific vulnerability in human brain aging that may signify a dramatic shift in cortical function and plasticity.
Introduction
A common way of describing the behavior of older adults is that they are more rigid and set in their ways. The wide range in sensory and cognitive functional changes that accompany normal, healthy aging are suggestive of widespread cortical dysfunction. Neurobiological studies are beginning to link these functional changes and common descriptions with a loss of experience-dependent plasticity that reflects age-related changes in synaptic plasticity mechanisms (Burke and Barnes, 2006 ). In the visual system, age-related changes include perceptual changes in luminance, color, motion, and texture (Faubert, 2002 ), and neurophysiological loss of orientation tuning (Schmolesky et al., 2000 ) and ocular dominance plasticity (Sato and Stryker, 2008 ). The common explanation for these changes is a loss of GABA-mediated inhibition in the aging visual cortex because application of GABA to visual cortical neurons reinstates normal receptive field tuning properties (Leventhal et al., 2003 ). But many changes occur at the aging synapse (Wong et al., 2000 ; Bai et al., 2004 ), and it is likely that more than just one synaptic mechanism contributes to visual deficits in aging. Recent studies have highlighted the important role of ubiquitin-mediated degradation of proteins at the synapse as a potent mechanism for changing synaptic structure and function (DiAntonio and Hicke, 2004 ), and the loss of ubiquitin ligases in neurodegeneration (Ardley and Robinson, 2004 ). Yet, little has been known about changes in the expression of ubiquitination machinery in human cortex across the lifespan into normal, healthy aging.
Ube3A, an E3 ubiquitin ligase, is absent in the neurodevelopmental disorder, Angelman’s syndrome, leading to mental retardation early in life (Kishino et al., 1997 ). A recent study has shown that Ube3A is necessary for experience-dependent ocular dominance plasticity during development (Yashiro et al., 2009 ). Ube3A knockout mice are resistant to the synaptic plasticity that underlies monocular deprivation driven changes in ocular dominance. This rigidity of synapses is strikingly similar to the reduced experience-dependent plasticity seen in older animals, who also show no shift in ocular dominance patterns when challenged with monocular deprivation (Sato and Stryker, 2008 ).
Neuronal activity interacts with ubiquitination pathways to regulate synaptic structure and function in response to changes in synaptic activity; for example, by facilitating the functional reorganization of the synapse by remodeling the post-synaptic density composition (Ehlers, 2003 ). Furthermore, disruptions in ubiquitination pathways are linked with specific neurodegenerative diseases including Alzheimer’s and Parkinson’s disease (Ardley and Robinson, 2004 ). Finally, a recent study has shown that an E3 ligase homologous to Ube3A is necessary for caloric restriction to extend longevity (Carrano et al., 2009 ). It is clear that an appropriate balance between synaptic proteins determines synaptic efficacy and function, and thus a controlled regulation between their synthesis and degradation is important for maintaining normal synaptic transmission and plasticity (Cline, 2003 ). Taken together, these results led us to ask whether normal aging in visual cortex is characterized by a loss of Ube3A at the synapse.
To better understand age-related changes in Ube3A expression in the visual cortex we quantified expression levels in tissue samples from macaque monkey, cat, and human visual cortex. In addition, we compared changes in primary visual cortex with extrastriate areas, auditory, and frontal cortex. We found a progressive loss of Ube3A expression in visual cortex during aging that was similar for the three species and cortical areas. Furthermore, our findings reveal a selective age-related loss of Ube3A in human cortex that becomes apparent at the transition into old age and may signify a loss of cortical plasticity.
Materials and Methods
Tissue Collection
Human cortical tissue samples were obtained from the Brain and Tissue Bank for Developmental Disorders at the University of Maryland (Baltimore, MD, USA). Tissue samples were obtained within 24 h postmortem. The occipital lobe was dissected according to gyral and sulcal landmarks. The samples were from close to the posterior pole of the left hemisphere of human primary visual cortex, including both superior and inferior portions of the calcarine fissure. At the Brain and Tissue Bank the left hemisphere was sectioned coronally, rinsed with water, blotted dry, placed in a quick-freeze bath (dry ice and isopentane), and stored frozen (−70°C). Samples were from 28 individuals ranging in age from 20 days to 79 years of age (Table 1 ). The individuals had no history of neurological or mental health disorders.
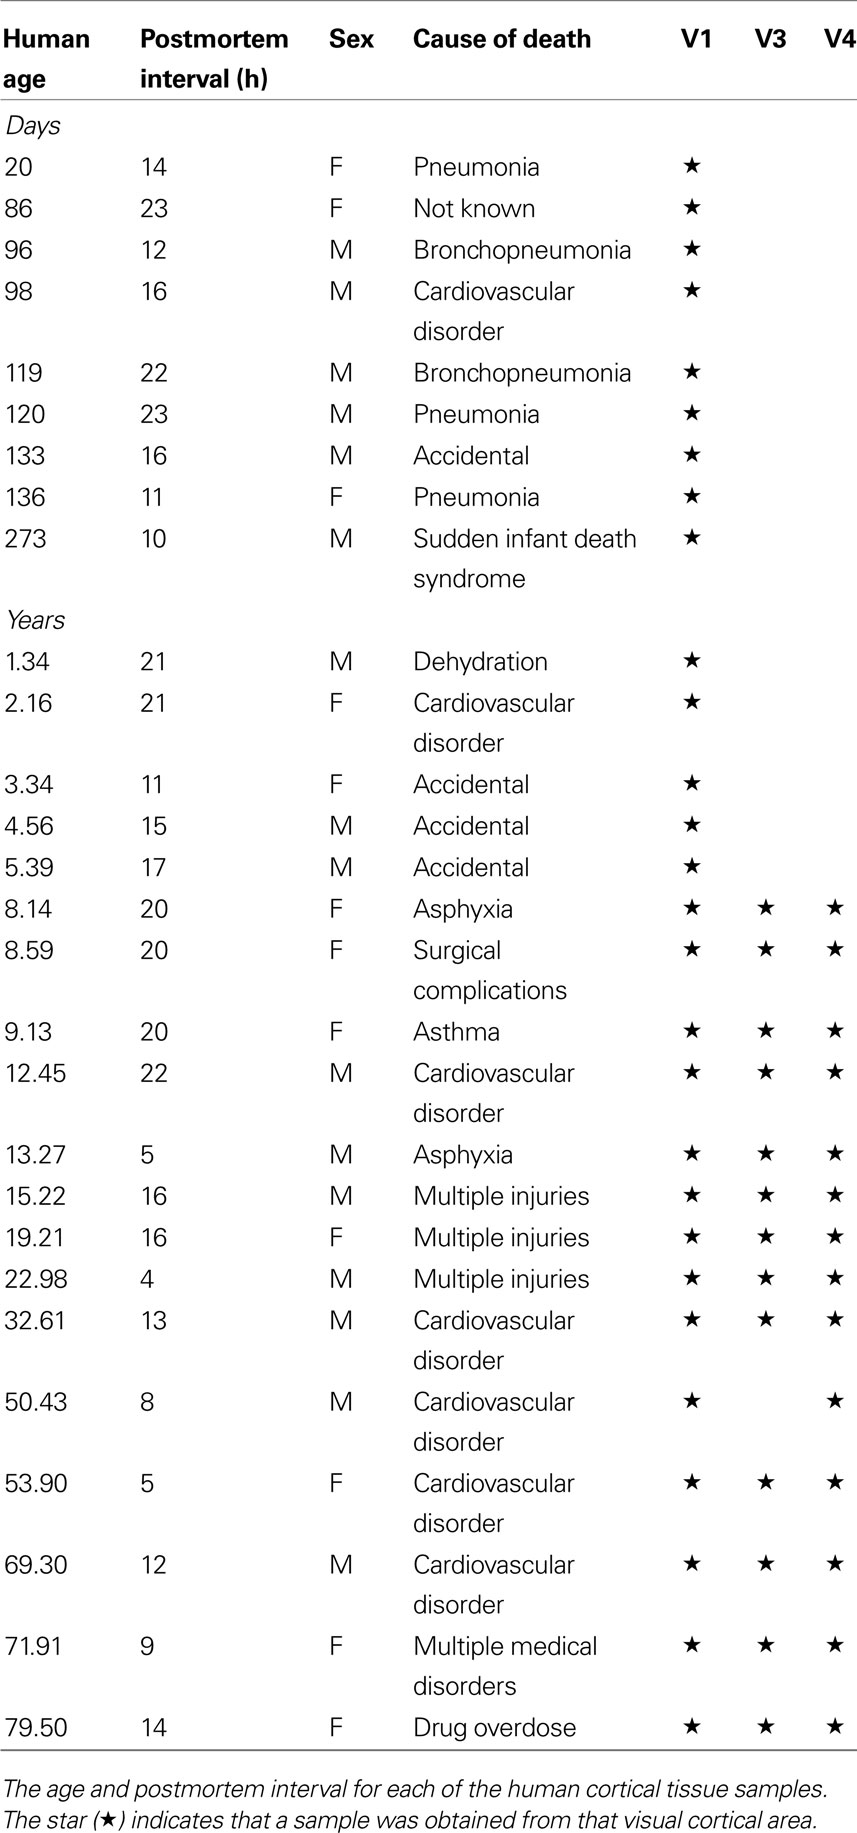
Table 1. Human tissue samples.
Macaque monkey tissue samples were obtained from the Alzheimer’s Research Center at the Medical College of Georgia (Augusta, GA, USA). Samples were from eight macaque monkeys, ranging in age from 4 to 33 years old (Table 2 ). The right hemisphere was removed, cut into thick coronal sections, fresh frozen, and stored at −80°C. The sections used were from the posterior pole of the hemisphere including primary visual cortex (V1) and extrastriate areas V3a and V4v.
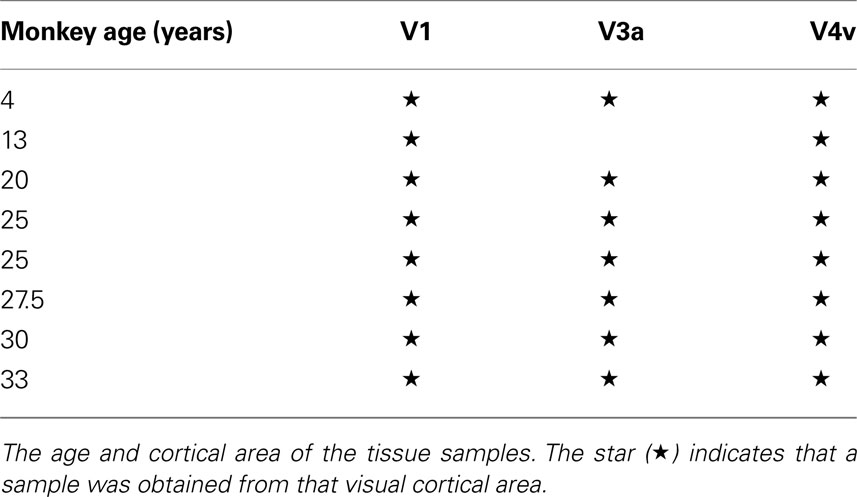
Table 2. Monkey tissue samples.
Cat tissue samples were obtained from seven animals, ranging in age from 2.5 to 11 years old (Table 3 ). Samples were collected from primary visual cortex (V1), frontal cortex, and auditory cortex (A1). Cats were euthanized with Euthanol (165 mg/kg), and transcardially perfused with cold 0.1 M PBS (4°C; 80–100 ml/min) until the circulating fluid was cleared. The brain was quickly removed from the skull and immersed in cold PBS. To facilitate quantification of regional differences within V1, the area was divided into a series of small tissue samples (approximately 2 × 2 mm) covering the central, peripheral, and monocular visual field representations (Tusa et al., 1978 ). For each cat, two samples of both central and peripheral and one from the monocular visual field representation were used. Each cortical tissue sample was rapidly frozen on dry ice and stored at −80°C.
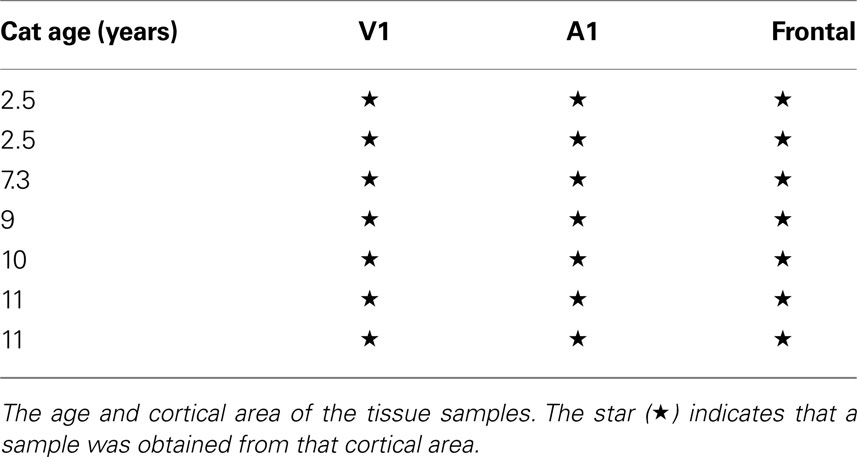
Table 3. Cat tissue samples.
All experimental procedures were approved by the McMaster University Animal Research Ethics Board and the McMaster Human Research Ethics Board.
Tissue Sample Preparation
Pieces of tissue (50–100 mg) were cut from the coronal sections of human and macaque monkey cortex using the gyral and sulcal pattern to identify primary visual cortex (V1), presumptive areas V3a, and V4v. For the cat the whole 2 × 2 mm pieces of tissue samples were used to prepare the samples for Western blotting. Samples were suspended in cold homogenization buffer (1 ml buffer:50 mg tissue, 0.5 mM DTT, 1 mM EDTA, 2 mM EGTA, 10 mM HEPES, 10 mg/l leupeptin, 100 nM microcystin, 0.1 mM PMSF, 50 mg/l soybean trypsin inhibitor) and homogenized using a glass-glass Dounce tissue homogenizer. A portion of the homogenate was removed, the remainder was then subjected to a subcellular fractionation procedure in order to enrich for synaptic proteins. Remaining homogenate was taken up with a 3-ml syringe, where it was passed through a 5-μm pore hydrophillic filter (Millipore, Billerica, MA, USA). The filtered product was then centrifuged for 10 minutes at ×1000g. Supernatant was removed, leaving a pellet enriched for synaptic proteins, the synaptoneurosome. The pellet, homogenate, and supernatant were then re-suspended in 100 μl of 1% boiling SDS and then stored at −20°C. Protein concentrations were determined using bicinchoninic acid (BCA) assay guidelines (Pierce, Rockford, IL, USA). Samples from cat were synaptoneurosome preparations, while human and macaque samples were homogenate preparations.
Immunoblotting
Samples (25 μg) were separated on polyacrylamide (SDS–PAGE) mini-gels (Precise Protein Gels) (Pierce Biotechnology Inc, Rockford, IL, USA) and transferred to polyvinylidene difluoride (PVDF-FL) (Millipore, Billerica, MA, USA) membranes. Each sample was run twice. Blots were pre-incubated in blocking buffer (Odyssey Blocking Buffer 1:1 with PBS) for 1 hour (Li-cor Biosciences; Lincoln, NE, USA), after which blots were incubated in primary antibody overnight at 4°C using the following concentrations: Ube3A (E6AP), 1:1000; (Bethyl Laboratories, Montgomery, TX, USA), Synapsin; 1:8000 (Invitrogen, Carlsbad, CA, USA), Synaptophysin; 1:2000 (Sigma, St. Louis, MO, USA), PSD95; 1:32,000 (Chemicon International, Temecula, CA, USA), Gephyrin; 1:2000 (Imgenex, San Diego, CA, USA), GAPDH; 1:4000 (Imgenex, San Diego, CA, USA). The blots were washed with phosphate buffer saline containing 0.05% Tween (Sigma, St. Louis, MO, USA) (PBS-T) (3 × 10 min), incubated (1 h, room temperature) with the appropriate IRDye labeled secondary antibody, (Anti-Mouse, 1:8000, Anti-Rabbit, 1:10,000) (Li-cor Biosciences, Lincoln, NE, USA), and washed in PBS-T (3 × 10 min). The blots were visualized using the Odyssey scanner (Li-cor Biosciences, Lincoln, NE, USA). The IRDye secondary antibodies and Odyssey scanner system have a wide linear dynamic range so that strong and weak bands could be accurately quantified on the same blot. The blots were stripped and prepared to be reprobed with additional antibodies (Blot Restore Membrane Rejuvenation kit, Chemicon International, Temecula, CA, USA).
Analysis
To analyze the expression levels we scanned the blots (Odyssey Infrared Scanner) and quantified the bands using densitometry (Li-cor Odyssey Software version 3.0; Li-cor Biosciences; Lincoln, NE, USA). Density profiles were determined by performing a subtraction of the background, integrating the pixel intensity across the area of the band, and dividing the intensity by the width of the band to control for variations in band size. GAPDH normalization was used as the loading control and for each sample expression of the synaptic proteins was divided by GAPDH expression. We verified that GAPDH expression was not correlated with age for any of the groups (all p-values were > 0.15) and thus was an appropriate loading control for this study. A control sample (a mixture of all the samples) was run on all of the gels and the density of each sample was measured relative to that control (sample density/control density).
We plotted scattergrams of Ube3A expression that included both the average expression level for each case and every point from all runs. To facilitate comparing the pattern of changes the results were normalized to the average for young adults. For humans, the young adult average was calculated from the 19-, 22-, and 32-year-old samples. For cats, the 2.5-year-old samples, and for macaque monkeys, the 4-year-old samples. To help describe the pattern of change in expression across the lifespan a weighted average curve was fit to Ube3A expression using the locally weighted least squares method (dotted lines).
In order to quantify changes in Ube3A expression relative to a collection of other synaptic proteins, we calculated an index of Ube3A to the average of four other synaptic proteins ((Ube3A-Other)/(Ube3A + Other)). The other synaptic proteins were synapsin, synaptophysin, PSD-95, and gephyrin.
Statistical comparisons of differences in Ube3A expression levels between young vs old adults (human: young – 19–32 years, old – 50–79 years; macaque monkey: young – 4–13 years, old – 20–33 years; cat: young – 2.5 years, old – 7–11 years) were calculated using Wilcoxon Mann–Whitney and Kruskal–Wallis non-parametric analysis of variance.
Results
In this study, we characterized the expression of E3 ubiquitin ligase, Ube3A, in three different species: humans, macaque monkeys, and cats. These species are commonly used to study perceptual and neurobiological changes in the aging visual system. Using Western blot analysis, we quantified the developmental trajectory of Ube3A expression across the lifespan. We measured expression in primary visual cortex (V1), because it is has been shown that Ube3A is required for experience-dependent plasticity in visual cortex (Yashiro et al., 2009 ). In the cat, we took samples from different regions of V1, to examine whether Ube3A might play a role in the loss of peripheral vision that occurs in normal aging (Sekuler et al., 2000 ). In the monkey and human, we took additional samples from dorsal (V3/V3a) and ventral (V4) visual processing streams. In the cat, we took additional samples from auditory and frontal cortex to examine Ube3A expression in other sensory and non-sensory cortical areas. Finally, to understand the expression of Ube3A in the context of other synaptic proteins over the lifespan, we quantified the expression of synapsin, synaptophysin, gephyrin, and PSD-95.
The human tissue samples were collected over a range of postmortem intervals (4–23 h), but we found no significant correlation between postmortem interval and expression of any of the proteins examined (all ps > 0.1): Ube3A (R = 0.23), GAPDH (R = 0.02), Synapsin (R = 0.22), Synaptophysin (R = 0.04), Gephyrin (R = 0.29), and PSD-95 (R = 0.08).
Changes in Ube3A Expression in Primary Visual Cortex (V1)
In human primary visual cortex (V1), we measured expression of Ube3A across the lifespan using Western blot analysis. No previous studies have examined the normal pattern of Ube3A expression in human V1, although other studies have shown that the loss of Ube3A expression during development leads to mental retardation (Angelman’s syndrome), and later disruptions in ubiquitin-mediated proteasomal degradation are linked with neurodegenerative disorders. We plotted Ube3A expression as a function of age (range from 20 days to 80 years), normalized relative to the expression level of young adults (19–32 years old) and fit with a locally weighted average curve (Figure 1 ). The average Ube3A expression in human V1 was relatively constant in children, teenagers, and young adults, but there was substantial inter-individual variability in Ube3A expression at these younger ages. After the young adult years (>mid 30 s) there was a clear loss of Ube3A expression with aging; Ube3A expression in older adults (>50 years) fell to about 50% of the younger adult levels (p < 0.01). For the oldest case (79 years), the loss of Ube3A expression was substantial, with about 85% less expression relative to young adult levels. In addition, there was much less inter-individual variability in older adults.
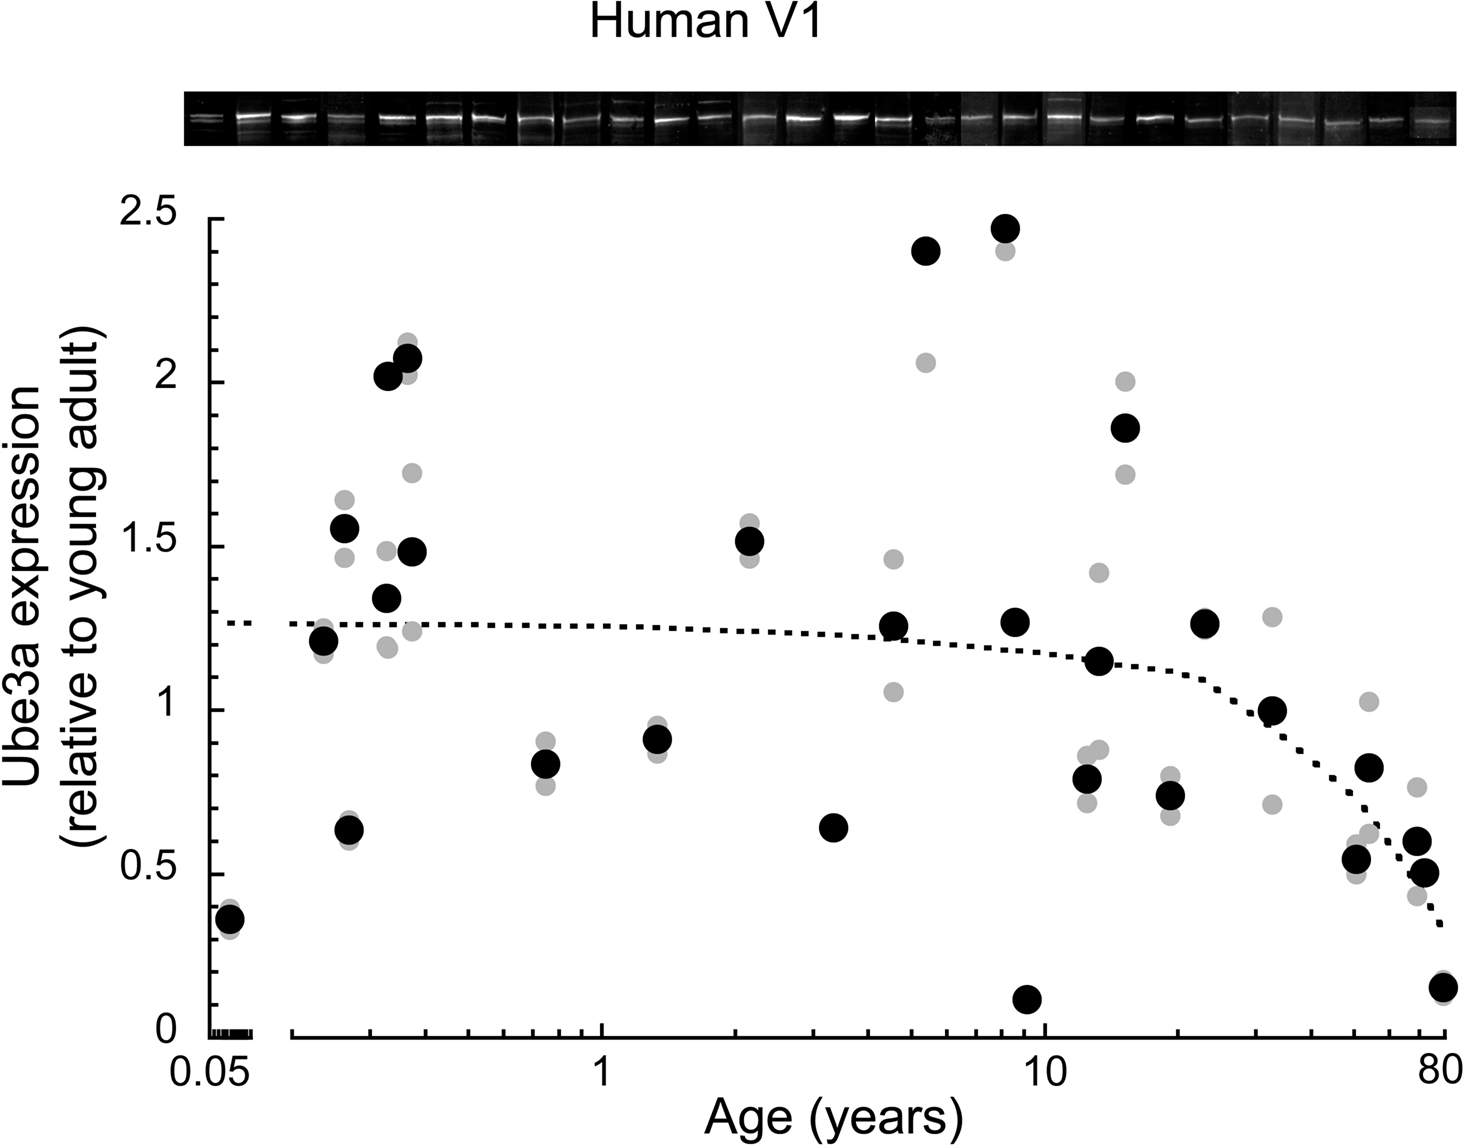
Figure 1. Ube3A expression level in human primary visual cortex across the lifespan. Expression levels are relative to young adults, and a weighted average was fit. Gray symbols indicate values from individual runs, black symbols represent the average between runs. Age is plotted on a logarithmic scale. Representative Western blots are pictured above. Expression was relatively constant through childhood to teenage to young adult levels. There was a clear loss of Ube3A in aging when expression fell nearly 50% from young adult levels (p < 0.01). In the oldest case (79 years) expression fell approximately 85%.
In macaque monkey V1, we quantified changes in Ube3A, and compared expression levels in young and older adults. The Ube3A expression levels were plotted relative to young adult expression, and a locally weighted average curve was fit to the data (Figure 2 A). There was a significant loss (approximately 25% ± 5%) of Ube3A expression (p < 0.05) in old monkeys (>20 years), though, this loss was less than that found for human V1. The loss of Ube3A in aging monkey V1 occurred between 13 and 20 years of age when expression dropped by 25% and then remained at that level.
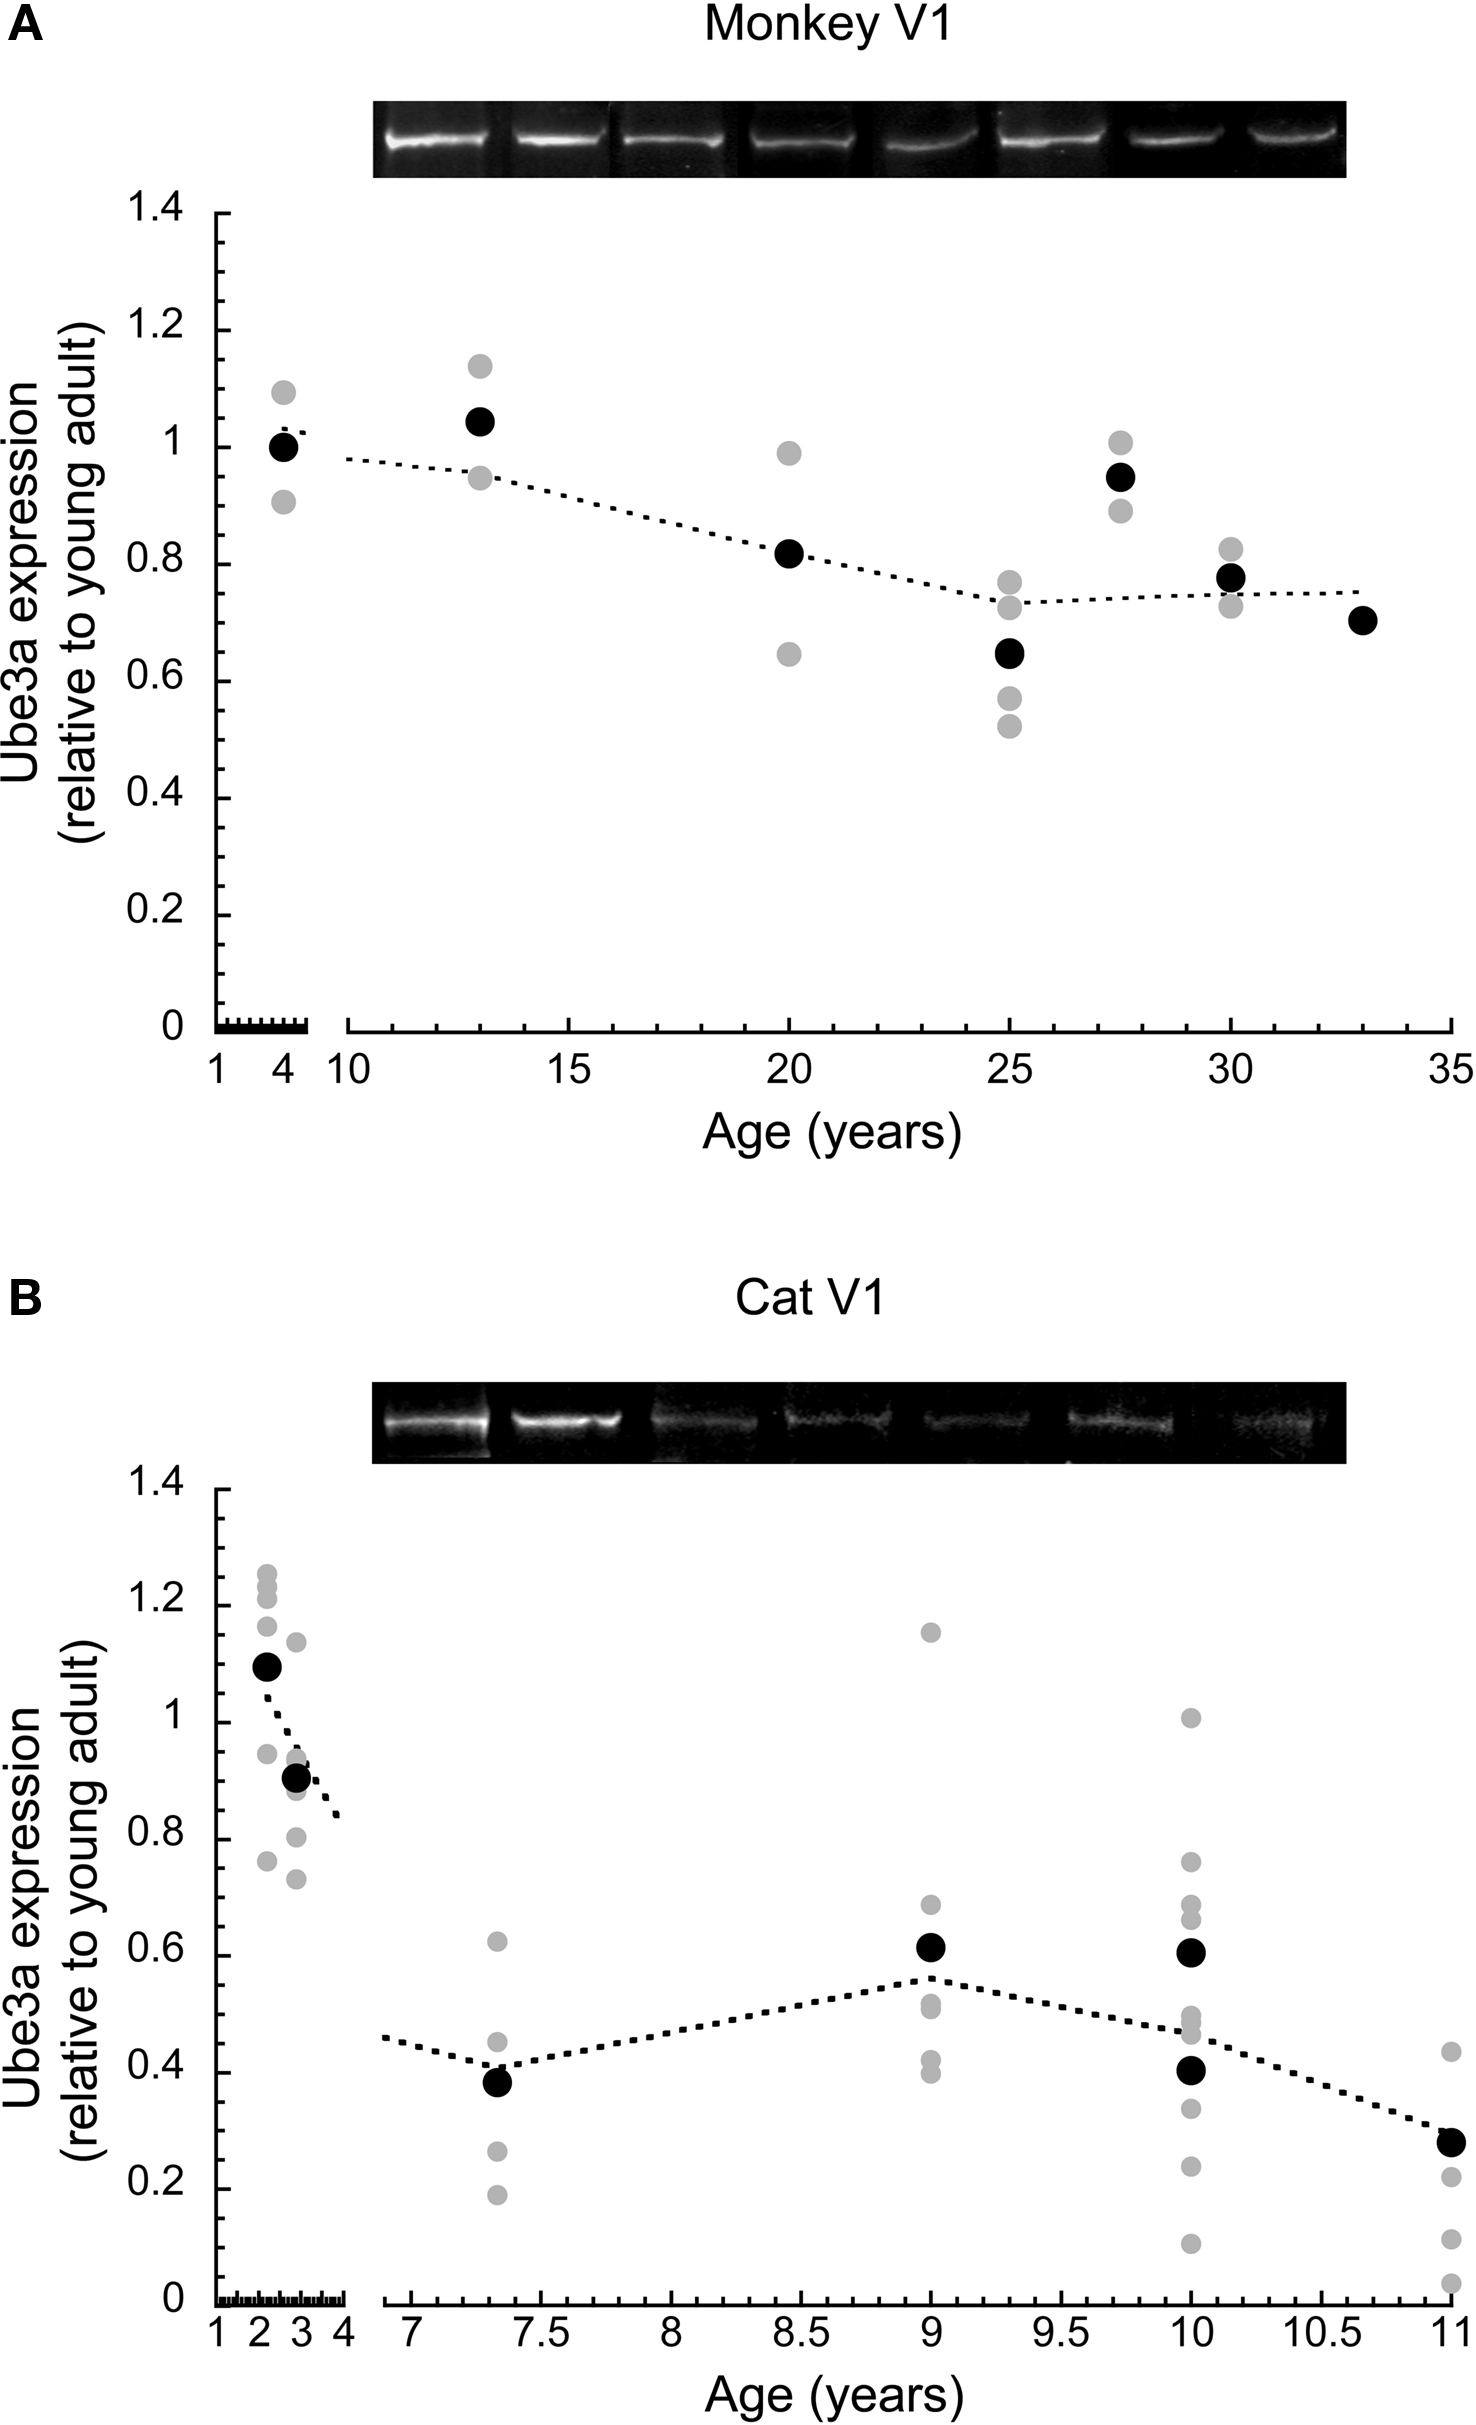
Figure 2. Ube3A expression level in primary visual cortex across the lifespan of cat and macaque monkey. Expression levels are relative to young adults, and a weighted average was fit. Gray symbols indicate values from individual runs, black symbols represent the average between runs. Representative Western blots are pictured above. In monkey, expression fell approximately 25% (p < 0.05) in old monkeys (>20 years). This occurred between 13 and 20 years of age (A). In cat, expression fell approximately 45% during aging (p < 0.001). This occurred between 2.5 and 7 years of age (B).
In cat V1, we quantified changes in Ube3A expression using multiple samples from different regions of V1, anticipating the possibility of regional differences related to the loss of peripheral vision in aging. Despite this expectation, we found no significant differences in Ube3A expression at any age between samples from parts of V1 that represent the central, peripheral, or monocular visual field (p > 0.1). Therefore, Ube3A expression from all regions of cat V1 were combined, normalized relative to the young adult cat level (2.5 years), and fit with a locally weighted average curve (Figure 2 B). We found a substantial loss of Ube3A expression after 2.5 years of age (p < 0.001). In cat V1, Ube3A expression levels fell an average of 45% (±7%) during aging. The magnitude of the age-related loss of Ube3A expression in cat V1 was greater than monkeys and comparable to the loss found in older human V1.
Changes in Ube3A Expression in Extrastriate Areas V3 and V4
To examine whether there were age-related losses of Ube3A expression in extrastriate visual areas we quantified expression in areas V3 and V4v of macaque monkey and human cortex. These areas represent early stages in the dorsal (V3) and ventral visual streams (V4v). The Ube3A expression levels were plotted relative to young adult expression, and a weighted average was fit to the data (Figure 3 ).
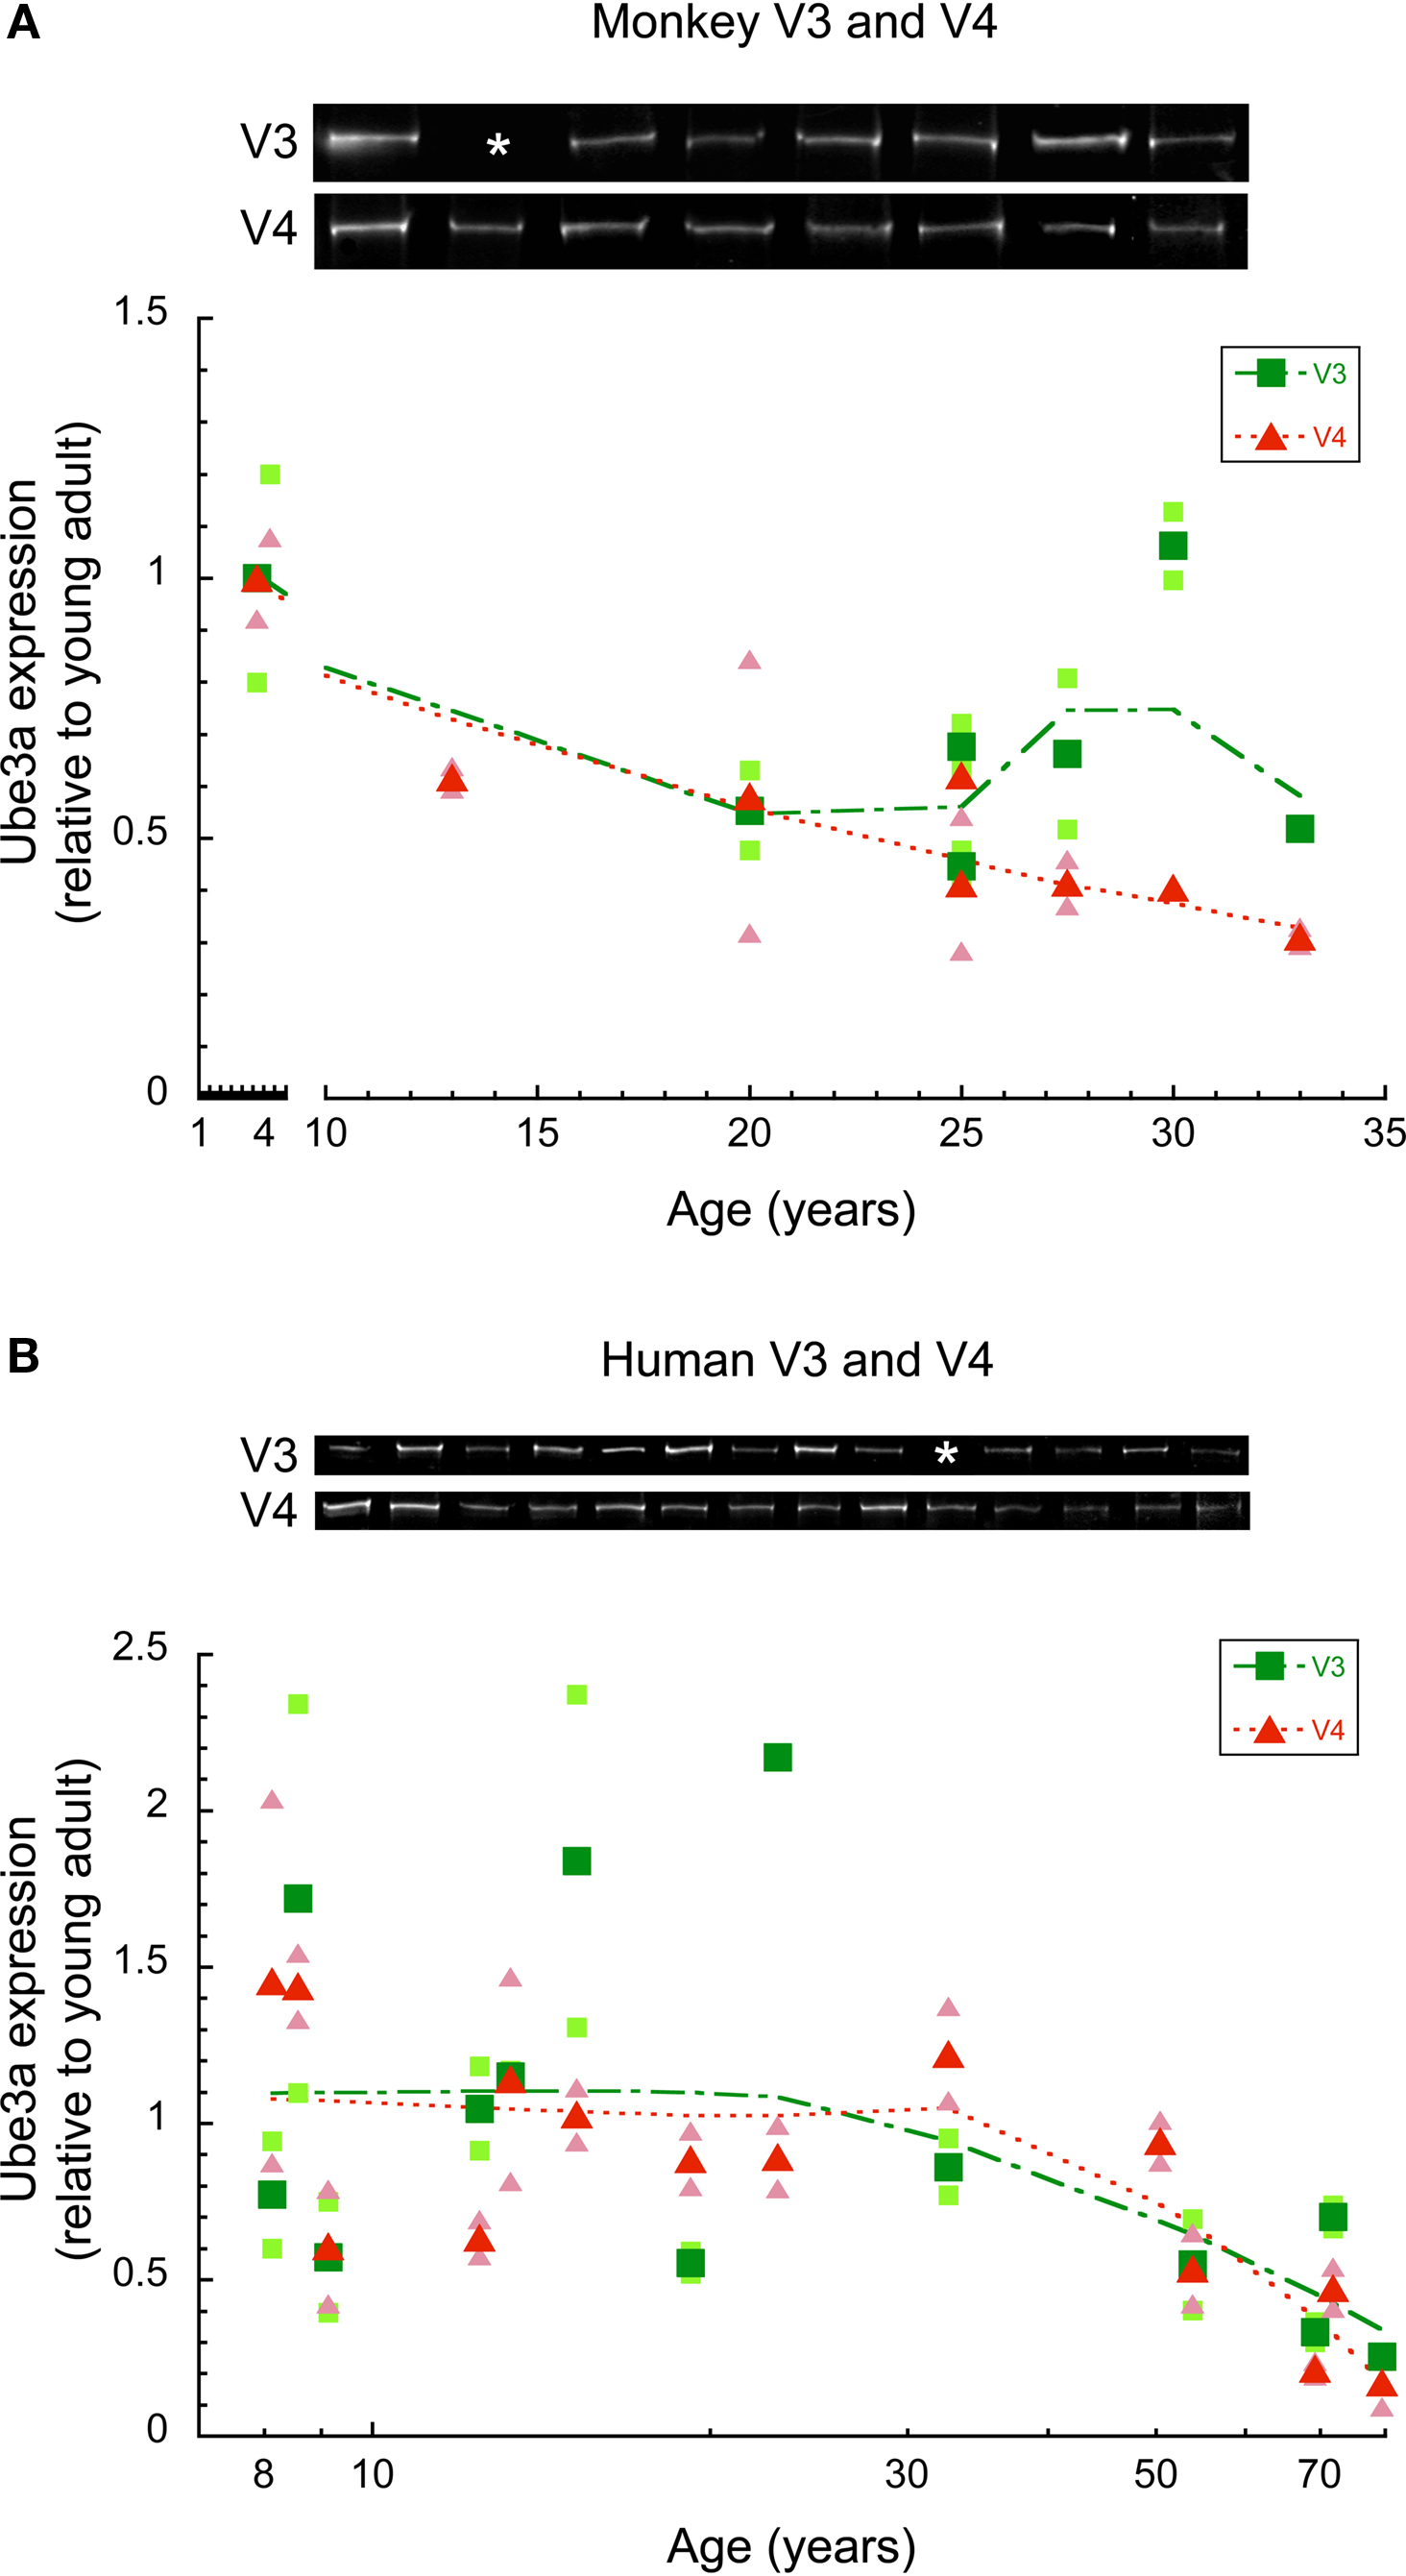
Figure 3. Ube3A expression in V3 and V4 of human and macaque monkey. Expression levels are relative to young adults, and a weighted average was fit. The larger green squares represent V3 and the larger red triangles represent V4. Individual runs are represented in the corresponding lighter shades. Age is plotted on a logarithmic scale for human V3, V4. Representative Western blots are pictured above. White asterisks indicate that no sample was acquired for that age. In monkey V3, there was no significant difference between young (4 year old) and older monkeys (<20 years). In monkey V4, Ube3A expression steadily declined during aging falling on average by 55% in older monkeys (p < 0.05) (A). In human, Ube3A expression in both V3 and V4 remained relatively constant through childhood to teenage to young adult. There was a steady loss into aging (p < 0.05) (B).
In monkey V3, there was no significant difference in Ube3A expression between the young (4 year old) and older monkeys (>20 years). Closer inspection of the results (Figure 3 A) showed that one older monkey (30 years) had no loss, but the expression levels for the other five older monkeys had declined by about 50% (p < 0.06). In monkey V4, Ube3A expression declined steadily during aging (Figure 3 A) falling an average of 55% (p < 0.05). The loss of Ube3A in monkey V4 was about twice as large as the loss in V1, and it occurred by 13 years of age, which was earlier than the onset of the loss in monkey V1.
The analysis of Ube3A expression in human V3 and V4 included samples covering ages from 8 to 80 years of age. The Ube3A expression levels in both V3 and V4 were relatively constant through childhood, teenage, young adults years (Figure 3 B). Similar to the expression pattern in V1, there was substantial inter-individual variability in Ube3A expression in areas V3 and V4 for these younger cases. After the young adult years there was a steady loss of Ube3A expression in both V3 (p < 0.05) and V4 (p < 0.01) of human cortex (Figure 3 B) and less inter-individual variability. When compared to the young adults, the Ube3A expression in V3 and V4 of the oldest case (79 years) had fallen by 75–80%.
Ube3A Expression in Auditory and Frontal Cortex
In cat auditory and frontal cortex, we quantified the expression of Ube3A in order to determine whether other sensory and non-sensory cortical areas had age-related losses similar to V1. Ube3A expression was plotted relative to young adult (2.5 years) expression, and a locally weighted average curve was fit to the data (Figure 4 ). In auditory cortex, the loss of Ube3A began between 7.5 and 9 years of age, when it dropped about 60% (±8%) relative to young adult cat levels (p < 0.01). In frontal cortex Ube3A expression had already declined by 7.5 years of age and continued to decline in the older cats. Expression of Ube3A in older cat frontal cortex was about 60% (±10%) less than levels in young adults (p < 0.05). In both frontal and auditory cortex, the magnitude of the loss was comparable to the loss in cat V1.
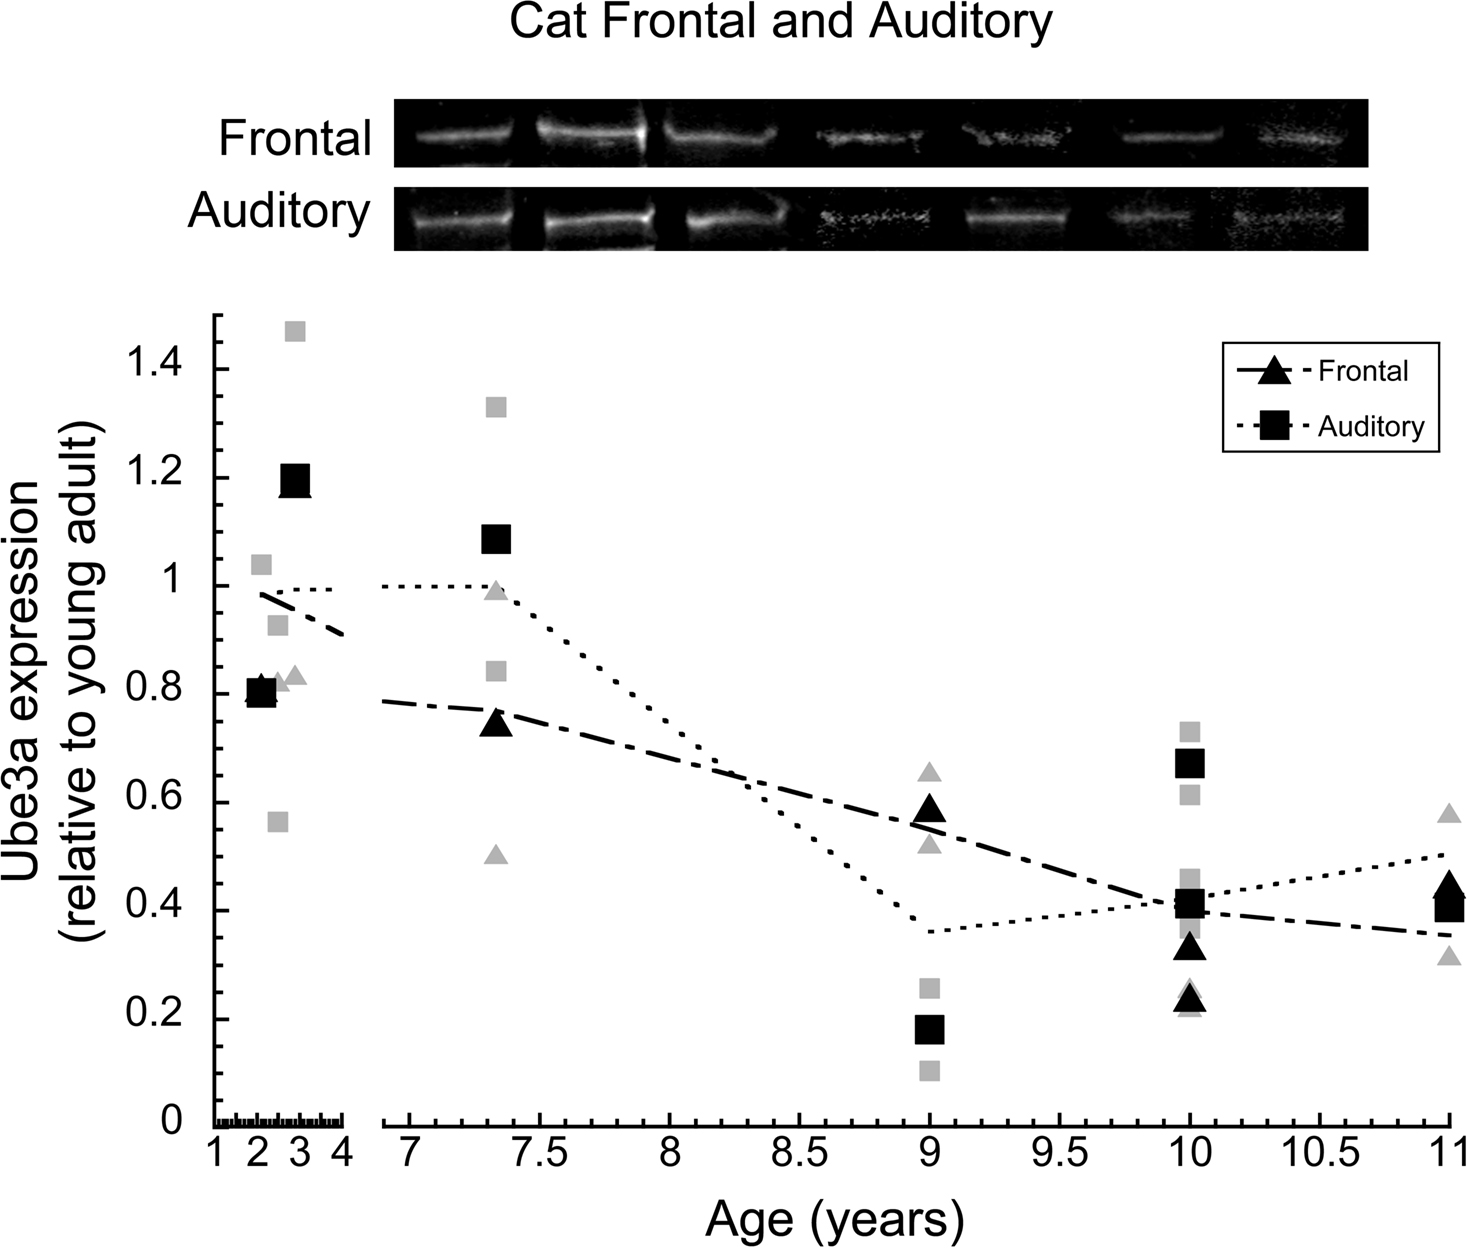
Figure 4. Ube3A expression in frontal and auditory cortex of cat. Expression levels are relative to young adults, and a weighted average was fit. The larger black triangles represent frontal cortex and the larger black squares represent auditory cortex. Individual runs are represented in the corresponding gray symbols. Representative Western blots are pictured above. Expression in frontal cortex began to decline after 2.5 years of age and continued to decline in aging where it fell by approximately 60% (p < 0.05). Expression in auditory cortex began to decline after 7.5 years where it fell by approximately 60% (p < 0.05). Expression at age 2.5 for both auditory and frontal cortex was so similar the symbols completely overlap.
Ube3A Expression Relative to other Synaptic Proteins
To address whether the age-related losses we observed were specific to Ube3A expression, or reflected a more general loss of synaptic proteins, we calculated an index of Ube3A expression relative to the expression of four other synaptic proteins (synapsin, synaptophysin, gephyrin, PSD-95). For this index, positive values indicate relatively more Ube3A and negative values indicate less Ube3A relative to the other synaptic proteins.
In monkey V1, there was no selective loss of Ube3A relative to the other synaptic proteins (Figure 5 A). The index remained close to 0, indicating that Ube3A expression and the other synaptic proteins were roughly balanced across younger and older monkeys. A similar pattern was observed for cat auditory and frontal cortex (Figure 5 B) with a slight trend towards less relative Ube3A expression in aging. A different pattern was found for cat V1, where at the oldest age (11 years) there was a significant loss of Ube3A relative to the other synaptic proteins (p < 0.05), dropping by an average of 40% (Figure 5 C). This indicates a selective loss of Ube3A during aging of cat V1.
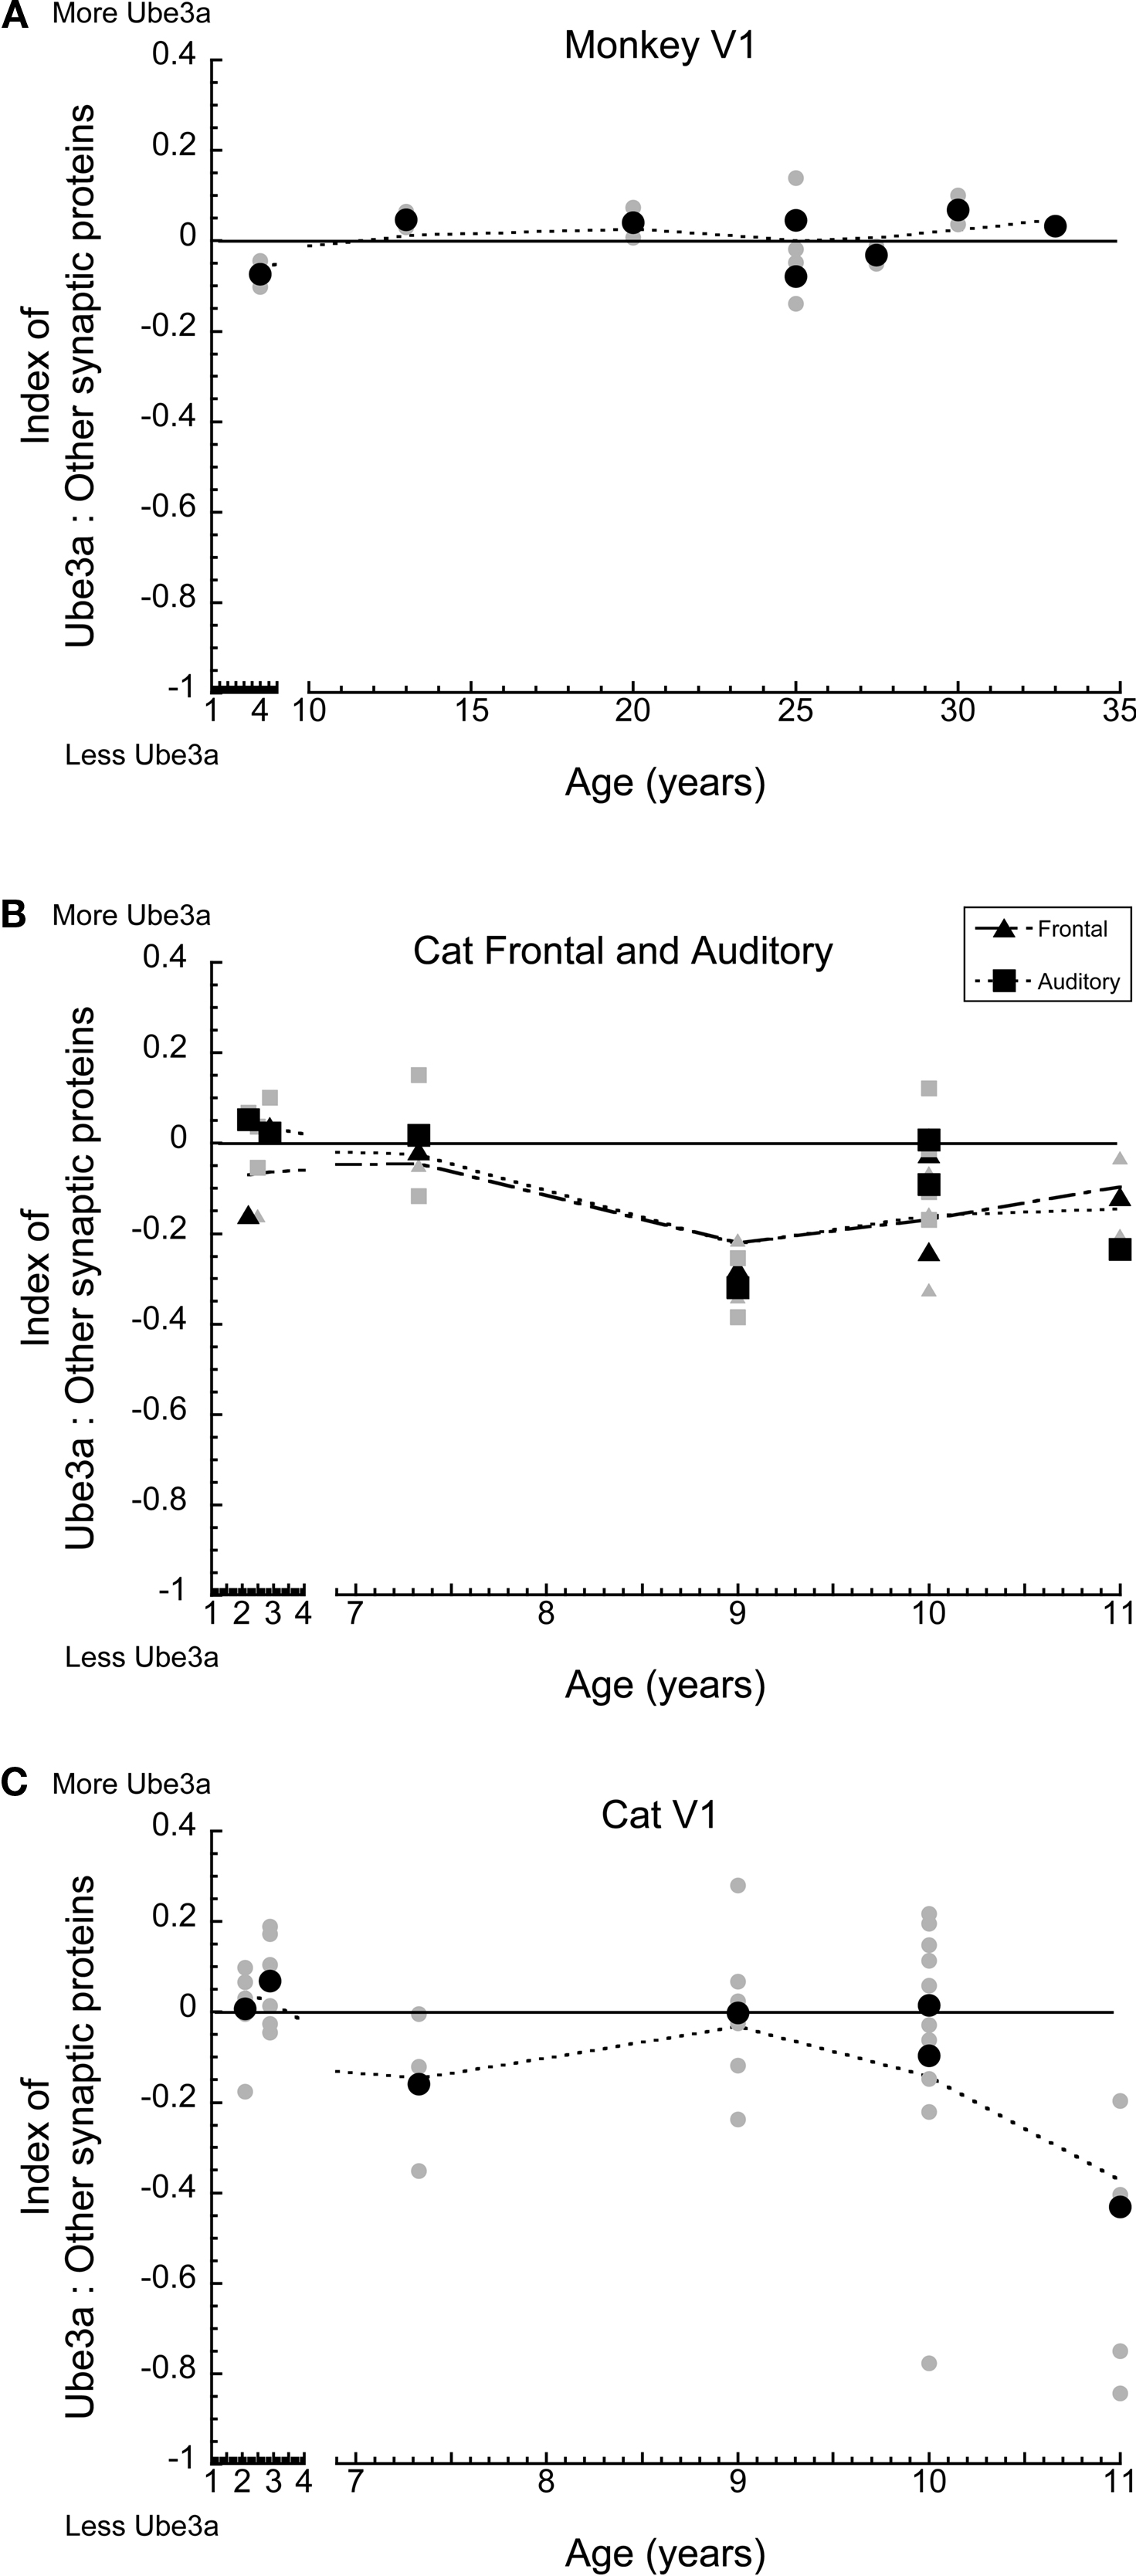
Figure 5. Index between Ube3A and other synaptic proteins (synapsin, gephyrin, PSD-95) for macaque monkey V1, cat frontal and auditory cortex, and V1. Positive values indicate relatively more Ube3A expression, negative values indicate relatively less Ube3A expression. Gray symbols indicate values from individual runs, black symbols represent the average between runs. A weighted average was fit to the data. In monkey V1, there was no selective loss in Ube3A (A). Both frontal and auditory cortex showed a slight trend towards relatively less Ube3A expression with age (B). In V1, there was a significant loss of Ube3A in the oldest cat (11 years of age) relative to other synaptic proteins, dropping on average 40% (p < 0.05) (C).
In human V1, there was a clear developmental change in the expression of Ube3A relative to other synaptic proteins (Figure 6 A). At the youngest ages (<1 year), there was more Ube3A; in children through to pre-teen years, Ube3A expression was roughly in balance with other synaptic proteins; in teens and young adults, relative Ube3A expressions dropped slightly, and then fell off substantially in aging (p < 0.0001). A very similar pattern was found for human V3 and V4 (Figure 6 B). In teens and young adults, the expression of Ube3A was roughly balanced with expression of other synaptic proteins and then there was a shift to relatively less Ube3A expression in older human V3 and V4 (p < 0.01). These results show a selective loss of Ube3A in human visual areas during aging.
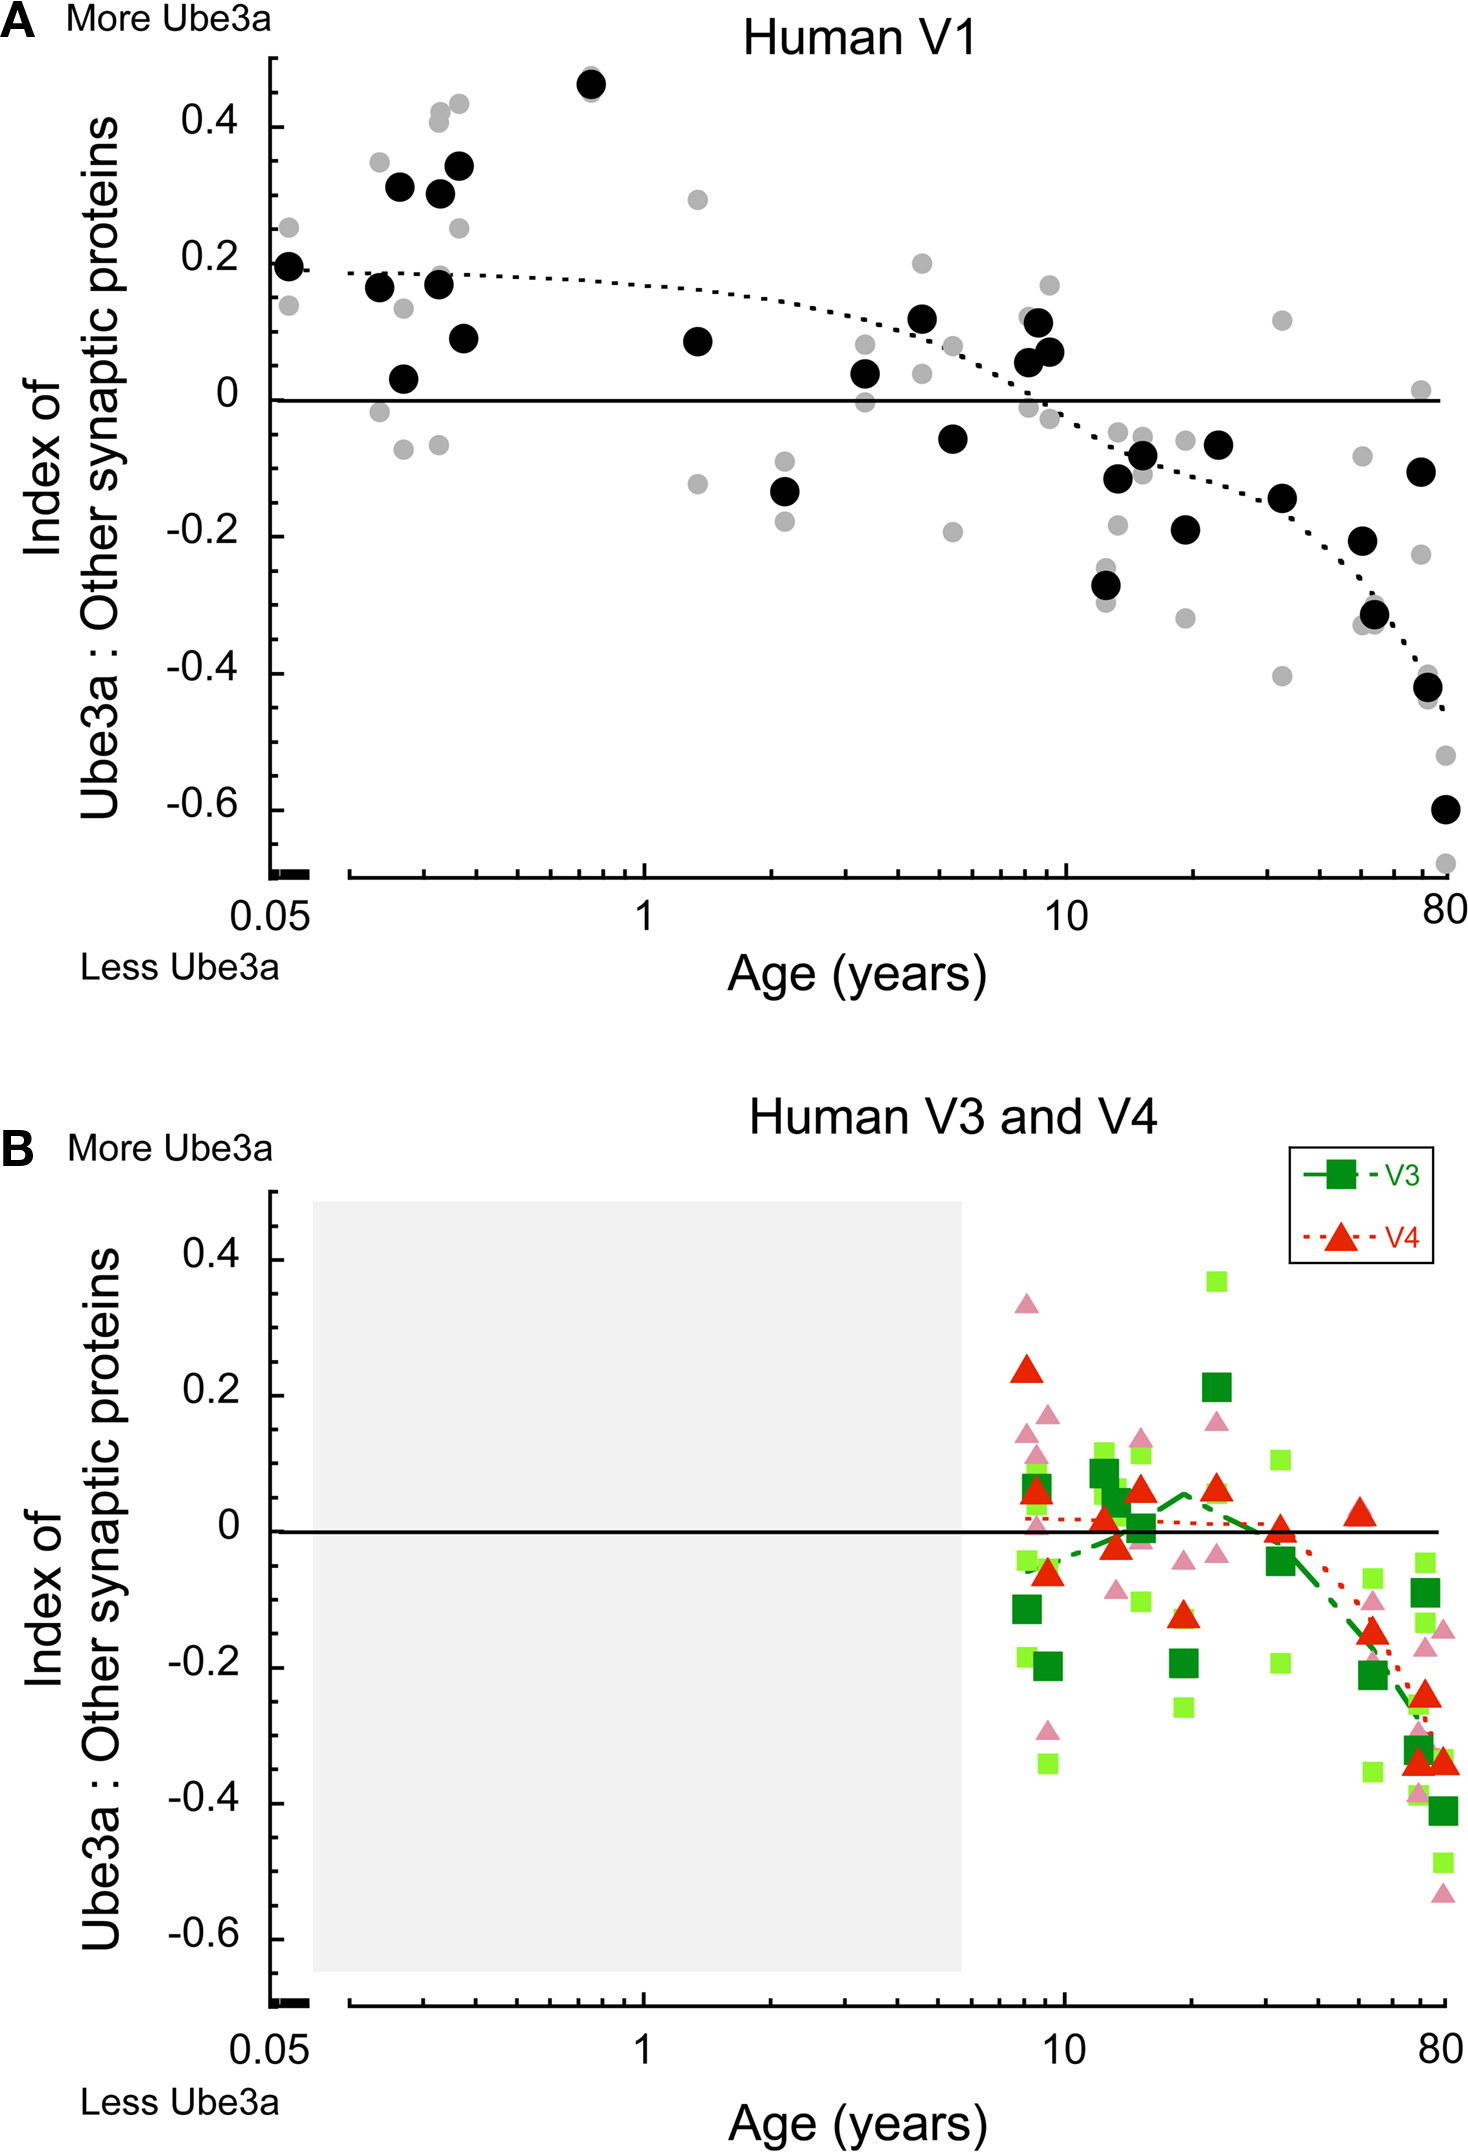
Figure 6. Index between Ube3A and other synaptic proteins (synapsin, gephyrin, PSD95, synaptophysin) in human V1, V3, V4. Positive values indicate relatively more Ube3A expression, negative values indicate relatively less Ube3A expression. The larger green squares represent V3 and the larger red triangles represent V4. Individual runs are represented in the corresponding lighter shades. A weighted average was fit to the data. Age is plotted on a logarithmic scale. The shaded area represented ages we do not have data for. In human V1, at the youngest ages there was more Ube3A, in children to pre-teens the expression was balanced, in teens to young adults it shifts in favor of less Ube3A, and falls off in aging (>50 years old) (p < 0.0001) (A). In V3, V4 expression was balanced in teens and young adults, and fell to less Ube3A in older humans (>50 years old) (p < 0.01) (B).
Discussion
Our study found that Ube3A expression declines across the lifespan in human, monkey, and cat cortex. This occurred in visual areas V1, V3, and V4, as well as frontal and auditory cortex. Moreover, in human areas V1, V3, and V4 there was a much greater loss of Ube3A relative to other synaptic proteins. This is the first study to address how the E3 ubiquitin ligase, Ube3A, changes in healthy aging. Our findings identify a fundamental change in Ube3A expression in the aging cortex and give new insights into age-related changes that lead to the loss of synaptic plasticity.
Ube3A Loss: Similarities and Difference
We have identified many similarities, and a key difference, in age-related changes of Ube3A expression among the cortical areas, animal models, and human cortex. The large number of samples for human V1, ranging from 20 days to 80 years of age, give a comprehensive view of the trajectory of Ube3A expression in human cortex. There was a clear loss of Ube3A expression with aging in all three species and in all cortical areas. A common notion is that the whole synaptic proteome goes down during aging. In the animals models, much of the loss can be explained by a general loss of synaptic proteins. In human cortex, however, there was a selective loss of Ube3A. For human visual cortical areas, the loss of Ube3A was substantially greater than the loss of other synaptic proteins. These results are suggestive of a general cortical pattern of synaptic change that may help to explain age-related functional losses in learning and memory, as well as other sensory systems. A diffuse loss of Ube3A across the human cortex may underlie a common mechanism affecting synaptic plasticity and mediating age-related functional losses. The loss of Ube3A during normal aging may lead to rigid synapses similar to Ube3A KO mice that lack synaptic plasticity (Yashiro et al., 2009 ).
A richer picture of the aging synapse is emerging from recent studies examining changes in synaptic proteins. The pattern of change is one of selective losses rather than a general decline in synaptic proteins. For example, there are selective pre- and post-synaptic changes in GABAergic signaling mechanisms during aging that will affect the functioning of cortical inhibition (Pinto et al., 2010 ). These selective changes at aging synapses have specific implications for dynamic synaptic function, as the relative balance between proteins changes and reduces experience-dependent plasticity.
Ube3A Loss Reduces Experience-Dependent Plasticity
Although Ube3A is required for experience-dependent plasticity during development of the visual cortex (Yashiro et al., 2009 ), the precise role that Ube3A plays is unclear. Ube3A knockout mice have deficits in LTP, despite normal baseline neurotransmission, and they display deficits in context dependent learning (Jiang et al., 1998 ). In addition, the development of dendritic spines is abnormal with fewer spines and abnormal spine morphologies in Ube3A knockout mice (Dindot et al., 2008 ). Together, these results point to a role for Ube3A in local regulation of synaptic plasticity. An important insight into the function of Ube3A comes from studying ocular dominance plasticity in the Ube3A knockout mice (Yashiro et al., 2009 ). They lack ocular dominance plasticity when reared in the light, but when dark reared and then brought into the light, these animals show the typical shift of ocular dominance in response to closing one eye. This experience-dependent plasticity, however, is lost after just a few days in the light and once again the synapses become rigid, unable to adapt to experience (Yashiro et al., 2009 ). Simply using the synapses depletes them of plasticity. This leaves neural connections in the cortex rigid, unable to be fine tuned and to develop normal function. Ube3A mediates plasticity at excitatory synapses by controlling the degradation of Arc which effects the internalization of AMPA receptors. Thus, disrupting Ube3A function causes an increase in Arc expression leading to greater internalization of AMPA receptors and loss of AMPA receptor at excitatory synapses (Greer et al., 2010 ). Perhaps the rigid synapses found in the Ube3A knockout mice are the key to linking the loss of Ube3A expression during normal aging of human cortex with the rigid behaviors that often accompany aging.
Visual Changes in Aging
The time course of loss in Ube3A expression is similar to the decline of visual abilities in aging. There are a wide range of visual deficits in aging which suggests that widespread neural changes occur across the central visual pathway. Certain visual perceptions, however, are more vulnerable to the effects of aging (Faubert, 2002 ; Billino et al., 2008 ). Specifically, the processing of complex visual stimuli declines more than the perception of simple visual stimuli, suggesting that complex neural integration may be more affected by aging (Habak and Faubert, 2000 ). For example, the perception of a moving stimulus that is surrounded by other moving stimuli is particularly affected in aging (Betts et al., 2005 ), raising the possibility that aging affects dynamic neural processing in the visual system. In this framework, the loss of Ube3A during aging may reduce the capacity for experience driven dynamic synaptic changes that are necessary to integrate and adapt physiological response in the visual cortex (Fu et al., 2002 ).
Links Between Ube3A and GABAergic Changes in Aging
The most common explanation for age-related changes in visual perceptual is a loss of GABA-mediated inhibition (Betts et al., 2005 ). This idea comes from studies showing that the direct application of GABA onto cortical neurons improves the neurophysiological responses of individual V1 neurons in senescent monkeys (Leventhal et al., 2003 ). Additionally, the loss of GABA-mediated inhibition in aging is further supported by a loss of GABAergic neurons in visual cortex of older cats (Hua et al., 2008 ), and a loss of specific synaptic components of GABAergic signaling during aging of human visual cortex (Pinto et al., 2010 ). The current findings of a loss of Ube3A, broadens our understanding of the age-related changes in visual cortex by showing synaptic compromises beyond changes in GABAergic signaling mechanisms.
It seems likely that changes at the aging synapse are as complex as those during development. The challenge for understanding aging visual perception will be to determine if particular perceptual losses are linked with specific changes in visual cortical synapses. There are interesting parallels in the development of experience-dependent plasticity between mice lacking GAD65 or Ube3A. Mice lacking GAD65, the enzyme that synthesizes the on-demand pool of GABA, have reduced inhibitory transmission and are insensitive to monocular deprivation (Hensch et al., 1998 ). But ocular dominance plasticity is re-established in GAD65 knockout mice, at any age, by infusion of diazepam into the visual cortex to increase GABA-mediated activity. Similarly, Ube3A knockout mice fail to express ocular dominance plasticity in development, but this plasticity can be restored by dark rearing (Yashiro et al., 2009 ). Perhaps future studies that compare the similarities and differences in experience-dependent plasticity in these mouse models will help to inform our understanding of the functional changes in aging synapses.
What is the Nature of Ube3A Loss in Aging?
While the rigid synaptic plasticity found in Ube3A knockout mice provides a promising model for understanding experience-dependent changes in aging synapses there is an important difference to consider. Plasticity is preserved in Ube3A mice by restricting experience. At first glance, this seems counter to our current thinking that the best way to preserve brain function during aging is to engage in activities to keep the mind active (Fratiglioni et al., 2004 ). Clearly, the age-related loss in Ube3A must be more complex than simply losing Ube3A at all synapses. An intriguing possibility is that age-related Ube3A loss is synapse-specific, and it is lost at some synapses and retained at others. This would lead to a situation where some synapses have reduced capacity for experience-dependent plasticity and become rigid, while others maintain a normal level of plasticity. The changes could be widespread and random, or particular circuits may be more vulnerable to the loss of Ube3A. If the latter is true, then insights into what makes a particular circuit or synapse more likely to lose Ube3A becomes a new and important question for understanding healthy aging. This is particularly interesting in light of a recent study in C. elegans showing that an E3 ligase homologous to Ube3A is necessary for caloric restriction to extend longevity (Carrano et al., 2009 ).
The current results raise questions about what drives the loss of Ube3A in the cortex during aging. It will be important to address this while considering strategies to prevent the loss or increase expression of Ube3A in the aging cortex. The loss may reflect a generalized down-regulation of cellular function and the ubiquitination machinery during aging. It seems likely that this will account for some of the loss but probably not all of it since we found a much greater loss of Ube3A relative to other synaptic proteins in human cortex. Another possibility is that age-related degradation of sensory and/or cognitive functions drives an experience-dependent loss of Ube3A. Two recent studies provide some insights about the impact of experience on Ube3A expression. One study found that enriched experience in adult mice increases Ube3A expression in the hippocampus (Greer et al., 2010 ) while the other study showed that early monocular deprivation does not lead to a loss of Ube3A (Sato and Stryker, 2010 ). These contrasting results indicate that more work is needed to determine the full scope of experience-dependent changes in Ube3A expression in the brain. One possibility is that the role of experience in regulating Ube3A expression changes across the lifespan so that it has greater impact in the adult brain.
The progressive loss of Ube3A expression during cortical aging is an important new finding for understanding age-related losses in experience-dependent synaptic plasticity. Furthermore, the selective loss of Ube3A in human cortex highlights a particular vulnerability in human brain aging that may signify a shift in cortical function and selective loss of synaptic plasticity.
Conflict of Interest Statement
The authors declare that the research was conducted in the absence of any commercial or financial relationships that could be construed as a potential conflict of interest.
Acknowledgments
This research was supported by grants from NSERC and CIHR to KM and DJ. KW is a recipient of a CIHR Master’s Research award. We would like to thank Dr. Jerry Buccafusco for providing visual cortical samples from macaque monkeys.
References
Ardley, H., and Robinson, P. (2004). The role of ubiquitin-protein ligases in neurodegenerative disease. Neurodegener. Dis. 1, 71–87.
Bai, L., Hof, P., Standaert, D., Xing, Y., Nelson, S., Young, A., and Magnusson, K. (2004). Changes in the expression of the NR2B subunit during aging in macaque monkeys. Neurobiol. Aging, 25, 201–208.
Betts, L., Taylor, C., Sekuler, A., and Bennett, P. (2005). Aging reduces center-surround antagonism in visual motion processing. Neuron 45, 361–366.
Billino, J., Bremmer, F., and Gegenfurtner, K. (2008). Differential aging of motion processing mechanisms: evidence against general perceptual decline. Vision Res. 48, 1254–1261.
Burke, S., and Barnes, C. (2006). Neural plasticity in the ageing brain. Nat. Rev. Neurosci. 7, 30–40.
Carrano, A., Liu, Z., Dillin, A., and Hunter, T. (2009). A conserved ubiquitination pathway determines longevity in response to diet restriction. Nature 460, 396–399.
Cline, H. (2003). Synaptic plasticity: importance of proteasome-mediated protein turnover. Curr. Biol. 13, R514–R516.
DiAntonio, A., and Hicke, L. (2004). Ubiquitin-dependent regulation of the synapse. Annu. Rev. Neurosci. 27, 223–246.
Dindot, S., Antalffy, B., Bhattacharjee, M., and Beaudet, A. (2008). The angelman syndrome ubiquitin ligase localizes to the synapse and nucleus, and maternal deficiency results in abnormal dendritic spine morphology. Hum. Mol. Genet. 17, 111–118.
Ehlers, M. (2003). Activity level controls postsynaptic composition and signaling via the ubiquitin-proteasome system. Nat. Neurosci. 6, 231–242.
Fratiglioni, L., Paillard-Borg, S., and Winblad, B. (2004). An active and socially integrated lifestyle in late life might protect against dementia. Lancet Neurol. 3, 343–353.
Fu, Y., Djupsund, K., Gao, H., Hayden, B., Shen, K., and Dan, Y. (2002). Temporal specificity in the cortical plasticity of visual space representation. Science 296, 1999–2003.
Greer, P. L., Hanayama, R., Bloodgood, B. L., Mardinly, A. R., Lipton, D. M., Flavell, S. W., Kim, T. K., Griffith, E. C., Waldon, Z., Maehr, R., Ploegh, H. L., Chowdbury, S., Worley, P. F., Steen, J., and Greenberg, M. E. (2010). The Angelman Syndrome protein Ube3a regulates synapse development by ubiquitinating arc. Cell 140, 704–716.
Habak, C., and Faubert, J. (2000). Larger effect of aging on the perception of higher-order stimuli. Vision Res. 40, 943–950.
Hensch, T. K., Fagiolini, M., Mataga, N., Stryker, M. P., Baekkeskov, S., and Kash, S. F. (1998). Local GABA circuit control of experience-dependent plasticity in developing visual cortex. Science 282, 1504–1508.
Hua, T., Kao, C., Sun, Q., Li, X., and Zhou, Y. (2008). Decreased proportion of GABA neurons accompanies age-related degradation of neuronal function in cat striate cortex. Brain Res. Bull. 75, 119–125.
Jiang, Y. H., Armstrong, D., Albrecht, U., Atkins, C. M., Noebels, J. L., Eichele, G., Sweat, J. D., and Beaudet, A. L. (1998). Mutation of the angelman ubiquitin ligase in mice causes increased cytoplasmic p53 and deficits of contextual learning and long-term potentiation. Neuron 21, 799–811.
Kishino, T., Lalande, M., and Wagstaff, J. (1997). Ube3A/E6-AP mutations cause Angelman syndrome. Nat. Genet. 15, 70–73.
Leventhal, A., Wang, Y., Pu, M., Zhou, Y., and Ma, Y. (2003). GABA and its agonists improved visual cortical function in senescent monkeys. Science 300, 812–815.
Pinto, J. G., Hornby, K. R., Jones, D. G., and Murphy, K. M. (2010). Developmental changes in GABAergic mechanisms in human visual cortex across the lifespan. Front. Cell. Neurosci. (in press).
Sato, M., and Stryker, M. P. (2008). Distinctive features of adult ocular dominance plasticity. J. Neurosci. 28, 10278–10286.
Sato, M., and Stryker, M. P. (2010). Genomic Imprinting of experience-dependent cortical plasticity by the ubiquitin ligase gene Ube3a. Proc. Natl. Acad. Sci. 107, 5611–5616.
Schmolesky, M. T., Wang, Y., Pu, M., and Leventhal, A. G. (2000). Degradation of stimulus selectivity of visual cortical cells in senescent rhesus monkeys. Nat. Neurosci. 3, 384–390.
Sekuler, A. B., Bennett, P. J., and Mamelak, M. (2000). Effects of aging on the useful field of view. Exp. Aging Res. 26, 103–120.
Tusa, R. J., Palmer, L. A., and Rosenquist, A. C. (1978). The retinotopic organization of area 17 (striate cortex) in the cat. J. Comp. Neurol. 177, 213–235.
Wong, T. P., Marchese, G., Casu, M. A., Ribeiro-da-Silva, A., Cuello, A. C., and De Koninck, Y. (2000). Loss of presynaptic and postsynaptic structures is accompanied by compensatory increase in action potential-dependent synaptic input to layer V neocortical pyramidal neurons in aged rats. J. Neurosci. 20, 8596–8606.
Keywords: Ube3A, aging, visual cortex, plasticity, E6AP
Citation: Williams K, Irwin DA, Jones DG and Murphy KM (2010) Dramatic loss of Ube3A expression during aging of the mammalian cortex. Front. Ag. Neurosci. 2:18. doi: 10.3389/fnagi.2010.00018
Received: 04 February 2010;
Paper pending published: 06 March 2010;
Accepted: 19 April 2010;
Published online: 18 May 2010
Edited by:
P. Hemachandra Reddy, Oregon Health and Science University, USAReviewed by:
Benjamin D. Philpot, University of North Carolina, School of Medicine, USAAsgar Zaheer, University of Iowa Hospitals and Clinics, USA
Copyright: © 2010. Williams, Irwin, Jones and Murphy. This is an open-access article subject to an exclusive license agreement between the authors and the Frontiers Research Foundation, which permits unrestricted use, distribution, and reproduction in any medium, provided the original authors and source are credited.
*Correspondence: Kathryn Murphy, McMaster Integrative Neuroscience Discovery and Study Program (MiNDS), McMaster University, 1280 Main Street West, Hamilton, ON, Canada L8S 4K1. e-mail:a211cnBoeUBtY21hc3Rlci5jYQ==