 Matthias L. Schroeter1,2,3* Jane Neumann1,4
- 1 Department of Neurology, Max Planck Institute for Human Cognitive and Brain Sciences, Leipzig, Germany
- 2 Day Clinic of Cognitive Neurology, University of Leipzig, Leipzig, Germany
- 3 Leipzig Research Center for Civilization Diseases, University of Leipzig, Germany
- 4 Leipzig University Medical Center, IFB Adiposity Diseases, Leipzig, Germany
To compare and dissociate the neural correlates of Alzheimer’s disease (AD) and frontotemporal lobar degeneration (FTLD), we combine and synthesize here recent comprehensive meta-analyses. Systematic and quantitative meta-analyses were conducted according to the QUOROM statement by calculating anatomical likelihood estimates (ALE). AD (n = 578) and the three subtypes of FTLD, frontotemporal dementia, semantic dementia (SD), and progressive non-fluent aphasia (n = 229), were compared in conjunction analyses, separately for atrophy and reductions in glucose metabolism. Atrophy coincided in the amygdala and hippocampal head in AD and the FTLD subtype SD. The other brain regions did not show any overlap between AD and FTLD subtypes for both atrophy and changes in glucose metabolism. For AD alone (n = 826), another conjunction analysis revealed a regional dissociation between atrophy and hypoperfusion/hypometabolism, whereby hypoperfusion and hypometabolism coincided in the angular/supramarginal gyrus and inferior precuneus/posterior cingulate gyrus. Our data together with other imaging studies suggest a specific dissociation of AD and FTLD if, beside atrophy, additional imaging markers in AD such as abnormally low parietal glucose utilization and perfusion are taken into account. Results support the incorporation of standardized imaging inclusion criteria into future diagnostic systems, which is crucial for early individual diagnosis and treatment in the future.
Introduction
Neurodegenerative disorders are a major public health problem (Dubois et al., 2007; Kipps et al., 2009). The early detection, prediction, and dissociation of dementia syndromes are of paramount interest, in particular for treatment purposes. Based on the unprecedented rapid development of techniques for structural, functional, and molecular brain imaging, it has recently been suggested to incorporate standardized imaging inclusion criteria into future diagnostic systems such as the diagnostic and statistical manual of mental disorders (DSM-V) or the international classification of diseases system (ICD-11; Dubois et al., 2007; Hyman, 2007; Kipps et al., 2009).
Comprehensive meta-analyses are an excellent method of validating the impact of imaging markers on diagnosis and differential diagnosis of dementia syndromes. Recently, we have identified the prototypical neural correlates of two frequent dementia disorders, Alzheimer’s disease (AD), and frontotemporal lobar degeneration (FTLD), in comprehensive systematic and quantitative meta-analyses conducted according to the QUOROM statement (Schroeter et al., 2007, 2009). These meta-analyses involved 1618 patients and 1448 healthy control subjects and applied the anatomical likelihood estimate (ALE) method, which is regarded as the most sophisticated and best-validated of coordinate-based voxelwise meta-analyses (Fox et al., 2005; Glahn et al., 2008; Laird et al., 2009). This meta-analytic method uses peaks of atrophy, hypometabolism, or hypoperfusion in patients with dementia if compared with control subjects, and determines brain regions that exhibit a higher density of peak coordinates reported across single studies than would arise by chance. The ALE map represents the prototypical neural correlates of a specific dementia syndrome.
For AD and its prodromal stage, amnestic mild cognitive impairment (MCI), the meta-analysis revealed atrophy and reductions in metabolism and perfusion in a mainly temporoparietal network related to episodic memory processing (Thompson et al., 2003; Schroeter et al., 2009; McDonald et al., 2010; Walhovd et al., 2010). AD additionally involved frontomedian-thalamic structures. Atrophy in the (trans-) entorhinal area/hippocampus, and hypometabolism/-perfusion in the inferior parietal lobules most reliably predicted the progression from amnestic MCI to AD, whereas decreases in metabolism and perfusion in the posterior cingulate cortex and precuneus were unspecific (Schroeter et al., 2009).
For FTLD, the meta-analyses “triple dissociated” the prototypical neural substrates of its three subtypes (Neary et al., 1998; Schroeter et al., 2007, 2008). Frontotemporal dementia (FTD) – clinically characterized by changes in behavior and personality – affected a frontomedian network discussed in the context of social cognition. For the two other FTLD subtypes, the main clinical symptom is language impairment. Semantic dementia (SD) was related to the inferior temporal poles and amygdalae – brain regions that have been discussed in the context of conceptual knowledge, semantic information processing, and social cognition. Progressive non-fluent aphasia (PNFA) involved the whole left frontotemporal network for phonological and syntactical processing. These meta-analytic results corresponded with other studies including also different imaging approaches and provided a basis for the understanding of clinical symptoms (Gorno-Tempini et al., 2004; Diehl-Schmid et al., 2007; Salmon et al., 2009; McDonald et al., 2010; Walhovd et al., 2010).
Besides the early detection of dementia syndromes, the dissociation of their neural correlates is crucial for their early differential diagnosis and treatment – an issue that is particularly relevant for the incorporation of standardized imaging inclusion criteria into future diagnostic systems (Dubois et al., 2007; Hyman, 2007; Kipps et al., 2009). While our previous meta-analyses identified the neural correlates of AD and FTLD (Schroeter et al., 2007, 2009), we now combine and synthesize these meta-analyses in a conjunction analysis in order to compare and dissociate the neural correlates of AD and FTLD, and to validate the specificity of imaging criteria for these disorders.
Materials and Methods
MedLine and Current Contents search engines were used to systematically identify studies on morphometry, glucose utilization, and perfusion in AD, MCI, and FTLD (Schroeter et al., 2007, 2009). Studies were examined to fulfil the following inclusion criteria: peer-reviewed, original studies, patients diagnosed according to internationally recognized diagnostic criteria, patients compared to age-matched healthy controls, or age included as a covariate in the analysis, quantitative automated whole brain analysis method, results normalized to a stereotactic space such as the Talairach or the Montreal Neurological Institute (MNI) reference system, and respective coordinates are available. When maxima were reported in the MNI reference system, they were transformed to the Talairach space. We also applied the following exclusion criteria. Studies using solely region-of-interest analysis were excluded to prevent any a priori assumptions with regard to the involved neural networks and to enable a data-driven approach, as were case studies, and studies investigating substantially overlapping patient populations. Moreover, we generally excluded functional imaging studies investigating brain activation during cognitive stimulation, because they apply diverse psychological paradigms making a comparison of the individual studies in a meta-analysis impossible. The literature search, selection of studies according to the inclusion and exclusion criteria and compilation of coordinates for the several contrasts were performed independently by two investigators and any disagreements were resolved by consensus.
Contrasts between patients and healthy control subjects were included, reporting either atrophy [magnetic resonance imaging (MRI)], decreases in glucose utilization [18F-fluorodeoxyglucose-positron emission tomography (FDG-PET)], or perfusion [H215O-PET, 99mTc-hexamethylpropyleneamine oxime-(HMPAO)-single photon emission computed tomography (SPECT), 99mTc-ethylcysteinate dimmer-(ECD)-SPECT]. Finally, for AD and MCI, 40 studies were identified involving 1351 patients and 1097 healthy control subjects reporting either atrophy or decreases in glucose utilization and perfusion (see Schroeter et al., 2009). For FTLD, 19 relevant studies were extracted measuring atrophy or decreases in glucose utilization in 267 patients and 351 healthy control subjects (see Schroeter et al., 2007). Here, the analysis was performed for each of the three subtypes as proposed by Neary et al. (1998): FTD, SD, and PNFA. No perfusion study fulfilled the inclusion criteria for FTLD. The meta-analysis flow charts, further information as required according to the QUOROM statement and the studies included are listed in detail in our previous papers (Schroeter et al., 2007, 2009).
To extract the prototypical neural networks, we applied the ALE meta-analysis method (Turkeltaub et al., 2002; Fox et al., 2005; Schroeter et al., 2007, 2008, 2009; Glahn et al., 2008). The idea behind this method is to determine brain regions that exhibit a higher density of peak coordinates reported across studies than would arise by chance. Based on peaks of atrophy, hypometabolism or hypoperfusion as reported in the single studies, the algorithm calculates an ALE map that represents the likelihood for each voxel that at least one of the reported peaks is located there. ALE values were determined on a grid of isotropic 2mm × 2mm × 2 mm voxels. In a second step, these empirical ALE maps were compared to ALE maps for randomly distributed maxima. The same number of maxima as included in the empirical ALE map was uniformly distributed 1000 times over a brain volume mask. Histograms of the thousand sets of randomly distributed maxima were averaged to obtain a histogram representing the noise distribution of ALE values. This histogram served as a null hypothesis against which the significance of the empirical ALE values was tested. A conservative ALE threshold corresponding to a level of 0.01% (p < 0.0001) was chosen to reduce the probability of type I errors and to identify only the most consistent regions of atrophy, hypometabolism, and hypoperfusion (Turkeltaub et al., 2002). The null hypothesis of random distribution was rejected for the voxels that exceeded this threshold. Results of the ALE analysis separately for AD and FTLD as well as a detailed description of the method applied are reported elsewhere (Schroeter et al., 2007, 2008, 2009).
Here, we compare and dissociate the neural correlates of AD and FTLD by combining and synthesizing these recent comprehensive meta-analyses. Accordingly, a conjunction analysis was conducted across results for AD and FTLD, separately for the different imaging approaches, namely MRI investigating atrophy and FDG-PET measuring changes in glucose utilization. Because the meta-analysis did not reveal any relevant study measuring changes in perfusion in FTLD, the conjunction analysis for AD and FTLD could not be performed for this imaging approach. A second conjunction analysis compared the results for the three imaging methods in AD alone. Here, a sufficient number of studies investigating atrophy (MRI), glucose utilization (FDG-PET), and perfusion (SPECT/PET) were available.
Results
Demographic and Clinical Characteristics
Table 1 illustrates the demographic and clinical characteristics of the different dementia cohorts involved in the meta-analysis. Note that we did not include subjects with amnestic MCI, because it is considered as a prodromal stage of AD and the FTLD subtypes may be associated with other non-amnestic prodromal stages such as dysexecutive MCI or mild behavioral (FTD) or language impairment (PNFA and SD; Winblad et al., 2004). Further, we excluded studies focused on undifferentiated FTLD, where the specific subtype was not identified. Distribution of dementia subgroups in the meta-analyses corresponds with epidemiological reports, because AD is the most frequent dementia syndrome (Dubois et al., 2007; Schroeter et al., 2009), whereas FTLD represents the second most common diagnosis of dementia in individuals younger than 65 years (Schroeter et al., 2007). It is also well known that approximately half of all FTLD diagnoses are FTD cases; SD and PNFA account for one quarter each (Johnson et al., 2005).
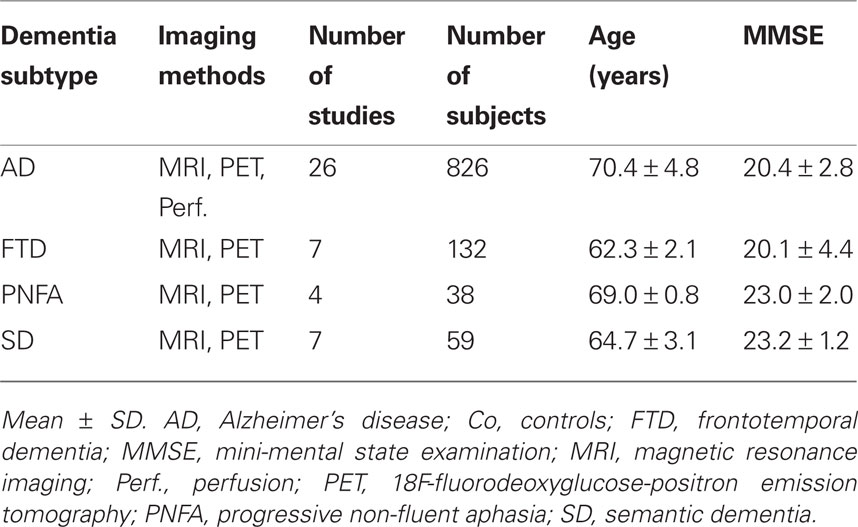
Table 1. Demographic and clinical characteristics.
An ANOVA including dementia subtype (AD vs. FTD vs. PNFA vs. SD) as a between subjects factor and method (MRI vs. FDG-PET vs. perfusion) as an additional factor revealed no influences of both factors on severity of dementia as measured by the mini-mental state examination (MMSE) and no significant interaction between both factors (dementia subtype: F = 1.4, degrees of freedom, df = 3, p = 0.40; method: F = 0.3, df = 2, p = 0.77; interaction F = 1.3, df = 3, p = 0.29). One might conclude that the dementia subtypes did not show differences in dementia severity. The ANOVA for age showed a different result – namely the factor dementia subtype was significant (F = 10.8, df = 3, p = 0.04), whereas there was no significant impact of imaging methods or interaction between both factors (F = 27.1, df = 2, p = 0.84; F = 0.62, df = 3, p = 0.61). Post hoc analyses with unpaired Student’s t-tests revealed that patients with AD were older than patients with FTD or SD (T = −7.1, df = 22.2, T = −3.0, df = 39). Furthermore, patients with PNFA were older than those with FTD (T = −6.1, df = 9; p < 0.05; other comparisons not significant; two tailed p, Bonferroni corrected and adjusted for inequality of variance if necessary). Age differences between groups are in accordance with the literature – in particular later age at onset in PNFA in comparison with other FTLD subtypes (Johnson et al., 2005) and increasing prevalence of AD with aging (Dubois et al., 2007; Schroeter et al., 2009). Because the original studies generally controlled for effects of age, no impact of age on the results of the meta-analysis was assumed.
Neural Correlates of Alzheimer’s Disease and Frontotemporal Lobar Degeneration
Figure 1 illustrates the neural correlates for the several dementia syndromes as revealed by the ALE meta-analysis. Results are shown for the three imaging methods separately. AD affected a temporoparietal and frontomedian-thalamic network. For FTLD, the meta-analyses specifically isolated the neural substrates for its three subtypes. FTD involved a frontomedian and thalamic network. PNFA was related to a left frontotemporal network and the lentiform nucleus, whereas SD was associated with changes in the inferior temporal poles, amygdalae, and subcallosal area. Details of the involved anatomical structures and a discussion of their functional correlates may be found in Schroeter et al. (2007, 2009).
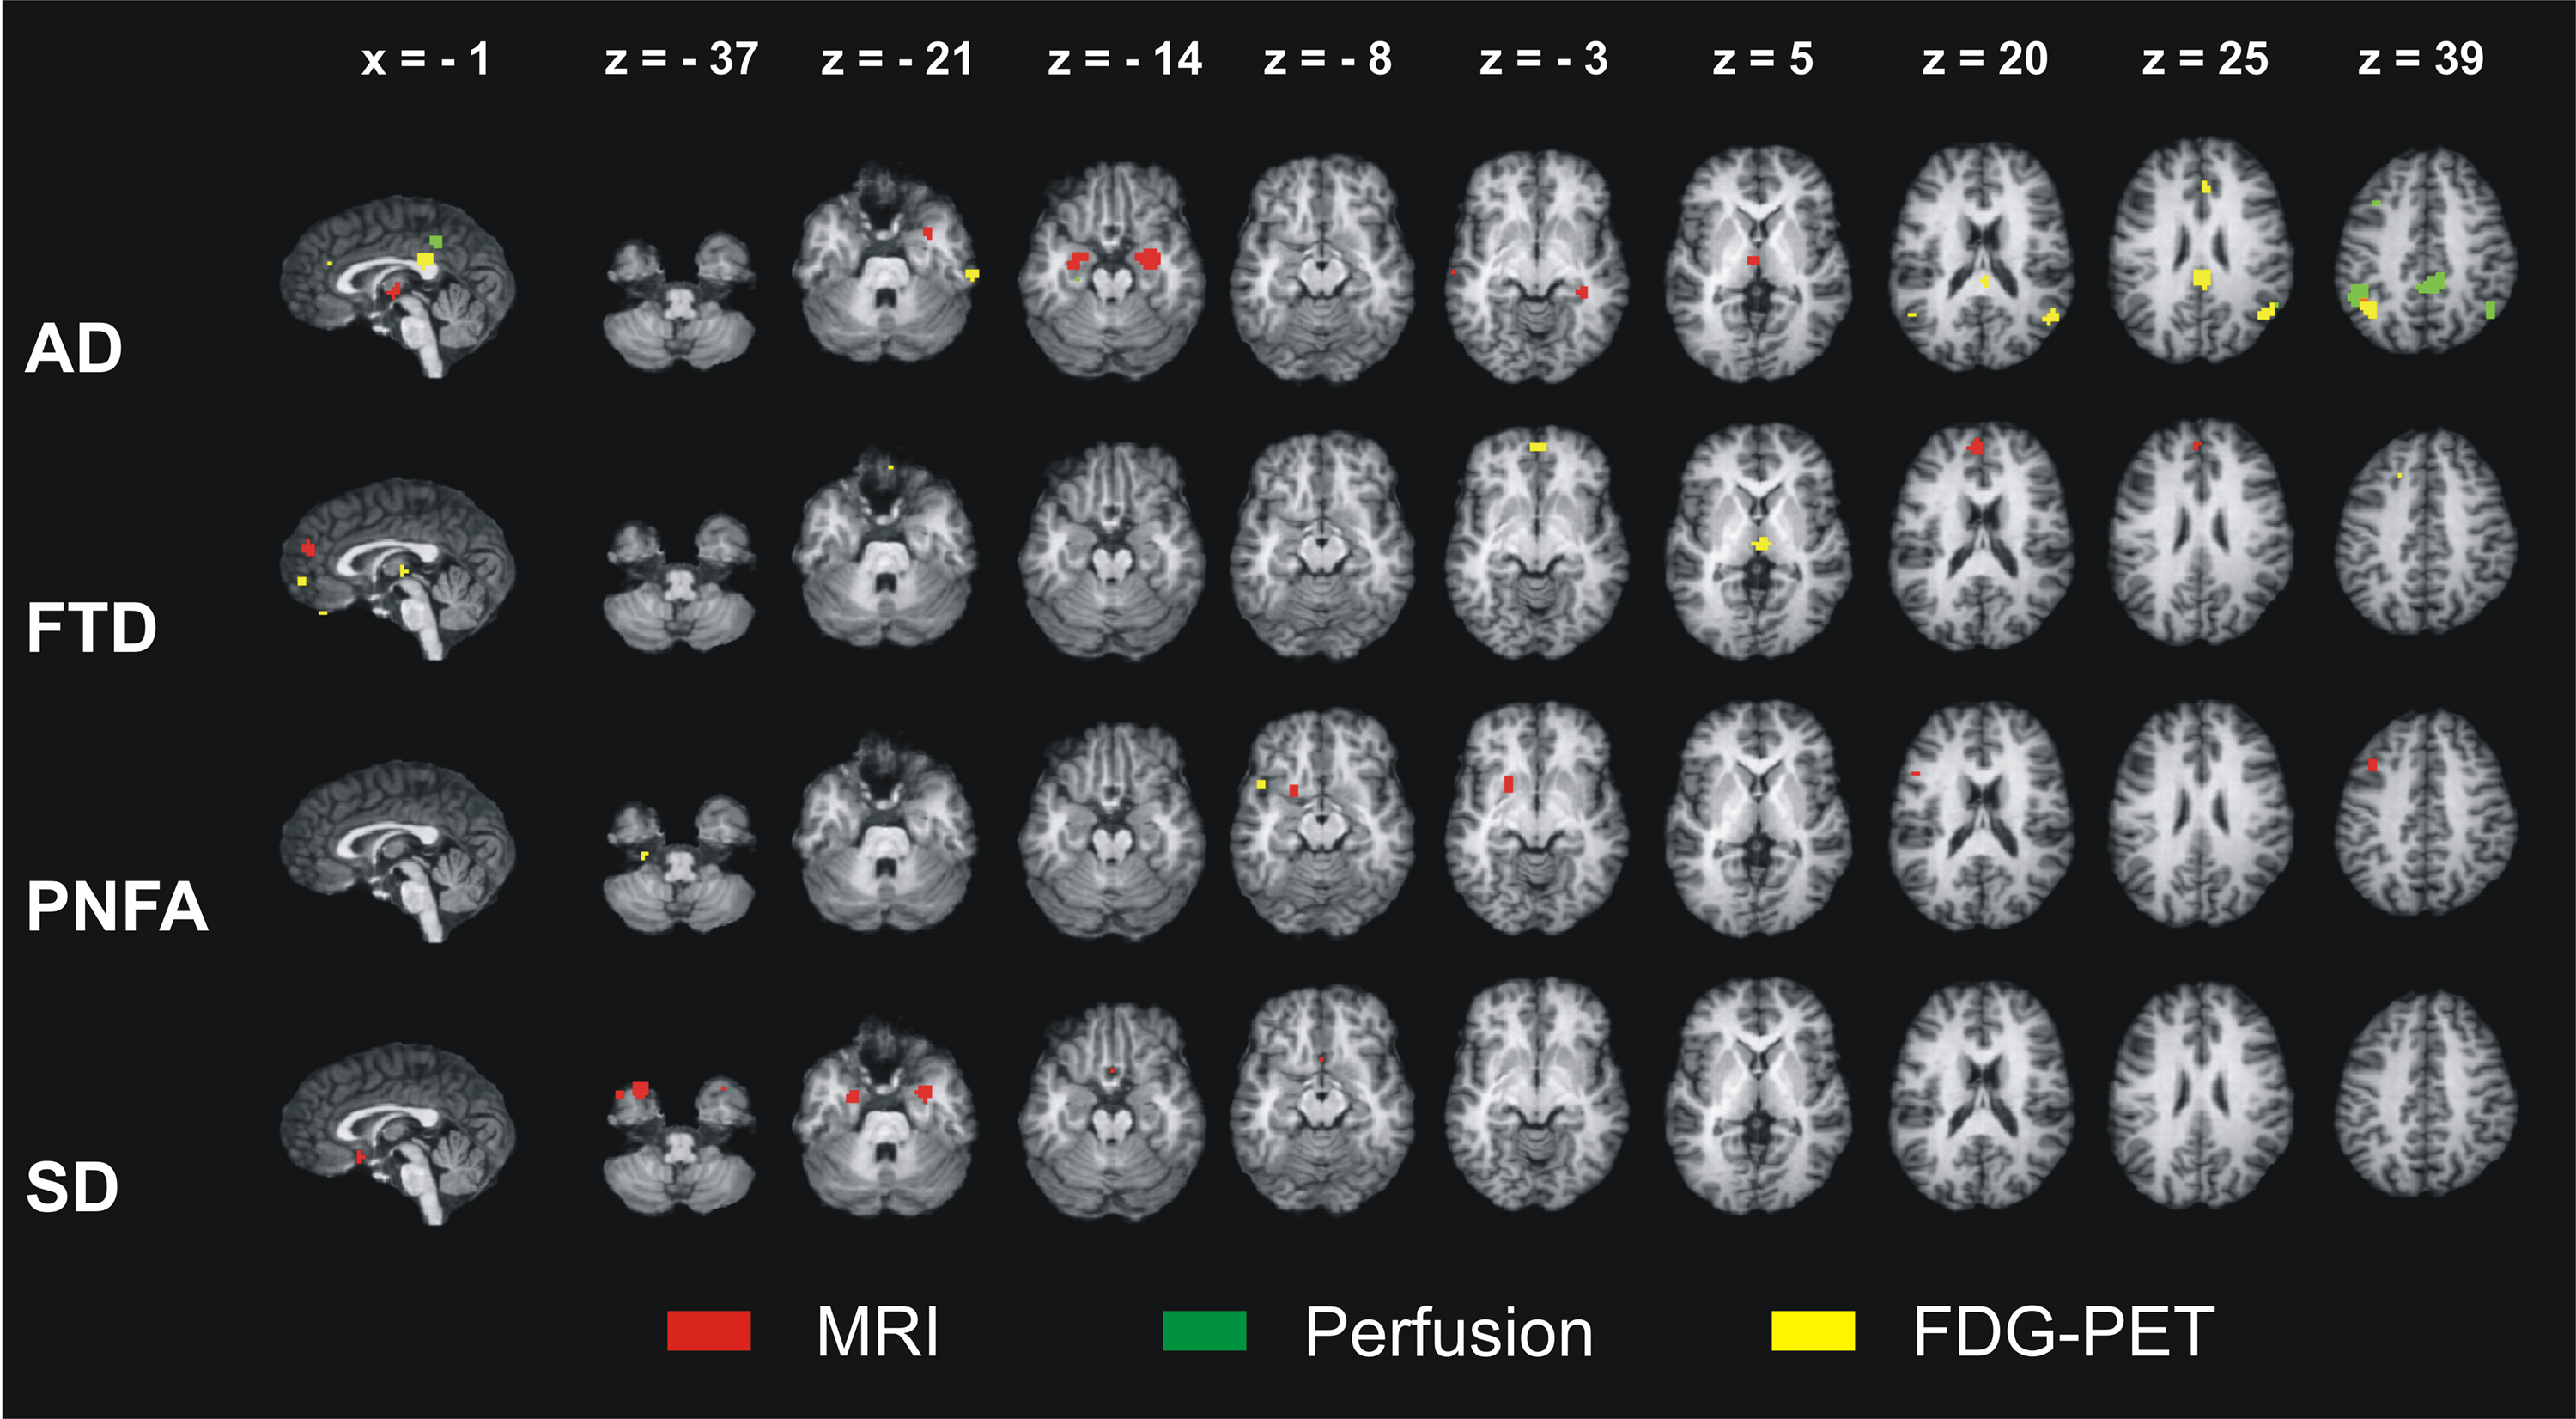
Figure 1. Results of the ALE meta-analyses identifying the neural correlates of Alzheimer’s disease (AD), frontotemporal dementia (FTD), progressive non-fluent aphasia (PNFA), and semantic dementia (SD). Atrophy as measured by magnetic resonance imaging (MRI) and decreases in glucose utilization as measured by 18F-fluorodeoxyglucose-positron emission tomography (FDG-PET) in patients compared with control subjects. For AD, reductions in perfusion are additionally shown (no studies available for FTD, PNFA, and SD). ALE – anatomical likelihood estimates. Coordinates in Talairach space. Left is left.
First Conjunction Analysis – Alzheimer’s Disease vs. Frontotemporal Lobar Degeneration
Results of the conjunction analysis for the comparison between the neural correlates of AD and the three subtypes of FTLD are illustrated in Figure 2. Note that the conjunction analysis was conducted separately for the two relevant imaging approaches MRI and FDG-PET. Because the meta-analysis did not reveal any relevant study measuring perfusion changes in FTLD, this conjunction analysis could not be performed for this imaging approach.
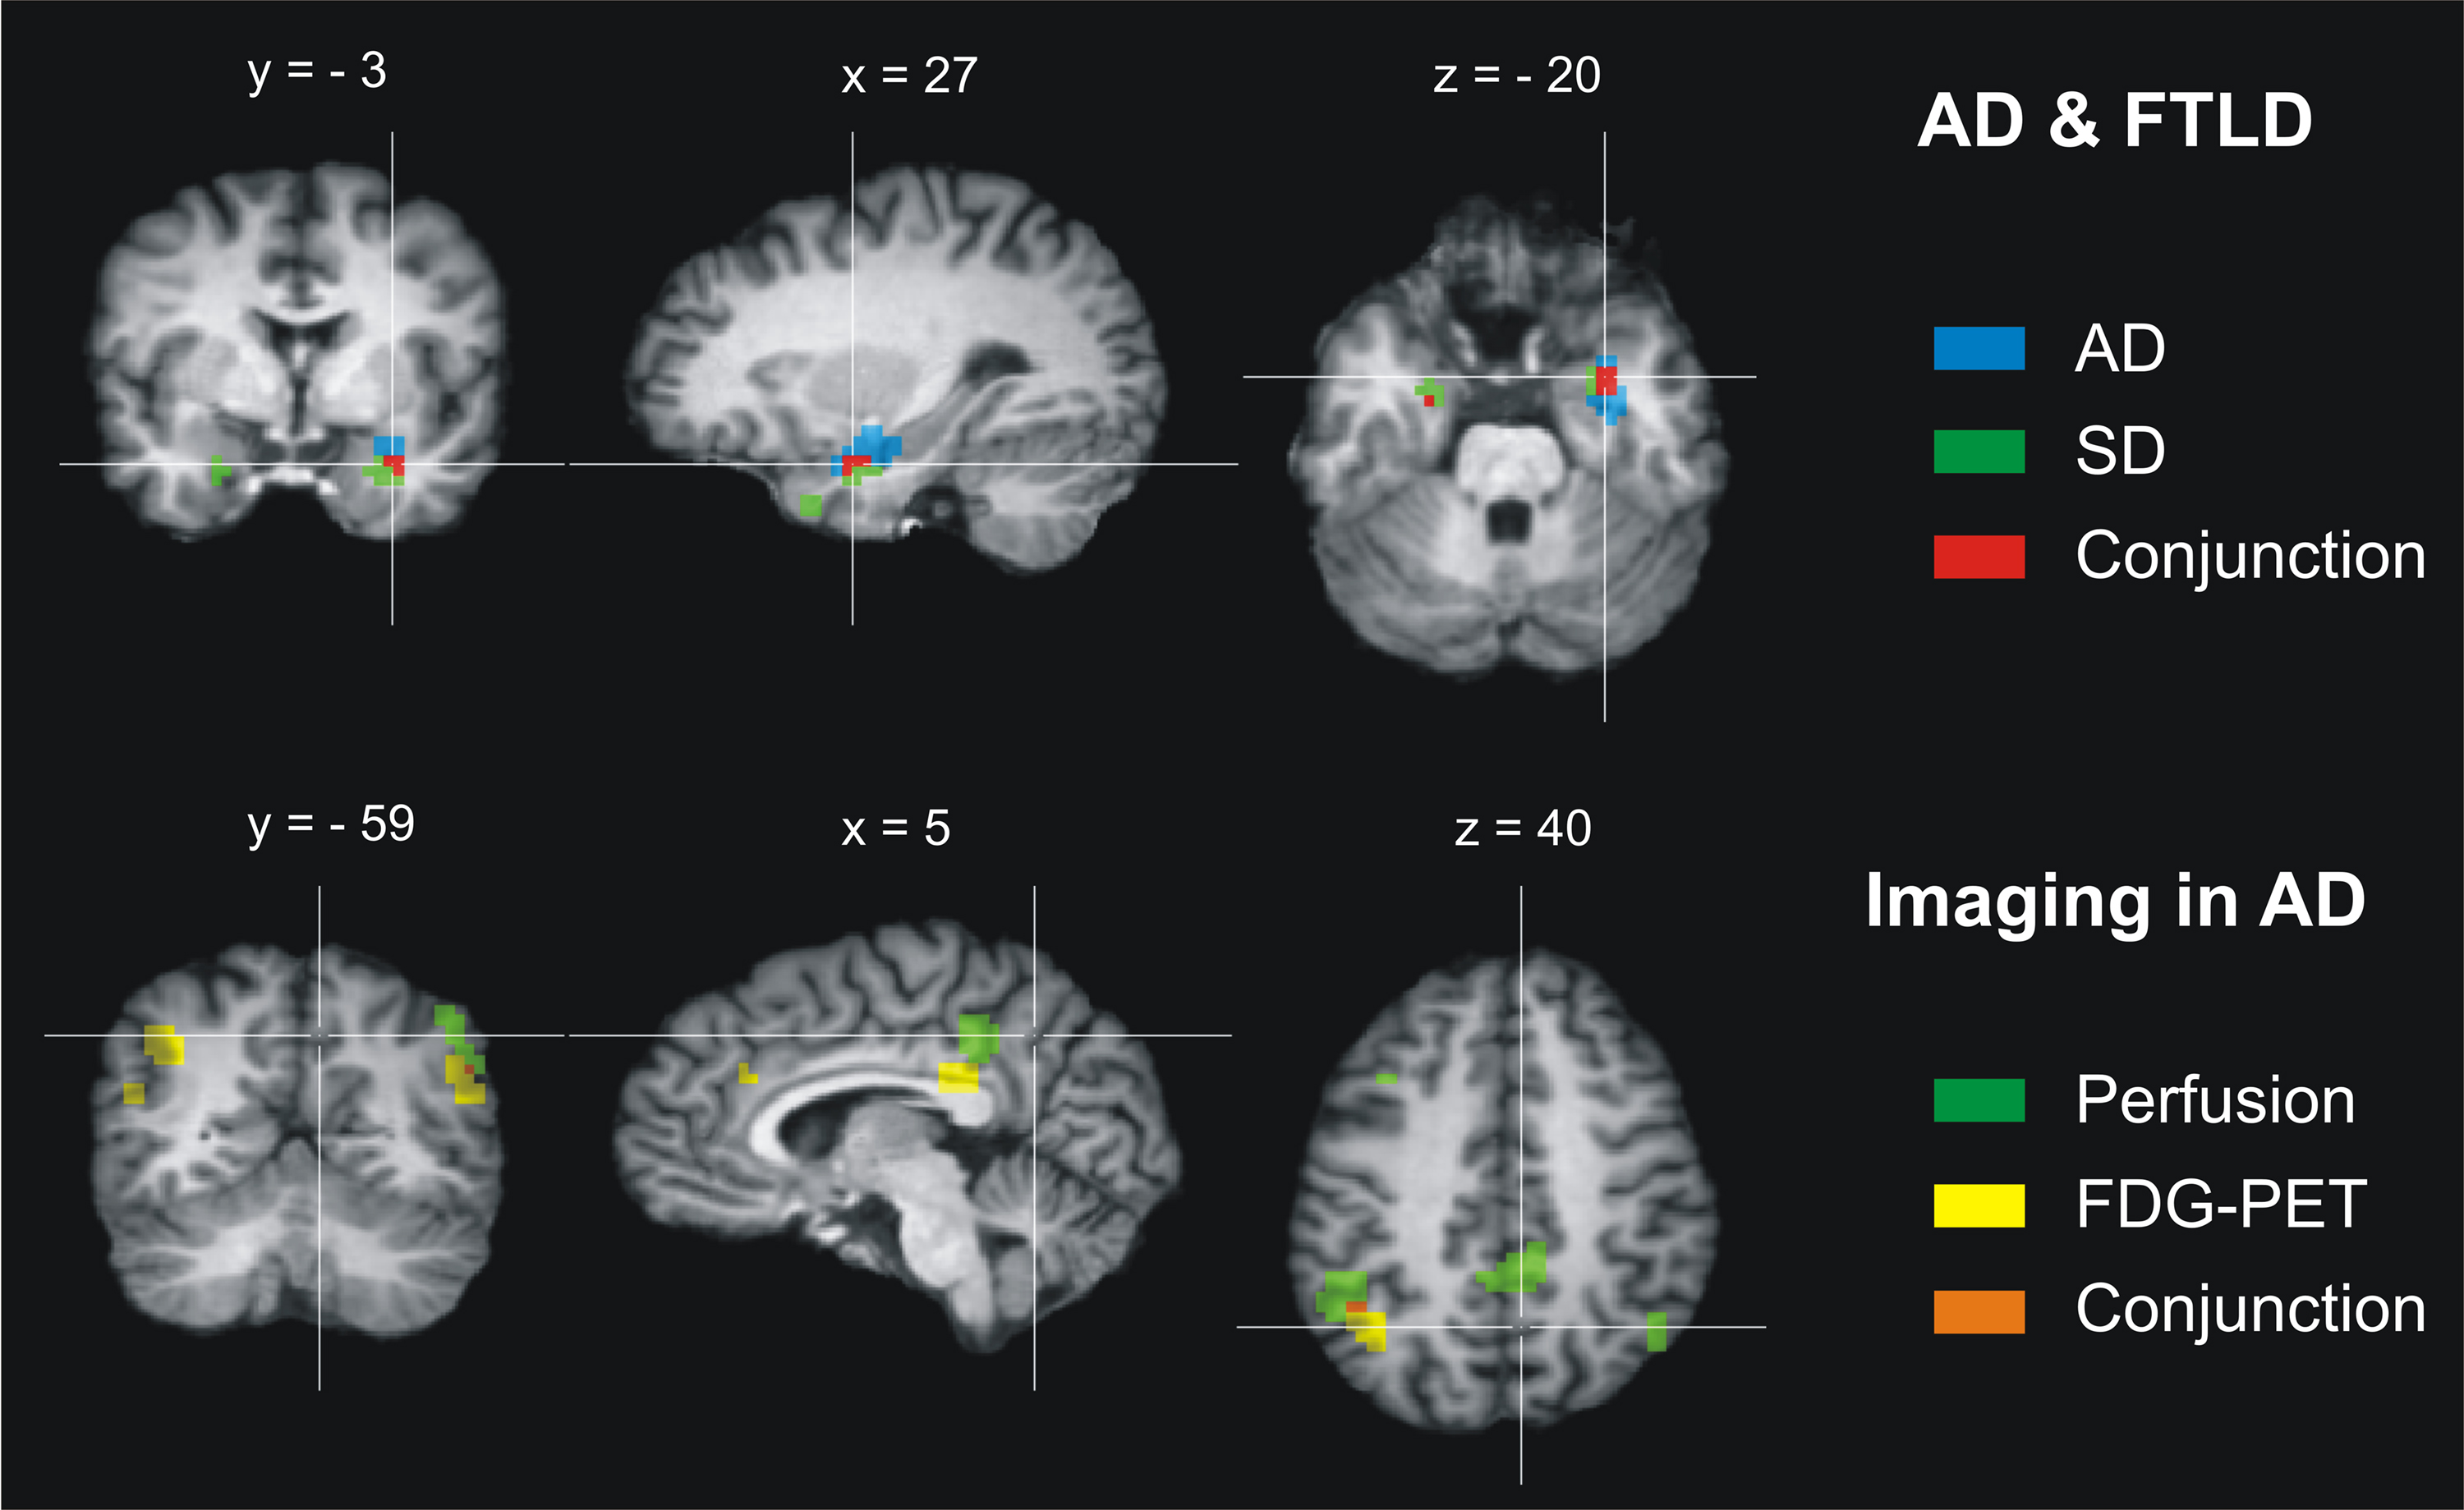
Figure 2. Results of the conjunction analysis for Alzheimer’s disease (AD) and frontotemporal lobar degeneration (FTLD). Upper row: Atrophic brain regions overlap in AD and the FTLD subtype semantic dementia (SD) in both amygdalae and hippocampal heads (maximum/cluster size: left −26 −9 −18/27 mm3, right 25 0 −21/243 mm3). No further overlap of atrophy (MRI) or changes in glucose utilization (FDG-PET) was found for AD and the three FTLD subtypes. Lower row: Abnormally low perfusion and glucose utilization overlap in AD in both angular and supramarginal gyri (left −47 −52 40/135 mm3, right 49 −58 31/27 mm3) and affect tightly adjoining brain regions in the inferior precuneus and posterior cingulate cortex, whereas atrophy was regionally dissociated from these functional imaging measures. Coordinates in Talairach space. Left is left.
In the final analysis, 578 patients with AD and 229 patients with FTLD were included. For detailed information with respect to the studies included see Schroeter et al. (2007, 2009). There were no significant differences of dementia severity as rated with the MMSE between AD and FTLD cohorts (see above). The conjunction analysis identified only one brain region bilaterally where atrophy as measured with MRI coincided in AD and the FTLD subtype SD (Figure 2, top). This region included the amygdala and hippocampal head. The other brain regions did not show any overlap in AD and the FTLD subtypes for atrophy (MRI) or glucose utilization (FDG-PET).
Second Conjunction Analysis – Imaging in Alzheimer’s Disease
The second conjunction analysis compared the neural correlates for AD alone as revealed by the respective three different imaging approaches, measuring either atrophy (MRI), glucose utilization (FDG-PET), or perfusion (SPECT/PET; Figure 2, bottom). Eight hundred twenty-six patients were included in this analysis. For detailed information with respect to the studies included see Schroeter et al. (2009). Regarding the AD cohorts of the studies applying the three different imaging approaches, there were no significant differences of dementia severity as rated with the MMSE. Again no impact of age on results of the conjunction analysis was assumed.
As illustrated in Figure 2, the analysis focusing on different imaging approaches in AD revealed a regional dissociation between atrophy as measured with MRI on the one side and hypoperfusion (SPECT/PET) and hypometabolism (FDG-PET) on the other side. Both hypoperfusion (SPECT/PET) and hypometabolism (FDG-PET) coincided in the angular and supramarginal gyrus (Brodmann area 39 and 40). Additionally, perfusion and metabolism were reduced in tightly adjoining areas in the inferior precuneus and posterior cingulate cortex (Brodmann area 7/31 and 23).
Discussion
Together with our recent findings (Schroeter et al., 2007, 2008, 2009), the data suggest a specific dissociation of affected brain regions in AD and the three FTLD subtypes if different imaging modalities are combined. MRI alone, if investigating atrophy, could not reliably dissociate AD and FTLD, because it revealed a common atrophic temporal brain region in AD and one subtype of FTLD, SD. However, this overlap might have no significant influence on reliable differential diagnosis in dementia syndromes if other imaging markers in AD such as abnormally low glucose utilization and perfusion in the parietal lobes (Figure 1, bottom) are carefully taken into account (Dubois et al., 2007; Drzezga et al., 2008). Moreover, high amyloid plaque load in AD in contrast, among others, to SD might contribute to differentiating dementia disorders, although to date no ALE meta-analysis can be performed across amyloid imaging studies due to their limited number (Dubois et al., 2007; Drzezga et al., 2008).
As MRI is more easily available than SPECT or PET in clinical settings, one might prefer a reliable imaging approach for the differential diagnosis of dementia syndromes based only on this method. In this context, the results of the second conjunction analysis are of particular interest – namely the regional coincidence of changes in glucose utilization and perfusion in AD (beside their dissociation from regional atrophy in agreement with former studies; see for instance Luckhaus et al., 2010). Accordingly, combining two MRI approaches, morphometric MRI, and arterial spin labeling (ASL) MRI measuring atrophy and changes in perfusion might yield sufficient information to dissociate AD and FTLD in the future (Alsop et al., 2010). Remarkably, a recent study underlines the importance of ASL in differentiating between AD and FTLD (Hu et al., 2010). In conclusion, due to its lack of specificity, structural MRI should be supported by other imaging modalities in the differential diagnosis of dementia.
Finally, one has to discuss the study’s limitations and prospects. Beside the three subtypes of FTLD as suggested by the classification of Neary et al. (1998) future meta-analyses should also include other closely related dementia types, i.e., corticobasal degeneration, progressive supranuclear palsy, and logopenic aphasia, once enough studies are available (Gorno-Tempini et al., 2004; Rabinovici and Miller, 2010; Seelaar et al., 2011). Furthermore, the method applied has to be discussed critically. Because ALE meta-analyses generally include maxima and not cluster sizes of the various studies, they extract the prototypical, most characteristic neural networks representing the brain regions that are consistently involved in specific dementia syndromes. Accordingly, single studies might have shown that dementia disorders may affect other brain structures and may be regionally more unspecific than the present meta-analysis suggests (see for instance Seeley et al., 2009; Dukart et al., 2010; Raczka et al., 2010). Consequently, in single imaging studies the regional overlap between AD and FTLD might be larger than suggested by our meta-analysis (particularly frontotemporal regions) – leading to generally less specific regional dissociations between both dementia syndromes. Moreover, the ALE meta-analysis might have missed parietal and posterior cingulate atrophy in AD as has been observed in single studies with MRI (Thompson et al., 2003).
However, for diagnostic purposes, the most consistent prototypical brain networks are of highest interest. Future classification systems for dementia require prediction, diagnosis, and differential diagnosis in individual subjects (Dubois et al., 2007; Hyman, 2007; Kipps et al., 2009). To address this issue we suggest focusing individual image analyses, for instance with support vector machine classification, on the regions-of-interest that have been identified in our studies based on independent large patient cohorts (Klöppel et al., 2008; Wilson et al., 2009). Indeed, we could show recently in our own patient cohort that the accuracy of the individual diagnosis of AD and FTLD can be improved by applying this method with multimodal imaging including MRI and FDG-PET (Dukart et al., 2011). These results supply first evidence that ALE meta-analytic based approaches may decisively improve the sensitivity and specificity in individual diagnosis of dementia syndromes – although results have to be confirmed by studies combining in vivo imaging with post mortem histopathological validation of dementia subtypes – to date the golden standard of dementia diagnosis.
In conclusion, our data together with other imaging studies suggest that combined brain imaging markers can reliably dissociate the most frequent neurodegenerative dementia disorders, AD, and FTLD. Results support the incorporation of standardized imaging inclusion criteria into future diagnostic systems, which will be crucial for early diagnosis and treatment in the future (Dubois et al., 2007; Hyman, 2007; Kipps et al., 2009).
Conflict of Interest Statement
The authors declare that the research was conducted in the absence of any commercial or financial relationships that could be construed as a potential conflict of interest.
Acknowledgments
Matthias L. Schroeter is supported by LIFE – Leipzig Research Center for Civilization Diseases at the University of Leipzig. LIFE is funded by means of the European Union, by the European Regional Development Fund (ERFD) and by means of the Free State of Saxony within the framework of the excellence initiative. Jane Neumann is supported by the NIH, grant number R01 MH74457 and the German Federal Ministry of Education and Research (BMBF), grant number FKZ 01EO1001.
References
Alsop, D. C., Dai, W., Grossman, M., and Detre, J. A. (2010). Arterial spin labeling blood flow MRI: its role in the early characterization of Alzheimer’s disease. J. Alzheimers Dis. 20, 871–880.
Diehl-Schmid, J., Grimmer, T., Drzezga, A., Bornschein, S., Riemenschneider, M., Forstl, H., Schwaiger, M., and Kurz, A. (2007). Decline of cerebral glucose metabolism in frontotemporal dementia: a longitudinal 18F-FDG-PET-study. Neurobiol. Aging 28, 42–50.
Drzezga, A., Grimmer, T., Henriksen, G., Stangier, I., Perneczky, R., Diehl-Schmid, J., Mathis, C. A., Klunk, W. E., Price, J., DeKosky, S., Wester, H. -J., Schwaiger, M., and Kurz, A. (2008). Imaging of amyloid plaques and cerebral glucose metabolism in semantic dementia and Alzheimer’s disease. Neuroimage 39, 619–633.
Dubois, B., Feldman, H. H., Jacova, C., DeKosky, S. T., Barberger-Gateau, P., Cummings, J., Delacourte, A., Galasko, D., Gauthier, S., Jicha, G., Meguro, K., O Brien, J., Pasquier, F., Robert, P., Rossor, M., Salloway, S., Stern, Y., Visser, P. J., and Scheltens, P. (2007). Research criteria for the diagnosis of Alzheimer’s disease: revising the NINCDS-ADRDA criteria. Lancet Neurol. 6, 734–746.
Dukart, J., Mueller, K., Horstmann, A., Barthel, H., Möller, H. E., Villringer, A., Sabri, O., and Schroeter, M. L. (2011). Combined evaluation of FDG-PET and MRI improves detection and differentiation of dementia. PLoS ONE 6, e18111. doi: 10.1371/journal.pone.0018111
Dukart, J., Mueller, K., Horstmann, A., Vogt, B., Frisch, S., Barthel, H., Becker, G., Möller, H. E., Villringer, A., Sabri, O., and Schroeter, M. L. (2010). Differential effects of global and cerebellar normalization on detection and differentiation of dementia in FDG-PET studies. Neuroimage 49, 1490–1495.
Fox, P. T., Laird, A. R., and Lancaster, J. L. (2005). Coordinate-based voxel-wise meta-analysis: dividends of spatial normalization. Report of a virtual workshop. Hum. Brain Mapp. 25, 1–5.
Glahn, D. C., Laird, A. R., Ellison-Wright, I., Thelen, S. M., Robinson, J. L., Lancaster, J. L., Bullmore, E., and Fox, P. T. (2008). A quantitative meta-analysis of voxel-based morphometry studies in schizophrenia: Application of anatomical likelihood estimation. Biol. Psychiatry 64, 774–781.
Gorno-Tempini, M. L., Dronkers, N. F., Rankin, K. P., Ogar, J. M., Phengrasamy, L., Rosen, H. J., Johnson, J. K., Weiner, M. W., and Miller, B. L. (2004). Cognition and anatomy in three variants of primary progressive aphasia. Ann. Neurol. 55, 335–346.
Hu, W. T., Wang, Z., Lee, V. M., Trojanowski, J. Q., Detre, J. A., and Grossman, M. (2010). Distinct cerebral perfusion patterns in FTLD and AD. Neurology 75, 881–888.
Johnson, J. K., Diehl, J., Mendez, M. F., Neuhaus, J., Shapira, J. S., Forman, M., Chute, D. J., Roberson, E. D., Pace-Savitsky, C., Neumann, M., Chow, T. W., Rosen, H. J., Förstl, H., Kurz, A., and Miller, B. L. (2005). Frontotemporal lobar degeneration. Demographic characteristics of 353 patients. Arch. Neurol. 62, 925–930.
Kipps, C. M., Hodges, J. R., Fryer, T. D., and Nestor, P. J. (2009). Combined magnetic resonance imaging and positron emission tomography brain imaging in behavioural variant frontotemporal degeneration: Refining the clinical phenotype. Brain 132, 2566–2578.
Klöppel, S., Stonnington, C. M., Chu, C., Draganski, B., Scahill, R. I., Rohrer, J. D., Fox, N. C., Jack, C. R., Ashburner, J., and Frackowiak, R. S. (2008). Automatic classification of MR scans in Alzheimer’s disease. Brain 131, 681–689.
Laird, A. R., Eickhoff, S. B., Kurth, F., Fox, P. M., Uecker, A. M., Turner, J. A., Robinson, J. L., Lancaster, J. L., and Fox, P. T. (2009). ALE meta-analysis workflows via the brainmap database: Progress towards a probabilistic functional brain atlas. Front. Neuroinform. 3:23. doi: 10.3389/neuro.11.023.2009
Luckhaus, C., Cohnen, M., Flüβ, M. O., Jänner, M., Grass-Kapanke, B., Teipel, S. J., Grothe, M., Hampel, H., Peters, O., Kornhuber, J., Maier, W., Supprian, T., Gaebel, W., Mödder, U., and Wittsack, H. J. (2010). The relation of regional cerebral perfusion and atrophy in mild cognitive impairment (MCI) and early Alzheimer’s dementia. Psychiatry Res. Neuroimaging 183, 44–51.
McDonald, C. R., Gharapetian, L., McEvoy, L. K., Fennema-Notestine, C., Hagler, D. J., Holland, D., Dale, A. M., and the Alzheimer’s Disease Neuroimaging Initiative. (2010). Relationship between regional atrophy rates and cognitive decline in mild cognitive impairment. Neurobiol. Aging. doi: 10.1016/j.neurobiolaging.2010.03.015. [Epub ahead of print].
Neary, D., Snowden, J. S., Gustafson, L., Passant, U., Stuss, D., Black, S., Freedman, M., Kertesz, A., Robert, P. H., Albert, M., Boone, K., Miller, B. L., Cummings, J., and Benson, D. F. (1998). Frontotemporal lobar degeneration: a consensus on clinical diagnostic criteria. Neurology 51, 1546–1554.
Rabinovici, G. D., and Miller, B. L. (2010). Frontotemporal lobar degeneration: epidemiology, pathophysiology, diagnosis and management. CNS Drugs 24, 375–398.
Raczka, K. A., Becker, G., Seese, A., Frisch, S., Heiner, S., Marschhauser, A., Barthel, H., Scheid, R., Sabri, O., and Schroeter, M. L. (2010). Executive and behavioral deficits share common neural substrates in frontotemporal lobar degeneration – a pilot FDG-PET study. Psychiatry Res. Neuroimaging 182, 274–280.
Salmon, E., Kerrouche, N., Perani, D., Lekeu, F., Holthoff, V., Beuthien-Baumann, B., Sorbi, S., Lemaire, C., Collette, F., and Herholz, K. (2009). On the multivariate nature of brain metabolic impairment in Alzheimer’s disease. Neurobiol. Aging 30, 186–197.
Schroeter, M. L., Raczka, K., Neumann, J., and von Cramon, D. Y. (2007). Towards a nosology for frontotemporal lobar degenerations – a meta-analysis involving 267 subjects. Neuroimage 36, 497–510.
Schroeter, M. L., Raczka, K., Neumann, J., and von Cramon, D. Y. (2008). Neural networks in frontotemporal dementia – a meta-analysis. Neurobiol. Aging 29, 418–426.
Schroeter, M. L., Stein, T., Maslowski, N., and Neumann, J. (2009). Neural correlates of Alzheimer’s disease and mild cognitive impairment: a systematic and quantitative meta-analysis involving 1351 patients. Neuroimage 47, 1196–1206.
Seelaar, H., Rohrer, J. D., Pijnenburg, Y. A., Fox, N. C., and van Swieten, J. C. (2011). Clinical, genetic and pathological heterogeneity of frontotemporal dementia: a review. J. Neurol. Neurosurg. Psychiatr. 82, 476–486.
Seeley, W. W., Crawford, R. K., Zhou, J., Miller, B. L., and Greicius, M. D. (2009). Neurodegenerative diseases target large-scale human brain networks. Neuron 62, 42–52.
Thompson, P. M., Hayashi, K. M., de Zubicaray, G., Janke, A. L., Rose, S. E., Semple, J., Herman, D., Hong, M. S., Dittmer, S. S., Doddrell, D. M., and Toga, A. W. (2003). Dynamics of gray matter loss in Alzheimer’s disease. J. Neurosci. 23, 994–1005.
Turkeltaub, P. E., Eden, G. F., Jones, K. M., and Zeffiro, T. A. (2002). Meta-analysis of the functional neuroanatomy of single-word reading: Method and validation. Neuroimage 16, 765–780.
Walhovd, K. B., Fjell, A. M., Dale, A. M., McEvoy, L. K., Brewer, J., Karow, D. S., Salmon, D. P., Fennema-Notestine, C., and the Alzheimer’s Disease Neuroimaging Initiative. (2010). Multi-modal imaging predicts memory performance in normal aging and cognitive decline. Neurobiol. Aging 31, 1107–1121.
Wilson, S. M., Ogar, J. M., Laluz, V., Growdon, M., Jang, J., Glenn, S., Miller, B. L., Weiner, M. W., and Gorno-Tempini, M. L. (2009). Automated MRI-based classification of primary progressive aphasia variants. Neuroimage 47, 1558–1567.
Winblad, B., Palmer, K., Kivipelto, M., Jelic, V., Fratiglioni, L., Wahlund, L. O., Nordberg, A., Backman, L., Albert, M., Almkvist, O., Arai, H., Basun, H., Blennow, K., de Leon, M., DeCarli, C., Erkinjuntti, T., Giacobini, E., Graff, C., Hardy, J., Jack, C., Jorm, A., Ritchie, K., van Duijn, C., Visser, P., and Petersen, R. C. (2004). Mild cognitive impairment: beyond controversies, towards a consensus – report of the international working group on mild cognitive impairment. J. Intern. Med. 256, 240–246.
Keywords: Alzheimer’s disease, differential diagnosis, FDG-PET, frontotemporal lobar degeneration, MRI, perfusion
Citation: Schroeter ML and Neumann J (2011) Combined imaging markers dissociate Alzheimer’s disease and frontotemporal lobar degeneration – an ALE meta-analysis. Front. Ag. Neurosci. 3:10. doi: 10.3389/fnagi.2011.00010
Received: 02 March 2011;
Accepted: 04 July 2011;
Published online: 19 July 2011.
Edited by:
Emil C. Toescu, Birmingham University, UKReviewed by:
William Seeley, University of California, USAMonica Baciu, Université Pierre Mendès-France, France
Copyright: © 2011 Schroeter and Neumann. This is an open-access article subject to a non-exclusive license between the authors and Frontiers Media SA, which permits use, distribution and reproduction in other forums, provided the original authors and source are credited and other Frontiers conditions are complied with.
*Correspondence: Matthias L. Schroeter, Max Planck Institute for Human Cognitive and Brain Sciences, Stephanstr. 1A, 04103 Leipzig, Germany. e-mail:c2Nocm9ldEBjYnMubXBnLmRl