 Vijay K. Venkatraman1
 Howard J. Aizenstein1,2* Anne B. Newman3
 Kristine Yaffe4 Tamara Harris5 Stephen Kritchevsky6 Hilsa N. Ayonayon4
 Caterina Rosano3
- 1 Department of Bioengineering, Swanson School of Engineering, University of Pittsburgh, Pittsburgh, PA, USA
- 2 Department of Psychiatry, University of Pittsburgh, Pittsburgh, PA, USA
- 3 Department of Epidemiology, Graduate School of Public Health, University of Pittsburgh, Pittsburgh, PA, USA
- 4 University of California San Francisco, San Francisco, CA, USA
- 5 National Institutes of Health, Bethesda, MD, USA
- 6 Wake Forest University, Winston-Salem, NC, USA
Background: Slowing information processing is common among community-dwelling elderly and it predicts greater mortality and disability risk. Slowing information processing is related to brain macro-structural abnormalities. Specifically, greater global atrophy and greater small vessel disease of the white matter (WM) have been associated with slower processing speed. However, community-dwelling elderly with such macro-structural abnormalities can maintain processing speed. The roles of brain micro-structure for slow processing in very old adults living in the community is uncertain, as epidemiological studies relating these brain markers to cognition and in the context of other health characteristics are sparse. Hypothesis: Information processing is cross-sectionally associated with WM micro-structure independent of overt macro-structural abnormalities and also independent of health related characteristics. Methods: Imaging indices of micro-structure diffusion tensor imaging (DTI) and magnetization transfer imaging (MTI), macro-structure white matter hyperintensities (WMH), gray matter (GM) volume, digit symbol substitution test (DSST), and health characteristics were measured in 272 elderly (mean age 83 years old, 43% men, 40% black) living in the community. Results: The DTI- and MTI-indices of micro-structure from the normal appearing WM and not from the normal appearing GM were associated with DSST score independent of WMH and GM volumes. Associations were also independent of age, race, gender, mini-mental score, systolic blood pressure, and prevalent myocardial infarction. Interpretation: DTI and MTI-indices of normal appearing WM are indicators of information processing speed in this cohort of very old adults living in the community. Since processing slowing is a potent index of mortality and disability, these indices may serve as biomarkers in prevention or treatment trials of disability.
Introduction
As the worldwide population rapidly grows older, the risk of disability steeply increases (Raz et al., 2007). Slowing information processing is one of the best documented, most pervasive and reliable markers of brain aging in non-demented adults (Salthouse, 1996, 2000). Slowing information processing is associated with greater risk of disability and mortality (Rosano et al., 2008), and it is potentially modifiable (Ball et al., 2002). Therefore, understanding the neurological correlates of information processing slowing in older adults may be instrumental to lead future intervention studies.
Decreases in information processing speed in otherwise well-functioning older adults are likely due to multiple inter-related neuropathological factors, including covert brain vascular changes and demyelination. Initial observations indicate that slower processing speed in older adults is associated with brain atrophy and white matter hyperintensities (WMH; Rosano et al., 2008). However, community-dwelling elderly with macro-structural abnormalities can maintain processing speed. We propose that the micro-structure of the normal appearing white matter (WM) plays a role in explaining the variance of processing speed in older adults. The rationale for this hypothesis is based on prior studies with diffusion tensor imaging (DTI) among younger old and of adults with dementia (e.g., Deary et al., 2006; Schiavone et al., 2009; Shimony et al., 2009; Kochunov et al., 2010). To date, neuroimaging data to quantify the micro-structure in relationship with information processing slowing in community-dwelling older adults free from dementia or other diseases are scant, and have primarily examined the individual neuroimaging markers in isolation (Sullivan and Pfefferbaum, 2006).
To identify neuroanatomical correlates associated with information processing speed, we use multiple MR imaging sequences to simultaneously quantify brain abnormalities at the macro-structural and micro-structural level. While conventional neuroimaging of older adults commonly displays smaller total brain volume and WMH volumes (Marner et al., 2003; Resnick et al., 2003). Brain abnormalities at the micro-structural level can remain hidden using these imaging approaches. More recently, magnetization transfer imaging (MTI; Wolff and Balaban, 1994) and DTI (Le Bihan et al., 1986) have been used to measure age-related micro-structural changes that are not visible using conventional MR imaging. DTI-related changes are significantly correlated with brain abnormalities and executive function impairment, including information processing slowing, in aging populations (Salat et al., 2005; Deary et al., 2006; Kochunov et al., 2007, 2009; Kennedy and Raz, 2009a; Madden et al., 2009; Sullivan et al., 2010). MTI-related changes have also been shown in relationship to aging (Ge et al., 2002) and executive function impairment (Filippi et al., 2000; Deary et al., 2006; Schiavone et al., 2009). However, it is not known whether the associations between micro-structural abnormalities and information processing speed remain independent of overt, macro-structural abnormalities such as brain atrophy and WMH. This is particularly important for those individuals who are at greater risk of having these overt macro-structural abnormalities such as individuals with hypertension (Kennedy and Raz, 2009b) and black individuals.
The goal of this manuscript is to characterize the micro-structure of normal appearing white and gray matter (GM) associated with information processing speed in a large racially diverse cohort of older adults. A secondary aim of this study is to examine whether these associations remain independent of other health related factors. This understanding is essential for the development of better prevention and treatment strategies for cognitive aging in late-life.
Materials and Methods
Participants
Participants were recruited from the parent health, aging, and body composition (Health ABC) study. The Health ABC study is a longitudinal, observational cohort study of 3,075 well-functioning older Caucasian and African American men and women from Pittsburgh, PA, USA and Memphis, TN, ages 70–79 when enrolled in 1997–1998. The parent Health ABC study was designed to determine the relationship of changes in body composition, weight, and related health conditions with incident mobility disability. In 2006–2007, Health ABC participants from the Pittsburgh site were invited to participate in the Healthy Brain Project ancillary study (Table 1). Of the 314 subjects who were eligible and interested to receive a 3 T brain MRI, a total of 272 had measurements for all of the variables of interest. In addition to in-person Health ABC assessments, participants received neurocognitive testing and detailed neurological and gait exams. Each subject’s medical history was reviewed to rule out endocrinal, neurological, and/or psychiatric illnesses. All subjects provided written informed consent. The University of Pittsburgh Institutional Review Board approved the protocol.
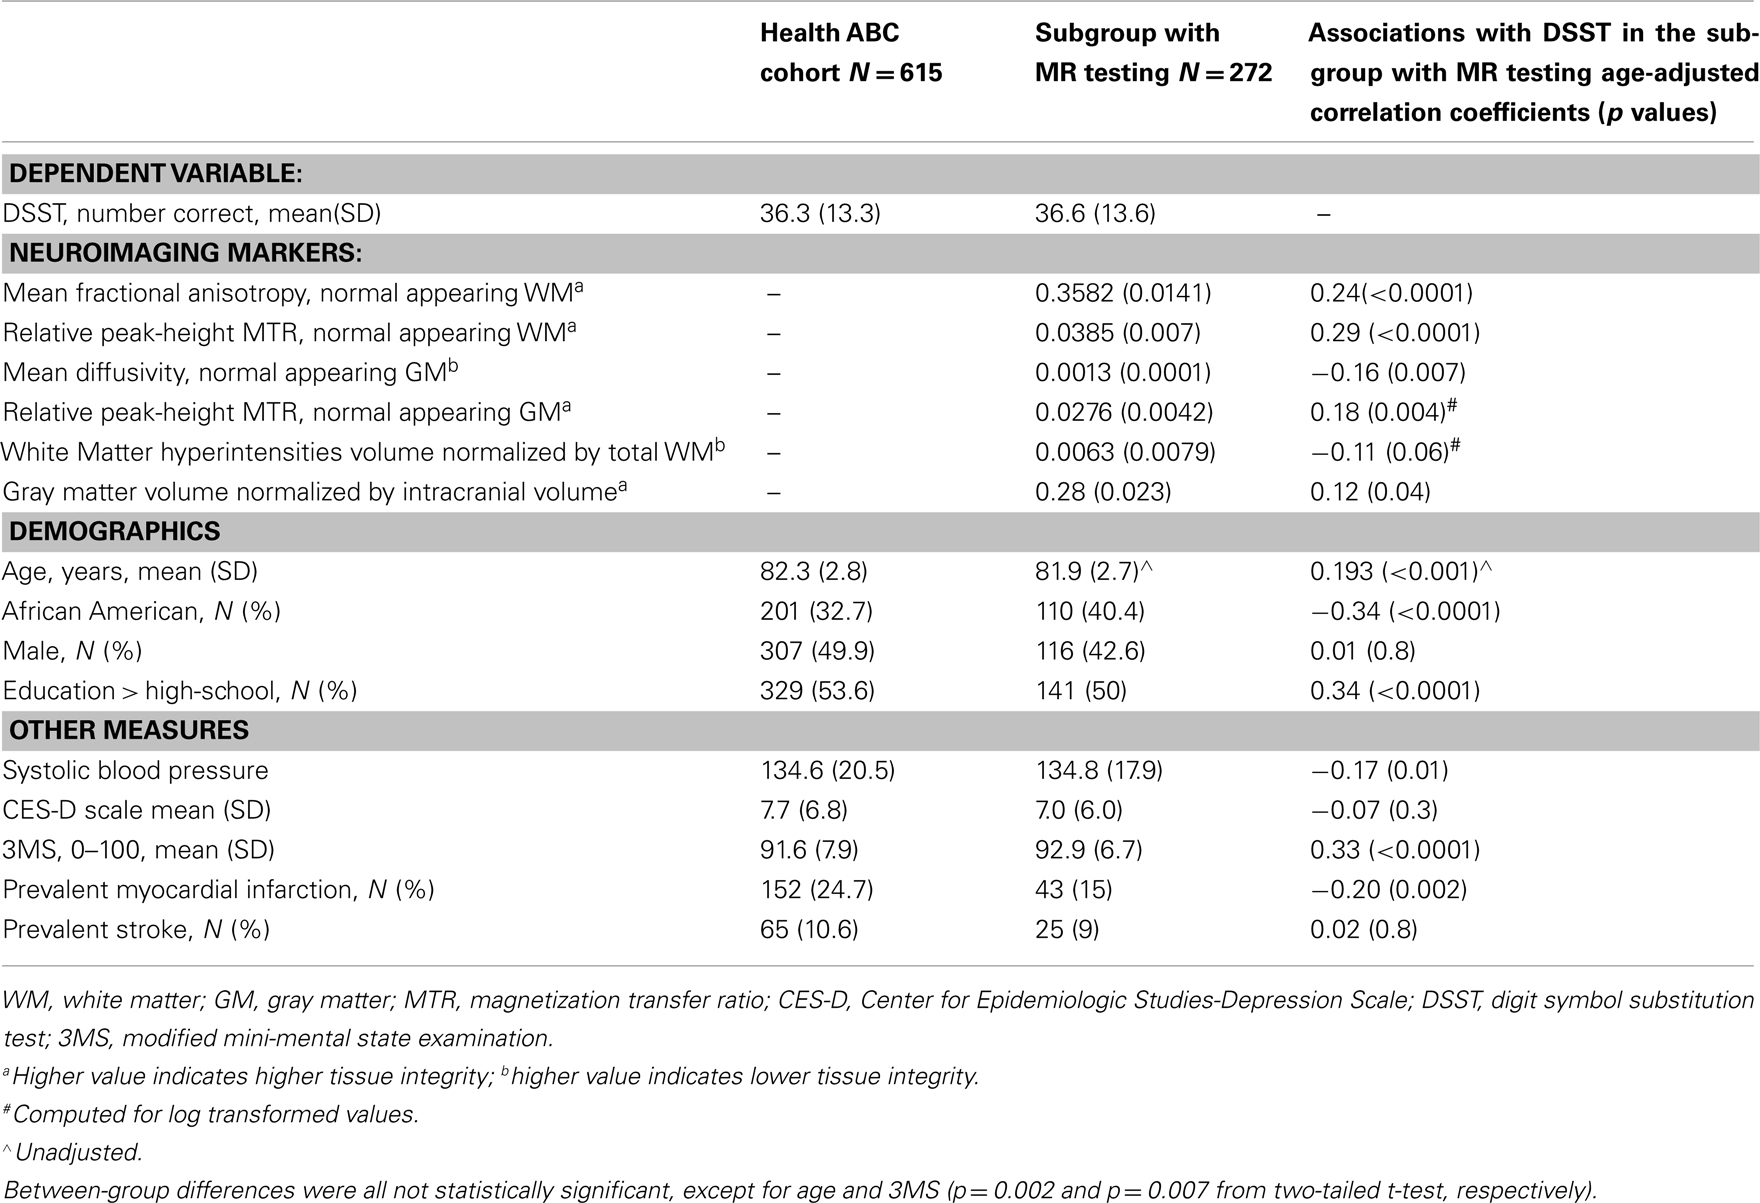
Table 1. Characteristics of the Health ABC cohort seen at the Pittsburgh site in year 10 (n = 778) and the subgroup who received the brain MR and concurrent cognitive testing (n = 272).
The Digit Symbol Substitution Test
The digit symbol substitution test (DSST), a paper and pencil test of psychomotor performance (Wechsler, 1981), is the primary behavioral outcome in this study. We have recently shown that this test correlates most strongly with volume of the left prefrontal cortex, as compared to other neuropsychological tests of information processing speed and executive control function (Rosano et al., 2011). The test consists of a key grid of numbers and matching symbols and a test section with numbers and empty boxes. The participant is instructed to fill the empty boxes with the symbol that matches each number, as fast and accurately as possible. The score is the number of correct number–symbol matches within 90 s. The cognitive processes involved in performing the DSST include sequential encoding, retrieval of numbers, and matching symbols. Incidental memory, perceptual organization, visuomotor coordination, and selective attention have all been associated with DSST performance (Wechsler, 1981). The ability to filter out irrelevant information (e.g., symbols that may look alike) also influences performance. This test has high test–retest reliability (Matarazzo and Herman, 1984).
Health Related Characteristics
In addition to participant’s gender, age, race, and whether or not they achieved a high-school level of education, health characteristics were collected since study entry in 1996–1998. History of myocardial infarction and history of stroke were determined using prevalent disease algorithms based on self-report of physician diagnoses and recorded medications. Systolic blood pressure was measured as the average of two measurements. Depressive symptoms were assessed with the 20-item Center for Epidemiologic Studies-Depression Scale (CES-D), with a score ≥ 16 consistent with possible depression (Radloff, 1977). The modified mini-mental score (3MS) is a brief, general cognitive battery with components for orientation, concentration, language, praxis, and immediate and delayed memory (Teng and Chui, 1987). Possible scores range from 0 to 100, with higher scores indicating better cognitive function.
Image Acquisition
MRI scanning used a Siemens 12-channel head coil and was performed on a 3T Siemens Tim Trio MR scanner at the MR Research Center of the University of Pittsburgh. Four series of MRI images were acquired on the MR scanner. Magnetization-prepared rapid gradient echo (MPRAGE) T1-weighted images were acquired in the axial plane: TR = 2300 ms; TE = 3.43 ms; TI = 900 ms; Flip angle = 9°; slice thickness = 1 mm; FOV = 256 mm × 224 mm; voxel size = 1 mm × 1 mm; matrix size = 256 × 224; and number of slices = 176. Fluid-attenuated inversion recovery (FLAIR) images were acquired in the axial plane: TR = 9160 ms; TE = 89 ms; TI = 2500 ms; FA = 150°; FOV = 256 mm × 212 mm; slice thickness = 3 mm; matrix size = 256 × 240; number of slices = 48 slices; and voxel size = 1 mm × 1 mm. DTI were acquired using single-short spin-echo echo planar imaging sequence with the following parameters: TR = 5300 ms; TE = 88 ms; TI = 2500 ms; Flip angle = 90°; FOV = 256 mm × 256 mm; two diffusion values of b = 0 and 1000 s/mm2; 12 diffusion directions; four repeats; 40 slices; matrix size = 128 × 128; voxel size = 2 mm × 2 mm; slice thickness = 3 mm; and GRAPPA = 2. Two series of sagittal scans (with and without the off-resonance saturation pulse with an offset frequency of 1.5 kHz) were obtained for the MT acquisition across 120 slices with matrix size = 256 × 192; TR = 35ms; TE = 2.86 ms; TI = 300 ms; Flip angle = 15°; slice thickness: 1.5 mm; voxel size = 0.89 mm × 0.89 mm; and FOV = 230 mm × 230 mm. A radiologist checked the MR images used in this study and excluded any unexpected findings from the study.
Image Processing and Analysis
Micro-structural MRI global indices of GM integrity [relative peak-height MT ratio (MTR), and mean diffusivity] and WM integrity (relative peak-height MTR, and mean fractional anisotropy) as well as volume of WMH and of the GM were obtained using previously published methods, briefly described below.
The brain tissue volumes GM, WM, and cerebrospinal fluid (CSF), were calculated by segmenting the skull-stripped T1-weighted image in native anatomical space using the FAST – FMRIB’s Automated Segmentation Tool (Zhang et al., 2001). The total GM volume, WM volume, and CSF volume were estimated in cubic millimeters by summing all voxels classified as these tissue types. Brain segmentation software usually includes the CSF between the surface of the brain and the interior of the skull, but does not always include all of the CSF between the inner skull and the brain. Total intracranial volume was computed as the volume contained within the “inner skull” using the brain extraction tool (BET) with an advanced option (−A; Jenkinson et al., 2005). The WMH volume was obtained from T2-weighted FLAIR image using an automated method for quantification and localization of WMH [21]. The WMH quantification was done using a fuzzy connected algorithm (Udupa and Samarasekera, 1996; Wu et al., 2006). Total WMH volume was estimated by summing all the voxels classified as WMH. The total WMH volume was normalized for brain volume. Total GM volume was normalized by intracranial volume.
DT MRI is a technique that uses the molecular diffusion of water within biologic tissue influenced by the characteristics of the surrounding medium (Le Bihan et al., 1986). The two commonly used parameters are mean diffusivity (MD) – an average magnitude of molecular motion or measure of structural damage (Bhagat and Beaulieu, 2004), and fractional anisotropy (FA) – a index of tract integrity (Pierpaoli and Basser, 1996). The diffusion-weighted images were pre-processed using the FMRIB’s Diffusion Toolbox (Smith et al., 2004) to remove unwanted distortions due to eddy current, the tensor were computed (Basser et al., 1994), and diagonalized to determine the eigenvalues from which the FA and MD maps were computed (Pierpaoli et al., 1996). The FA map was registered to the FMRIB58_FA template (Smith et al., 2004) using the FMRIB’s non-linear image registration tool (FNIRT; Andersson et al., 2007), similar to the tract-based spatial statistics (TBSS; Smith et al., 2006). The transformation was also applied to the MD map. Then, using the segmentation of WM, GM, and WMH that were obtained from the T1-weighted and T2-weighted FLAIR images, the FA and MD maps were restricted to normal appearing WM and normal appearing GM. Mean FA and Mean MD were calculated for normal appearing WM and normal appearing GM.
MT MRI is based on the exchange of magnetization between the protons bound to macromolecules and the protons of free water molecules inside tissue (Wolff and Balaban, 1994). The MTR reflects the efficiency of this exchange. After the magnetization transfer images were re-oriented from sagittal to axial plane, the T1-weighted images were used to strip the skull. Then, the images were used to generate the MTR as the ratio between the signal intensities obtained pre-saturation (Mo) and post-saturation (Ms). The MTR was calculated using the equation MTR = 100 × (Mo − Ms)/Mo. The values with MTR greater than 20% were included; those voxels with MTR less than 20% were excluded (as these were most likely CSF). The WM and GM masks from the T1-weighted image of individual subjects were used to restrict the MTR calculations. The MTR whole brain histograms (256 bins, MTR between 20 and 100 with bin size: 0.3137) were separately computed for GM and WM. To obtain the relative peak-height MTR for WM and GM separately, the histogram bin with the peak frequency was normalized over the total number of voxels in the segmented image.
Statistical Analysis
A total of 272 of 314 persons had a complete dataset of MRI indices (micro-structural and macro-structural measures) and DSST score. Standardized Z-scores were obtained for the MRI indices of micro- and macro-structure. Among the variables examined, the volume of the WMH and the peak-height MTR of the normal appearing GM were skewed (skewness [SE]: 2.4 [0.14] and 5.6 [0.15], respectively). Therefore, statistics for these variables were obtained after log-transformation (skewness [SE]: −0.73 [0.15] and 2.2 [0.15], respectively after log-transformation).
Age-adjusted Pearson correlation coefficients were used to quantify the association of DSST and the MRI indices with other variables to identify potential covariates of interest. Age-adjusted regression models were used to test the association of each of the MRI indices with DSST (one model for each index). The MRI indices that were significantly associated with DSST score were then entered into a stepwise multivariable regression model adjusted for age to identify and select those MRI indices that are associated with DSST independently of each other and also to quantify the strength of the association between each MRI index with the DSST score. The MRI indices thus selected entered a multivariable regression model adjusted for variables that were associated with the main independent variables. Specifically, these variables were entered one at a time and the change in the R2 was measured at each step to quantify how much of the variance of the DSST each added variable contributes to. These analyses were also repeated after stratification by race, because prior reports have indicated race-related differences in MRI indices. Associations between the MR indices of brain micro-structure with DSST were also tested after stratification by gender-specific tertiles of brain atrophy and of WMH. All analyses were done using SPSS, version 18.0 (SPSS, Inc. Chicago, IL, USA).
Results
Sample Characteristics
The sample examined in this study was representative of the existing Health ABC cohort with some expected differences in age (Table 1). Compared to the cohort seen at the Pittsburgh site, this subgroup had 1.5 point higher 3MS score, and this difference was statistically significant after adjusting for age. There were no statistically significant differences (p > 0.1) in the other variables, and results were similar after adjustment for age and gender.
Associations of Population Characteristics with Variables of Interest
Higher DSST score was associated with younger age (p < 0.0001), being white, higher 3MS score, higher systolic blood pressure, more years of school education, and with prevalent myocardial infarction (all at p < 0.05).
MRI indices of macro- and micro-structure were associated with age (p < 0.001), with the exception of peak-height MTR from the gray matter. Gender differences in MRI indices were statistically significant for all except for WMH (p = 0.01). Compared to white participants, black had greater WMH volume, although differences were not statistically significant (p = 0.9). Gender and race stratified MRI indices values are in Table 2.
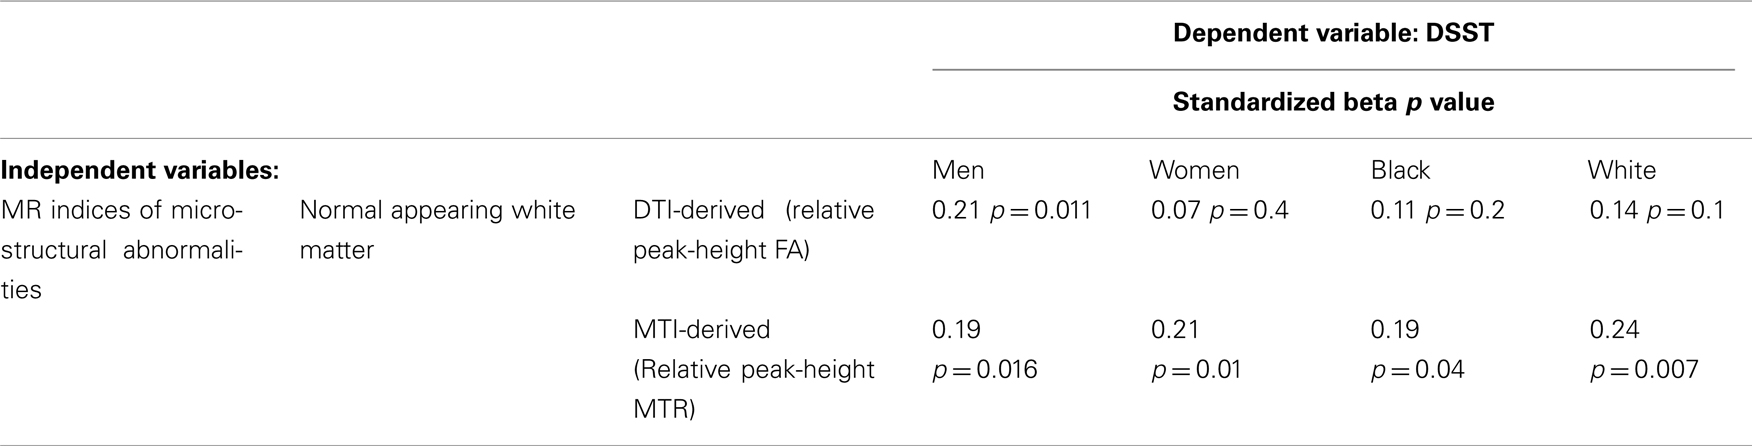
Table 2. Age-adjusted associations of MR indices with DSST in men and women.
Associations between MRI Indices
Overall, age-adjusted correlations between MRI indices were statistically significant at p < 0.05 (Table 3). The only exception was the correlation of the MTI-derived micro-structural index for GM with the macro-structural index for WM (p > 0.1). Scatter plots indicated that the associations were overall linear, even when applying conservative interpolation methods of Lowess.
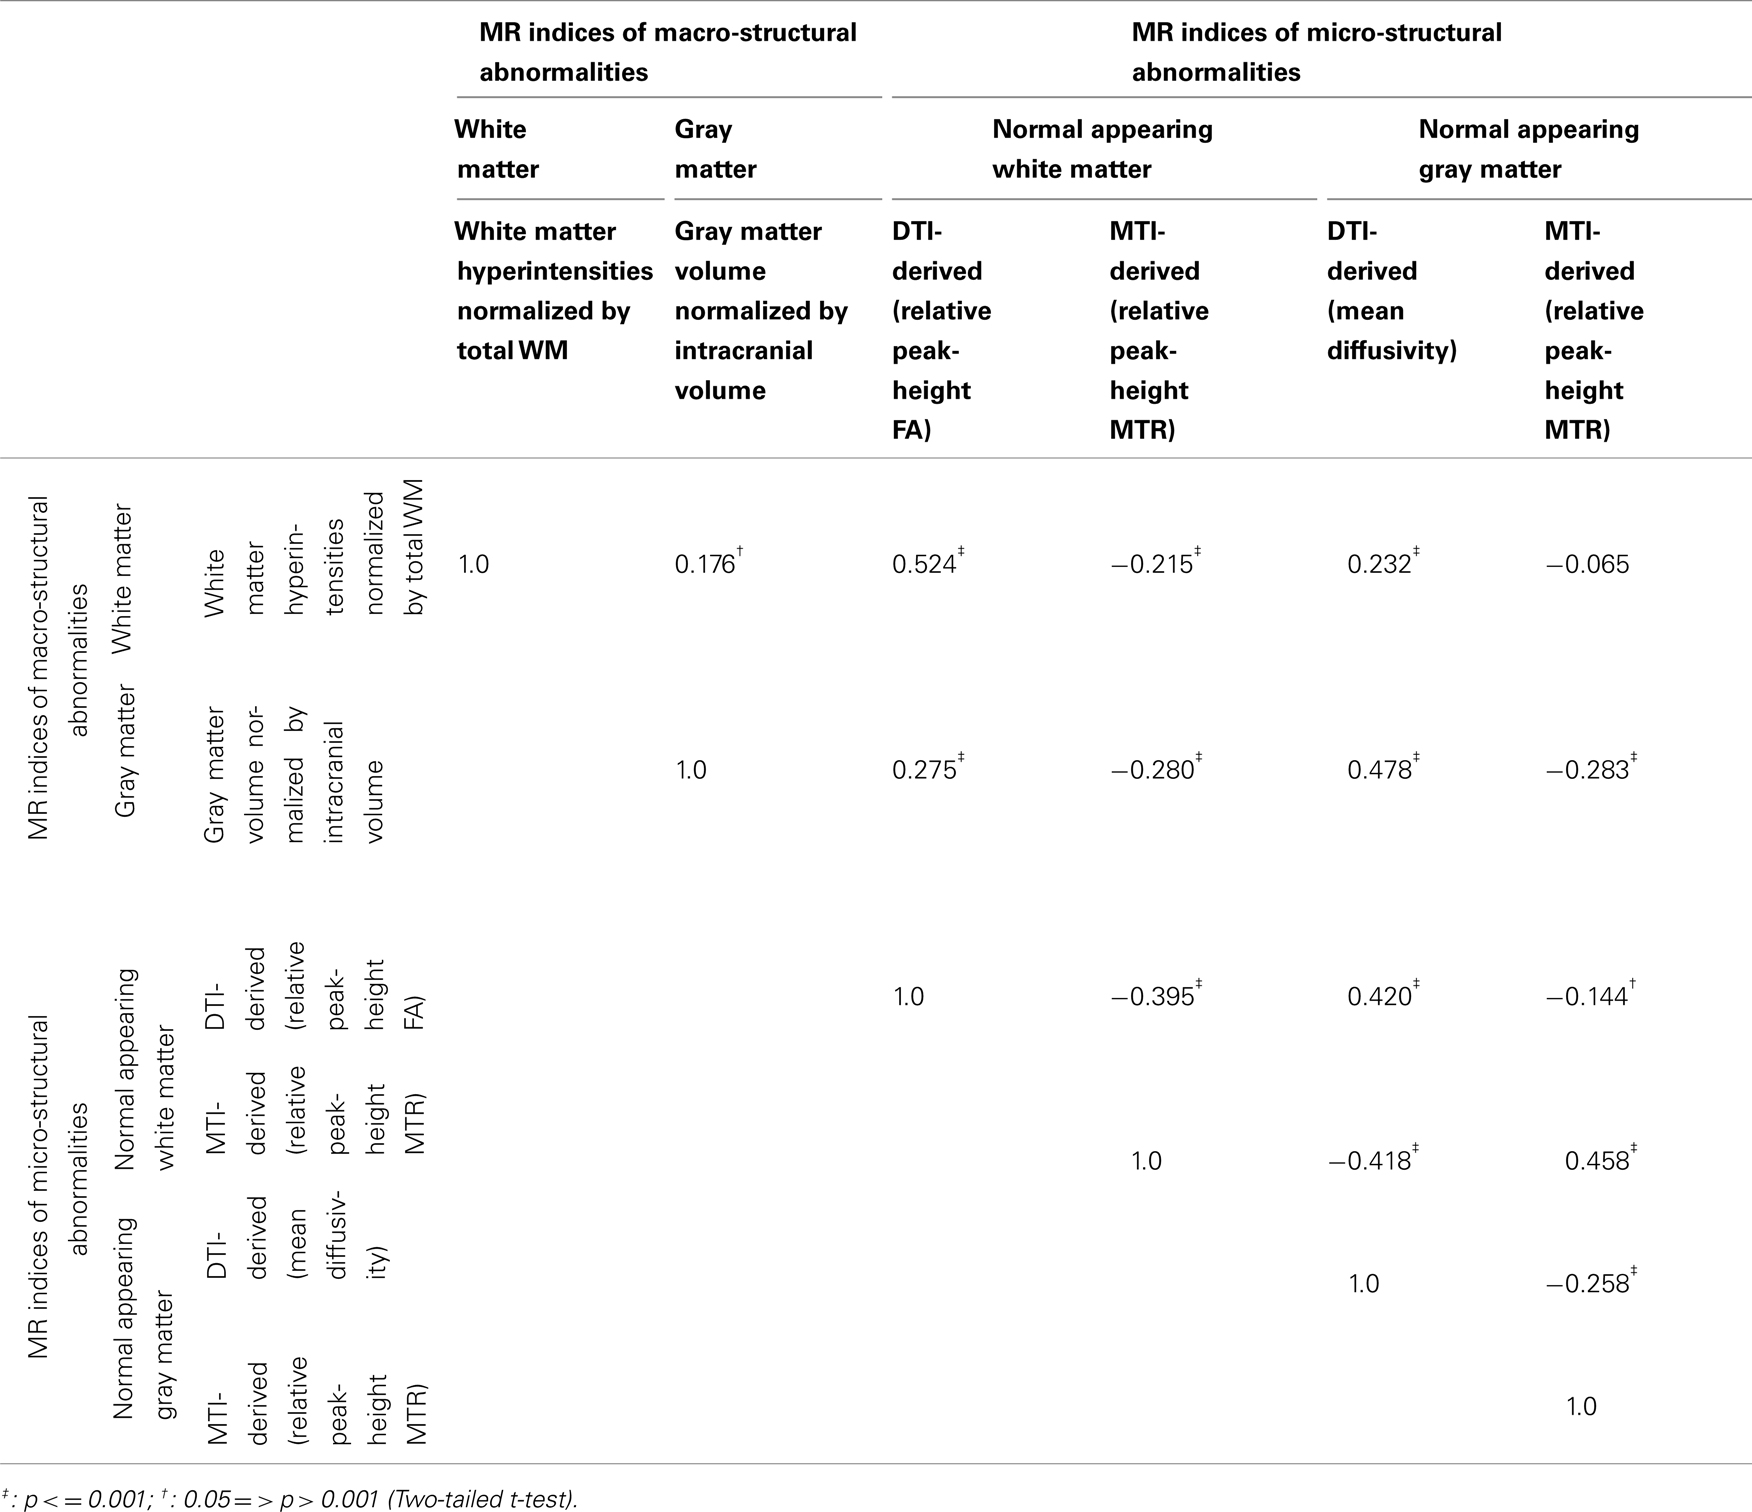
Table 3. Age-adjusted correlation coefficients between MRI indices.
Associations of DSST Score with MRI Indices
The associations between each of the MRI indices and DSST were in the expected direction (Table 1, last column). Associations were statistically significant at p < 0.05 and independent of age, with the exception of WMH (p = 0.06). Associations appeared to be stronger for the DTI and MTI-derived indices of WM, as compared to the DTI and MTI-derived indices of GM or to the MRI indices of macro-structure.
Higher peak-height MTR and higher FA from normal appearing WM, but not other indices of GM, were associated with higher DSST independent of age and of each other (Table 3). A parsimonious age-adjusted model of peak-height MTR and FA from normal appearing WM explained 13% of the variance of the DSST score. Associations remained similar after adjustment for health related factors associated with DSST (shown in Table 1, last column), that is race, education, 3MS, systolic blood pressure and prevalent myocardial infarct. This model explained 31% of the variance of DSST. The associations between the MRI indices of micro-structure of the WM with DSST appeared to be similar within each tertile of WMH and to what observed in the entire sample (Figure 1). Analyses stratified by race and gender (Table 2) indicated that results were similar for men and women as well as for black and white participants.
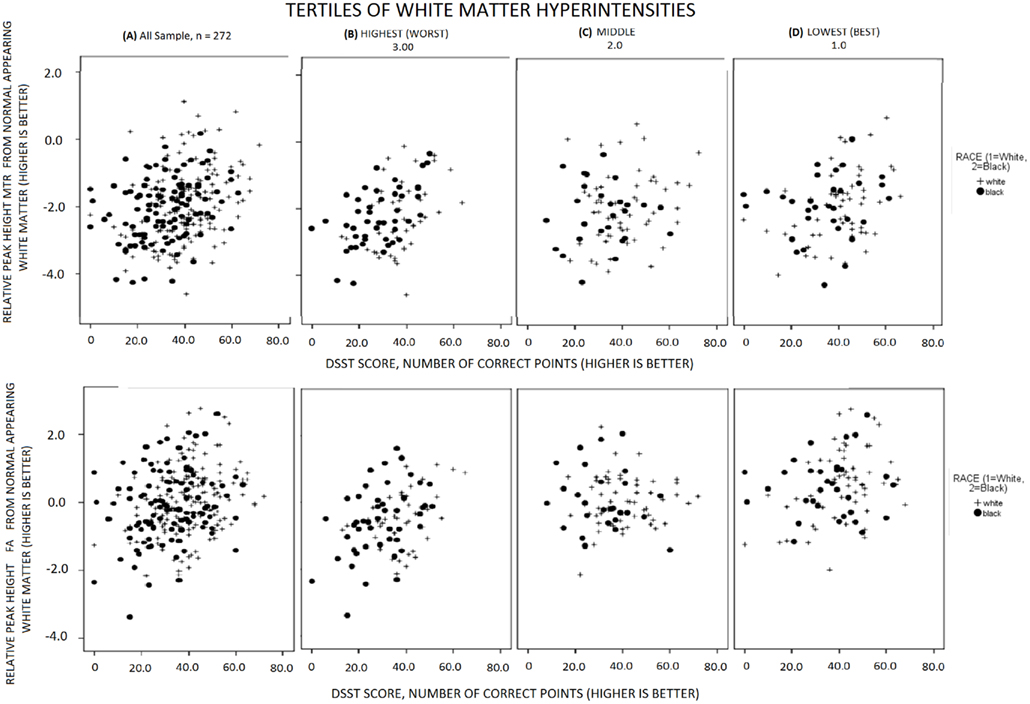
Figure 1. Associations of MRI indices of WM micro-structure with DSST, for black (solid circles) and whites (crosses) in the all sample and in each tertile of WMH volume.
Discussion
Among the MRI indices hereby assessed, micro-structural measures of the normal appearing WM were significantly correlated with information processing speed, as measured by the DSST independently of each other and of other health related factors. While all neuroimaging measures were significantly correlated with each other, there appeared to be only a partial overlap between these markers in explaining the variance of the DSST. Of the imaging markers, the MT index of normal appearing WM accounted for the greatest independent variance in DSST score, indicating that this measure may be most sensitive to cognitive slowing in the elderly. Since cognitive slowing is itself a potent index of mortality and disability, DTI and MTI may hold particular promise as mechanistic intermediate outcome markers in prevention and treatment studies of brain aging.
Our study follows from a number of previous studies of information processing speed across the age span, which suggest that micro-structural WM changes are sensitive markers for disease- and age-related cognitive decline and independent of macro-structural abnormalities such as WMH (e.g., Deary et al., 2006; Schiavone et al., 2009; Shimony et al., 2009; Kochunov et al., 2010). The current study adds to this literature by examining micro-structure of normal appearing GM in addition to normal appearing WM in a large epidemiologic sample of very old individuals. Our observation that micro-structure of the normal appearing WM is associated with processing slowing independent of GM volume is consistent with observations from cognitive aging studies (O’Sullivan et al., 2001; Charlton et al., 2006; Deary et al., 2006; Schiavone et al., 2009).
A strength of our study was that we examined a variety of MRI measures, including both gray and WM measures, using macro- and micro-structural indices. Thus, we were able to test the relative contributions of these markers with each other and with respect to their associations with information processing speed. This study examined one test of processing speed, the DSST because it is a widely used test in epidemiological studies, it is reliable, it is highly correlated with cognitive function. We have recently shown that this test correlates most strongly with volume of the left prefrontal cortex, as compared to other neuropsychological tests of information processing speed and executive control function (Rosano et al., 2011).
A potential limitation of having multiple MR modalities is the dilution of power by the addition of more explanatory variables. One way we chose to mitigate against this limitation in the current study was by limiting the number of variables within each modality through the use of full-brain WM and GM measures. Although regional analyses are important in understanding the relative distribution of the changes across brain, the full-brain indices seem to be the single most useful measures (Nusbaum et al., 2001; van der Flier et al., 2002; DeCarli et al., 2005; Whitwell et al., 2007). Thus for comparing across measures, as we are doing here, we chose to use the full-brain markers.
There are a number of different diffusion imaging pulse sequences, which vary on, among other parameters, the number of acquired directions and the number of averages. The current study used a relatively small number of directions, 12, but chose instead to use a larger number of averages 4, while still maintaining a short acquisition time (5 min). This trade-off favors the accuracy of summary tensor measures (e.g., FA and MD) at the expense of tractographic accuracy. Our analysis approach with non-linear deformation and segmentation of tracts using individual subject’s white-matter mask, was chosen, in part, because it is particularly robust to volumetric changes. Alternative approaches, e.g., voxel-based analyses, where each subject’s DTI data is warped to standard space are more susceptible to the influence of atrophy. The MTI analysis used whole brain histogram techniques, which has two primary limitations, (1) as a full-brain measure, this lacks the anatomic specificity of ROI-based approaches, and (2) the partial volume effects at tissue boundaries could add noise to the measures.
Future studies are needed to validate the use of DTI and MTI as quantitative markers of brain integrity and to assess the effect of intervention on the progression of WM damage. The application of serial MRI with DTI and MTI in older adults may also clarify whether micro-structural age-associated differences precede brain atrophy and the formation of WMH.
Conflict of Interest Statement
The authors declare that the research was conducted in the absence of any commercial or financial relationships that could be construed as a potential conflict of interest.
Acknowledgments
N01-AG-6-2101, N01-AG-6-2103, N01-AG-6-2106. This research was supported in part by the Intramural Research Program of the NIH, National Institute on Aging. K23 AG 028966, R01 AG 029232.
References
Andersson, J. L. R., Jenkinson, M., and Smith, S. (2007). Non-linear registration, aka Spatial normalisation. FMRIB technical report TR07JA2. Available at: www.fmrib.ox.ac.uk/analysis/techrep
Ball, K., Berch, D. B., Helmers, K. F., Jobe, J. B., Leveck, M. D., Marsiske, M., Morris, J. N., Rebok, G. W., Smith, D. M., Tennstedt, S. L., Unverzagt, F. W., Willis, S. L., Advanced Cognitive Training for Independent and Vital Elderly Study Group. (2002). Effects of cognitive training interventions with older adults: a randomized controlled trial. JAMA 288, 2271–2281.
Basser, P. J., Mattiello, J., and LeBihan, D. (1994). Estimation of the effective self-diffusion tensor from the NMR spin echo. J. Magn. Reson. B 103, 247–254.
Bhagat, Y. A., and Beaulieu, C. (2004). Diffusion anisotropy in subcortical white matter and cortical gray matter: changes with aging and the role of CSF-suppression. J. Magn. Reson. Imaging 20, 216–227.
Charlton, R. A., Barrick, T. R., McIntyre, D. J., Shen, Y., O’Sullivan, M., Howe, F. A., Clark, C. A., Morris, R. G., and Markus, H. S. (2006). White matter damage on diffusion tensor imaging correlates with age-related cognitive decline. Neurology 66, 217–222.
Deary, I. J., Bastin, M. E., Pattie, A., Clayden, J. D., Whalley, L. J., Starr, J. M., and Wardlaw, J. M. (2006). White matter integrity and cognition in childhood and old age. Neurology 66, 505–512.
DeCarli, C., Fletcher, E., Ramey, V., Harvey, D., and Jagust, W. J. (2005). Anatomical mapping of white matter hyperintensities (WMH): exploring the relationships between periventricular WMH, deep WMH, and total WMH burden. Stroke 36, 50–55.
Filippi, M., Tortorella, C., Rovaris, M., Bozzali, M., Possa, F., Sormani, M. P., Iannucci, G., and Comi, G. (2000). Changes in the normal appearing brain tissue and cognitive impairment in multiple sclerosis. J. Neurol. Neurosurg. Psychiatr. 68, 157–161.
Ge, Y., Grossman, R. I., Babb, J. S., Rabin, M. L., Mannon, L. J., and Kolson, D. L. (2002). Age-related total gray matter and white matter changes in normal adult brain. Part II: quantitative magnetization transfer ratio histogram analysis. AJNR Am. J. Neuroradiol. 23, 1334–1341.
Jenkinson, M., Pechaud, M., and Smith, S. (2005). “BET2: MR-based estimation of brain, skull and scalp surfaces,” in Eleventh Annual Meeting of the Organization for Human Brain Mapping, Toronto.
Kennedy, K. M., and Raz, N. (2009a). Aging white matter and cognition: differential effects of regional variations in diffusion properties on memory, executive functions, and speed. Neuropsychologia 47, 916–927.
Kennedy, K. M., and Raz, N. (2009b). Pattern of normal age-related regional differences in white matter microstructure is modified by vascular risk. Brain Res. 1297, 41–56.
Kochunov, P., Coyle, T., Lancaster, J., Robin, D. A., Hardies, J., Kochunov, V., Bartzokis, G., Stanley, J., Royall, D., Schlosser, A. E., Null, M., and Fox, P. T. (2010). Processing speed is correlated with cerebral health markers in the frontal lobes as quantified by neuroimaging. Neuroimage 49, 1190–1199.
Kochunov, P., Robin, D. A., Royall, D. R., Coyle, T., Lancaster, J., Kochunov, V., Schlosser, A. E., and Fox, P. T. (2009). Can structural MRI indices of cerebral integrity track cognitive trends in executive control function during normal maturation and adulthood? Hum. Brain Mapp. 30, 2581–2594.
Kochunov, P., Thompson, P. M., Lancaster, J. L., Bartzokis, G., Smith, S., Coyle, T., Royall, D. R., Laird, A., and Fox, P. T. (2007). Relationship between white matter fractional anisotropy and other indices of cerebral health in normal aging: tract-based spatial statistics study of aging. Neuroimage 35, 478–487.
Le Bihan, D., Breton, E., Lallemand, D., Grenier, P., Cabanis, E., and Laval-Jeantet, M. (1986). MR imaging of intravoxel incoherent motions: application to diffusion and perfusion in neurologic disorders. Radiology 161, 401–407.
Madden, D. J., Bennett, I. J., and Song, A. W. (2009). Cerebral white matter integrity and cognitive aging: contributions from diffusion tensor imaging. Neuropsychol. Rev. 19, 415–435.
Marner, L., Nyengaard, J. R., Tang, Y., and Pakkenberg, B. (2003). Marked loss of myelinated nerve fibers in the human brain with age. J. Comp. Neurol. 462, 144–152.
Matarazzo, J. D., and Herman, D. O. (1984). Base rate data for the WAIS-R: test-retest stability and VIQ-PIQ differences. J. Clin. Neuropsychol. 6, 351–366.
Nusbaum, A. O., Tang, C. Y., Buchsbaum, M. S., Wei, T. C., and Atlas, S. W. (2001). Regional and global changes in cerebral diffusion with normal aging. AJNR Am. J. Neuroradiol. 22, 136–142.
O’Sullivan, M., Jones, D. K., Summers, P. E., Morris, R. G., Williams, S. C., and Markus, H. S. (2001). Evidence for cortical “disconnection” as a mechanism of age-related cognitive decline. Neurology 57, 632–638.
Pierpaoli, C., and Basser, P. J. (1996). Toward a quantitative assessment of diffusion anisotropy. Magn. Reson. Med. 36, 893–906.
Pierpaoli, C., Jezzard, P., Basser, P. J., Barnett, A., and Di Chiro, G. (1996). Diffusion tensor MR imaging of the human brain. Radiology 201, 637–648.
Radloff, L. (1977). The CES-D scale: a self-report depression scale for research in the general population. Appl. Psychol. Meas. 1, 385–401.
Raz, N., Rodrigue, K. M., Kennedy, K. M., and Acker, J. D. (2007). Vascular health and longitudinal changes in brain and cognition in middle-aged and older adults. Neuropsychology 21, 149–157.
Resnick, S. M., Pham, D. L., Kraut, M. A., Zonderman, A. B., and Davatzikos, C. (2003). Longitudinal magnetic resonance imaging studies of older adults: a shrinking brain. J. Neurosci. 23, 3295–3301.
Rosano, C., Newman, A. B., Katz, R., Hirsch, C. H., and Kuller, L. H. (2008). Association between lower digit symbol substitution test score and slower gait and greater risk of mortality and of developing incident disability in well-functioning older adults. J. Am. Geriatr. Soc. 56, 1618–1625.
Rosano, C., Studenski, S. A., Aizenstein, H. J., Boudreau, R. M., Longstreth, W. T. Jr., and Newman, A. B. (2011). Slower gait, slower information processing and smaller prefrontal area in older adults. Age Aging (in press).
Salat, D. H., Tuch, D. S., Greve, D. N., van der Kouwe, A. J., Hevelone, N. D., Zaleta, A. K., Rosen, B. R., Fischl, B., Corkin, S., Rosas, H. D., and Dale, A. M. (2005). Age-related alterations in white matter microstructure measured by diffusion tensor imaging. Neurobiol. Aging 26, 1215–1227.
Salthouse, T. A. (1996). The processing-speed theory of adult age differences in cognition. Psychol. Rev. 103, 403–428.
Schiavone, F., Charlton, R. A., Barrick, T. R., Morris, R. G., and Markus, H. S. (2009). Imaging age-related cognitive decline: a comparison of diffusion tensor and magnetization transfer MRI. J. Magn. Reson. Imaging 29, 23–30.
Shimony, J. S., Sheline, Y. I., D’Angelo, G., Epstein, A. A., Benzinger, T. L., Mintun, M. A., McKinstry, R. C., and Snyder, A. Z. (2009). Diffuse microstructural abnormalities of normal-appearing white matter in late life depression: a diffusion tensor imaging study. Biol. Psychiatry 66, 245–252.
Smith, S. M., Jenkinson, M., Johansen-Berg, H., Rueckert, D., Nichols, T. E., Mackay, C. E., Watkins, K. E., Ciccarelli, O., Cader, M. Z., Matthews, P. M., and Behrens, T. E. (2006). Tract-based spatial statistics: voxelwise analysis of multi-subject diffusion data. Neuroimage 31, 1487–1505.
Smith, S. M., Jenkinson, M., Woolrich, M. W., Beckmann, C. F., Behrens, T. E., Johansen-Berg, H., Bannister, P. R., De Luca, M., Drobnjak, I., Flitney, D. E., Niazy, R. K., Saunders, J., Vickers, J., Zhang, Y., De Stefano, N., Brady, J. M., and Matthews, P. M. (2004). Advances in functional and structural MR image analysis and implementation as FSL. Neuroimage 23(Suppl. 1), S208–S219.
Sullivan, E. V., and Pfefferbaum, A. (2006). Diffusion tensor imaging and aging. Neurosci. Biobehav. Rev. 30, 749–761.
Sullivan, E. V., Rohlfing, T., and Pfefferbaum, A. (2010). Quantitative fiber tracking of lateral and interhemispheric white matter systems in normal aging: relations to timed performance. Neurobiol. Aging 31, 464–481.
Teng, E. L., and Chui, H. C. (1987). The modified mini-mental state (3MS) examination. J. Clin. Psychiatry 48, 314–318.
Udupa, J. K., and Samarasekera, S. (1996). Fuzzy connectedness and object definition: theory, algorithms, and applications in image segmentation. Graph. Models Image Process. 58, 246–261.
van der Flier, W. M., van den Heuvel, D. M., Weverling-Rijnsburger, A. W., Bollen, E. L., Westendorp, R. G., van Buchem, M. A., and Middelkoop, H. A. (2002). Magnetization transfer imaging in normal aging, mild cognitive impairment, and Alzheimer’s disease. Ann. Neurol. 52, 62–67.
Wechsler, D. (1981). Wechsler Adult Intelligence Scale – Revised Manual. New York: Psychological Corporation.
Whitwell, J. L., Jack, C. R. Jr., Parisi, J. E., Knopman, D. S., Boeve, B. F., Petersen, R. C., Ferman, T. J., Dickson, D. W., and Josephs, K. A. (2007). Rates of cerebral atrophy differ in different degenerative pathologies. Brain 130(Pt 4), 1148–1158.
Wolff, S. D., and Balaban, R. S. (1994). Magnetization transfer imaging: practical aspects and clinical applications. Radiology 192, 593–599.
Wu, M., Rosano, C., Butters, M., Whyte, E., Nable, M., Crooks, R., Meltzer, C. C., Reynolds, C. F. III., and Aizenstein, H. J. (2006). A fully automated method for quantifying and localizing white matter hyperintensities on MR images. Psychiatry Res. 148, 133–142.
Keywords: digit symbol substitution score, oldest old, magnetization transfer, diffusion tensor imaging, white matter
Citation: Venkatraman VK, Aizenstein HJ, Newman AB, Yaffe K, Harris T, Kritchevsky S, Ayonayon HN and Rosano C (2011) Lower digit symbol substitution score in the oldest old is related to magnetization transfer and diffusion tensor imaging of the white matter. Front. Ag. Neurosci. 3:11. doi: 10.3389/fnagi.2011.00011
Received: 13 July 2011;
Paper pending published: 03 August 2011;
Accepted: 15 August 2011;
Published online: 27 September 2011.
Edited by:
Hari S. Sharma, Uppsala University, SwedenCopyright: © 2011 Venkatraman, Aizenstein, Newman, Yaffe, Harris, Kritchevsky, Ayonayon and Rosano. This is an open-access article subject to a non-exclusive license between the authors and Frontiers Media SA, which permits use, distribution and reproduction in other forums, provided the original authors and source are credited and other Frontiers conditions are complied with.
*Correspondence: Howard J. Aizenstein, Department of Psychiatry, University of Pittsburgh, 3811 O’Hara Street, Pittsburgh, PA 15213, USA. e-mail:YWl6ZW5AcGl0dC5lZHU=