 Athanasios Alexiou
 Vasileios D. Mantzavinos
 Nigel H. Greig
 Mohammad A. Kamal
- 1Novel Global Community Educational Foundational, Hebersham, NSW, Australia
- 2Department of Computer Science and Biomedical Informatics, University of Thessaly, Lamia, Greece
- 3Drug Design and Development Section, Translational Gerontology Branch, Intramural Research Program, National, Institute on Aging, National Institutes of Health, Biomedical Research Center, Baltimore, MD, USA
- 4Metabolomics and Enzymology Unit, Fundamental and Applied Biology Group, King Fahd Medical Research Center, King Abdulaziz University, Jeddah, Saudi Arabia
- 5Enzymoics, Hebersham, NSW, Australia
Alzheimer's disease treatment is still an open problem. The diversity of symptoms, the alterations in common pathophysiology, the existence of asymptomatic cases, the different types of sporadic and familial Alzheimer's and their relevance with other types of dementia and comorbidities, have already created a myth-fear against the leading disease of the twenty first century. Many failed latest clinical trials and novel medications have revealed the early diagnosis as the most critical treatment solution, even though scientists tested the amyloid hypothesis and few related drugs. Unfortunately, latest studies have indicated that the disease begins at the very young ages thus making it difficult to determine the right time of proper treatment. By taking into consideration all these multivariate aspects and unreliable factors against an appropriate treatment, we focused our research on a non-classic statistical evaluation of the most known and accepted Alzheimer's biomarkers. Therefore, in this paper, the code and few experimental results of a computational Bayesian tool have being reported, dedicated to the correlation and assessment of several Alzheimer's biomarkers to export a probabilistic medical prognostic process. This new statistical software is executable in the Bayesian software Winbugs, based on the latest Alzheimer's classification and the formulation of the known relative probabilities of the various biomarkers, correlated with Alzheimer's progression, through a set of discrete distributions. A user-friendly web page has been implemented for the supporting of medical doctors and researchers, to upload Alzheimer's tests and receive statistics on the occurrence of Alzheimer's disease development or presence, due to abnormal testing in one or more biomarkers.
Introduction
A precise etiology of Alzheimer's disease (AD) is still unclear while several risk factors have been recognized to catalytically affect the early onset and the progression of the disease (Abbott and Dolgin, 2016). According to latest studies (Dubois et al., 2007), AD can be categorized according to potential risk factors, symptoms and pathophysiological lesions into eight different categories (Table 1). Furthermore, these eight categories can be analyzed in depth by adding potential biomarkers in each category (Figure 1) which have been proved to affect the severity of the disease (Mantzavinosa et al., 2017). While several attempts at reducing AD severity have already been presented targeting mainly the symptomatic treatment (Ashraf et al., 2015) until now, there is no holistic therapy available that can efficiently reverse AD. For many scientists and pharmaceuticals companies, there are several and different treatment approaches for AD such as cholinesterase inhibitors, NMDA receptor antagonist, β-secretase inhibitors, γ-secretase inhibitors, α-secretase stimulators, tau inhibitors, immunotherapy, nutraceuticals, and nano drugs (Ashraf et al., 2015; Soursou et al., 2015) even though the more secure solution seems to be the early diagnosis of neurodegeneration signs, in order to facilitate the early diagnosis or prediction.
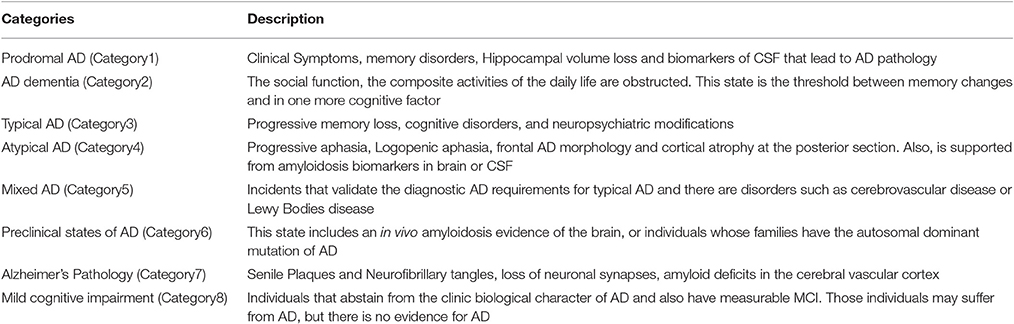
Table 1. Alzheimer's disease classification according to symptoms and lesions based on the “Research criteria for the diagnosis of Alzheimer's disease: revising the NINCDS-ADRDA criteria” (Abbott and Dolgin, 2016).
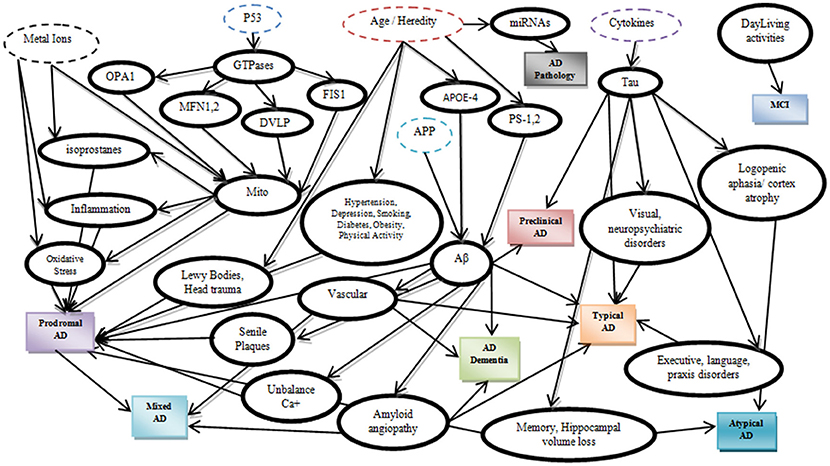
Figure 1. Alzheimer's disease biomarkers expressed through a Bayesian Network.
In this regards, Bayesian Statistics constitutes a powerful tool for Science and especially for Biomedical Informatics and Medical Decision Systems. Markov Chain Monte Carlo (MCMC) theory was provided as a solution several times, targeting environmental' s or diseases' evaluations with satisfactory results (Tzoufras, 2009). Bayesian statistics uses all the unknown parameters as random variables, to pre-define the prior distribution of the model and calculate the posterior distribution f(θ|y), which can be expressed as:
or including both the prior and the observed data by the expression of the prior distribution f(θ) and the likelihood f(y|θ) as follows:
In this research paper, a new probabilistic model was created, describing the relationship between AD biomarkers, which may reveal and influence the disease's development, presence or progression. The algorithmic approach to AD prediction coded with WinBUGS biostatistics software (Lunn et al., 2000) for Bayesian inference, data analysis, and modeling. The model, the initial data and few examples are described in the Experimental section of this paper.
Materials and Methods
A Probabilistic Approach to AD
Let us recall some basic mathematical notations concerning the Bayesian approach (Congdon, 2005; Vidakovic, 2011; Højsgaard, 2012). Assume a random variable Y known as a response, which follows a probabilistic path f(y|θ), where θ is a parameter vector. We consider a sample y = [y1, y2,….,yn] of size n. If we assume two possible events A, B where A = A1 ∪ A2 ∪.…∪ An, Ai ∩ Aj = ∅ ∀ i ≠ j, Bayes Theorem calculates the probability to occur an event Ai given B,
In general,
Finally, given the observed data y1, y2,…,yn, the posterior distribution f(θ|y1,…,yn) could be calculated from the prior distribution. Bayesian Inference is based on the p(θ|y) factor which is used by MCMC methods. Markov Chain Monte Carlo methods are based on iterative sampling from the posterior distribution, using various chain probabilities of the sample parameters and resulting posterior means and variances of the parameters or functions of the parameters Δ = Δ(θ) as follows:
The most popular MCMC methods are the Metropolis-Hastings Algorithm (Metropolis et al., 1953; Hastings, 1970) and its particular case, the Gibbs Sampling (Geman and Geman, 1984). In 1988, Lauritzen and Spiegelhalter presented for the first time a Bayesian expert system, the “ASIA model,” introducing a fictitious medical decision system for the explanation of dyspnea due to a patient's recent visit to Asia and the presence of several other symptoms (Lauritzen and Spiegelhalter, 1988).
The proposed in this paper AD prediction model was established based on the Bayesian Networks (BN). According to BN theory, if we assume a directed graph G with N nodes, each node n ∈ N has a number of paternal nodes pa(n) that may be linked with “child” nodes and the joint distribution for such a network given as follows:
By taking into consideration the latest calculations for the relative probabilities of AD progression due to certain brain lesions (Table 2) (Christen, 2000; de la Torre, 2002; Praticò et al., 2002; Modrego and Ferrández, 2004; Hooper et al., 2007; Cheung et al., 2008; Stone, 2008; Schuff et al., 2009; Snider et al., 2009; Wang et al., 2009; Israeli-Korn et al., 2010; Barnes and Yaffe, 2011; Nazem and Mansoori, 2011; Serrano-Pozo et al., 2011; Bird, 2012; Alzheimer's Association, 2015; Chakrabarty et al., 2015) and the majority of the published AD biomarkers (Albert et al., 2010, 2011; Besson et al., 2015; Cabezas-Opazo et al., 2015; Dong et al., 2015; Duce et al., 2015; Eskildsen et al., 2015; Jansen et al., 2015; Madeira et al., 2015; Michel, 2015; Nakanishi et al., 2015; Ossenkoppele et al., 2015; Østergaard et al., 2015; Quiroz et al., 2015; Ringman et al., 2015; Risacher et al., 2015; Sastre et al., 2015; Schindler and Fagan, 2015; Sutphen et al., 2015; Thordardottir et al., 2015; Cauwenberghe et al., 2016; Counts et al., 2016; Gaël et al., 2016; Yang et al., 2016) or calculating indirectly the relative probabilities, we designed a Bayesian model for the prediction of AD based on the abnormal testing of one or more biomarkers. The described probabilities were exported through major clinical trials globally and are continuously subject to updating and redefinition. The proposed model includes the main AD categories formulated by the categorical prior distribution.
the majority of biomarkers that underlie AD severity and are represented as an acyclic graph.
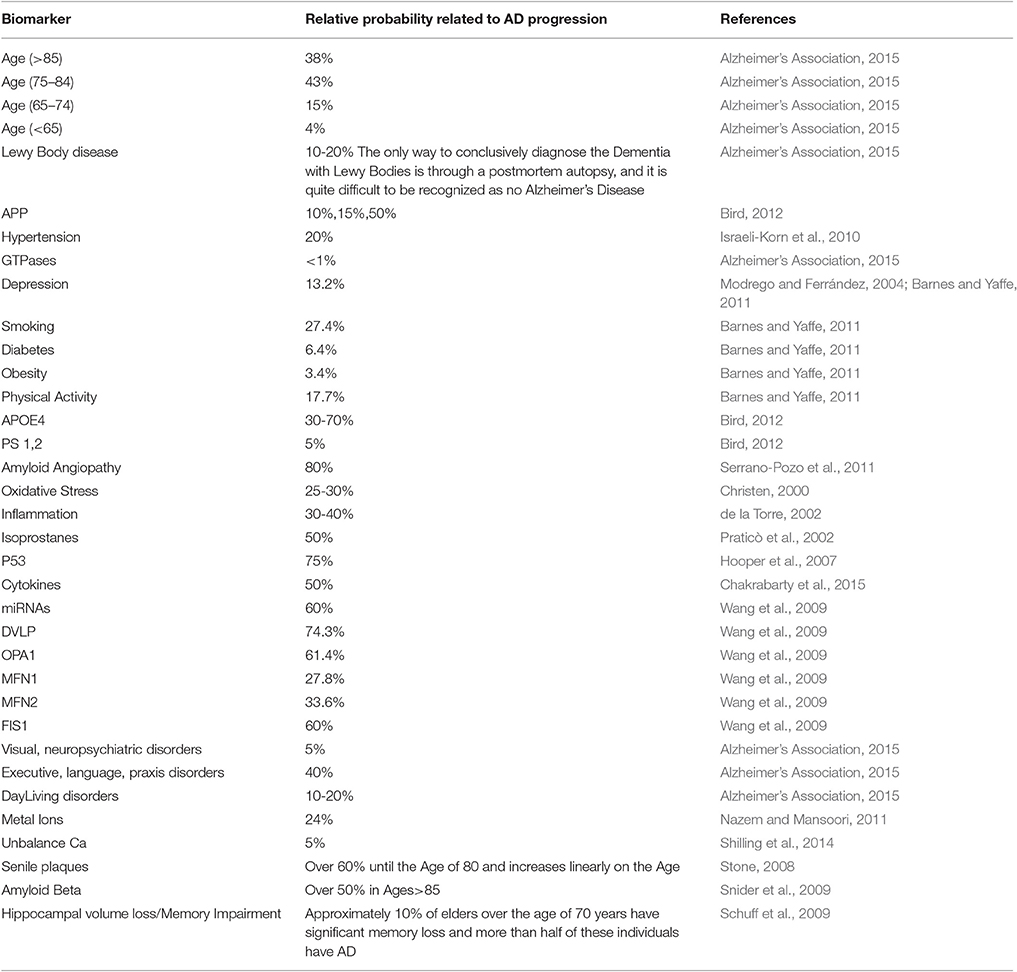
Table 2. Alzheimer's disease biomarkers, biomarkers' probabilistic impact on Alzheimer's disease presence and the corresponding bibliographic reference.
The Winbugs software requires all the parent knots of the acyclic graph to be initialized as True, something that does not affect the model execution. In the second step of the initialization mode, the “parent” knots Metal_Ions, p53, Age/Heredity, APP, Cytokines are defined with their probabilistic values that indicate the True value, and then all the “child” knots are simply set to False/True. An exception is proposed and occur in the case of LewyBodies existence, while the only way to conclusively diagnose the Dementia with Lewy bodies is through a postmortem autopsy and it is quite difficult to be recognized as a no Alzheimer's Disease case (Figure 2). When a biomarker is finally selected as True, then the probabilistic impact value is attributed to the related knot, according to Table 2 and the following rule: for the “parent” knots first we assign the probability to be False and then the probability to be True. For the “child” knots we assign probabilities in the form of False|False, False|True, True|False, True|True (Figures 3–6).
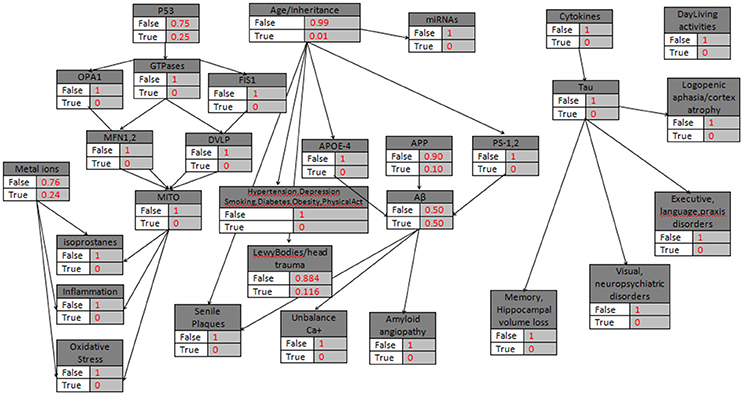
Figure 2. The general probabilistic model with the knots initializations. APP is set to 10%, Age>85, the “parent” knots and the LewyBodies are set to their probabilistic values.
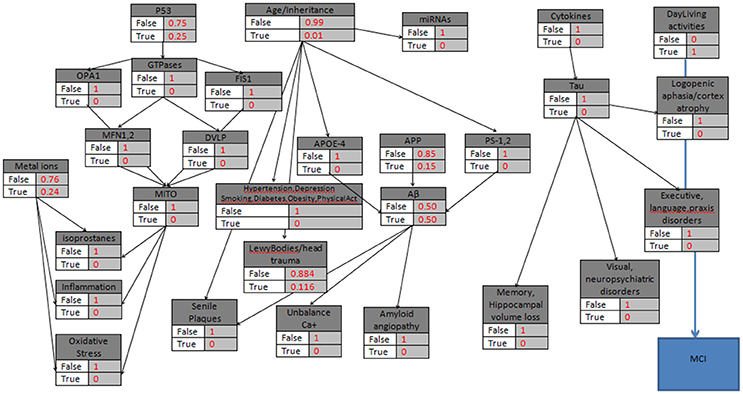
Figure 3. The probabilistic model that can be used for MCI validation with the knots initializations. APP is set to 15%, Age>85, the “parent” knots and the LewyBodies are set to their probabilistic values, and the DailyAcivities have a “strong” probability equal to 1.
Experimental
While a single biomarker can be related to more than one AD types, the probabilistic model consists of categorical variables-nodes (~dcat) where each variable node can be linked with two or more parent variables-nodes or can be presented as a single and independent variable-node. In the case where a node is linked to more than two parent nodes, another similar variable-node is created at the same level within the model. The proposed BN has been designed according to the latest “Research criteria for the diagnosis of Alzheimer's disease: revising the NINCDS-ADRDA criteria” (Dubois et al., 2007) and the model exports for every AD category the maximum probability value given by the biomarkers' evaluation, as it is described below along with the lists of initial values and data from the Winbugs Software.
The General Form of the Model{
Age~ dcat([1:2])
Ab~dcat(APOE4, PS1-2, APP[1:2])
Tau, Phospho ~ dcat(Cytokines 1:2])
MetalIons ~ dcat([1:2])
LewyBodies ~dcat(Age[1:2])
Hypertension ~ dcat(p.Hypertension[Age_Inheritance,1:2])
Depression ~ dcat(p.Depression[Age_Inheritance,1:2])
Smoking ~dcat(p.Smoking[Age_Inheritance,1:2])
Diabetes ~dcat(p.Diabetes[Age_Inheritance,1:2])
Obesity~dcat(p.Obesity[Age_Inheritance,1:2])
PhysicalActivity~dcat(p.PhysicalActivity[Age_Inheritance,1:2])
APP ~ dcat([1:2])
GTP ~ dcat(p53[1:2])
APOE4 ~ dcat(Age[1:2])
PS1-2 ~ dcat(Age[1:2])
Cytokines ~ dcat([1:2])
SenilePlaques ~ dcat(Ab[1:2])
UnbalanceCa ~ dcat(Ab[1:2])
Vascular ~ dcat(Ab, Tau_Phospho[1:2])
LogopenicAphasia, CortexAtrophy~dcat(Tau_Phospho[1:2])
Memory, HippocampalLoss~dcat(Tau, Phospho[1:2])
ExecLangPrax~dcat(Tau_Phospho[1:2])
Visual, Neuropsychiatric~dcat(Tau_Phospho[1:2])
DailyActivities ~ dcat([1:2])
OxidStress, Inflamation, Isoprostanes ~dcat( Mito, MetalIons [1:2])
Mito ~dcat( MetalIons,OPA1, MFN1,DVLP, FIS1 [1:2] )
MFN1~dcat(GTP[1:2])
OPA1~dcat(GTP[1:2])
DVLP~dcat(GTP[1:2])
FIS1~dcat GTP[1:2])
p53 ~ dcat([1:2])
miRNAs~dcat(Age[1:2])
MCI~dcat(DailyAct[1:2])
max1 ← max(Ab, LewyBodies, Mito, OxidStress,
Memory_Hippocampal_loss, SenilePlaques,
Unbalance_Ca, Hypertension_depression, Inflamation, Isoprostanes, Mito )
ProdromalAD ← max(max1,OxidStress)
ADdementia ← max(Ab, Vascular)
max2 ← max(Ab, Tau, Phospho, Vascular, ExecLangPrax)
TypicalAD ← max(max2, Visual, Neuropsychiatric)
AtypicalAD ← max(LogopenicAphasia, CortexAtrophy, Memory, HippocampalLoss)
MixedAD ← max(Vascular,Category1)
PreclinicalAD ← max(Ab, Tau, Phosph)
ADPathology ← miRNAs
MildCognitiveImpairment ← MCI
}
The model can be extended or adjusted to new biomarkers or relations between the symptoms, the lesions and the exported AD categories. Additionally, the relative probabilities can be updated or even more replaced by the biomarkers values when a secure protocol for AD diagnosis will be verified or proposed by the international health associations. Four examples are provided below concerning cases of abnormal biomarkers tests, revealing potential AD presence.
Results
Example 1
In the first hypothetical case study, a patient is assumed to be diagnosed with problems in daily living activities but with no other results of abnormal AD biomarkers. Additionally, the patient belongs to a risk group due to the age factor (>85). Therefore, while there is evidence only for abnormal Daily-Living activities, the corresponding node becomes “True,” and all the other nodes take the “False” value (Figure 3). The model calculates the P(MCI|DailyLivingActivities), the probability that Mild Cognitive Impairment is characterized ‘True’ given the DailyLivingActivities variable, which can be written as follows:
Data List
(Age_Inheritance =2, MetalIons=2, APP=2, Cytokines=2, DailyActivities=2, p53=2,
p.Age_Inheritance = c(0.99,0.01),
p.Ab= structure(.Data = c(0.50,0.50,0.50,0.50,0.50,0.50,0.50,0.50), .Dim = c(2,2,2)),
p.Tau_Phospho =structure(.Data = c(1,0,1,0), .Dim = c(2,2)),
p.MetalIons = c(0.76, 0.24),
p.LewyBodies=structure(.Data = c(0.884,0.116,0.884,0.116), .Dim = c(2,2)),
p.Hypertension=structure(.Data = c(1,0,1,0), .Dim = c(2,2)),
p.Depression=structure(.Data = c(1,0,1,0), .Dim = c(2,2)),
p.Smoking=structure(.Data = c(1,0,1,0), .Dim = c(2,2)),
p.Diabetes=structure(.Data = c(1,0,1,0), .Dim = c(2,2)),
p.Obesity=structure(.Data = c(1,0,1,0), .Dim = c(2,2)),
p.PhysicalActivity=structure(.Data =c(1,0,1,0), .Dim = c(2,2)),
p.APP = c(0.90,0.10),
p.GTP = structure(.Data = c(1,0,1,0), .Dim = c(2,2)),
p.APOE4 = structure(.Data = c(1,0,1,0), .Dim = c(2,2)),
p.PS1_2 = structure(.Data = c(1,0,1,0), .Dim = c(2,2)),
p.Cytokines = c(1,0),
p.SenilePlaques = structure(.Data = c(1,0,1,0,1,0,1,0), .Dim = c(2,2,2)),
p.Unbalance_Ca = structure(.Data = c(1,0,1,0,1,0,1,0), .Dim = c(2,2,2)),
p.Vascular = structure(.Data = c(1,0,1,0,1,0,1,0), .Dim = c(2,2,2)),
p.LogopenicAphasiaCortexAtrophy =structure(.Data =c(1,0,1,0), .Dim = c(2,2)),
p.MemoryHippocampalLoss = structure(.Data = c(1,0,1,0), .Dim = c(2,2)),
p.ExecLangPrax=structure(.Data = c(1,0,1,0), .Dim = c(2,2)),
p.VisualNeuropsychiatric =structure(.Data = c(1,0,1,0), .Dim = c(2,2)),
p.DailyActivities = c(0,1),
p.OxidStress1=structure(.Data = c(1,0,1,0,1,0,1,0), .Dim = c(2,2,2)),
p.OxidStress2=structure(.Data = c(1,0,1,0,1,0,1,0), .Dim = c(2,2,2)),
p.Inflamation1=structure(.Data = c(1,0,1,0,1,0,1,0), .Dim = c(2,2,2)),
p.Inflamation2=structure(.Data = c(1,0,1,0,1,0,1,0), .Dim = c(2,2,2)),
p.Isoprostanes1=structure(.Data = c(1,0,1,0,1,0,1,0), .Dim = c(2,2,2)),
p.Isoprostanes2=structure(.Data = c(1,0,1,0,1,0,1,0), .Dim = c(2,2,2)),
p.Mito1=structure(.Data = c(1,0,1,0,1,0,1,0), .Dim = c(2,2,2)),
p.Mito2=structure(.Data = c(1,0,1,0,1,0,1,0), .Dim = c(2,2,2)),
p.Mito3=structure(.Data = c(1,0,1,0), .Dim = c(2,2)),
p.MFN1 = structure(.Data = c(1,0,1,0), .Dim = c(2,2)),
p.OPA1= structure(.Data = c(1,0,1,0), .Dim = c(2,2)),
p.DVLP= structure(.Data = c(1,0,1,0), .Dim = c(2,2)),
p.FIS1= structure(.Data = c(1,0,1,0), .Dim = c(2,2)),
p.p53 = c(0.75,0.25),
p.Ab_APP= structure(.Data = c(1,0,1,0), .Dim = c(2,2)),
p.miRNAs=structure(.Data=c(1,0,1,0), .Dim = c(2,2)),
p.MCI_due_to_DayLiving=structure(.Data=c(0.001,0.999,0.001,0.999), .Dim = c(2,2)))
Executing the Winbugs code, the result for MCI category is the same as calculated above.
For each stochastic variable of the generated probabilistic model, Winbugs defines the categorical interval (Dubois et al., 2007; Abbott and Dolgin, 2016) for the categorical distribution ~dcat, which receives only positive values. The MCMC results, posterior summary estimations, mean, standard deviation and the estimation of the error is implemented by the batch mean method (Tables 3, 4). After 3000 and 10000 iterations of the current MCMC Winbugs algorithms, the mean value of MCI category can be similarly calculated as:
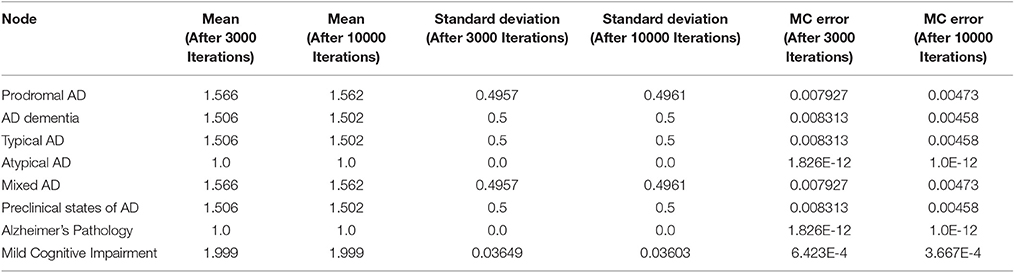
Table 3. WINBUGS statistics for Alzheimer's disease categories according to Example 1.
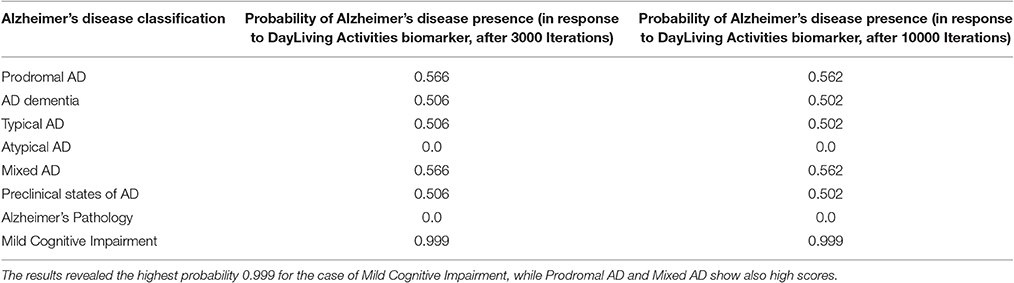
Table 4. The total probability value for Alzheimer's disease presence due to alterations in DayLiving Activities.
Example 2
In a similar case (age>85) where miRNAs' biomarker is assumed to be “True”, and there is no other evidence of heredity concerning AD (Figure 4), the model calculates the P(ADPathology|miRNAs). However, while miRNAs' node is also linked to the Age/Heredity node, there is a probabilistic relation between the Age/Heredity and miRNAs' nodes (Tables 5, 6).
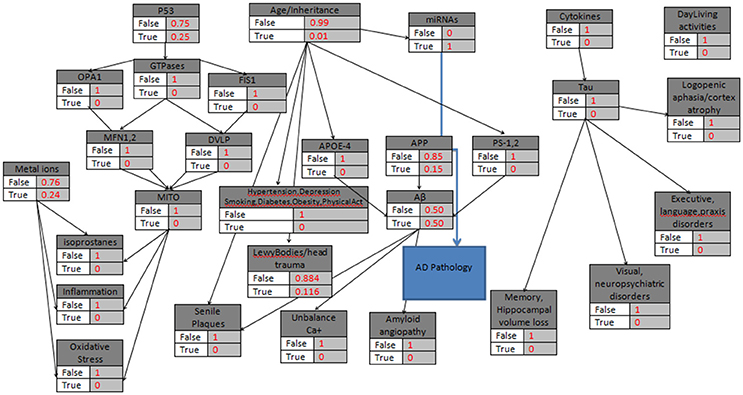
Figure 4. The probabilistic model that can be used for AD Pathology validation with the knots initializations. APP is set to 15%, Age>85, the “parent” knots and the LewyBodies are set to their probabilistic values, and the miRNAs have a “strong” probability equal to 1.
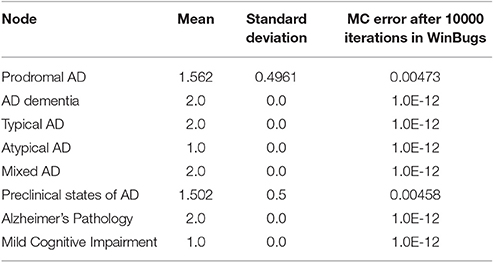
Table 5. WINBUGS statistics for Alzheimer's disease categories according to Example 2.
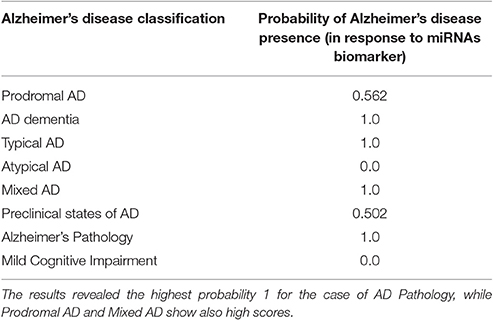
Table 6. The total probability value for Alzheimer's disease presence due to alterations in miRNAs biomarker of the patient.
Thus, importing the adjusted data below to the Winbugs, in the case of ADPathology given that the miRNAs' variable is “True”, the exported probability is 1.
Data List
(Age_Inheritance =2, MetalIons=2, APP=2, Cytokines=2, DailyActivities=2, p53=2,
p.Age_Inheritance = c(0.99,0.01),
p.Ab= structure(.Data = c(0.50,0.50,0.50,0.50,0.50,0.50,0.50,0.50), .Dim = c(2,2,2)),
p.Tau_Phospho =structure(.Data = c(1,0,1,0), .Dim = c(2,2)),
p.MetalIons = c(0.76, 0.24),
p.LewyBodies=structure(.Data = c(0.884,0.116,0.884,0.116), .Dim = c(2,2)),
p.Hypertension=structure(.Data = c(1,0,1,0), .Dim = c(2,2)),
p.Depression=structure(.Data = c(1,0,1,0), .Dim = c(2,2)),
p.Smoking=structure(.Data = c(1,0,1,0), .Dim = c(2,2)),
p.Diabetes=structure(.Data = c(1,0,1,0), .Dim = c(2,2)),
p.Obesity=structure(.Data = c(1,0,1,0), .Dim = c(2,2)),
p.PhysicalActivity=structure(.Data = c(1,0,1,0), .Dim = c(2,2)),
p.APP = c(0.90,0.10),
p.GTP = structure(.Data = c(1,0,1,0), .Dim = c(2,2)),
p.APOE4 = structure(.Data = c(1,0,1,0), .Dim = c(2,2)),
p.PS1_2 = structure(.Data = c(1,0,1,0), .Dim = c(2,2)),
p.Cytokines = c(1,0),
p.SenilePlaques = structure(.Data = c(1,0,1,0,1,0,1,0), .Dim = c(2,2,2)),
p.Unbalance_Ca = structure(.Data = c(1,0,1,0,1,0,1,0), .Dim = c(2,2,2)),
p.Vascular = structure(.Data = c(0,1,0,1,0,1,0,1), .Dim = c(2,2,2)),
p.LogopenicAphasiaCortexAtrophy =structure(.Data = c(1,0,1,0), .Dim = c(2,2)),
p.MemoryHippocampalLoss = structure(.Data = c(1,0,1,0), .Dim = c(2,2)),
p.ExecLangPrax=structure(.Data = c(1,0,1,0), .Dim = c(2,2)),
p.VisualNeuropsychiatric =structure(.Data = c(1,0,1,0), .Dim = c(2,2)),
p.DailyActivities = c(0,1),
p.OxidStress1=structure(.Data = c(1,0,1,0,1,0,1,0), .Dim = c(2,2,2)),
p.OxidStress2=structure(.Data = c(1,0,1,0,1,0,1,0), .Dim = c(2,2,2)),
p.Inflamation1=structure(.Data = c(1,0,1,0,1,0,1,0), .Dim = c(2,2,2)),
p.Inflamation2=structure(.Data = c(1,0,1,0,1,0,1,0), .Dim = c(2,2,2)),
p.Isoprostanes1=structure(.Data = c(1,0,1,0,1,0,1,0), .Dim = c(2,2,2)),
p.Isoprostanes2=structure(.Data = c(1,0,1,0,1,0,1,0), .Dim = c(2,2,2)),
p.Mito1=structure(.Data = c(1,0,1,0,1,0,1,0), .Dim = c(2,2,2)),
p.Mito2=structure(.Data = c(1,0,1,0,1,0,1,0), .Dim = c(2,2,2)),
p.Mito3=structure(.Data = c(1,0,1,0), .Dim = c(2,2)),
p.MFN1 = structure(.Data = c(1,0,1,0), .Dim = c(2,2)),
p.OPA1= structure(.Data = c(1,0,1,0), .Dim = c(2,2)),
p.DVLP= structure(.Data = c(1,0,1,0), .Dim = c(2,2)),
p.FIS1= structure(.Data = c(1,0,1,0), .Dim = c(2,2)),
p.p53 = c(0.75,0.25),
p.Ab_APP= structure(.Data = c(1,0,1,0), .Dim = c(2,2)),
p.miRNAs=structure(.Data=c(0,1,0,1), .Dim = c(2,2)),
p.MCI_due_to_DayLiving=structure(.Data=c(1,0,1,0), .Dim = c(2,2)))
After 10000 iterations, the mean value of ADPathology is calculated as:
Example 3
In the third example, without the age being a risk factor (<60) the most common case is presented, where both Amyloid-beta and Tau proteins' abnormalities occur, with additional ‘True’ values in the Age_Inheritance, APP, APOE4 and Vascular variables of the probabilistic model (Figure 5).
Data List
(Age_Inheritance =2, MetalIons=2, APP=2, Cytokines=2, DailyActivities=2, p53=2,
p.Age_Inheritance = c(0.57,0.43),
p.Ab= structure(.Data = c(0,1,0,1,0,1,0,1), .Dim = c(2,2,2)),
p.Tau_Phospho =structure(.Data = c(0,1,0,1), .Dim = c(2,2)),
p.MetalIons = c(0.76, 0.24),
p.LewyBodies=structure(.Data = c(0.884,0.116,0.884,0.116), .Dim = c(2,2)),
p.Hypertension=structure(.Data = c(1,0,1,0), .Dim = c(2,2)),
p.Depression=structure(.Data = c(1,0,1,0), .Dim = c(2,2)),
p.Smoking=structure(.Data = c(1,0,1,0), .Dim = c(2,2)),
p.Diabetes=structure(.Data = c(1,0,1,0), .Dim = c(2,2)),
p.Obesity=structure(.Data = c(1,0,1,0), .Dim = c(2,2)),
p.PhysicalActivity=structure(.Data = c(1,0,1,0), .Dim = c(2,2)),
p.APP = c(0.50,0.50),
p.GTP = structure(.Data = c(1,0,1,0), .Dim = c(2,2)),
p.APOE4 = structure(.Data = c(0.30,0.70,0.30,0.70), .Dim = c(2,2)),
p.PS1_2 = structure(.Data = c(1,0,1,0), .Dim = c(2,2)),
p.Cytokines = c(1,0),
p.SenilePlaques = structure(.Data = c(1,0,1,0,1,0,1,0), .Dim = c(2,2,2)),
p.Unbalance_Ca = structure(.Data = c(1,0,1,0,1,0,1,0), .Dim = c(2,2,2)),
p.Vascular = structure(.Data = c(0,1,0,1,0,1,0,1), .Dim = c(2,2,2)),
p.LogopenicAphasiaCortexAtrophy =structure(.Data = c(1,0,1,0), .Dim = c(2,2)),
p.MemoryHippocampalLoss = structure(.Data = c(1,0,1,0), .Dim = c(2,2)),
p.ExecLangPrax=structure(.Data = c(1,0,1,0), .Dim = c(2,2)),
p.VisualNeuropsychiatric =structure(.Data = c(1,0,1,0), .Dim = c(2,2)),
p.DailyActivities = c(0,1),
p.OxidStress1=structure(.Data = c(1,0,1,0,1,0,1,0), .Dim = c(2,2,2)),
p.OxidStress2=structure(.Data = c(1,0,1,0,1,0,1,0), .Dim = c(2,2,2)),
p.Inflamation1=structure(.Data = c(1,0,1,0,1,0,1,0), .Dim = c(2,2,2)),
p.Inflamation2=structure(.Data = c(1,0,1,0,1,0,1,0), .Dim = c(2,2,2)),
p.Isoprostanes1=structure(.Data = c(1,0,1,0,1,0,1,0), .Dim = c(2,2,2)),
p.Isoprostanes2=structure(.Data = c(1,0,1,0,1,0,1,0), .Dim = c(2,2,2)),
p.Mito1=structure(.Data = c(1,0,1,0,1,0,1,0), .Dim = c(2,2,2)),
p.Mito2=structure(.Data = c(1,0,1,0,1,0,1,0), .Dim = c(2,2,2)),
p.Mito3=structure(.Data = c(1,0,1,0), .Dim = c(2,2)),
p.MFN1 = structure(.Data = c(1,0,1,0), .Dim = c(2,2)),
p.OPA1= structure(.Data = c(1,0,1,0), .Dim = c(2,2)),
p.DVLP= structure(.Data = c(1,0,1,0), .Dim = c(2,2)),
p.FIS1= structure(.Data = c(1,0,1,0), .Dim = c(2,2)),
p.p53 = c(0.75,0.25),
p.Ab_APP= structure(.Data = c(0,1,0,1), .Dim = c(2,2)),
p.miRNAs=structure(.Data=c(0,1,0,1), .Dim = c(2,2)),
p.MCI_due_to_DayLiving=structure(.Data=c(1,0,1,0), .Dim = c(2,2)))
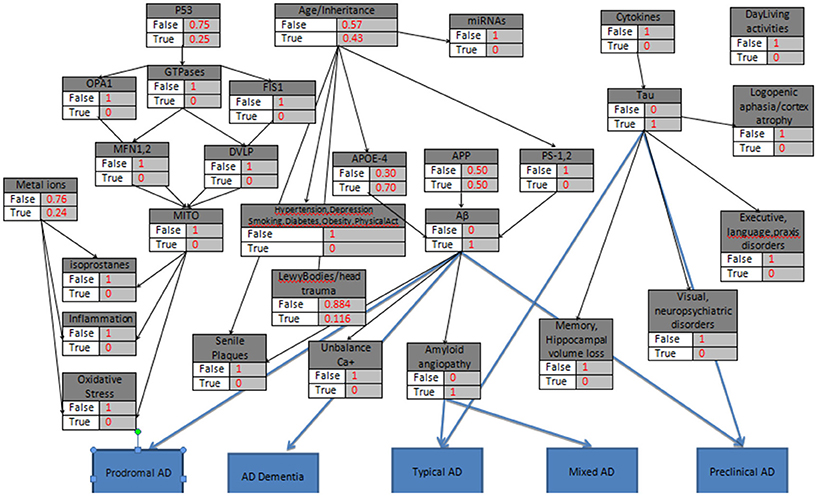
Figure 5. The probabilistic model referring to several categories of Alzheimer's disease simultaneously, with the knots initializations. APP is set to 50%, Age <60, the “parent” knots and the LewyBodies are set to their probabilistic values, and the biomarkers Tau, Aβ, APOE4, Amyloid Angiopathy have a “strong” probability equal to 1.
Given the initial data set above, after 10000 iterations the estimated probabilities of the eight AD categories (Tables 7, 8) reveals high risk for AD presence. The results highlight the role of Amyloid-beta and Tau proteins and emphasize their importance and effectiveness in AD aggravation.
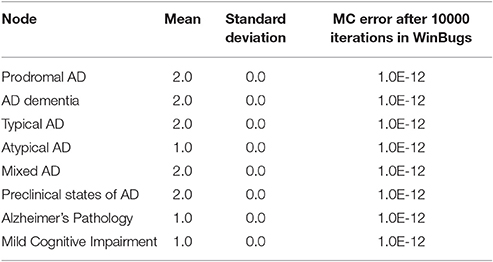
Table 7. WINBUGS statistics for Alzheimer's disease categories according to Example 3.
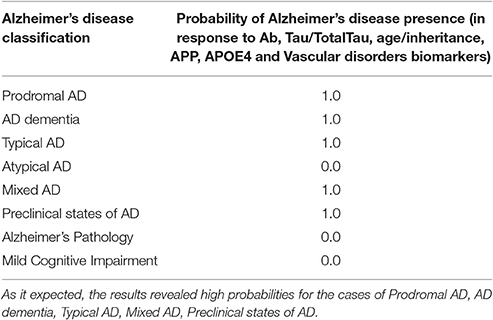
Table 8. The total probability value for Alzheimer's disease presence due to alterations in Ab, Tau/TotalTau, age/inheritance, APP, APOE4 and Vascular disorders of the patient.
Example 4
In the fourth example, the hypothetical patient (age<60) is a Smoker with an Obesity problem and Depression symptoms (Figure 6). The Bayesian model calculates the probabilities respectively,
Data List
(Age_Inheritance =2, MetalIons=2, APP=2, Cytokines=2, DailyActivities=2, p53=2,
p.Age_Inheritance = c(0.57,0.43),
p.Ab= structure(.Data = c(1,0,1,0,1,0,1,0), .Dim = c(2,2,2)),
p.Tau_Phospho =structure(.Data = c(1,0,1,0), .Dim = c(2,2)),
p.MetalIons = c(0.76, 0.24),
p.LewyBodies=structure(.Data = c(0.884,0.116,0.884,0.116), .Dim = c(2,2)),
p.Hypertension=structure(.Data = c(1,0,1,0), .Dim = c(2,2)),
p.Depression=structure(.Data = c(0.868,0.132,0.868,0.132), .Dim = c(2,2)),
p.Smoking=structure(.Data = c(0.726,0.274,0.726,0.274), .Dim = c(2,2)),
p.Diabetes=structure(.Data = c(1,0,1,0), .Dim = c(2,2)),
p.Obesity=structure(.Data = c(0.966,0.034,0.966,0.034), .Dim = c(2,2)),
p.PhysicalActivity=structure(.Data = c(1,0,1,0), .Dim = c(2,2)),
p.APP = c(0.50,0.50),
p.GTP = structure(.Data = c(1,0,1,0), .Dim = c(2,2)),
p.APOE4 = structure(.Data = c(1,0,1,0), .Dim = c(2,2)),
p.PS1_2 = structure(.Data = c(1,0,1,0), .Dim = c(2,2)),
p.Cytokines = c(1,0),
p.SenilePlaques = structure(.Data = c(1,0,1,0,1,0,1,0), .Dim = c(2,2,2)),
p.Unbalance_Ca = structure(.Data = c(1,0,1,0,1,0,1,0), .Dim = c(2,2,2)),
p.Vascular = structure(.Data = c(0,1,0,1,0,1,0,1), .Dim = c(2,2,2)),
p.LogopenicAphasiaCortexAtrophy =structure(.Data = c(1,0,1,0), .Dim = c(2,2)),
p.MemoryHippocampalLoss = structure(.Data = c(1,0,1,0), .Dim = c(2,2)),
p.ExecLangPrax=structure(.Data = c(1,0,1,0), .Dim = c(2,2)),
p.VisualNeuropsychiatric =structure(.Data = c(1,0,1,0), .Dim = c(2,2)),
p.DailyActivities = c(1,0),
p.OxidStress1=structure(.Data = c(1,0,1,0,1,0,1,0), .Dim = c(2,2,2)),
p.OxidStress2=structure(.Data = c(1,0,1,0,1,0,1,0), .Dim = c(2,2,2)),
p.Inflamation1=structure(.Data = c(1,0,1,0,1,0,1,0), .Dim = c(2,2,2)),
p.Inflamation2=structure(.Data = c(1,0,1,0,1,0,1,0), .Dim = c(2,2,2)),
p.Isoprostanes1=structure(.Data = c(1,0,1,0,1,0,1,0), .Dim = c(2,2,2)),
p.Isoprostanes2=structure(.Data = c(1,0,1,0,1,0,1,0), .Dim = c(2,2,2)),
p.Mito1=structure(.Data = c(1,0,1,0,1,0,1,0), .Dim = c(2,2,2)),
p.Mito2=structure(.Data = c(1,0,1,0,1,0,1,0), .Dim = c(2,2,2)),
p.Mito3=structure(.Data = c(1,0,1,0), .Dim = c(2,2)),
p.MFN1 = structure(.Data = c(1,0,1,0), .Dim = c(2,2)),
p.OPA1= structure(.Data = c(1,0,1,0), .Dim = c(2,2)),
p.DVLP= structure(.Data = c(1,0,1,0), .Dim = c(2,2)),
p.FIS1= structure(.Data = c(1,0,1,0), .Dim = c(2,2)),
p.p53 = c(0.75,0.25),
p.Ab_APP= structure(.Data = c(1,0,1,0), .Dim = c(2,2)),
p.miRNAs=structure(.Data=c(0,1,0,1), .Dim = c(2,2)),
p.MCI_due_to_DayLiving=structure(.Data=c(1,0,1,0), .Dim = c(2,2)))
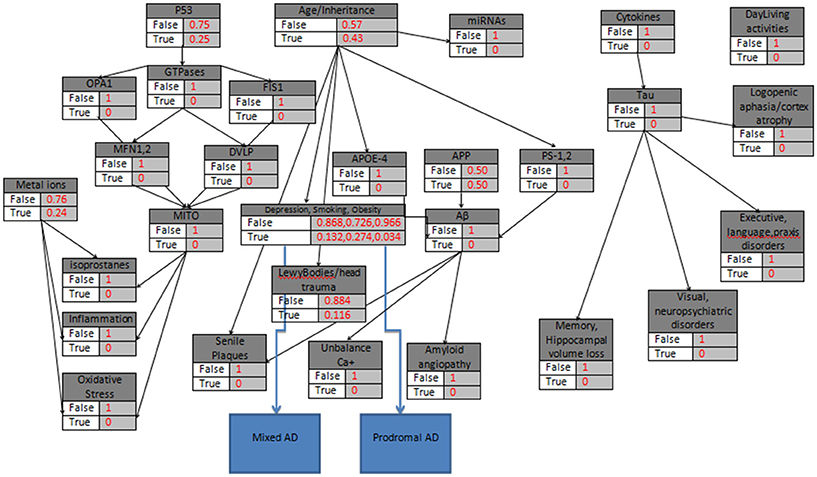
Figure 6. The probabilistic model that can be used for Prodromal AD and Mixed AD validation due to Depression, Obesity and Smoking, with the knots initializations. APP is set to 50%, Age<60, the “parent” knots, the LewyBodies and the Depression, Obesity and Smoking Biomarkers are set to their probabilistic values.
Given the initial dataset above, after 10000 iterations the estimated probabilities of the eight AD categories (Tables 9, 10) reveals a medium risk for AD presence due Depression, Smoking and Obesity and a set of risk factors for related comorbidities. The results in general, highlight the role of Hypertension, Depression, Smoking, Diabetes, Obesity, and Physical Inactivity as potential AD biomarkers and emphasize their importance and effectiveness in AD aggravation. The calculated probabilities verify the latest clinical findings (Modrego and Ferrández, 2004; Barnes and Yaffe, 2011) where the combination of Mild Cognitive Impairment and Depression in patients, doubles the risk of Alzheimer Dementia development compared with those without depression.
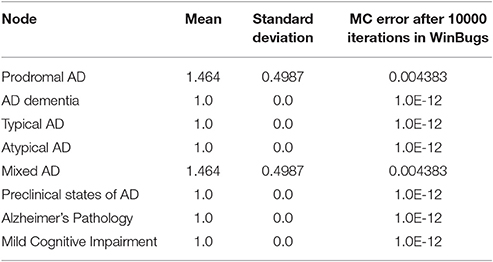
Table 9. WINBUGS statistics for Alzheimer's disease categories according to Example 4.
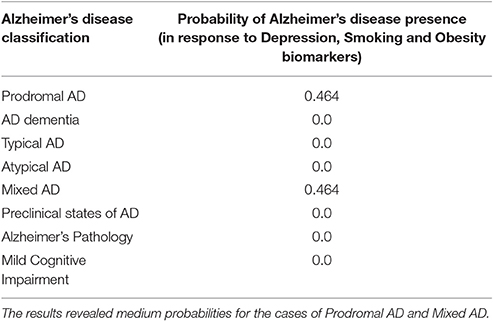
Table 10. The total probability value for Alzheimer's disease presence due to Obesity and Depression problems in a smoker patient.
Discussion
While AD is a hardly curable disease, few computational diagnostic tools have been published during the last years, for the evaluation of biomarkers and symptoms and the automated prediction of the disease. There are algorithms for an automated Dementia identification based on MRI, PET and SPECT imaging analysis using Bayes classifiers, support vector machines, and artificial neural networks (Zheng et al., 2016). According to these specific methods, the systems have to be trained with as many cases as possible to improve accuracy in a clinical dataset. There is also a tool for the automatic diagnosis of AD via the combination of PET Images and Neuropsychological Test Data (Segovia et al., 2014). According to its documentation, authors using a multi-kernel classification approach trained a mixed data set to improve the accuracy of their diagnosis in compare with other methods that evaluate imaging results exclusively. It is important to mention another latest clinical decision support system for AD that combines a Rule-Based System with a Clinical Guideline-Based System, and it is modeled through a Bayesian Network (Seixas et al., 2014). This is another case of a decision trained system that accesses a specific dataset of biomarkers to provide an accurate diagnosis of Dementia, Alzheimer's and MCI.
In the current method, all the known AD biomarkers are combined in a complex Bayesian Network to establish a medical diagnostic decision system for AD, not as a generic diagnostic result but mainly as a more sophisticated probabilistic outcome referred to all the eight categories of AD classification. The proposed statistical model is multi-parametric, targeting the convergence of several independent data like plasma and CSF tests with behavioral or imaging tests and their representation through prior categorical distributions. The proposed AD Bayesian model uses the WinBUGS 1.4.3 software, and all the experiments have been executed in a personal computer with medium performance. While the WinBUGS program cannot be used as an online software, a friendly website (http://alzheimers.edu.gr) has also been designed for individual users and medical staff, for the submission and analysis of anonymous AD tests results. External users can upload biomarkers' results in the form of “True” or “False” and receive the personalized exported statistics in their email account. Medical staff can use the prognostic tool even for individual cases, having in mind that in the Bayesian Inference thousands of sample iterations are automatically executed to pre-define the unknown prior distribution of the model and calculate the posterior distribution of the heterogeneous data with high accuracy. Since the proposed probabilistic model is based on conditional probabilities, it must be noted that the calculated error is only the Monte Carlo Error that measures the variability of each estimation due to simulation, increasing the accuracy of the model almost to the 100%. Besides the categorical values, the medical staff is prompted to upload in the webpage, the analytic test results, any medications or other special conditions that refer to the under consideration patient, anonymously or even more to ask for an upgrade of the model, if new dynamic relations occur between the biomarkers, or new biomarkers being identified. The authors of this computational method are in the process of designing, organizing and implement an open biological database for the data sharing of biomarkers assessment (Frasier, 2016), the dissemination of accurate clinical practices and the validation of the current method. In this way, we could replace in the future the categorical values of the current model with real datasets from observational studies improving the cooperation between scientists, targeting a holistic solution against AD. Including a large set of multilevel biomarkers, the proposed diagnostic method has not been validated yet. Therefore we will ask and embed in our system every time, the final diagnosis of the clinicians as a feedback for the evaluation and improvement of our model.
We strongly believe and work in this direction, that an international open biological database for hosting AD clinical results, could benefit the research against the disease helping scientists to re-evaluate their diagnostic models and treatments or even more consider alternative solutions.
Apparently, the proposed Bayesian approach can be extended to several other related neurodegenerative disorders where the early recognition of symptoms is a crucial factor for an efficient treatment procedure and in similar cases of unknown etiology such as the hypothesis of Developmental Origins of Health and Disease and the research on epigenetic mechanisms in epidemiological studies (Barker and Osmond, 1986; Barker et al., 1989, 1993).
Author Contributions
AA study concept and design, analysis and interpretation of data, study supervision, preparation of the final manuscript, critical revision of manuscript for intellectual content. VM study concept and design, acquisition of data, analysis and interpretation of data, writing of the first draft. NG critical revision of manuscript for intellectual content. MK critical revision of manuscript for intellectual content.
Funding
This study is based on work that has been supported by the AFnP Engineering, Chemicals and Consumables GmbH. AA received grant from AFnP Engineering, Chemicals and Consumables GmbH; VM has nothing to disclose; NG has nothing to disclose; MK has nothing to disclose.
Conflict of Interest Statement
The authors declare that the research was conducted in the absence of any commercial or financial relationships that could be construed as a potential conflict of interest.
References
Alzheimer's Association (2015). Alzheimer's disease facts and figures. J. Alzheimer's Asso. 11, 332–384. doi: 10.1016/j.jalz.2015.02.003
Abbott, A., and Dolgin, E. (2016). Failed Alzheimer's trial does not kill leading theory of disease. Nature 540, 15–16. doi: 10.1038/nature.2016.21045
Albert, M. S., DeKosky, S. T., Dickson, D., Dubois, B., Feldman, H. H., Fox, N. C., et al. (2010). Mild Cognitive Impairment (MCI) due to Alzheime's Disease Workgroup. Curr. Med. Chem. Immun. Endoc. Metab. Agents 3, 371–383
Albert, M. S., DeKosky, S. T., Dickson, D., Dubois, B., Feldman, H. H., Fox, N. C., et al. (2011). The diagnosis of mild cognitive impairment due to Alzheimer's disease: recommendations from the National Institute on Aging-Alzheimer's Association workgroups on diagnostic guidelines for Alzheimer's disease. Alzheimer Demen. J. Alzheimer Assoc. 7, 270–279. doi: 10.1016/j.jalz.2011.03.008
Ashraf, G. M., Tabrez, S., Jabir, N. R., Firoz, C. K., Ahmad, S., Hassan, I., et al. (2015). An overview on global trends in nanotechnological approaches for Alzheimer Therapy. Curr. Drug Metab. 16, 719–727. doi: 10.2174/138920021608151107125757
Barker, D. J., Gluckman, P. D., Godfrey, K. M., Harding, J. E., Owens, J. A., and Robinson, J. S. (1993). Fetal nutrition and cardiovascular disease in adult life. Lancet 341, 938–941. doi: 10.1016/0140-6736(93)91224-A
Barker, D. J., and Osmond, C. (1986). Infant mortality, childhood nutrition, and ischaemic heart disease in England and Wales. Lancet 1, 1077–1081. doi: 10.1016/S0140-6736(86)91340-1
Barker, D. J., Winter, P. D., Osmond, C., Margetts, B., and Simmonds, S. J. (1989). Weight in infancy and death from ischaemic heart disease. Lancet 2, 577–580. doi: 10.1016/S0140-6736(89)90710-1
Barnes, D. E., and Yaffe, K. (2011). The projected impact of risk factor reduction on Alzheimer's disease prevalence. Lancet. Neurol. 10, 819–828. doi: 10.1016/S1474-4422(11)70072-2
Besson, F. L., La Joie, R., Doeuvre, L., Gaubert, M., Mézenge, F., Egret, S., et al. (2015). Cognitive and brain profiles associated with current neuroimaging biomarkers of preclinical Alzheimer's Disease. J. Neurosci. 35, 10402–10411. doi: 10.1523/JNEUROSCI.0150-15.2015
Cabezas-Opazo, F. A., Vergara-Pulgar, K., Pérez, M. J., Jara, C., Osorio-Fuentealba, C., and Quintanilla, R. A. (2015). Mitochondrial dysfunction contributes to the pathogenesis of Alzheimer's Disease. Oxid. Med. Cell. Longev. 2015:509654. doi: 10.1155/2015/509654
Cauwenberghe, C. V., Broeckhoven, C. V., and Sleegers, K. (2016). The genetic landscape of Alzheimer disease: clinical implications and perspectives. Gen. Med. 18, 421–430. doi: 10.1038/gim.2015.117
Chakrabarty, P., Li, A., Ceballos-Diaz, C., Eddy, J. A., Funk, C. C., Moore, B., Golde, T. E., et al. (2015). IL-10 Alters Immunoproteostasis in APP mice, increasing plaque burden and worsening cognitive behavior. Neuron 85, 519–533. doi: 10.1016/j.neuron.2014.11.020
Cheung, K. H., Shineman, D., Muller, M., Cardenas, C., Mei, L., Yang, J., Foskett, J. K., et al. (2008). Mechanism of Ca2+ Disruption in Alzheimer's Disease by Presenilin Regulation of InsP3 Receptor Channel Gating. Neuron 58, 871–883. doi: 10.1016/j.neuron.2008.04.015
Counts, S. E., He, B., Prout, J. G., Michalski, B., Farotti, L., Fahnestock, M., et al. (2016). Cerebrospinal Fluid proNGF: a putative biomarker for early Alzheimer's disease. Curr. Alzheimer Res. 13, 800–808. doi: 10.2174/1567205013666160129095649
de la Torre, J. C. (2002). Alzheimer disease as a vascular disorder. Nosol. Evid. 33, 1152–1162. doi: 10.1161/01.STR.0000014421.15948.67
Dong, H., Li, J., Huang, L., Chen, X., Li, D., Wang, T., et al. (2015). Serum MicroRNA Profiles Serve as Novel Biomarkers for the Diagnosis of Alzheimer's Disease. Dis. Markers 2015:625659. doi: 10.1155/2015/625659
Dubois, B., Feldman, H. H., Jacova, C., Dekosky, S. T., Barberger-Gateau, P., Cummings, J., et al. (2007). Research criteria for the diagnosis of Alzheimer's disease: revising the NINCDS-ADRDA criteria. Lancet Neurol. 6, 734–746. doi: 10.1016/S1474-4422(07)70178-3
Duce, J. A., Bush, A. I., and Adlard, P. A. (2015). Role of Amyloid-β-metal Interactions in Alzheimer's Disease. Future Neurol. 6, 641–659. doi: 10.2217/fnl.11.43
Eskildsen, S. F., Coupé, P., Fonov, V. S., Pruessner, J. C., and Collins, D. L. (2015). Structural imaging biomarkers of Alzheimer's disease: predicting disease progression. Neurobiol. Aging 36, 23–31. doi: 10.1016/j.neurobiolaging.2014.04.034
Gaël, N., Wallon, D., Charbonnier, C., Quenez, O., Rousseau, S., Richard, A. C., et al. (2016). Screening of dementia genes by whole-exome sequencing in early-onset Alzheimer disease: input and lessons. Eur. J. Human Gen. 24, 710–716. doi: 10.1038/ejhg.2015.173
Geman, S., and Geman, D. (1984). Stochastic relaxation, gibbs distributions, and the bayesian restoration of images. IEEE Trans. Pattern Anal. Mach. Intell. 6, 721–741.
Hastings, W. K. (1970). Monte carlo sampling methods using markov chains and their applications. Biometrika 57, 97–109. doi: 10.1093/biomet/57.1.97
Højsgaard, S. (2012). Graphical independence networks with the gRain package for R. J. Stat. Softw. 46, 1–26. doi: 10.18637/jss.v046.i10
Hooper, C., Meimaridou, E., Tavassoli, M., Melino, G., Lovestone, S., and Killick, R. (2007). p53 is upregulated in Alzheimer's disease and induces tau phosphorylation in HEK293a cells. Neurosci. Lett. 418, 34–37. doi: 10.1016/j.neulet.2007.03.026
Israeli-Korn, S. D., Masarwa, M., Schechtman, E., Abuful, A., Strugatsky, R., Avni, S., et al. (2010). Hypertension increases the probability of Alzheimer's Disease and of Mild Cognitive Impairment in an Arab Community in Northern Israel. Neuroepidemiology 34, 99–105. doi: 10.1159/000264828
Jansen, W. J., Ossenkoppele, R., Knol, D. L., Tijms, B. M., Scheltens, P., Verhey, F. R. J., et al. (2015). Prevalence of cerebral amyloid pathology in persons without dementia. JAMA 313, 1924–1938. doi: 10.1001/jama.2015.4668
Lauritzen, S. L., and Spiegelhalter, D. J. (1988). Local computations with probabilities on graphical structures and their application to expert systems. J. R. Stat. Soc. B. 50, 157–224.
Lunn, D. J., Thomas, A., Best, N., and Spiegelhalter, D. (2000). WinBUGS- a Bayesian modelling framework: concepts, structure, and extensibility. Stat. Comput. 10, 325–337. doi: 10.1023/A:1008929526011
Madeira, C., Lourenco, M. V., Vargas-Lopes, C., Suemoto, C. K., Brandão, C. O., Reis, T., et al. (2015). d-serine levels in Alzheimer's disease: implications for novel biomarker development. Transl. Psychiatry 5:e561. doi: 10.1038/tp.2015.52
Mantzavinosa, V., Alexiou, A., Greig, N. H., and Kamal, M. A. (2017). Biomarkers for Alzheimer's disease diagnosis. Curr. Alzheimer Res. doi: 10.2174/1567205014666170203125942. [Epub ahead of print].
Metropolis, N., Rosenbluth, A. W., Rosenbluth, M. N., Teller, A. H., and Teller, E. (1953). Equations of state calculations by fast computing machines. J. Chem. Phys. 21, 1087–1092.
Michel, G. (2015). Alzheimer's and Parkinson's diseases: the prion concept in relation to assembled Aβ, tau, and α-synuclein. Science 349:1255555. doi: 10.1126/science.1255555
Modrego, P. J., and Ferrández, J. (2004). Depression in Patients With Mild cognitive impairment increases the risk of developing dementia of Alzheimer typea prospective cohort study. Arch. Neurol. 61, 1290–1293. doi: 10.1001/archneur.61.8.1290
Nakanishi, A., Minami, A., Kitagishi, Y., and Ogura, Y. (2015). Matsuda S BRCA1 and p53 tumor suppressor molecules in Alzheimer's Disease. Int. J. Mol. Sci. 16, 2879–2892. doi: 10.3390/ijms16022879
Nazem, A., and Mansoori, G. A. (2011). Nanotechnology for Alzheimer's disease detection and treatment. Insci. J. 1, 169–193. doi: 10.5640/insc.0104169
Ossenkoppele, R., Jansen, W. J., Rabinovici, G. D., Knol, D. L., Wiesje, M., van der Flier, W. M., et al. (2015). Prevalence of Amyloid PET Positivity in Dementia Syndromes A Meta-analysis. JAMA Neurol. 313, 1939–1950. doi: 10.1001/jama.2015.4669
Østergaard, S. D., Mukherjee, S., Sharp, S. J., Proitsi, P., Lotta, L. A., Day, F., et al. (2015). Associations between potentially modifiable risk factors and alzheimer disease: a mendelian randomization study. PLoS Med. 12:e1001841. doi: 10.1371/journal.pmed.1001841
Praticò, D., Clark, C. M., Liun, F., Lee, V. Y., and Trojanowski, J. Q. (2002). Increase of brain oxidative stress in mild cognitive impairment. A possible predictor of Alzheimer Disease. Arch. Neurol. 59, 972–976. doi: 10.1001/archneur.59.6.972
Quiroz, Y. T., Schultz, A. P., Chen, K., Protas, H. D., Brickhouse, M., Fleisher, A. S., et al. (2015). Brain Imaging and blood biomarker abnormalities in children with autosomal dominant Alzheimer Disease: a cross-sectional study. JAMA Neurol. 72, 912–919. doi: 10.1001/jamaneurol.2015.1099
Ringman, J. M., Liang, L. J., Zhou, Y., Vangala, S., Teng, E., Kremen, S., et al. (2015). Early behavioural changes in familial Alzheimer's disease in the Dominantly Inherited Alzheimer Network. Brain 138, 1036–1045. doi: 10.1093/brain/awv004
Risacher, S. L., Kim, S., Nho, K., Foroud, T., Shen, L., Petersen, R. C., et al. (2015). APOE effect on Alzheimer's disease biomarkers in older adults with significant memory concern. Alzheimer's Dement. 11, 1417–1429. doi: 10.1016/j.jalz.2015.03.003
Sastre, M., Ritchie, C. W., and Hajji, N. (2015). Metal Ions in Alzheimer's Disease Brain. JSM Alzheimer's Dis. Related Dementia 2:1014.
Schindler, S. E., and Fagan, A. M. (2015). Autosomal dominant alzheimer disease: a unique resource to study csf biomarker changes in preclinical, A. D. Front. Neurol. 6:124. doi: 10.3389/fneur.2015.00142
Segovia, F., Bastin, C., Salmon, E., Górriz, J. M., Ramírez, J., and Phillips, C. (2014). Combining PET images and neuropsychological test data for automatic diagnosis of Alzheimer's disease. PLoS ONE 9:e88687. doi: 10.1371/journal.pone.0088687
Serrano-Pozo, A., Frosch, M. P., Masliah, E., and Hyman, B. T. (2011). Neuropathological Alterations in Alzheimer Disease. Cold Spring Harb. Perspect. Med. 1:a006189. doi: 10.1101/cshperspect.a006189
Schuff, N., Woerner, N., Boreta, L., Kornfield, T., Shaw, L. M., Trojanowski, J. Q., et al. (2009). MRI of hippocampal volume loss in early Alzheimer's Disease in Relation to ApoE Genotype and Biomarkers. Brain 132, 1067–1077. doi: 10.1093/brain/awp007
Seixas, F. L., Zadrozny, B., Laks, J., Conci, A., and Muchaluat Saade, D. C. (2014). A Bayesian network decision model for supporting the diagnosis of dementia, Alzheimer's disease and mild cognitive impairment. Comput. Biol. Med. 51, 140–158. doi: 10.1016/j.compbiomed.2014.04.010
Shilling, D., Müller, M., Takano, H., Mak, D. D., Abel, T., Coulter, D. A., et al. (2014). Suppression of InsP3 receptor-mediated Ca2+ signaling alleviates mutant presenilin-linked familial Alzheimer's disease pathogenesis. J. Neurosci. 34, 6910–6923. doi: 10.1523/JNEUROSCI.5441-13.2014
Snider, B. J., Fagan, A. M., Roe, C., Shah, A. R., Grant, E. A., Xiong, C., et al. (2009). Cerebrospinal fluid biomarkers and rate of cognitive decline in very mild dementia of the Alzheimer type. Arch. Neurol. 66, 638–645. doi: 10.1001/archneurol.2009.55
Soursou, G., Alexiou, A., Ashraf, G. M., Siyal, A. A., Mushtaq, G., and Kamal, M. A. (2015). Applications of nanotechnology in diagnostics and therapeutics of Alzheimer's and Parkinson's disease. Curr. Drug Metab. 16, 705–712. doi: 10.2174/138920021608151107125049
Stone, J. (2008). What initiates the formation of senile plaques? The origin of Alzheimer-like dementias in capillary haemorrhages. Med. Hypotheses. 71, 347–359. doi: 10.1016/j.mehy.2008.04.007
Sutphen, C. L., Jasielec, M. S., Shah, A. R., Macy, E. M., Xiong, C., Vlassenko, A. G., et al. (2015). Longitudinal cerebrospinal fluid biomarker changes in preclinical alzheimer disease during middle age. JAMA Neurol. 72, 1029–1042. doi: 10.1001/jamaneurol.2015.1285
Thordardottir, S., Ståhlbom, A. K., Ferreira, D., Almkvist, O., Westman, E., Zetterberg, H., et al. (2015). Preclinical cerebrospinal fluid and volumetric magnetic resonance imaging biomarkers in Swedish familial Alzheimer's disease. J. Alzheimer's Dis. 43, 1393–1402. doi: 10.3233/JAD-140339
Wang, X., Su, B., Lee, H.-G., Li, X., Perry, G., Smith, M. A., et al. (2009). Impaired balance of mitochondrial fission and fusion in Alzheimer's disease. J. Neurosci. 29, 9090–9103. doi: 10.1523/JNEUROSCI.1357-09.2009
Yang, Z., Wen, W., Jiang, J., Crawford, J. D., Reppermund, S., Levitan, C., et al. (2016). Structural MRI biomarkers of mild cognitive impairment from young elders to centenarians. Curr. Alzheimer Res. 13, 256–267. doi: 10.2174/1567205013666151218150534
Keywords: Alzheimer's disease, early diagnosis, medical decision systems, Bayesian statistics, Markov Chain Monte Carlo, Metropolis-Hastings Algorithm, Gibbs Sampling, Winbugs
Citation: Alexiou A, Mantzavinos VD, Greig NH and Kamal MA (2017) A Bayesian Model for the Prediction and Early Diagnosis of Alzheimer's Disease. Front. Aging Neurosci. 9:77. doi: 10.3389/fnagi.2017.00077
Received: 11 December 2016; Accepted: 13 March 2017;
Published: 31 March 2017.
Edited by:
Rommy Von Bernhardi, Pontifical Catholic University of Chile, ChileReviewed by:
Magda Tsolaki, Aristotle University of Thessaloniki, GreeceEunjoo Kim, Daegu Gyeongbuk Institute of Science and Technology, South Korea
Filippo Caraci, University of Catania, Italy
Copyright © 2017 Alexiou, Mantzavinos, Greig and Kamal. This is an open-access article distributed under the terms of the Creative Commons Attribution License (CC BY). The use, distribution or reproduction in other forums is permitted, provided the original author(s) or licensor are credited and that the original publication in this journal is cited, in accordance with accepted academic practice. No use, distribution or reproduction is permitted which does not comply with these terms.
*Correspondence: Athanasios Alexiou, YWxleGlvdUBuZ2NlZi5uZXQ=