 Timo Pekkala1
 Anette Hall1*Tiia Ngandu2,3
 Mark van Gils4
 Seppo Helisalmi1Tuomo Hänninen5Nina Kemppainen6,7Yawu Liu1,8
 Jyrki Lötjönen9Teemu Paajanen10
 Juha O. Rinne6,7Hilkka Soininen1,5
 Miia Kivipelto1,3,11,12Alina Solomon1,3
- 1Institute of Clinical Medicine/Neurology, University of Eastern Finland, Kuopio, Finland
- 2Public Health Promotion Unit, Finnish Institute for Health and Welfare, Helsinki, Finland
- 3Division of Clinical Geriatrics, Center for Alzheimer Research, NVS, Karolinska Institutet, Stockholm, Sweden
- 4VTT Technical Research Centre of Finland Ltd., Tampere, Finland
- 5Neurocenter/Neurology, Kuopio University Hospital, Kuopio, Finland
- 6Turku PET Centre, University of Turku, Turku, Finland
- 7Division of Clinical Neurosciences, Turku University Hospital, Turku, Finland
- 8Department of Clinical Radiology, Kuopio University Hospital, Kuopio, Finland
- 9Combinostics, Tampere, Finland
- 10Finnish Institute of Occupational Health, Helsinki, Finland
- 11Institute of Public Health and Clinical Nutrition, University of Eastern Finland, Kuopio, Finland
- 12Ageing Epidemiology Research Unit, School of Public Health, Imperial College London, London, United Kingdom
The importance of early interventions in Alzheimer’s disease (AD) emphasizes the need to accurately and efficiently identify at-risk individuals. Although many dementia prediction models have been developed, there are fewer studies focusing on detection of brain pathology. We developed a model for identification of amyloid-PET positivity using data on demographics, vascular factors, cognition, APOE genotype, and structural MRI, including regional brain volumes, cortical thickness and a visual medial temporal lobe atrophy (MTA) rating. We also analyzed the relative importance of different factors when added to the overall model. The model used baseline data from the Finnish Geriatric Intervention Study to Prevent Cognitive Impairment and Disability (FINGER) exploratory PET sub-study. Participants were at risk for dementia, but without dementia or cognitive impairment. Their mean age was 71 years. Participants underwent a brain 3T MRI and PiB-PET imaging. PiB images were visually determined as positive or negative. Cognition was measured using a modified version of the Neuropsychological Test Battery. Body mass index (BMI) and hypertension were used as cardiovascular risk factors in the model. Demographic factors included age, gender and years of education. The model was built using the Disease State Index (DSI) machine learning algorithm. Of the 48 participants, 20 (42%) were rated as Aβ positive. Compared with the Aβ negative group, the Aβ positive group had a higher proportion of APOE ε4 carriers (53 vs. 14%), lower executive functioning, lower brain volumes, and higher visual MTA rating. AUC [95% CI] for the complete model was 0.78 [0.65–0.91]. MRI was the most effective factor, especially brain volumes and visual MTA rating but not cortical thickness. APOE was nearly as effective as MRI in improving detection of amyloid positivity. The model with the best performance (AUC 0.82 [0.71–0.93]) was achieved by combining APOE and MRI. Our findings suggest that combining demographic data, vascular risk factors, cognitive performance, APOE genotype, and brain MRI measures can help identify Aβ positivity. Detecting amyloid positivity could reduce invasive and costly assessments during the screening process in clinical trials.
Introduction
The importance of dementia prevention and early interventions in Alzheimer’s disease (AD) (Winblad et al., 2016) has emphasized the increasing need for accurate identification of at-risk individuals who may benefit most from such interventions. Although many dementia prediction models have been developed (Hou et al., 2019), there are considerably fewer studies focusing on detection of brain pathology. Given the central role attributed to beta-amyloid (Aβ) pathology in AD (Dubois et al., 2007), early identification of individuals with Aβ pathology has become particularly important.
The prevalence of Aβ pathology from ages 50 to 80 years has been estimated to range from 10 to 33% in cognitively normal individuals, and from 27 to 60% in individuals with mild cognitive impairment (MCI) (Jansen et al., 2015). This complicates the screening process in e.g., randomized controlled trials testing interventions that target Aβ, since assessment of Aβ pathology in cerebrospinal fluid (CSF) or on positron emission tomography (PET) scans can easily become inefficient due to invasiveness, costs, and/or PET availability. Developing models for detecting Aβ pathology based on less invasive, less costly, and more easily available factors could help identify a target population with high prevalence of Aβ pathology. More selective use of CSF or PET assessments to confirm the presence of Aβ pathology could thus reduce costly screening failures and improve screening efficiency.
Previous models for Aβ pathology, were most commonly developed in mixed populations including individuals with AD dementia and/or MCI (e.g., Bahar-Fuchs et al., 2013; Tosun et al., 2013, 2014; Burnham et al., 2014; Apostolova et al., 2015; Haghighi et al., 2015; Lee et al., 2018; Westwood et al., 2018; Palmqvist et al., 2019; Ansart et al., 2020), with area under the receiver operating characteristic curve (AUC) values up to 0.87–0.88. Very few studies have focused specifically on cognitively normal populations, despite the key importance of this group who could potentially benefit from interventions that are started early, before the onset of cognitive impairment. Lower performance has been reported for models developed in cognitively normal individuals, with AUC values up to 0.74–0.77 (Mielke et al., 2012; Insel et al., 2016; ten Kate et al., 2018; Ansart et al., 2020). Models for detecting Aβ pathology have most often been developed based on demographic data, cognitive performance, and apolipoprotein E (APOE) genotype. Of the studies in cognitively normal individuals, two have also included structural magnetic resonance imaging (MRI) (ten Kate et al., 2018; Ansart et al., 2020).
In this study, we first aim to develop a model for detecting Aβ pathology in individuals with risk factors for dementia, but without dementia or substantial cognitive impairment. We assess a broad range of factors, including demographic data, cardiovascular factors, cognitive performance, APOE genotype, and brain MRI measures. Both visual rating of medial temporal lobe atrophy (MTA) and quantitative measures of regional brain volumes and cortical thickness are considered. The second aim is to conduct a pragmatic analysis on the added value of the different factors, taking into account how easily obtainable they are in clinical settings, i.e., from less complex to more specialized. The model uses baseline data from the Finnish Geriatric Intervention Study to Prevent Cognitive Impairment and Disability (FINGER) exploratory PET sub-study.
Materials and Methods
Participants
The FINGER main study design and population characteristics have been previously described (Kivipelto et al., 2013; Ngandu et al., 2014). In brief, FINGER (ClinicalTrials.gov identifier NCT01041989) was a 2-year randomized controlled trial testing a multidomain lifestyle intervention versus regular health advice in 1260 older individuals at risk for dementia from the general population. Results showing intervention benefits on the primary and secondary cognitive outcomes, as well as on several other outcomes, have been published (Ngandu et al., 2015).
The exploratory PET sub-study included 48 individuals from the Turku site in FINGER main study and was conducted at the Turku PET Centre. The 48 participants were selected from the most recently recruited individuals when MRI/PET resources became available at the Turku site, and if there were no contraindications. Participants had to be eligible for MRI and PET scans, in addition to meeting all inclusion criteria for the FINGER main study: age 60 to 77 years; Cardiovascular Risk Factors, Aging, and Dementia (CAIDE) score at or above six points indicating elevated risk for dementia; and cognitive performance at the mean level or slightly lower than expected for age according to Finnish population norms for the Consortium to Establish a Registry for Alzheimer’s Disease (CERAD) test as previously described in detail (Kivipelto et al., 2013). Participants had to meet at least one of the following criteria: word list memory task results ≤19 words; word list recall ≤ 75%; or mini mental state examination ≤26 points. Individuals with diagnosed dementia or suspected dementia or substantial cognitive impairment based on screening assessments were excluded from the study. Additionally, participants with MMSE score < 20, a disorder that would affect safe engagement in the intervention, loss of hearing, vision or ability to communicate, a disorder preventing cooperation; or participation in another intervention trial were also excluded.
The FINGER PET population was not significantly different from the rest of the Turku cohort or the rest of the FINGER participants regarding education, vascular risk factors, or APOE e4 carrier status (Kemppainen et al., 2018). FINGER PET participants were slightly older than the rest of the FINGER population at the baseline visit (mean 70.8 vs. 69.3 years), most likely due to a later initiation of recruitment at the Turku study site (Kemppainen et al., 2018).
The FINGER study was approved by the Coordinating Ethics Committee of the Hospital District of Helsinki and Uusimaa. All participants gave written informed consent at the screening and baseline visits, and also for the exploratory neuroimaging sub-study.
Clinical Assessments and APOE Genotyping
The present study used data from the FINGER baseline visit, before the start of the intervention. Cognition was measured using a modified version of the Neuropsychological Test Battery (mNTB) (Harrison et al., 2007). A standardized composite mNTB score was determined based on 14 individual tests measuring three different cognitive domains, i.e., memory, executive function, and processing speed. Domain-specific standardized mNTB scores were also calculated as previously described (Ngandu et al., 2015), with higher scores indicating better performance. Height, weight, and blood pressure were measured (Ngandu et al., 2014), and body mass index (BMI) and hypertension (systolic blood pressure ≥140 mmHg and/or diastolic blood pressure ≥90 mmHg) were used as vascular risk factors in the model. Genomic DNA was extracted from venous blood samples with Chemagic MSM1 (PerkinElmer) using magnetic beads. APOE genotype was determined by polymerase chain reaction using TaqMan genotyping assays (Applied Biosystems) for two single-nucleotide polymorphisms (rs429358 and rs7412) and an allelic discrimination method on the Applied Biosystems 7500 platform (De La Vega et al., 2005).
MRI and PET Imaging
Participants in the FINGER PET sub-study underwent a brain 3T MRI (Philips Ingenuity TF PET/MR, Amsterdam, Netherlands) and 11C-Pittsburgh compound B (PiB)-PET imaging. The MRI and PiB-PET protocols have been previously published (Kemppainen et al., 2018). PiB images were visually determined as positive or negative by two-party consensus agreement. PiB negative individuals had only non-specific 11C-PiB-PET retention in white matter, whereas PiB positive individuals had 11C-PiB-PET retention in at least one AD-specific cortical region.
Regional brain volumes and cortical thickness were measured on MRI scans using FreeSurfer (version 5.3)1. Brain volumes were normalized to total intracranial volume to take into account variations in head size. An AD-signature cortical thickness measure was calculated as the average of cortical thickness in the entorhinal, inferior and middle temporal, and fusiform regions (Jack et al., 2015). Additionally, visual assessment of MTA was conducted by a single rater blinded to clinical data based on a T1-weighted coronal slice. MTA was graded on the Scheltens scale from 0 to 4 (Scheltens et al., 1992).
Statistical Analysis
The population was characterized by calculating group means and standard deviations. Statistical significance of group differences was examined using the Wilcoxon rank sum test for continuous and categorical data.
We used a machine-learning algorithm (Disease State Index, DSI) to detect PiB-PET positivity with clinical, APOE and MRI data as factors. DSI is a supervised machine learning method developed at the VTT Technical Research Centre of Finland (Mattila et al., 2011). Its accuracy is comparable to other methods such as logistic regression, support vector machines, and Bayes inference (Mattila et al., 2011), and it has been successful in modeling MCI progression (Hall et al., 2015) and discriminating between dementia types (Koikkalainen et al., 2016; Tolonen et al., 2018). DSI classifies individuals into Aβ positive and negative based on a population with known Aβ status (training population). An individual’s data are compared with value distributions in the training population with a fitness function.
The fitness function f calculates a value for each measurement value x, where FN is the false negative error and FP is the false positive error for prediction at measurement value x. The analysis puts more weight on factors that show more pronounced dissimilarities between the positive and negative groups in the training population with a relevance value. The relevance is calculated by adding sensitivity and specificity and substracting 1.
This is also known as the Youden index. The grouped index values, such as overall MRI, are calculated by taking a relevance weighted average over fitness of each measurement. Recursively, a new fitness and relevance is defined for groups, from which the total DSI value is defined.
The resulting DSI value for an individual represents a point on the scale 0–1, where higher values denote higher similarity to Aβ positive individuals in the training population. A separate training population was not used in this study, but the data were cross-validated by randomly selecting 80% of the population for training and 20% for testing, and then repeating the procedure 100 times for statistically reliable results (100 × 5-fold cross validation). The classification results are shown as area under the receiver-operator curve (AUC) for the model, with 95% confidence intervals (CI) averaged from the folds.
Advantages of the DSI include the ability to incorporate a large number of factors simultaneously, and permissive requirements for types and distribution characteristics of the data. Missing values are ignored as part of the model, and the total DSI value is calculated from the available data. Over learning is a challenge especially when the sample size is small. DSI defines a classifier for each predictor separately and combines these classifiers making it less sensitive to over learning than methods based on complex decision boundaries. Conceptually related and potentially correlated factors can be structured into groups to assess their combined effect. Individual factors are combined into a group DSI value through a weighted average, and the process is then repeated recursively for all groups to obtain a total DSI value. DSI thus provides detailed information about performance on multiple levels simultaneously: the independent performance of each factor, the combined performance of a group of similar factors, and the overall performance of the entire model.
In this study, factors were organized into groups according to conceptual likeness: Demographic (age, sex, education), Cardiovascular (BMI, hypertension), APOE genotype (ε4 carrier vs. non-carrier), Cognition (mNTB total, memory, processing speed, and executive function), and MRI. Subgroups were defined for MRI measures (Volumes, Visual MTA score, and AD-signature cortical thickness) for a more detailed assessment of performance. Additional analyses were conducted to assess the added value of different factor groups (modalities), taking into account how easily obtainable they are in clinical settings. This was done by assessing performance of the model after step-by-step inclusion or exclusion of different factor groups.
All analyses were performed using MATLAB R2015b. DSI values were calculated using Fingerprint Toolbox version 0.9 on MATLAB.
Results
Population characteristics according to Aβ status on PiB-PET scans are shown in Table 1. Of the 48 participants, 20 (42%) were rated as Aβ positive. Compared with the Aβ negative group, the Aβ positive group had a higher proportion of APOE ε4 carriers (53 vs. 14%), lower executive functioning, lower brain volumes (total cortical and gray matter volumes, cerebellar cortex, thalamus proper, putamen, hippocampus, amygdala, the accumbens area, and ventral diencephalon), and higher visual MTA rating. No significant differences were found in other characteristics (Table 1).
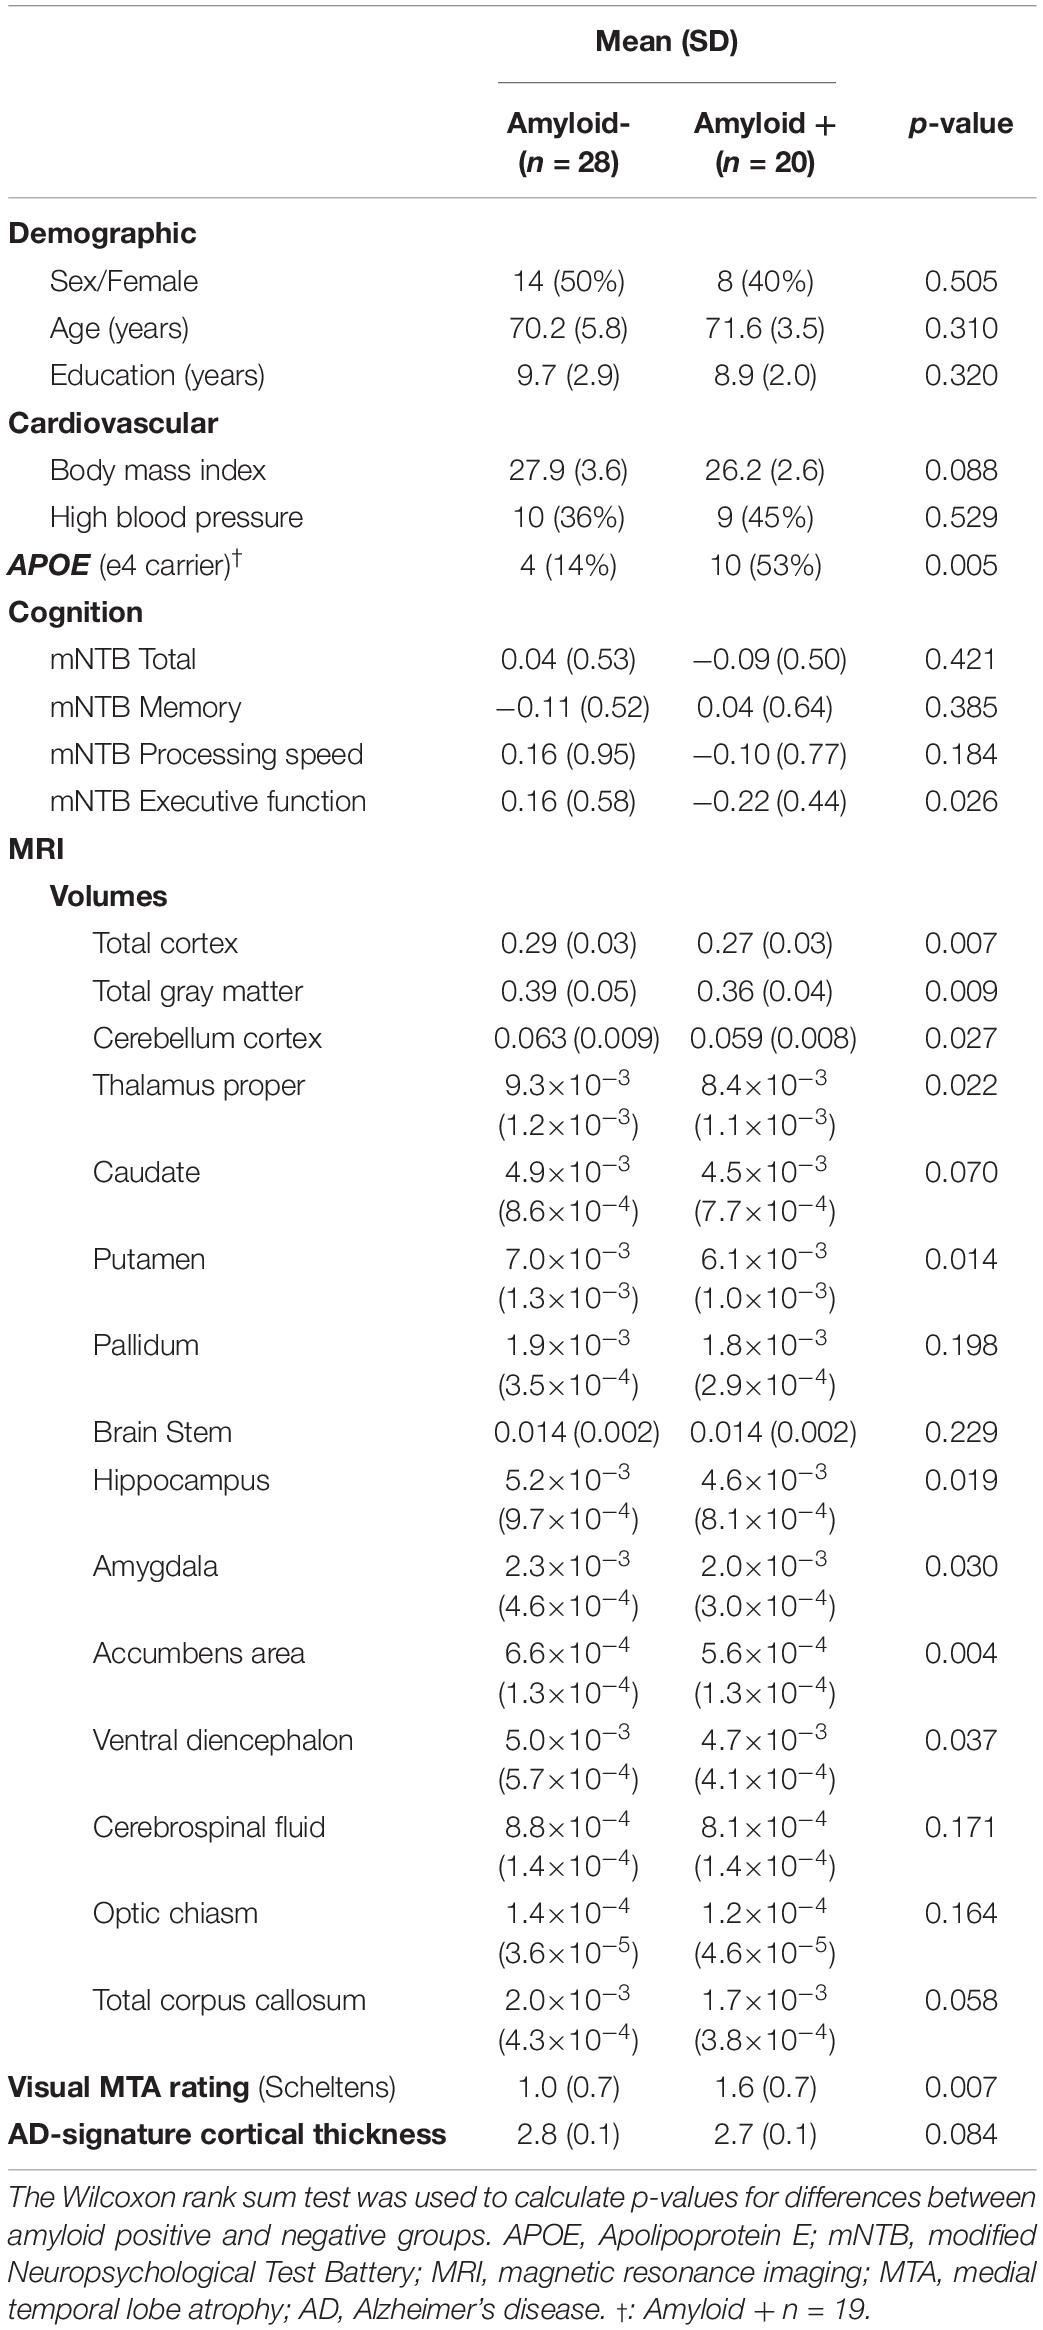
Table 1. Population characteristics according to amyloid status on PiB-PET scans.
The performance of the complete DSI model, factor groups and individual factors is shown in Table 2. The AUC of the complete model after cross-validation was 0.78 (95% CI 0.65–0.91). Model AUC without cross-validation (training and testing with all individuals) was 0.88. Table 3 shows sensitivity, specificity, and positive and negative predictive values for different DSI cutoff values. For example, setting the DSI cutoff value for positive classification at 0.5 would identify a sub-population with a true Aβ positivity prevalence (positive predictive value, PPV) of 65%, with 69% sensitivity, 69% specificity, and 77% negative predictive value (NPV). If only individuals with a DSI value ≥ 0.5 undergo PiB-PET scans, this would lead to an increase in the rate of Aβ positive scans from 42% (observed in FINGER PET study participants) to 65%. Using a higher cutoff for Aβ positivity prediction, such as 0.6, could increase the positive scan rate to 74%, but at a lower sensitivity (39%). Similarly, using a lower cutoff, such as 0.4, the positive scan rate would be 57% and sensitivity 87%.
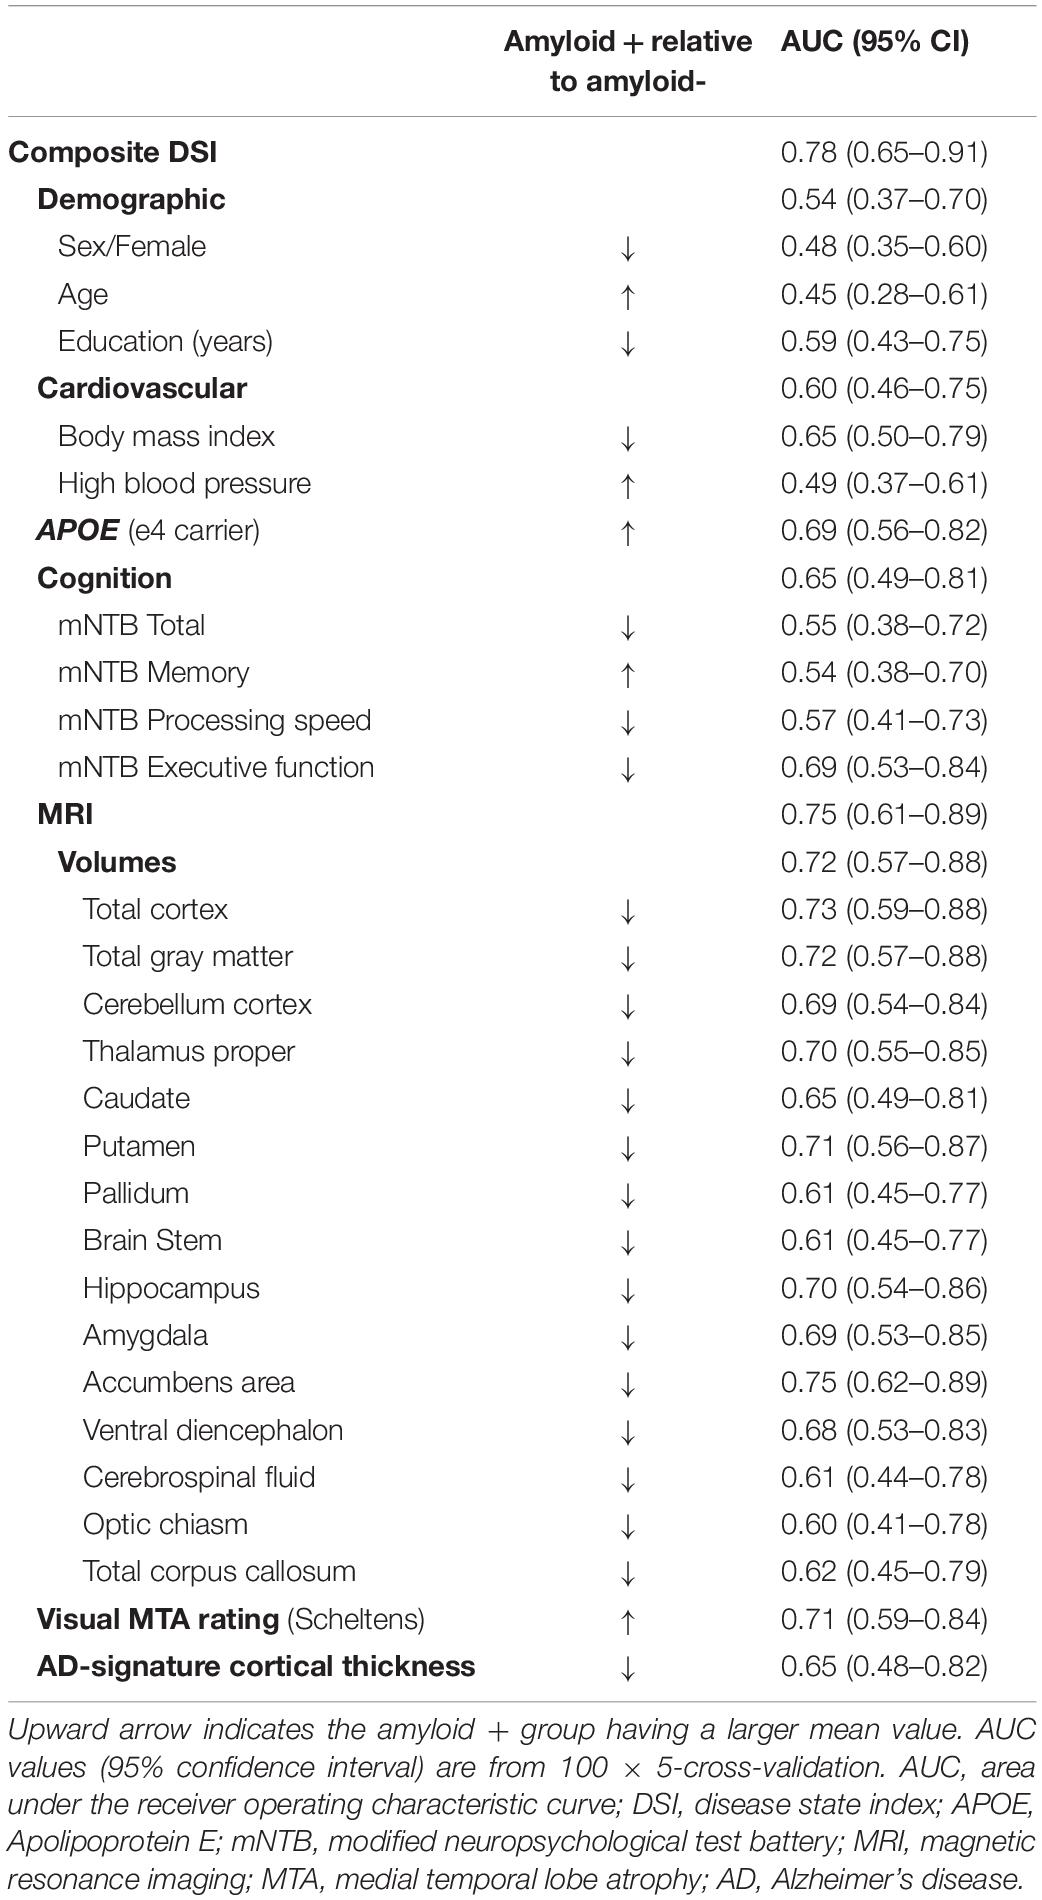
Table 2. Performance for the full model, factor groups and individual factors for detecting amyloid positivity.
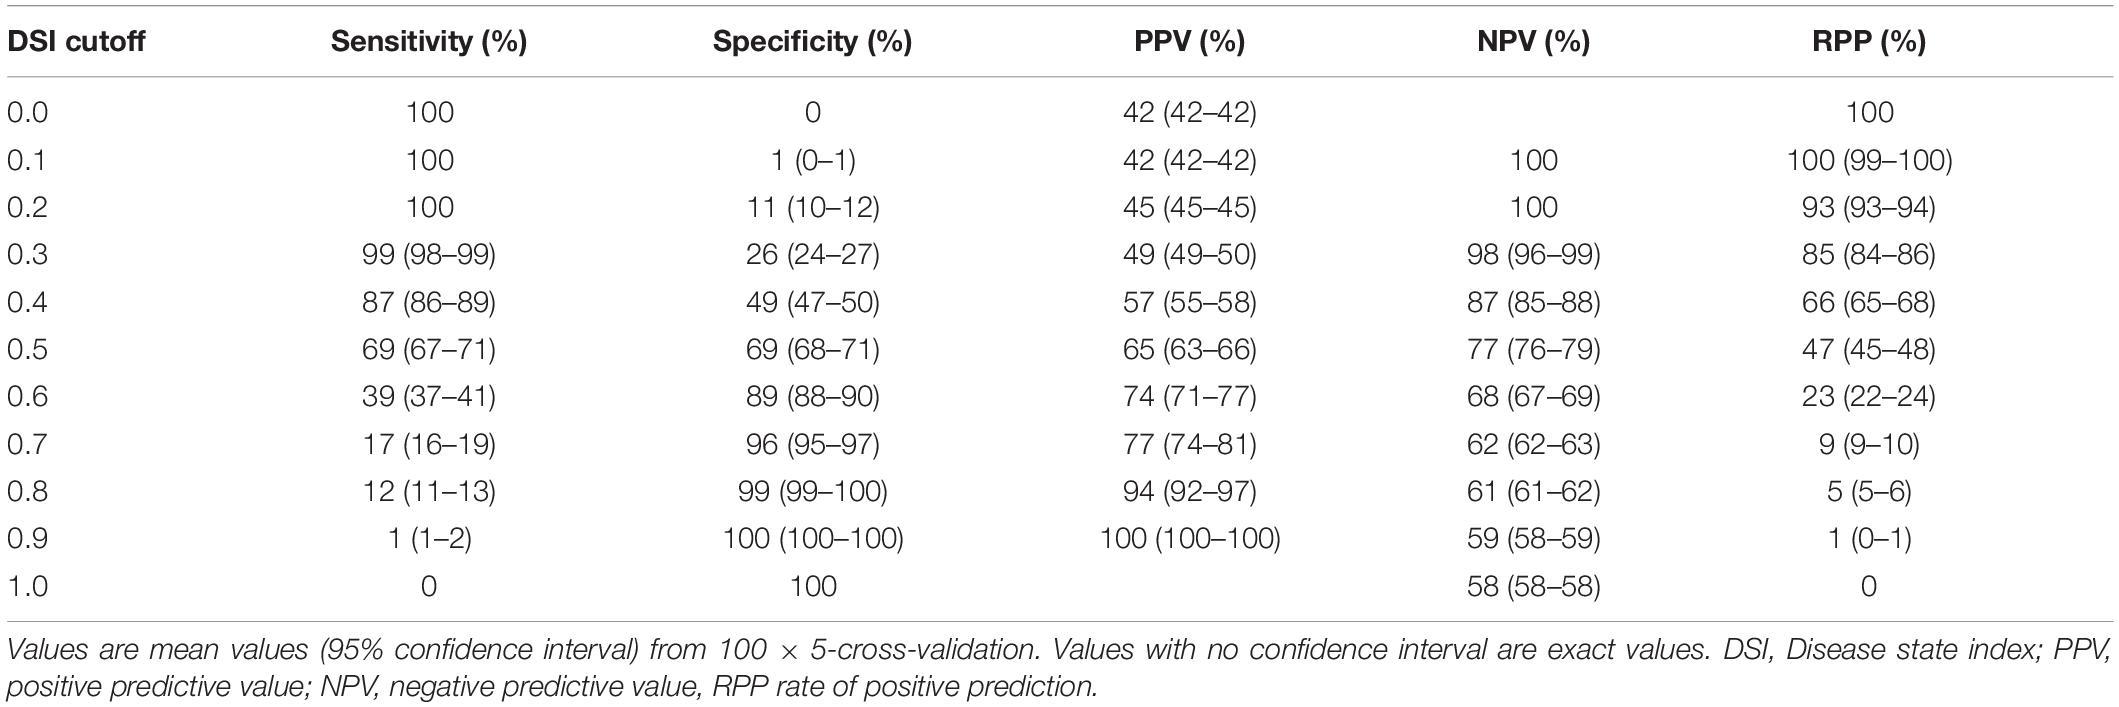
Table 3. Classifier statistics for selected DSI cutoff levels for detecting amyloid positivity.
Among the groups of factors included in the model, structural MRI measures together had the best performance, with an overall AUC (95% CI) of 0.75 (0.61–0.89). Within the MRI group, the most effective subgroups were volumetric measures (AUC 0.72, CI 0.57–0.88) and visual MTA rating (AUC 0.71, CI 0.59–0.84), while AD-signature cortical thickness had lower performance (AUC 0.65, CI 0.48–0.82). APOE ε4 carrier status had an AUC (95% CI) of 0.69 (0.56–0.82). The Cognition group of factors had an AUC (95% CI) of 0.65 (0.49–0.81), and within this group executive functioning had an AUC of 0.69 (0.53–0.84). Other cognitive measures did not have detection power. BMI was the strongest factor (AUC 0.65, CI 0.50–0.79) in the cardiovascular group, although the group level AUC (95% CI) was low at 0.60 (0.46–0.75). Demographic factors had the poorest performance with years of education having the highest within-group AUC of 0.59 (0.43–0.75), and age and sex showing no effect.
Table 4 shows the added value of different groups of factors in terms of model performance. In the first scenario, a base model with only demographic and cardiovascular data (AUC 0.56, CI 0.41–0.72) was augmented by adding a single factor group (Cognition, APOE, Visual MTA rating, or all MRI measurements). The AUC improved to 0.62–0.71, but only addition of APOE or MRI data led to a CI above 0.50 indicating a significant model. All MRI measurements together had the highest added performance (AUC 0.71, 95% CI 0.56–0.85), followed by APOE ε4 carrier status (AUC 0.69, CI 0.56–0.83).
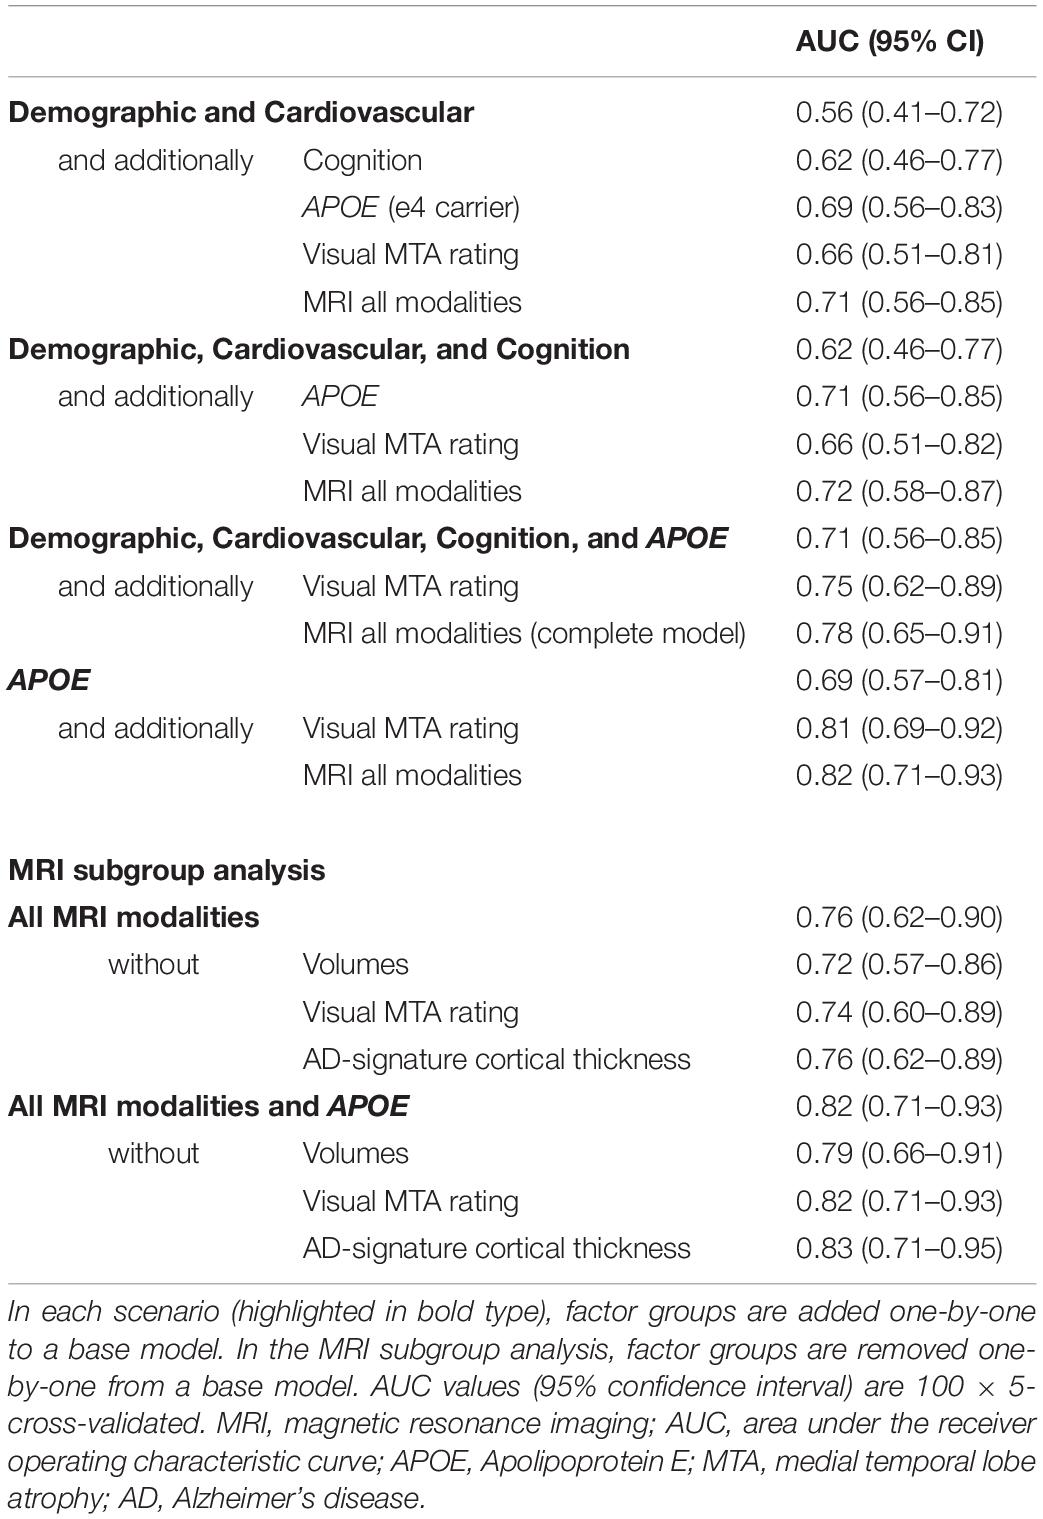
Table 4. Added value of different groups of factors in terms of model performance.
The second scenario used a base model including demographic and cardiovascular factors, and cognition (AUC 0.62, 95% CI 0.46–0.77). Adding APOE or all MRI measures enhanced the model performance to an AUC (95% CI) of 0.71 (0.56–0.85) and 0.72 (0.58–0.87), respectively. Visual MTA rating improved the AUC (95% CI) only to 0.66 (0.51–0.82).
The third scenario tested the added value of the simple visual MTA rating instead of the more comprehensive automated MRI measures. The base model using all factors except MRI led to AUC (95% CI) 0.71 (0.56–0.85). Visual MTA rating increased AUC to 0.75 (0.62–0.89), with the complete model performing at 0.78 (0.65–0.91). We also tested a fourth scenario focusing on the combination of APOE and MRI, the two best performing factor groups. APOE together with either visual MTA rating (AUC 0.81, 95% CI 0.69–0.92) or all MRI measurements (AUC 0.82, 95% CI 0.71–0.93) performed better as a combination than the complete model.
The relative importance of the different subgroups of MRI factors is shown in Table 4. MRI factor subgroups were removed one-by-one from a base model. With a base model including all MRI measures, AUC (95% CI) decreased from 0.76 (0.62–0.90) to 0.72 (0.57–0.86) by removing volumetric measures, and to 0.74 (0.60–0.89) by removing visual MTA rating. Removing AD-signature cortical thickness did not affect the performance of the base model. With a base model including all MRI measures and APOE, removing AD-signature cortical thickness slightly improved the model performance, while removing volumetric measures decreased the AUC.
Discussion
Findings from the exploratory FINGER PET sub-study suggest that a model combining demographic data, vascular risk factors, cognitive performance, APOE genotype, and brain MRI measures can detect Aβ positivity in older at-risk individuals without dementia or substantial cognitive impairment. Given the lower prevalence of Aβ pathology among cognitively normal individuals (Jansen et al., 2015), such a model would facilitate the identification of populations with a considerably higher prevalence, thus reducing the number of invasive, time-consuming and costly assessments during e.g., the screening process in clinical trials. The DSI model allows selecting a suitable threshold depending on the situation. An index threshold of 0.5 gives the best balance with sensitivity and specificity of the model. Using a low cut-off, such as 0.4 would mean very high sensitivity, but a large number of subsequent PET scans. This would mostly remove the cases that are likely to be amyloid negative. Usually, when trying to find participants with amyloid pathology, it might be more useful to choose a higher cut-off, such as 0.6, to ensure that a large number of participants are not needlessly subjected to a PET scan to verify amyloid positivity. This could be useful in a scenario, where we needed to select study participants who were amyloid positive, but did not want to do a PET scan on the whole cohort due to cost issues or minimizing possible harm or inconvenience on the participants. Performance of the complete DSI model including MRI was AUC 0.78, and 0.71 without MRI. Both could be considered “acceptable” as per Hosmer et al. (2013) criteria. Previously reported models in cognitively normal individuals have had AUCs in the range of 0.60–0.74 (Mielke et al., 2012; ten Kate et al., 2018; Ansart et al., 2020), with the highest performance for a support vector machine (SVM) model combining demographics, cognitive performance, APOE genotype and detailed structural MRI measures (ten Kate et al., 2018).
Similar to the abovementioned SVM model (ten Kate et al., 2018), MRI and APOE were the best factors in this study. Brain volumes with the highest performance (AUC ≥ 0.70) were total cortical and gray matter volumes, and hippocampus, accumbens, thalamus and putamen volumes, which have been previously reported to be lower in cognitively normal Aβ positive individuals (ten Kate et al., 2018). Visual MTA rating was almost as effective as brain volumes, although it was not selected in the previous SVM model (ten Kate et al., 2018). The AD-signature cortical thickness had lower performance than brain volumes or visual MTA rating in the FINGER PET population.
Very few studies in cognitively normal participants have investigated the added value of structural MRI in the detection of Aβ pathology. One study reported that best results were obtained without MRI, and that change in cognition over time was a superior substitute to MRI in a multimodal prediction model (Ansart et al., 2020). In another study, MRI measures did have an added value above other factors (ten Kate et al., 2018). Similar findings emphasizing the added value of MRI were observed in the FINGER PET sub-study. In addition, the leave-one-out analysis of the MRI factor group indicated brain volumes as the best factors, while AD-signature cortical thickness did not have any added value. Given that visual MTA rating, which is easier to obtain in clinical settings, performed almost as well as brain volumes, it may represent a useful alternative to the more complex volumetric measures.
Apolipoprotein E ε4 carrier status was very effective in improving the results and adding APOE to basic clinical data was almost as effective as performing an MRI scan. APOE and MRI together, in the absence of any other factors, led to better performance compared with the complete model (AUC 0.81–0.82 vs. 0.78). This is because the model showed that several factors in the demographic, cardiovascular and cognitive groups were not useful in detecting amyloid positivity.
Regarding cognition, executive functioning was most effective, with an individual AUC of about the same magnitude as APOE genotype. Cognition as a group was, however, not as valuable in different combinations of factor modalities as APOE or MRI measures. In contrast, the previous SVM model (ten Kate et al., 2018) emphasized memory among the tested cognitive domains. This may be due to population differences, i.e., FINGER participants underwent cognitive screening to select individuals with performance at the mean level or slightly lower than expected for age, thus limiting the distribution of cognitive test scores in the present study.
Among vascular factors, BMI had some ability to detect amyloid positivity, but not hypertension. Low BMI at younger-old ages has previously been associated with Aβ load (Ewers et al., 2012; Toledo et al., 2012), although these studies also included individuals with MCI and dementia at baseline. However, the performance of vascular factors may have been influenced by the use of the CAIDE dementia risk score (including age, sex, education, BMI, systolic blood pressure, total serum cholesterol and physical activity) (Kivipelto et al., 2006) to select the at-risk FINGER study participants. FINGER eligibility criteria may also explain why age did not associate with Aβ positivity in this population, despite being reported as a clear determinant of Aβ pathology in individuals with normal cognition or MCI, with Aβ pathology prevalence growing rapidly after about the age of 70 years (Jansen et al., 2015).
The main limitations of the present study are the small sample size leading to potential model overfitting effects, and the lack of external validation. However, while the sample size is limited, the ratio of amyloid positive and negative cases is balanced. The same dataset was used for both training and testing the DSI model, although we reported results following nested 100 × 5 cross-validation. Findings need to be interpreted keeping in mind that FINGER participants had already undergone a screening process based on cognitive testing and the CAIDE dementia risk score, i.e., they represent a population at risk for dementia, but without dementia or substantial cognitive impairment. Studies in independent populations will be needed to further validate the results. Testing the model with a larger sample could show more effects for age, cognition and vascular factors. There was no significant association between age and amyloid positivity in our sample, likely due to the original selection process, which only recruited participants aged 60–77, who were at-risk for cognitive impairment. This would exclude healthier young subjects and more cognitively impaired older subjects, which could make the amyloid-age association less prominent.
Compared with previous studies in cognitively normal populations, the present study assessed a broader range of factors, and performance at multiple levels simultaneously, i.e., from the overall model to groups of conceptually related factors and also individual factors. We also investigated different screening strategies, i.e., the benefit of adding more complex factor modalities, by testing the performance of increasingly comprehensive models, from easily obtainable demographic, clinical and cognitive data, to APOE genotyping and structural brain MRI.
Data Availability Statement
The datasets for this article are not publicly available because of privacy issues of sensitive personal data. Requests to access the datasets should be directed to AS,YWxpbmEuc29sb21vbkB1ZWYuZmk=.
Ethics Statement
The studies involving human participants were reviewed and approved by Coordinating Ethics Committee of the Hospital District of Helsinki and Uusimaa. The patients or participants provided their written informed consent to participate in this study.
Author Contributions
TPe, AH, TN, JL, JR, HS, MK, and AS: designing the study. TN, SH, TH, NK, YL, TPa, JR, HS, and MK: acquisition of the data. TPe, AH, TN, MG, JL, NK, JR, and AS: interpretation of the data. TPe: analysis of the data. TPe, AH, and AS: drafting the manuscript. All authors contributed in revising the manuscript, read and approved the final version.
Funding
The study was funded by European Research Council (Grant 804371), Academy of Finland; Finnish Social Insurance Institution, Alzheimer’s Research & Prevention Foundation, Juho Vainio Foundation, Swedish Research Council, Alzheimerfonden, Region Stockholm ALF and NSV, Center for Innovative Medicine (CIMED) at Karolinska Institutet, Knut and Alice Wallenberg Foundation, Stiftelsen Stockholms sjukhem, Konung Gustaf V:s och Drottning Victorias Frimurarstiftelse (Sweden); Joint Program of Neurodegenerative Disorders – prevention (MIND-AD), and VTR grants of Turku University Hospital. JR was funded by the Sigrid Juselius Foundation, Finnish State Research Funding, Academy of Finland (Grant 310962).
Conflict of Interest
JL was shareholder and co-founder of Combinostics Ltd. Combinostics Ltd., owns the following IPR related to the manuscript: (1) A method for inferring the state of a system, US7, 840,510 B2, and PCT/FI2007/050277. (2) State Inference in a heterogeneous system, PCT/FI2010/050545 and FI20125177.
The remaining authors declare that the research was conducted in the absence of any commercial or financial relationships that could be construed as a potential conflict of interest.
Acknowledgments
We thank all participants and members of the FINGER study group for their cooperation in data collection and management.
Footnotes
References
Ansart, M., Epelbaum, S., Gagliardi, G., Colliot, O., Dormont, D., Dubois, B., et al. (2020). Reduction of recruitment costs in preclinical AD trials: validation of automatic pre-screening algorithm for brain amyloidosis. Stat. Methods Med. Res. 29, 151–164. doi: 10.1177/0962280218823036
Apostolova, L. G., Hwang, K. S., Avila, D., Elashoff, D., Kohannim, O., Teng, E., et al. (2015). Brain amyloidosis ascertainment from cognitive, imaging, and peripheral blood protein measures. Neurology 84, 729–737. doi: 10.1212/wnl.0000000000001231
Bahar-Fuchs, A., Villemagne, V., Ong, K., Chetélat, G., Lamb, F., Reininger, C. B., et al. (2013). Prediction of amyloid- β pathology in amnestic mild cognitive impairment with neuropsychological tests. J. Alzheimers Dis. 33, 451–462. doi: 10.3233/jad-2012-121315
Burnham, S. C., Faux, N. G., Wilson, W., Laws, S. M., Ames, D., Bedo, J., et al. (2014). A blood-based predictor for neocortical Aβ burden in Alzheimer’s disease: results from the AIBL study. Mol. Psychiatry 19, 519–526. doi: 10.1038/mp.2013.40
De La Vega, F. M., Lazaruk, K. D., Rhodes, M. D., and Wenz, M. H. (2005). Assessment of two flexible and compatible SNP genotyping platforms: TaqMan SNP Genotyping Assays and the SNPlex genotyping system. Mutat. Res. 573, 111–135. doi: 10.1016/j.mrfmmm.2005.01.008
Dubois, B., Feldman, H. H., Jacova, C., Dekosky, S. T., Barberger-Gateau, P., Cummings, J., et al. (2007). Research criteria for the diagnosis of Alzheimer’s disease: revising the NINCDS-ADRDA criteria. Lancet Neurol. 6, 734–746. doi: 10.1016/s1474-4422(07)70178-3
Ewers, M., Schmitz, S., Hansson, O., Walsh, C., Fitzpatrick, A., Bennett, D., et al. (2012). Body mass index is associated with biological CSF markers of core brain pathology of Alzheimer’s disease. Neurobiol. Aging 33, 1599–1608. doi: 10.1016/j.neurobiolaging.2011.05.005
Haghighi, M., Smith, A., Morgan, D., Small, B., and Huang, S. (2015). Identifying cost-effective predictive rules of amyloid- β level by integrating neuropsychological tests and plasma-based markers. J. Alzheimers Dis. 43, 1261–1270. doi: 10.3233/jad-140705
Hall, A., Muñoz-Ruiz, M., Mattila, J., Koikkalainen, J., Tsolaki, M., Mecocci, P., et al. (2015). Generalizability of the Disease State Index prediction model for identifying patients progressing from mild cognitive impairment to Alzheimer’s disease. J. Alzheimers Dis. 44, 79–92. doi: 10.3233/jad-140942
Harrison, J., Minassian, S. L., Jenkins, L., Black, R. S., Koller, M., and Grundman, M. (2007). A neuropsychological test battery for use in Alzheimer disease clinical trials. Arch. Neurol. 64, 1323–1329.
Hosmer, D. W., Lemeshow, S., and Sturdivant, R. X. (2013). Applied Logistic Regression, 3rd Edn. Hoboken, NJ: John Wiley & Sons.
Hou, X., Feng, L., Zhang, C., Cao, X., Tan, L., and Yu, J. (2019). Models for predicting risk of dementia: a systematic review. J. Neurol. Neurosurg. Psychiatry 90, 373–379. doi: 10.1136/jnnp-2018-318212
Insel, P. S., Palmqvist, S., Mackin, R. S., Nosheny, R. L., Hansson, O., Weiner, M. W., et al. (2016). Assessing risk for preclinical β-amyloid pathology with APOE, cognitive, and demographic information. Alzheimers Dement. 4, 76–84. doi: 10.1016/j.dadm.2016.07.002
Jack, C. R. Jr., Wiste, H. J., Weigand, S. D., Knopman, D. S., Mielke, M. M., Vemuri, P., et al. (2015). Different definitions of neurodegeneration produce similar amyloid/neurodegeneration biomarker group findings. Brain 138, 3747–3759. doi: 10.1093/brain/awv283
Jansen, W. J., Ossenkoppele, R., Knol, D. L., Tijms, B. M., Scheltens, P., Verhey, F. R. J., et al. (2015). Prevalence of cerebral amyloid pathology in persons without dementia: a meta-analysis. JAMA 313, 1924–1938.
Kemppainen, N., Johansson, J., Teuho, J., Parkkola, R., Joutsa, J., Ngandu, T., et al. (2018). Brain amyloid load and its associations with cognition and vascular risk factors in FINGER study. Neurology 90, e206–e213. doi: 10.1212/wnl.0000000000004827
Kivipelto, M., Ngandu, T., Laatikainen, T., Winblad, B., Soininen, H., and Tuomilehto, J. (2006). Risk score for the prediction of dementia risk in 20 years among middle aged people: a longitudinal, population-based study. Lancet. Neurol. 5, 735–741. doi: 10.1016/s1474-4422(06)70537-3
Kivipelto, M., Solomon, A., Ahtiluoto, S., Ngandu, T., Lehtisalo, J., Antikainen, R., et al. (2013). The finnish geriatric intervention study to prevent cognitive impairment and disability (FINGER): study design and progress. Alzheimers Dement. 9, 657–665. doi: 10.1016/j.jalz.2012.09.012
Koikkalainen, J., Rhodius-Meester, H., Tolonen, A., Barkhof, F., Tijms, B., Lemstra, A. W., et al. (2016). Differential diagnosis of neurodegenerative diseases using structural MRI data. Neuroimage Clin. 11, 435–449. doi: 10.1016/j.nicl.2016.02.019
Lee, J. H., Byun, M. S., Yi, D., Sohn, B. K., Jeon, S. Y., Lee, Y., et al. (2018). Prediction of cerebral amyloid with common information obtained from memory clinic practice. Front. Aging Neurosci. 10:309. doi: 10.3389/fnagi.2018.00309
Mattila, J., Koikkalainen, J., Virkki, A., Simonsen, A., van Gils, M., Waldemar, G., et al. (2011). Disease state fingerprint for evaluation of Alzheimer’s disease. J. Alzheimers Dis. 27, 163–176.
Mielke, M. M., Wiste, H. J., Weigand, S. D., Knopman, D. S., Lowe, V. J., Roberts, R. O., et al. (2012). Indicators of amyloid burden in a population-based study of cognitively normal elderly. Neurology 79, 1570–1577. doi: 10.1212/wnl.0b013e31826e2696
Ngandu, T., Lehtisalo, J., Levälahti, E., Laatikainen, T., Lindström, J., Peltonen, M., et al. (2014). Recruitment and baseline characteristics of participants in the finnish geriatric intervention study to prevent cognitive impairment and disability (FINGER)—a randomized controlled lifestyle trial. Int. J. Environ. Res. Public Health 11, 9345–9360. doi: 10.3390/ijerph110909345
Ngandu, T., Lehtisalo, J., Solomon, A., Levälahti, E., Ahtiluoto, S., Antikainen, R., et al. (2015). A 2 year multidomain intervention of diet, exercise, cognitive training, and vascular risk monitoring versus control to prevent cognitive decline in at-risk elderly people (FINGER): a randomised controlled trial. Lancet 385, 2255–2263. doi: 10.1016/s0140-6736(15)60461-5
Palmqvist, S., Insel, P. S., Zetterberg, H., Blennow, K., Brix, B., Stomrud, E., et al. (2019). Accurate risk estimation of β -amyloid positivity to identify prodromal Alzheimer’s disease: cross-validation study of practical algorithms. Alzheimers Dement. 15, 194–204. doi: 10.1016/j.jalz.2018.08.014
Scheltens, P., Leys, D., Barkhof, F., Huglo, D., Weinstein, H. C., Vermersch, P., et al. (1992). Atrophy of medial temporal lobes on MRI in “probable” Alzheimer’s disease and normal ageing: diagnostic value and neuropsychological correlates. J. Neurol. Neurosurg. Psychiatry 55, 967–972. doi: 10.1136/jnnp.55.10.967
ten Kate, M., Redolfi, A., Peira, E., Bos, I., Vos, S. J., Vandenberghe, R., et al. (2018). MRI predictors of amyloid pathology: results from the EMIF-AD multimodal biomarker discovery study. Alzheimers Res. Ther. 10:100.
Toledo, J. B., Toledo, E., Weiner, M. W., Jack, C. R. Jr., Jagust, W., Lee, V. M. Y., et al. (2012). Cardiovascular risk factors, cortisol, and amyloid-β deposition in Alzheimer’s Disease neuroimaging initiative. Alzheimers Dement. 8, 483–489. doi: 10.1016/j.jalz.2011.08.008
Tolonen, A., Rhodius-Meester, H. F. M., Bruun, M., Koikkalainen, J., Barkhof, F., Lemstra, A. W., et al. (2018). Data-driven differential diagnosis of dementia using multiclass disease state index classifier. Front. Aging Neurosci. 10:111. doi: 10.3389/fnagi.2018.00111
Tosun, D., Joshi, S., and Weiner, M. W. (2013). Neuroimaging predictors of brain amyloidosis in mild cognitive impairment. Ann. Neurol. 74, 188–198.
Tosun, D., Joshi, S., and Weiner, M. W. (2014). Multimodal MRI-based imputation of the Aβ + in early mild cognitive impairment. Ann. Clin. Transl. Neurol. 1, 160–170. doi: 10.1002/acn3.40
Westwood, S., Baird, A. L., Hye, A., Ashton, N. J., Nevado-Holgado, A. J., Anand, S. N., et al. (2018). Plasma protein biomarkers for the prediction of CSF amyloid and tau and [18F]-Flutemetamol PET scan result. Front. Aging Neurosci. 10:409. doi: 10.3389/fnagi.2018.00409
Keywords: amyloid beta, positron emission tomography, cognition, magnetic resonance imaging, apolipoprotein E, machine learning, Alzheimer’s disease
Citation: Pekkala T, Hall A, Ngandu T, Gils M, Helisalmi S, Hänninen T, Kemppainen N, Liu Y, Lötjönen J, Paajanen T, Rinne JO, Soininen H, Kivipelto M and Solomon A (2020) Detecting Amyloid Positivity in Elderly With Increased Risk of Cognitive Decline. Front. Aging Neurosci. 12:228. doi: 10.3389/fnagi.2020.00228
Received: 30 March 2020; Accepted: 29 June 2020;
Published: 30 July 2020.
Edited by:
Panteleimon Giannakopoulos, Université de Genève, SwitzerlandReviewed by:
Valentina Garibotto, Geneva University Hospitals (HUG), SwitzerlandGiancarlo Logroscino, University of Bari Aldo Moro, Italy
Copyright © 2020 Pekkala, Hall, Ngandu, Gils, Helisalmi, Hänninen, Kemppainen, Liu, Lötjönen, Paajanen, Rinne, Soininen, Kivipelto and Solomon. This is an open-access article distributed under the terms of the Creative Commons Attribution License (CC BY). The use, distribution or reproduction in other forums is permitted, provided the original author(s) and the copyright owner(s) are credited and that the original publication in this journal is cited, in accordance with accepted academic practice. No use, distribution or reproduction is permitted which does not comply with these terms.
*Correspondence: Anette Hall, YW5ldHRlLmhhbGxAdWVmLmZp