 Zheyu Li1†
 Kaicheng Li2†
 Xiao Luo2
 Qingze Zeng2
 Shuai Zhao1
 Baorong Zhang1
 Minming Zhang2*
 Yanxing Chen1* for the Alzheimer’s Disease Neuroimaging Initiative‡
- 1Department of Neurology, the Second Affiliated Hospital, School of Medicine, Zhejiang University, Hangzhou, China
- 2Department of Radiology, the Second Affiliated Hospital, School of Medicine, Zhejiang University, Hangzhou, China
Background: Suspected non-Alzheimer disease pathophysiology (SNAP) refers to the subjects who feature negative β-amyloid (Aβ) but positive tau or neurodegeneration biomarkers. It accounts for a quarter of the elderly population and is associated with cognitive decline. However, the underlying pathophysiology is still unclear.
Methods: We included 111 non-demented subjects, then classified them into three groups using cerebrospinal fluid (CSF) Aβ 1–42 (A), phosphorylated tau 181 (T), and total tau (N). Specifically, we identified the normal control (NC; subjects with normal biomarkers, A-T-N-), SNAP (subjects with normal amyloid but abnormal tau, A−T+), and predementia Alzheimer’s disease (AD; subjects with abnormal amyloid and tau, A+T+). Then, we used the static amplitude of low-frequency fluctuation (sALFF) and dynamic ALFF (dALFF) variance to reflect the intrinsic functional network strength and stability, respectively. Further, we performed a correlation analysis to explore the possible relationship between intrinsic brain activity changes and cognition.
Results: SNAP showed decreased sALFF in left superior frontal gyrus (SFG) while increased sALFF in left insula as compared to NC. Regarding the dynamic metric, SNAP showed a similarly decreased dALFF in the left SFG and left paracentral lobule as compared to NC. By contrast, when compared to NC, predementia AD showed decreased sALFF in left inferior parietal gyrus (IPG) and right precuneus, while increased sALFF in the left insula, with more widely distributed decreased dALFF variance across the frontal, parietal and occipital lobe. When directly compared to SNAP, predementia AD showed decreased sALFF in left middle occipital gyrus and IPG, while showing decreased dALFF variance in the left temporal pole. Further correlation analysis showed that increased sALFF in the insula had a negative correlation with the general cognition in the SNAP group. Besides, sALFF and dALFF variance in the right precuneus negatively correlated with attention in the predementia AD group.
Conclusion: SNAP and predementia AD show distinct functional impairment patterns. Specifically, SNAP has functional impairments that are confined to the frontal region, which is usually spared in early-stage AD, while predementia AD exhibits widely distributed functional damage involving the frontal, parietal and occipital cortex.
Introduction
Suspected non-Alzheimer disease pathophysiology (SNAP) refers to the subjects with abnormal tau or neurodegeneration but normal amyloid deposition (Jack et al., 2018). Previous studies have usually focused on Alzheimer’s continuum and ignored these subjects due to the lack of Alzheimer’s disease (AD) core biomarker β-amyloid (Aβ). However, recent epidemiological investigations claimed that SNAP accounts for about a quarter in cognitively normal (CN) and mild cognitive impairment (MCI) population (Jack et al., 2012, 2016; Schreiber et al., 2017). Furthermore, longitudinal studies found a greater cognitive decline in SNAP patients than in subjects with normal biomarkers (Caroli et al., 2015; Vos et al., 2015; Chung et al., 2017; Jack et al., 2017; Ben Bouallègue et al., 2018). Thus, understanding the underlying pathophysiology of SNAP is necessary.
Previous studies reported that tau deposition in SNAP is located in the bilateral medial and lateral temporal region (Dodich et al., 2020), as well as hypometabolism in temporoparietal regions (Schreiber et al., 2017; Chiaravalloti et al., 2019). This is somehow in line with the magnetic resonance imaging (MRI) findings, which found more severe baseline hippocampal atrophy in SNAP than normal control (NC; Caroli et al., 2015; Burnham et al., 2016; Gordon et al., 2016; Chung et al., 2017). Though the above study gave us some insight into the foundation of the cognitive decline of SNAP, the functional impairment pattern of SNAP is still unknown.
Amplitude of low-frequency fluctuation (ALFF) is an effective neuroimaging index in reflecting neurodegenerative changes caused by different pathologies. To be specific, the static ALFF (sALFF) reflects the regional intrinsic functional activity strength by calculating the average ALFF signal through the whole resting-state period (Yang et al., 2007). Decreased sALFF associates with impaired brain activity, while increased sALFF is usually regarded as a compensatory mechanism to cognitive impairment in neurodegenerative diseases (Palacios et al., 2013; Liu et al., 2016; Yang et al., 2018). On the other hand, the dynamic ALFF (dALFF) could reflect the temporal variability of intrinsic brain activity (Fu et al., 2018). Abnormalities in dynamic brain activity, including excessive variability (increased dALFF) and excessive stability (decreased dALFF), impair brain function (Christoff et al., 2016). These methods have been widely used in neurodegenerative diseases, like AD (Yang et al., 2018; de Vos et al., 2018; Li et al., 2019; Zeng et al., 2019), Parkinson’s disease (Skidmore et al., 2013; Zhang et al., 2019) have been proven feasible and effective. Thus, combining the sALFF and dALFF may help to illuminate the underlying brain functional changes in SNAP.
In our study, we aim to explore the brain functional changes in SNAP by combining the sALFF and dALFF. Notably, to compare the differences in functional impairment patterns, we included the predementia AD group (A+T+) as a reference. According to previous findings (Caroli et al., 2015; Jack et al., 2016; Altomare et al., 2019; Lowe et al., 2019) that SNAP had a relatively distinct pathological background and clinical trajectory from AD, we hypothesized that SNAP might display different functional changes relative to AD.
Materials and Methods
Alzheimer’s Disease Neuroimaging and Initiative
All data used in this article were downloaded from the Alzheimer’s Disease Neuroimaging Initiative (ADNI) database1. The ADNI is a longitudinal multicenter study since 2004 and now contains ADNI 1, ADNI GO, ADNI 2, and ADNI 3. By the use of clinical, neuropsychological assessment, gene, biofluid, and imaging data, it aims to investigate the biomarkers of early detection and progression of AD.
Study Participants
All individuals in this study signed the written informed consent as they joined the ADNI project. We identified 111 non-demented subjects (characterized as either CN or MCI) from the ADNI GO/2database (the flowchart was presented in Supplementary Material 1; Table 1). We included the CN and MCI since SNAP is much more prevalent in the non-demented population than in the dementia population (Dani et al., 2017; Yu et al., 2019). All these subjects had undergone structural MRI, resting-state functional MRI (rsfMRI), lumbar puncture, and comprehensive neuropsychological assessments.
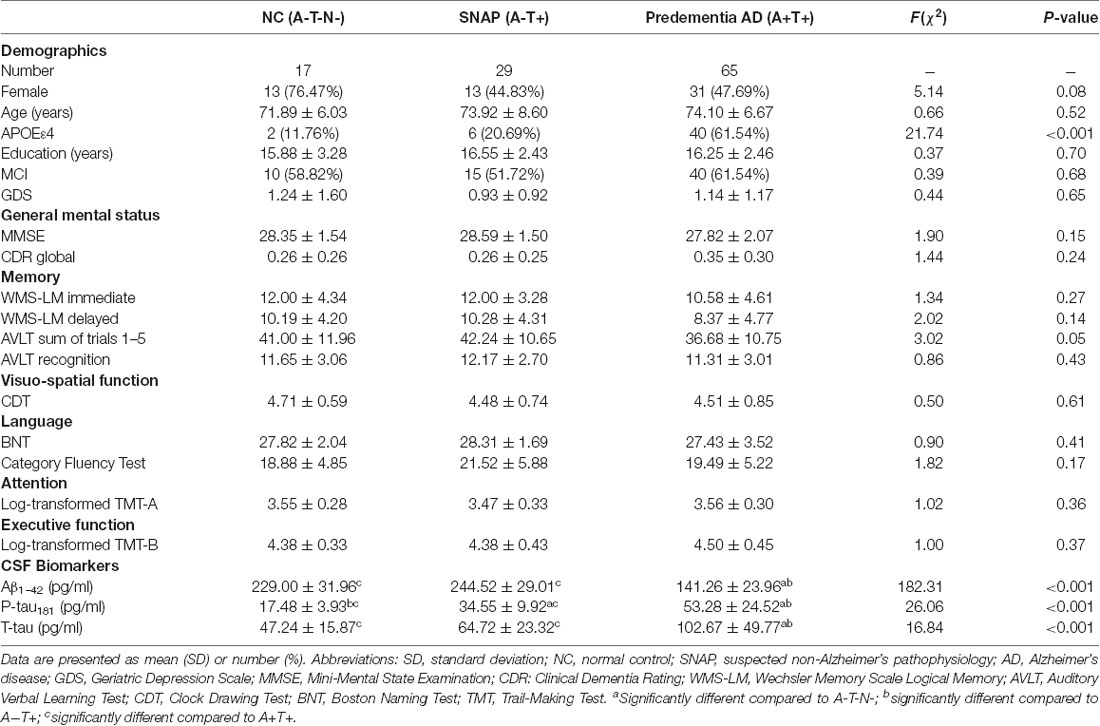
Table 1. Demographic and clinical characteristics.
Cognitively normal was defined as: (1) Clinical Dementia Rating (CDR) = 0; (2) Mini-Mental State Exam (MMSE) score between 24 and 30 (inclusive); (3) Normal Wechsler Memory Scale Logical Memory (WMS-LM) delay recall performance (in detail: ≥9 for subjects with 16 or more years of education; ≥5 for subjects with 8–15 years of education; and ≥3 for 0–7 years of education); (4) Without memory complaints; (5) No impairment in cognitive functions or activities of daily living. MCI was defined as (1) CDR = 0.5; (2) MMSE score between 24 and 30 (inclusive); (3) Abnormal WMS-LM delay recall performance documented by scoring within the education adjusted ranges; (4) Subjective memory concern reported by the subject itself, study partners or clinician; and (5) Preserved general cognition and functional performance so that a diagnosis of AD dementia cannot be made.
We excluded individuals with following manifestations: (1) Significant medical, neurologic, and psychiatric illness, such as Parkinson’s disease, major depression, clinically significant abnormalities in vitamin B12; (2) Obvious head trauma history; (3) Use of non-AD related medication known to influence cerebral function; and (4) Alcohol or drug abuse (more details about the inclusion and exclusion criteria were presented in Supplementary Material 2).
Neuropsychological Assessments
All subjects completed the comprehensive cognitive assessment (Table 1), including general mental status assessed by MMSE and CDR global, memory assessed by Auditory Verbal Learning Test (AVLT) and WMS-LM, attention assessed by Trail-Making Test Part A (TMT-A), executive function assessed by Trail-Making Test Part B (TMT-B), visuospatial function assessed by Clock-Drawing Test (CDT), and language assessed by Boston Naming Test (BNT) and Category Fluency Test.
Group Classifications
Cerebrospinal fluid (CSF) β-amyloid 1–42 (Aβ1–42), phosphorylated tau at position 181 (P-tau181), and total tau (T-tau) are core AD biomarkers (Jack et al., 2018). The non-dementia stages enable early prevention and intervention. Thus, we classified people based on the CSF biomarkers of AD to explore the imaging characteristics in the non-dementia stage.
According to the 2018 National Institute on Aging-Alzheimer’s Association (NIA-AA) research framework (Jack et al., 2018), we use CSF Aβ1–42, T-tau, and P-tau181 level as the classification criteria. The CSF samples were measured by the multiplex xMAP Luminex platform as previously described (Olsson et al., 2005; Shaw et al., 2009). We set the CSF cutoff point at 192 pg/ml for Aβ1–42, 23 pg/ml for P-tau181, and 93 pg/ml for T-tau (Shaw et al., 2009). Decreased CSF Aβ1–42 and elevated CSF P-tau181or T-tau levels were regarded as abnormalities. Then, we divided 111 non-demented subjects into three groups: NC: subjects with normal Aβ1–42 and P-tau181 and T-tau (A-T-N-, n = 17), SNAP: subjects with normal Aβ1–42 and abnormal P-tau181 (A-T+, n = 29), predementia AD: subjects with abnormal Aβ1–42 and P-tau181 (A+T+, n = 65). Due to the limited number of A+T-, we did not include this group for analysis (the flowchart in Supplementary Material 1).
MRI Acquisition
The T1 structure images were obtained using Three-dimensional Magnetization Prepared Rapid Acquisition Gradient Echo (3D MPRAGE) T1-weighted sequence with the following parameters: voxel size = 1.0 × 1.0 × 1.2 mm3; flip angle = 9°; echo time (TE) = 3.13 ms; repetition time (TR) = 6.77 ms; 170 sagittal slices; within plane FOV = 256 × 256 mm2. The rsfMRI images were obtained using an echo-planar imaging sequence with the following parameters: 140 time points; TE = 30 ms; TR = 3,000 ms; number of slices = 48; slice thickness = 3.3 mm; spatial resolution = 3.31 × 3.31 × 3.31 mm3; flip angle = 80°; matrix = 64 × 64. All subjects undergo MRI scanning with their eyes open, focusing on a cross, and kept at rest calmly according to the ADNI scanning protocol.
MRI Pre-processing
The rsfMRI data were preprocessed using the Data Processing Assistant for Resting-state fMRI (DPARSF2, Chao-Gan and Yu-Feng, 2010) based on the platform of Statistical Parametric Mapping 12 (SPM12)3. First, the first 10 volumes of rsfMRI scans were removed due to the signal equilibrium and the subject’s adaptation to the scanning noise. The remaining 130 images were corrected for both timing differences between each slice and head motion (Friston 24-parameter model (Friston et al., 1996). Next, image data with head motion displacement of not more than 2.5 mm in any of the x, y, or z directions or 2.5° rotation of angular motion were chosen for further analysis (one SNAP and one predementia AD subject was excluded). Then, T1-weighted images and the mean rsfMRI images were co-registered, spatially normalized to the Montreal Neurological Institute (MNI) standard space, and subsequently re-sampled into 3 mm × 3 mm × 3 mm cubic voxel. Nuisance covariates, including 24 head motion parameters and signals of white matter and CSF, were corrected. Finally, rsfMRI images were detrended and spatially smoothed with a Gaussian kernel of 6 × 6 × 6 mm3 full width at half maximum (FWHM).
sALFF and dALFF Variance Calculation
The sALFF was computed using the DPARSF toolbox to reflect the strength of intrinsic brain activity. The procedure was as follows: the time series of each voxel was changed into the frequency domain with a fast Fourier transform. Next, across the 0.01–0.08 Hz domain, the square root of the power spectrum in each voxel was computed and averaged. This averaged square root was taken as the sALFF of each voxel (Zang et al., 2007). Finally, to standardize the result, the sALFF of each voxel was divided by the global mean sALFF value within the default brain mask from the DPARSF.
The dALFF was computed in the DynamicBC toolbox4 (Liao et al., 2014) by using a sliding window approach to reflect the dynamic change of intrinsic brain activity. According to previous studies which proved that window sizes in the range of 40 s to 100 s could capture brain dynamics well (Zalesky and Breakspear, 2015), we chose 14TR (42 s) as the window size, and 1TR as the window step. Then, we got an ALFF map for each sliding window, as well as the dALFF variance that reflects the temporal stability of intrinsic brain activity. To test the reliability of the results under different window sizes, we also analyzed dALFF in other window sizes, and details were presented in Supplementary Material 3.
Statistical Analysis
Demographic data were analyzed in SPSS (version 23.0) by using Chi-squared (χ2) test for categorical data (gender, APOE4 genotyping) and analysis of variance (ANOVA) for continuous data (age, education years, neuropsychological scores, and CSF biomarkers). Then, post hoc analysis using two-sample t-tests was further performed to reveal the source of ANOVA difference (P < 0.05, corrected by Bonferroni).
We adopted a voxel-wise two-sample t-test in the DPABI toolbox (Yan et al., 2016) to explore the neuroimaging metric differences (including sALFF, dALFF variance) between SNAP and NC, predementia AD and NC, as well as predementia AD and SNAP, with gray matter volume and age as covariates. We set the threshold at 0.01 for voxel P-value, 0.05 for cluster P-value using the Gaussian random field (GRF) correction.
We defined regions with significantly changed sALFF and dALFF variance as the regions of interest (ROIs) and extracted each subjects’ values of sALFF and dALFF within ROIs. Then, we performed partial correlation analyses between the sALFF or dALFF of ROIs and neurophysiological or pathological data after controlling for age. In detail, pathological data included CSF Aβ1–42, T-tau, and P-tau181. Neurophysiological data included general mental status (MMSE, CDR global), memory (AVLT, WMS-LM), attention (TMT-A), executive function (TMT-B), visuospatial function (CDT), and language (BNT, Category Fluency Test). To reduce the effects of multiple comparisons, we chose P < 0.01 as the statistical significance level.
Results
Demographics, Cognitive and CSF Data
We presented the demographics, CSF biomarkers levels, and neuropsychological scores in Table 1. There is no significant statistical difference in age, gender, education, clinical diagnosis, and geriatric depression scale (GDS) among three groups (P > 0.05). The proportion of APOEε4 carriers was significantly lower in SNAP (20.7%) and NC (11.8%) than that in the predementia AD group (61.5%, P < 0.001).
As for cognitive data, three groups did not differ significantly in general mental status (MMSE, CDR global) and multiple cognitive domains (memory, visuospatial function, language, attention, and executive function; P > 0.05).
As for the CSF pathological biomarkers, P-tau181 showed significant changes in SNAP and predementia AD group (P < 0.001). Aβ1–42 and T-tau showed significant changes only in the predementia AD group (P < 0.001).
sALFF Result
SNAP had decreased sALFF in the left superior frontal gyrus (SFG), and increased sALFF in the left insula when compared to NC (Figure 1A, Table 2, Supplementary Material 4; voxel P < 0.01, cluster P < 0.05, controlling age and gray matter volume, GRF corrected). Predementia AD showed decreased sALFF in the right precuneus, left inferior parietal gyrus (IPG) while increased sALFF in the left insula than NC (Figure 1C, Table 2, Supplementary Material 4). When directly compared to SNAP, predementia AD showed decreased sALFF in left middle occipital gyrus and left IPG (Figure 1E, Table 2, Supplementary Material 4).
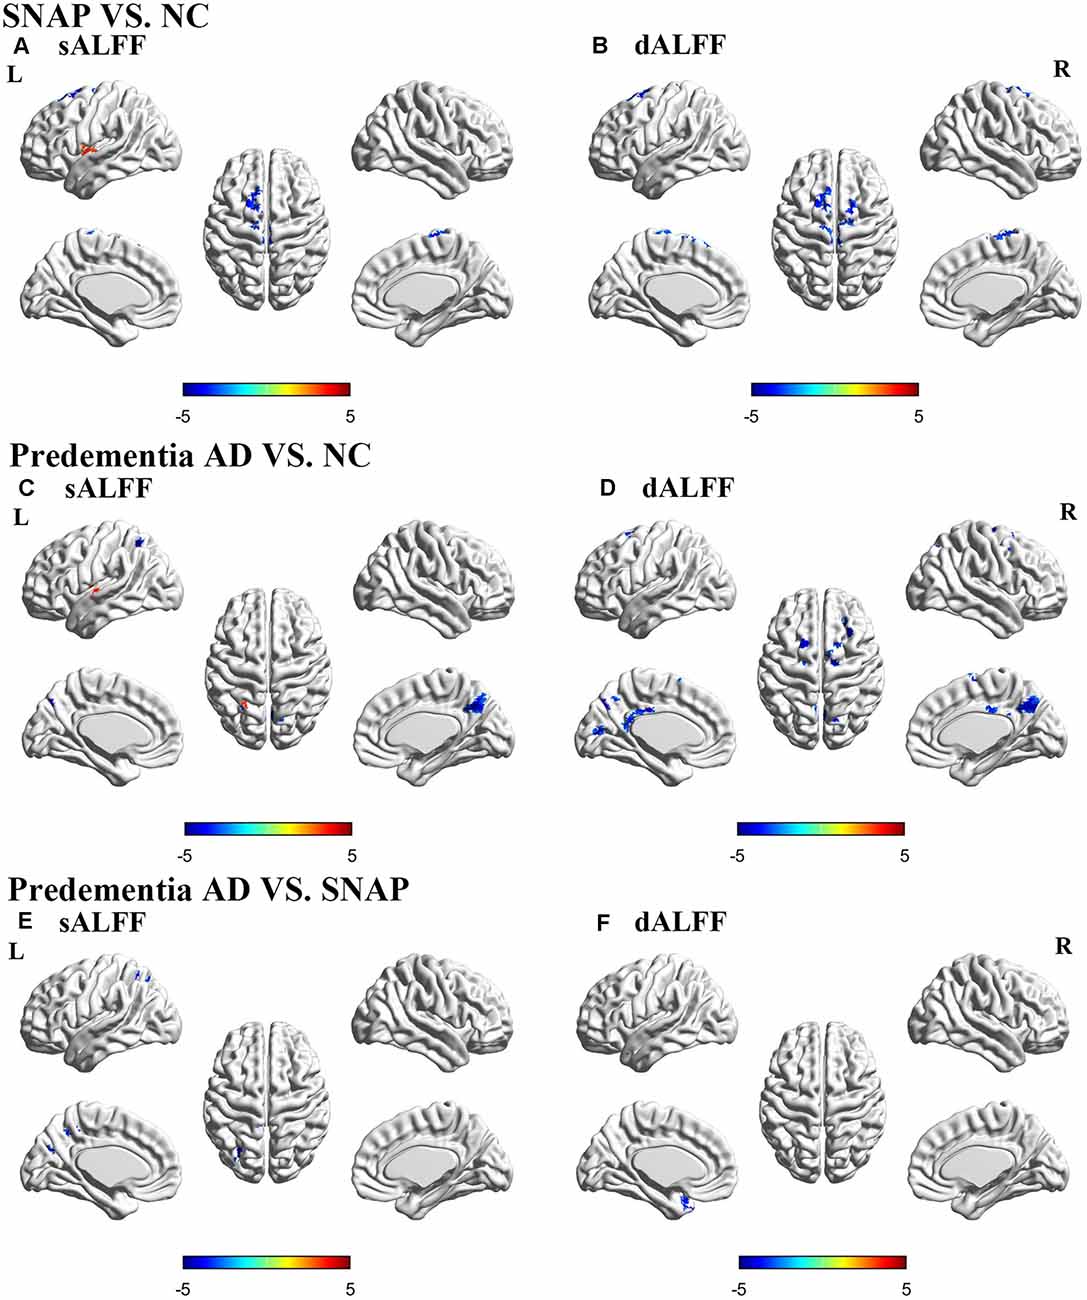
Figure 1. Brain areas with significant differences of sALFF and dALFF in SNAP and predementia AD. Upper panel: SNAP vs. NC; Middle panel: predementia AD vs. NC; Lower panel: predementia AD vs. SNAP. (A,C,E) Differences of sALFF; (B,D,F) differences of dALFF [voxel P < 0.01, cluster P < 0.05, controlling for age, gray matter volume, Gaussian random field (GRF) corrected]. Abbreviations: sALFF, static amplitude of low-frequency fluctuation; dALFF, dynamic amplitude of low-frequency fluctuation; NC, normal control; SNAP, suspected non-Alzheimer’s pathophysiology; AD, Alzheimer’s disease.
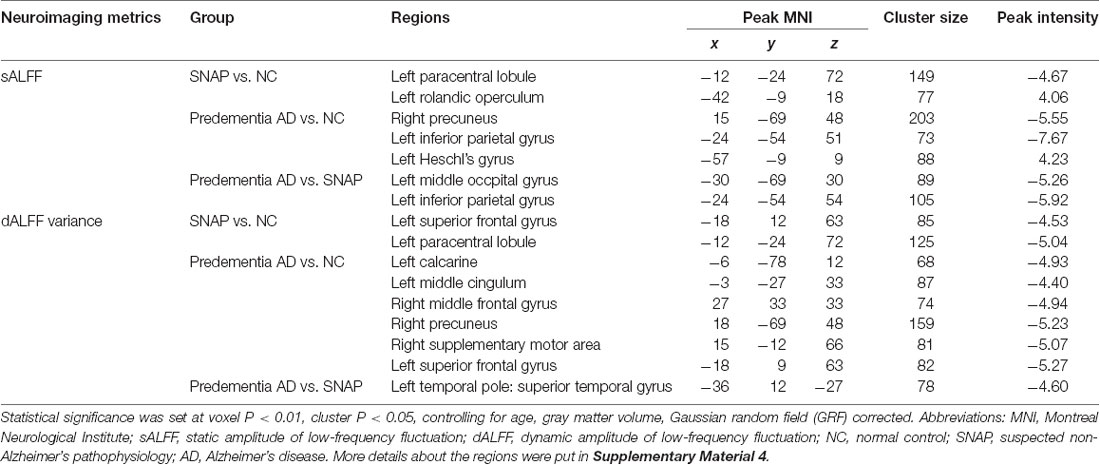
Table 2. Brain areas with significant differences of sALFF and dALFF in SNAP and predementia AD.
dALFF Variance Result
SNAP showed decreased dALFF variance in left SFG and left paracentral lobule when compared to NC (Figure 1B, Table 2, Supplementary Material 4; voxel P < 0.01, cluster P < 0.05, controlling age and gray matter volume, GRF corrected), while predementia AD group showed decreased dALFF variance in a wide cortical area involving left calcarine, left middle cingulum, right precuneus, right supplementary motor area, left SFG, and right middle frontal gyrus (MFG) when compared to NC (Figure 1D, Table 2, Supplementary Material 4). Moreover, as directly compared with SNAP, predementia AD showed decreased dALFF variance in the left temporal pole (Figure 1F, Table 2, Supplementary Material 4).
Correlation Analysis
We performed partial correlation analyses between the functional changes and cognition, as well as pathological biomarkers to explore the physiological significance of the sALFF and dALFF (detailed results were presented in Supplementary Material 5). For SNAP, we found that sALFF in the insula had a negative correlation with MMSE (r = −0.485, P = 0.009, corrected for age, Figure 2A). As for predementia AD, sALFF and dALFF in precuneus were associated with attention (Log-transformed TMT-A, r = −0.390, P = 0.001; r = −0.375, P = 0.002; corrected for age, respectively, Figures 2B,C). We did not find a significant correlation between CSF biomarkers and functional changes in SNAP and predementia AD.
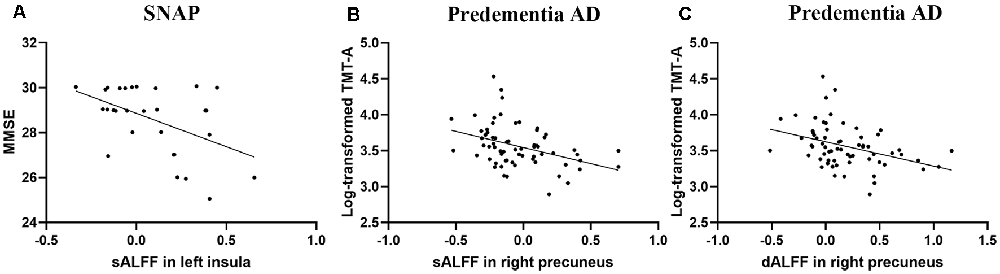
Figure 2. Scatter plot diagram of the correlation between sALFF/dALFF and cognition. (A) Increased sALFF in insula correlated with worse MMSE in SNAP group (r = −0.485, P = 0.009, corrected for age). (B,C) The sALFF/dALFF in precuneus negatively correlated with Log-transformed TMT-A finish time in predementia AD group (r = −0.390, P = 0.001; r = −0.375, P = 0.002; corrected for age, respectively). Abbreviations: sALFF, static amplitude of low-frequency fluctuation; dALFF, dynamic amplitude of low-frequency fluctuation; SNAP, suspected non-Alzheimer’s pathophysiology; AD, Alzheimer’s disease; MMSE, Mini-Mental State Examination; TMT-A, Trail-Making Test Part-A.
Discussion
To the best of our knowledge, this is the first study investigating the brain functional changes in SNAP by combining the sALFF and dALFF. Our study found distinct impairment patterns in SNAP and predementia AD as compared to NC: SNAP showed decreased intrinsic functional connectivity strength and stability in SFG, while also showing increased intrinsic functional connectivity strength in the insula, while predementia AD showed widespread decreased functional connectivity strength and stability involving the frontal, parietal and occipital cortex. In the direct comparison of SNAP and predementia AD group, predementia AD showed decreased functional connectivity strength and stability than SNAP. Accordingly, SNAP is a different neurodegenerative disease entity from AD, which needs more clinical attention.
Distinct Brain Functional Impairment Patterns in SNAP and Predementia AD
Our findings on predementia AD showed decreased sALFF in the right precuneus and left IPG, while increased sALFF in the left insula. These results are largely consistent with the classic network disconnectivity theory in AD: reduced functional connectivity in default mode network (DMN), especially the precuneus and IPG, while salience network (SN) can be activated as compensation to maintain cognitive integrity (Zhou et al., 2010). Thereinto, precuneus, as the vital component of DMN, is vulnerable to suffer amyloid deposition and functional changes at the early AD stage and is significantly correlated with cognitive changes (Palmqvist et al., 2017). This can also be proved by our study which observed the significant correlation between intrinsic brain activity within precuneus and attention in predementia AD. Moreover, our dALFF results extensively showed widespread decreased intrinsic brain activity stability in predementia AD subjects, which suggested progressively widespread functional network disruption involving DMN, SN, and executive control network (ECN) in AD (Menon, 2011; Zhao et al., 2019).
On the other hand, SNAP showed a quite different impaired pattern: decreased sALFF and dALFF variance in SFG while increased sALFF in the insula. First, the altered functional signal in SFG suggested the decreased intrinsic brain activity strength and stability in SFG. The decreased brain activity strength and stability in SFG represented the specific impairment pattern of SNAP, which differs from the compensatory function of SFG in AD patients (Maillet and Rajah, 2013; Franzmeier et al., 2018). Functionally, SFG works as the core structure of the ECN and contributes to high cognitive functions including working memory and executive function (du Boisgueheneuc et al., 2006; Alagapan et al., 2019; Briggs et al., 2020). A recent study showed that SNAP (A−T+) had worse frontal lobe function performance than AD (A+T+) in the dementia population (Takenoshita et al., 2019). Accordingly, the decreased brain functional connectivity strength and flexibility in SFG may be the key to cognition changes in SNAP.
Moreover, we also found increased sALFF in the insula, suggesting the increased intrinsic brain activity strength. Functionally, The insula plays a crucial role in SN and mediates the interaction between large-scale functional networks during cognitive processes (Menon and Uddin, 2010; Chen et al., 2016). The insula involves multiple functions, including sensory, emotional, autonomic, and cognitive function (Menon and Uddin, 2010; Gasquoine, 2014). Previous studies found increased functional connectivity in the SN in subjects with neurodegenerative diseases and regarded it as a compensatory response to decreased cognitive ability (Yassa et al., 2008; Agosta et al., 2012; Skouras et al., 2019). Similarly, increased cerebral blood flow in the insula has also been identified as a compensatory mechanism against pathological damage in the preclinical phase of AD (Caroli et al., 2010; Fazlollahi et al., 2020). Our further analysis also observed a positive association between sALFF and MMSE in SNAP, supporting the compensatory mechanism. Conclusively, SNAP showed functional impairments in SFG with the compensatory improvement of function in the insula. This is partially distinct from the classic AD impairment pattern.
When directly compared to SNAP, predementia AD showed significantly decreased sALFF in left middle occipital gyrus and left IPG, and decreased dALFF variance in the left temporal pole. This result indicated that AD had more functional impairment than SNAP in the non-dementia stage, which further supports our finding that SNAP has distinct brain functional impairment patterns from predementia AD.
The Possible Mechanism Underlying SNAP
SNAP features functional changes in the SFG and insula. This is quite different from the classic AD functional change pattern: widespread functional impairments starting from DMN while SFG is spared at the early stage. The possible mechanism may be the distinct pathological deposit and distribution. SNAP features abnormal Tau and normal Amyloid, while AD here features both abnormal Amyloid and Tau. Moreover, another study found that entorhinal tauopathy correlated with distant frontal hypometabolism in an Aβ independent way (Hanseeuw et al., 2017), which might be the possible reason for frontal functional damage in SNAP. Medial temporal lobe tauopathy without amyloid was common in the brain of older people, which was thought to account for a subset of SNAP population (Crary et al., 2014). A recent tau position emission tomography (PET) study supported this finding and showed bilateral temporal lobe tau deposition in SNAP (Dodich et al., 2020). As for AD, amyloid deposition spreads widely in the neocortex early in the pathological processes (Braak and Braak, 1991), which may explain why AD showed widespread cortical functional changes. Moreover, the synergistic effect of amyloid deposition and pathologic tau may induce more impairments than amyloid deposition or tau alone (Bloom, 2014; He et al., 2018).
There are some limitations in our study. First, the sample size is relatively small, which may reduce statistical power and would not allow for a subgroup analysis between different cognitive stages of SNAP. Further studies with larger sample sizes should be performed. Second, SNAP is a relatively heterogeneous group, easily resulting from other factors like cerebrovascular disease (CVD; Wong et al., 2019), primary age-related tauopathy (PART; Vos et al., 2013) or argyrophilic grain disease (AGD; Lowe et al., 2019). Further studies should consider these associated factors. Third, as for dALFF, there lacks a unified criterion for the window size in the sliding-window analysis process. We explored the analysis in other window sizes to prove the stability of the result. Moreover, a longer scan length for the dALFF might be better to study the pattern of dynamic brain activity. At last, we did not find significant differences in the cognitive scores between SNAP and NC (Table 1). This might be explained by the relatively intact cognition of the included subjects, and that pathological changes and fMRI abnormalities always precede cognitive changes (Sperling et al., 2011; Sheline and Raichle, 2013). Further studies with longitudinal data may give more hints on the clinical implications of SNAP.
Conclusion
SNAP shows impaired functional activities mainly confined to the frontal lobe and activated insula, while predementia AD shows widespread functional activity changes involving frontal, parietal, and occipital cortex as compared to NC. Moreover, such decreased intrinsic brain activity strength and stability in SNAP may explain its cognitive decline and rapid clinical progression. Our study suggests that SNAP can be distinguished from AD both pathologically and functionally, and more attention should be put on SNAP.
Data Availability Statement
The datasets generated and/or analyzed during the current study are available in the ADNI study. More details in www.adni-info.org.
Ethics Statement
All procedures performed in studies involving human participants were in accordance with the ethical standards of the institutional and/or national research committee and with the 1964 Helsinki declaration and its later amendments or comparable ethical standards.
Written informed consent was obtained from all participants and/or authorized representatives and the study partners before any protocol-specific procedures were carried out in the ADNI study.
Author Contributions
ZL collected and analyzed the MRI data, and wrote the first draft of the manuscript. KL analyzed the MRI data and wrote the protocol. YC and MZ designed and conceptualized the study, and revised the manuscript. ZL, QZ, SZ, and BZ assisted with study design and interpretation of findings. All authors contributed to the article and approved the submitted version.
Funding
This study was funded by the National Natural Science Foundation of China (Grant No. 81870826, 81901707), Zhejiang Provincial Natural Science Foundation of China (Grant No. LY18H090004), the 13th Five-year Plan for National Key Research and Development Program of China (Grant No. 2016YFC1306600), and Guangdong Provincial Key S&T Program (2018B030336001).
Conflict of Interest
The authors declare that the research was conducted in the absence of any commercial or financial relationships that could be construed as a potential conflict of interest.
Acknowledgments
Data collection and sharing for this project was funded by the Alzheimer’s Disease Neuroimaging Initiative (ADNI; National Institutes of Health Grant U01 AG024904) and DOD ADNI (Department of Defense award number W81XWH-12-2-0012). ADNI is funded by the National Institute on Aging, the National Institute of Biomedical Imaging and Bioengineering, and through generous contributions from the following: AbbVie, Alzheimer’s Association; Alzheimer’s Drug Discovery Foundation; Araclon Biotech; BioClinica, Inc.; Biogen; Bristol-Myers Squibb Company; CereSpir, Inc.; Cogstate; Eisai Inc.; Elan Pharmaceuticals, Inc.; Eli Lilly and Company; EuroImmun; F. Hoffmann-La Roche Limited and its affiliated company Genentech, Inc.; Fujirebio; GE Healthcare; IXICO Limited; Janssen Alzheimer Immunotherapy Research and Development, LLC.; Johnson and Johnson Pharmaceutical Research and Development LLC.; Lumosity; Lundbeck; Merck and Co., Inc.; Meso Scale Diagnostics, LLC.; NeuroRx Research; Neurotrack Technologies; Novartis Pharmaceuticals Corporation; Pfizer Inc.; Piramal Imaging; Servier; Takeda Pharmaceutical Company; and Transition Therapeutics. The Canadian Institutes of Health Research is providing funds to support ADNI clinical sites in Canada. Private sector contributions are facilitated by the Foundation for the National Institutes of Health (www.fnih.org). The grantee organization is the Northern California Institute for Research and Education, and the study is coordinated by the Alzheimer’s Therapeutic Research Institute at the University of Southern California. ADNI data are disseminated by the Laboratory for Neuro Imaging at the University of Southern California.
Footnotes
- ^ http://adni.loni.usc.edu/
- ^ http://rfmri.org/DPARSF
- ^ www.fil.ion.ucl.ac.uk/spm
- ^ www.restfmri.net/forum/DynamicBC
Supplementary Material
The Supplementary Material for this article can be found online at: https://www.frontiersin.org/articles/10.3389/fnagi.2020.550664/full#supplementary-material.
References
Agosta, F., Pievani, M., Geroldi, C., Copetti, M., Frisoni, G. B., and Filippi, M. (2012). Resting state fMRI in Alzheimer’s disease: beyond the default mode network. Neurobiol. Aging 33, 1564–1578. doi: 10.1016/j.neurobiolaging.2011.06.007
Alagapan, S., Lustenberger, C., Hadar, E., Shin, H. W., and Frhlich, F. (2019). Low-frequency direct cortical stimulation of left superior frontal gyrus enhances working memory performance. NeuroImage 184, 697–706. doi: 10.1016/j.neuroimage.2018.09.064
Altomare, D., de Wilde, A., Ossenkoppele, R., Pelkmans, W., Bouwman, F., Groot, C., et al. (2019). Applying the ATN scheme in a memory clinic population: the ABIDE project. Neurology 93, e1635–e1646. doi: 10.1212/WNL.0000000000008361
Ben Bouallègue, F., Mariano-Goulart, D., Payoux, P., and Alzheimer’s Disease Neuroimaging Initiative (ADNI). (2018). Joint assessment of quantitative 18F-florbetapir and 18F-FDG regional uptake using baseline data from the ADNI. J. Alzheimers Dis. 62, 399–408. doi: 10.3233/JAD-170833
Bloom, G. S. (2014). Amyloid-β and tau: the trigger and bullet in Alzheimer disease pathogenesis. JAMA Neurol. 71, 505–508. doi: 10.1001/jamaneurol.2013.5847
Braak, H., and Braak, E. (1991). Neuropathological stageing of Alzheimer-related changes. Acta Neuropathol. 82, 239–259. doi: 10.1007/BF00308809
Briggs, R. G., Khan, A. B., Chakraborty, A. R., Abraham, C. J., Anderson, C. D., Karas, P. J., et al. (2020). Anatomy and white matter connections of the superior frontal gyrus. Clin. Anat. 33, 823–832. doi: 10.1002/ca.23523
Burnham, S. C., Bourgeat, P., Dore, V., Savage, G., Brown, B., Laws, S., et al. (2016). Clinical and cognitive trajectories in cognitively healthy elderly individuals with suspected non-Alzheimer’s disease pathophysiology (SNAP) or Alzheimer’s disease pathology: a longitudinal study. Lancet Neurol. 15, 1044–1053. doi: 10.1212/WNL.0000000000010952
Caroli, A., Geroldi, C., Nobili, F., Barnden, L. R., Guerra, U. P., Bonetti, M., et al. (2010). Functional compensation in incipient Alzheimer’s disease. Neurobiol. Aging 31, 387–397. doi: 10.1016/j.neurobiolaging.2008.05.001
Caroli, A., Prestia, A., Galluzzi, S., Ferrari, C., van der Flier, W. M., Ossenkoppele, R., et al. (2015). Mild cognitive impairment with suspected nonamyloid pathology (SNAP): prediction of progression. Neurology 84, 508–515. doi: 10.1212/WNL.0000000000001209
Chao-Gan, Y., and Yu-Feng, Z. (2010). DPARSF: a MATLAB toolbox for “pipeline” data analysis of resting-state fMRI. Front. Syst. Neurosci. 4:13. doi: 10.3389/fnsys.2010.00013
Chen, T., Cai, W., Ryali, S., Supekar, K., and Menon, V. (2016). Distinct global brain dynamics and spatiotemporal organization of the salience network. PLoS Biol. 14, e1002469–e1002469. doi: 10.1371/journal.pbio.1002469
Chiaravalloti, A., Barbagallo, G., Martorana, A., Castellano, A. E., Ursini, F., and Schillaci, O. (2019). Brain metabolic patterns in patients with suspected non-Alzheimer’s pathophysiology (SNAP) and Alzheimer’s disease (AD): is [18F] FDG a specific biomarker in these patients? Eur. J. Nucl. Med. Mol. Imaging 46, 1796–1805. doi: 10.1007/s00259-019-04379-4
Christoff, K., Irving, Z. C., Fox, K. C., Spreng, R. N., and Andrews-Hanna, J. R. (2016). Mind-wandering as spontaneous thought: a dynamic framework. Nat. Rev. Neurosci. 17, 718–731. doi: 10.1038/nrn.2016.113
Chung, J. K., Plitman, E., Nakajima, S., Caravaggio, F., Iwata, Y., Gerretsen, P., et al. (2017). Hippocampal and clinical trajectories of mild cognitive impairment with suspected non-Alzheimer’s disease pathology. J. Alzheimers Dis. 58, 747–762. doi: 10.3233/JAD-170201
Crary, J. F., Trojanowski, J. Q., Schneider, J. A., Abisambra, J. F., Abner, E. L., Alafuzoff, I., et al. (2014). Primary age-related tauopathy (PART): a common pathology associated with human aging. Acta Neuropathol. 128, 755–766. doi: 10.1007/s00401-014-1349-0
Dani, M., Brooks, D. J., and Edison, P. (2017). Suspected non-Alzheimer’s pathology—is it non-Alzheimer’s or non-amyloid? Ageing Res. Rev. 36, 20–31. doi: 10.1016/j.arr.2017.02.003
de Vos, F., Koini, M., Schouten, T. M., Seiler, S., van der Grond, J., Lechner, A., et al. (2018). A comprehensive analysis of resting state fMRI measures to classify individual patients with Alzheimer’s disease. NeuroImage 167, 62–72. doi: 10.1016/j.neuroimage.2017.11.025
Dodich, A., Mendes, A., Assal, F., Chicherio, C., Rakotomiaramanana, B., Andryszak, P., et al. (2020). The A/T/N model applied through imaging biomarkers in a memory clinic. Eur. J. Nucl. Med. Mol. Imaging 47, 247–255. doi: 10.1007/s00259-019-04536-9
du Boisgueheneuc, F., Levy, R., Volle, E., Seassau, M., Duffau, H., Kinkingnehun, S., et al. (2006). Functions of the left superior frontal gyrus in humans: a lesion study. Brain 129, 3315–3328. doi: 10.1093/brain/awl244
Fazlollahi, A., Calamante, F., Liang, X., Bourgeat, P., Raniga, P., Dore, V., et al. (2020). Increased cerebral blood flow with increased amyloid burden in the preclinical phase of Alzheimer’s disease. J. Magn. Reson. Imaging 51, 505–513. doi: 10.1002/jmri.26810
Franzmeier, N., Düzel, E., Jessen, F., Buerger, K., Levin, J., Duering, M., et al. (2018). Left frontal hub connectivity delays cognitive impairment in autosomal-dominant and sporadic Alzheimer’s disease. Brain 141, 1186–1200. doi: 10.1093/brain/awy008
Friston, K. J., Williams, S., Howard, R., Frackowiak, R. S., and Turner, R. (1996). Movement-related effects in fMRI time-series. Magn. Reson. Med. 35, 346–355. doi: 10.1002/mrm.1910350312
Fu, Z., Tu, Y., Di, X., Du, Y., Pearlson, G. D., Turner, J. A., et al. (2018). Characterizing dynamic amplitude of low-frequency fluctuation and its relationship with dynamic functional connectivity: an application to schizophrenia. NeuroImage 180, 619–631. doi: 10.1016/j.neuroimage.2017.09.035
Gasquoine, P. G. (2014). Contributions of the insula to cognition and emotion. Neuropsychol. Rev. 24, 77–87. doi: 10.1007/s11065-014-9246-9
Gordon, B. A., Blazey, T., Su, Y., Fagan, A. M., Holtzman, D. M., Morris, J. C., et al. (2016). Longitudinal β-amyloid deposition and hippocampal volume in preclinical Alzheimer disease and suspected non-Alzheimer disease pathophysiology. JAMA Neurol. 73, 1192–1200. doi: 10.1001/jamaneurol.2016.2642
Hanseeuw, B. J., Betensky, R. A., Schultz, A. P., Papp, K. V., Mormino, E. C., Sepulcre, J., et al. (2017). Fluorodeoxyglucose metabolism associated with tau-amyloid interaction predicts memory decline. Ann. Neurol. 81, 583–596. doi: 10.1002/ana.24910
He, Z., Guo, J. L., McBride, J. D., Narasimhan, S., Kim, H., Changolkar, L., et al. (2018). Amyloid-β plaques enhance Alzheimer’s brain tau-seeded pathologies by facilitating neuritic plaque tau aggregation. Nat. Med. 24, 29–38. doi: 10.1038/nm.4443
Jack, C. R. Jr., Bennett, D. A., Blennow, K., Carrillo, M. C., Dunn, B., Haeberlein, S. B., et al. (2018). NIA-AA research framework: toward a biological definition of Alzheimer’s disease. Alzheimers Dement. 14, 535–562. doi: 10.1016/j.jalz.2018.02.018
Jack, C. R. Jr., Knopman, D. S., Chételat, G., Dickson, D., Fagan, A. M., Frisoni, G. B., et al. (2016). Suspected non-Alzheimer disease pathophysiology—concept and controversy. Nat. Rev. Neurol. 12, 117–124. doi: 10.1038/nrneurol.2015.251
Jack, C. R. Jr., Knopman, D. S., Weigand, S. D., Wiste, H. J., Vemuri, P., Lowe, V., et al. (2012). An operational approach to national institute on aging-Alzheimer’s association criteria for preclinical Alzheimer disease. Ann. Neurol. 71, 765–775. doi: 10.1002/ana.22628
Jack, C. R. Jr., Wiste, H. J., Weigand, S. D., Therneau, T. M., Knopman, D. S., Lowe, V., et al. (2017). Age-specific and sex-specific prevalence of cerebral β-amyloidosis, tauopathy and neurodegeneration in cognitively unimpaired individuals aged 50–95 years: a cross-sectional study. Lancet Neurol. 16, 435–444. doi: 10.1016/S1474-4422(17)30077-7
Li, K., Luo, X., Zeng, Q., Jiaerken, Y., Wang, S., Xu, X., et al. (2019). Interactions between sleep disturbances and Alzheimer’s disease on brain function: a preliminary study combining the static and dynamic functional MRI. Sci. Rep. 9:19064. doi: 10.1038/s41598-019-55452-9
Liao, W., Wu, G.-R., Xu, Q., Ji, G.-J., Zhang, Z., Zang, Y.-F., et al. (2014). DynamicBC: a MATLAB toolbox for dynamic brain connectome analysis. Brain Connect. 4, 780–790. doi: 10.1089/brain.2014.0253
Liu, W., Yang, J., Chen, K., Luo, C., Burgunder, J., Gong, Q., et al. (2016). Resting-state fMRI reveals potential neural correlates of impaired cognition in Huntington’s disease. Parkinsonism Relat. Disord. 27, 41–46. doi: 10.1016/j.parkreldis.2016.04.017
Lowe, V. J., Lundt, E. S., Albertson, S. M., Przybelski, S. A., Senjem, M. L., Parisi, J. E., et al. (2019). Neuroimaging correlates with neuropathologic schemes in neurodegenerative disease. Alzheimers Dement. 15, 927–939. doi: 10.1016/j.jalz.2019.03.016
Maillet, D., and Rajah, M. N. (2013). Association between prefrontal activity and volume change in prefrontal and medial temporal lobes in aging and dementia: a review. Ageing Res. Rev. 12, 479–489. doi: 10.1016/j.arr.2012.11.001
Menon, V. (2011). Large-scale brain networks and psychopathology: a unifying triple network model. Trends Cogn. Sci. 15, 483–506. doi: 10.1016/j.tics.2011.08.003
Menon, V., and Uddin, L. Q. (2010). Saliency, switching, attention and control: a network model of insula function. Brain Struct. Funct. 214, 655–667. doi: 10.1007/s00429-010-0262-0
Olsson, A., Vanderstichele, H., Andreasen, N., De Meyer, G., Wallin, A., Holmberg, B., et al. (2005). Simultaneous measurement of β-amyloid(1–42), total tau, and phosphorylated tau (Thr181) in cerebrospinal fluid by the xMAP technology. Clin. Chem. 51, 336–345. doi: 10.1373/clinchem.2004.039347
Palacios, E. M., Sala-Llonch, R., Junque, C., Roig, T., Tormos, J. M., Bargallo, N., et al. (2013). Resting-state functional magnetic resonance imaging activity and connectivity and cognitive outcome in traumatic brain injury. JAMA Neurol. 70, 845–851. doi: 10.1001/jamaneurol.2013.38
Palmqvist, S., Scholl, M., Strandberg, O., Mattsson, N., Stomrud, E., Zetterberg, H., et al. (2017). Earliest accumulation of β-amyloid occurs within the default-mode network and concurrently affects brain connectivity. Nat. Commun. 8:1214. doi: 10.1038/s41467-017-01150-x
Schreiber, S., Schreiber, F., Lockhart, S. N., Horng, A., Bejanin, A., Landau, S. M., et al. (2017). Alzheimer disease signature neurodegeneration and APOE genotype in mild cognitive impairment with suspected non-Alzheimer disease pathophysiology. JAMA Neurol. 74, 650–659. doi: 10.1001/jamaneurol.2016.5349
Shaw, L. M., Vanderstichele, H., Knapik-Czajka, M., Clark, C. M., Aisen, P. S., Petersen, R. C., et al. (2009). Cerebrospinal fluid biomarker signature in Alzheimer’s disease neuroimaging initiative subjects. Ann. Neurol. 65, 403–413. doi: 10.1002/ana.21610
Sheline, Y. I., and Raichle, M. E. (2013). Resting state functional connectivity in preclinical Alzheimer’s disease. Biol. Psychiatry 74, 340–347. doi: 10.1016/j.biopsych.2012.11.028
Skidmore, F. M., Yang, M., Baxter, L., von Deneen, K. M., Collingwood, J., He, G., et al. (2013). Reliability analysis of the resting state can sensitively and specifically identify the presence of Parkinson disease. NeuroImage 75, 249–261. doi: 10.1016/j.neuroimage.2011.06.056
Skouras, S., Falcon, C., Tucholka, A., Rami, L., Sanchez-Valle, R., Lladó, A., et al. (2019). Mechanisms of functional compensation, delineated by eigenvector centrality mapping, across the pathophysiological continuum of Alzheimer’s disease. NeuroImage Clin. 22, 101777–101777. doi: 10.1016/j.nicl.2019.101777
Sperling, R. A., Aisen, P. S., Beckett, L. A., Bennett, D. A., Craft, S., Fagan, A. M., et al. (2011). Toward defining the preclinical stages of Alzheimer’s disease: recommendations from the National Institute on Aging-Alzheimer’s Association workgroups on diagnostic guidelines for Alzheimer’s disease. Alzheimers Dement. 7, 280–292. doi: 10.1016/j.jalz.2011.03.003
Takenoshita, N., Shimizu, S., Kanetaka, H., Sakurai, H., Suzuki, R., Miwa, T., et al. (2019). Classification of clinically diagnosed Alzheimer’s disease associated with diabetes based on amyloid and tau PET results. J. Alzheimers Dis. 71, 261–271. doi: 10.3233/JAD-190620
Vos, S. J. B., Xiong, C., Visser, P. J., Jasielec, M. S., Hassenstab, J., Grant, E. A., et al. (2013). Preclinical Alzheimer’s disease and its outcome: a longitudinal cohort study. Lancet Neurol. 12, 957–965. doi: 10.1016/S1474-4422(13)70194-7
Vos, S. J., Verhey, F., Frolich, L., Kornhuber, J., Wiltfang, J., Maier, W., et al. (2015). Prevalence and prognosis of Alzheimer’s disease at the mild cognitive impairment stage. Brain 138, 1327–1338. doi: 10.1093/brain/awv029
Wong, B. Y. X., Yong, T. T., Lim, L., Tan, J. Y., Ng, A. S. L., Ting, S. K. S., et al. (2019). Medial temporal atrophy in amyloid-negative amnestic type dementia is associated with high cerebral white matter hyperintensity. J. Alzheimers Dis. 70, 99–106. doi: 10.3233/JAD-181261
Yan, C.-G., Wang, X.-D., Zuo, X.-N., and Zang, Y.-F. (2016). DPABI: data processing and analysis for (resting-state) brain imaging. Neuroinformatics 14, 339–351. doi: 10.1007/s12021-016-9299-4
Yang, H., Long, X.-Y., Yang, Y., Yan, H., Zhu, C.-Z., Zhou, X.-P., et al. (2007). Amplitude of low frequency fluctuation within visual areas revealed by resting-state functional MRI. NeuroImage 36, 144–152. doi: 10.1016/j.neuroimage.2007.01.054
Yang, L., Yan, Y., Wang, Y., Hu, X., Lu, J., Chan, P., et al. (2018). Gradual disturbances of the amplitude of low-frequency fluctuations (ALFF) and fractional ALFF in Alzheimer spectrum. Front. Neurosci. 12:975. doi: 10.3389/fnins.2018.00975
Yassa, M. A., Verduzco, G., Cristinzio, C., and Bassett, S. S. (2008). Altered fMRI activation during mental rotation in those at genetic risk for Alzheimer disease. Neurology 70, 1898–1904. doi: 10.1212/01.wnl.0000312288.45119.d1
Yu, J.-T., Li, J.-Q., Suckling, J., Feng, L., Pan, A., Wang, Y.-J., et al. (2019). Frequency and longitudinal clinical outcomes of Alzheimer’s AT(N) biomarker profiles: a longitudinal study. Alzheimers Dement. 15, 1208–1217. doi: 10.1016/j.jalz.2019.05.006
Zalesky, A., and Breakspear, M. (2015). Towards a statistical test for functional connectivity dynamics. NeuroImage 114, 466–470. doi: 10.1016/j.neuroimage.2015.03.047
Zang, Y.-F., He, Y., Zhu, C.-Z., Cao, Q.-J., Sui, M.-Q., Liang, M., et al. (2007). Altered baseline brain activity in children with ADHD revealed by resting-state functional MRI. Brain Dev. 29, 83–91. doi: 10.1016/j.braindev.2006.07.002
Zeng, Q., Luo, X., Li, K., Wang, S., Zhang, R., Hong, H., et al. (2019). Distinct spontaneous brain activity patterns in different biologically-defined Alzheimer’s disease cognitive stage: a preliminary study. Front. Aging Neurosci. 11:350. doi: 10.3389/fnagi.2019.00350
Zhang, C., Dou, B., Wang, J., Xu, K., Zhang, H., Sami, M. U., et al. (2019). Dynamic alterations of spontaneous neural activity in Parkinson’s disease: a resting-state fMRI study. Front. Neurol. 10:1052. doi: 10.3389/fneur.2019.01052
Zhao, Q., Sang, X., Metmer, H., Swati, Z., Lu, J., and Alzheimer’s Disease NeuroImaging Initiative. (2019). Functional segregation of executive control network and frontoparietal network in Alzheimer’s disease. Cortex 120, 36–48. doi: 10.1016/j.cortex.2019.04.026
Keywords: suspected non-Alzheimer disease pathophysiology, Alzheimer’s disease, amplitude of low-frequency fluctuation, dynamic brain activity, resting-state fMRI
Citation: Li Z, Li K, Luo X, Zeng Q, Zhao S, Zhang B, Zhang M and Chen Y (2020) Distinct Brain Functional Impairment Patterns Between Suspected Non-Alzheimer Disease Pathophysiology and Alzheimer’s Disease: A Study Combining Static and Dynamic Functional Magnetic Resonance Imaging. Front. Aging Neurosci. 12:550664. doi: 10.3389/fnagi.2020.550664
Received: 10 April 2020; Accepted: 14 October 2020;
Published: 23 November 2020.
Edited by:
Annalena Venneri, The University of Sheffield, United KingdomReviewed by:
William Jonathan McGeown, University of Strathclyde, United KingdomStephanie Vos, Maastricht University, Netherlands
Copyright © 2020 Li, Li, Luo, Zeng, Zhao, Zhang, Zhang and Chen. This is an open-access article distributed under the terms of the Creative Commons Attribution License (CC BY). The use, distribution or reproduction in other forums is permitted, provided the original author(s) and the copyright owner(s) are credited and that the original publication in this journal is cited, in accordance with accepted academic practice. No use, distribution or reproduction is permitted which does not comply with these terms.
*Correspondence: Yanxing Chen, Y2hlbnlhbnhpbmdAemp1LmVkdS5jbg==; Minming Zhang, emhhbmdtaW5taW5nQHpqdS5lZHUuY24=
† These authors have contributed equally to this work
‡ Data used in the preparation of this article were obtained from the Alzheimer’s Disease Neuroimaging Initiative (ADNI) database (adni.loni.usc.edu). As such, the investigators within the ADNI contributed to the design and implementation of ADNI and/or provided data but did not participate in analysis or writing of this report. A complete listing of ADNI investigators can be found at http://adni.loni.usc.edu/wp-content/uploads/how_to_apply/ADNI_Acknowledgement_List.pdf