 Rui-ting Hu1†
 Bang-li Hu
- 1Department of Neurology, Minzu Hospital of Guangxi Zhuang Autonomous Region, Nanning, China
- 2Department of Pharmacy, Affiliated Hospital of Guilin Medical University, Guilin, China
- 3Department of Research, Guangxi Medical University Cancer Hospital, Nanning, China
- 4Department of Pharmacy, Minzu Hospital of Guangxi Zhuang Autonomous Region, Nanning, China
Background: The pathogenesis of Alzheimer’s disease (AD) remains to be elucidated. This study aimed to identify the hub genes in AD pathogenesis and determine their functions and pathways.
Methods: A co-expression network for an AD gene dataset with 401 samples was constructed, and the AD status-related genes were screened. The hub genes of the network were identified and validated by an independent cohort. The functional pathways of hub genes were analyzed.
Results: The co-expression network revealed a module that related to the AD status, and 101 status-related genes were screened from the trait-related module. Gene enrichment analysis indicated that these status-related genes are involved in synaptic processes and pathways. Four hub genes (ENO2, ELAVL4, SNAP91, and NEFM) were identified from the module, and these hub genes all participated in AD-related pathways, but the associations of each gene with clinical features were variable. An independent dataset confirmed the different expression of hub genes between AD and controls.
Conclusions: Four novel genes associated with AD pathogenesis were identified and validated, which provided novel therapeutic targets for AD.
Introduction
Alzheimer’s disease (AD) is a common chronic and progressive neurodegenerative disease in the aging population that is characterized by brain atrophy, progressive memory loss, and clinical manifestations of cognitive impairment (Madore et al., 2020). Despite the great advancement made in the treatment of AD, its pathogenesis remains largely unknown, and no cure is currently available (Arvanitakis et al., 2019), which poses a great socioeconomic burden to society. To date, many factors have been shown to be important contributors to the pathogenesis of AD, such as age, genetic variants, and environmental exposure. According to current evidence, aberrant expression of cytokines has been found to be a crucial factor in AD development (Veitch et al., 2019). Hence, unraveling the molecular basis of this disease is necessary to uncover the biology of AD and identify novel therapeutic targets.
Previous studies have identified several genes that participate in the pathogenesis of AD, such as IFITM3 (Hur et al., 2020), HDAC1 (Pao et al., 2020), and PLA2G4E (Pérez-González et al., 2020), which lead to neuronal apoptosis, amyloid-β deposition, and tau hyperphosphorylation, and finally result in neuronal loss and neurofibrillary tangle (NFT) formation. However, there are still many genes involved in AD pathology that remain to be elucidated. Recently, the weighted gene co-expression network analysis (WGCNA) has been widely used to identify clusters of co-expressed genes with highly correlated expression patterns based on the genetic profile of many diseases (Zhao et al., 2010). WGCNA has also been adopted to screen crucial modules and genes that are associated with AD pathogenesis, and several genes have been identified and validated (Pandey et al., 2019; Shi et al., 2020; Soleimani Zakeri et al., 2020). However, there were several limitations in those studies, such as the small sample sizes of the datasets, the use of differentially expressed genes instead of the original genes, or the use of blood rather than nervous system tissues. Therefore, the mechanisms underlying AD remain to be explored.
In this study, we conducted a comprehensive integrative analysis for a gene dataset with a large number of samples from the brain tissues of AD patients and normal controls. Our work aimed to construct a co-expression network for the genes using the WGCNA method and to screen the hub genes that were related to AD pathogenesis; then we validated the robustness of the expression of hub genes using an independent validated cohort. We also analyzed the pathways and clinical significance of the hub genes. Our results will provide valuable molecular information of the pathogenesis of AD and contribute to developing potential therapeutic targets for AD in future studies.
Materials and Methods
Dataset Selection
A flow chart of study design, data preparation, and analyses in this study is shown in Figure 1. The human AD tissue mRNA expression data of the GSE118553 dataset (Patel et al., 2019) was downloaded from Gene Expression Omnibus (GEO) database. This dataset has 401 brain tissue samples, consisting of 167 AD tissues, 134 asymptomatic AD tissues, and 100 normal brain tissues. Individuals with intact cognition but neuropathology consistent with AD were diagnosed with asymptomatic AD (Patel et al., 2019). The brain tissues include the cerebellum, entorhinal cortex, frontal cortex, and temporal cortex. The platform of this dataset was GPL10558 (Illumina HumanHT-12 V4.0 expression beadchip). We also downloaded the GSE109887 dataset (Lardenoije et al., 2019), which has 40 AD tissues (middle temporal gyrus) and 32 normal brain tissues, as an independent validated dataset, and the platform was GPL10904. For the GSE1297 dataset (Blalock et al., 2004) with 22 AD tissues (middle temporal gyrus) and nine normal brain tissues, we used the GPL96 platform (Affymetrix Human Genome U133A Array) to analyze the clinical significance of hub genes.
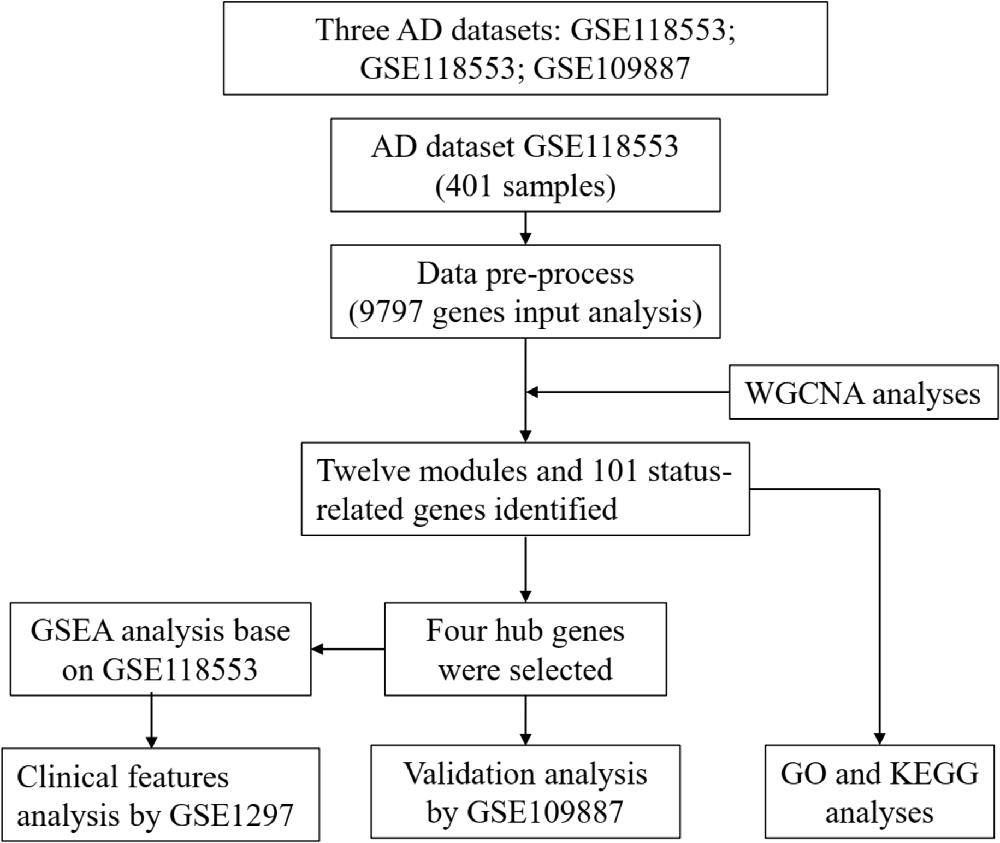
Figure 1. Flow chart of study design, data preparation, and analyses in this study.
Data Preprocessing for the Selected Datasets
After the expression matrixes of the four GEO datasets were downloaded, the probes of each dataset were mapped to gene symbols using the corresponding platform. Probes with more than one gene or empty probes were removed. If there were numerous probes mapped to the same gene symbol, their mean value was selected as the gene expression value. For the GSE118553 dataset, which was used to conduct co-expression analysis, there are 47,325 probes in the Illumina array platform; after the duplicated and empty probe gene pairs were removed, 20,764 probe–symbol pairs remained. To ensure the robustness of the network construction, we selected the genes for which the mean expression was only more than 1/5 of the average expression.
Weighted Gene Co-expression Network Analysis for Alzheimer’s Disease Dataset
WGCNA was performed on the GSE118553 dataset to identify significant modules and genes that were associated with the pathogenesis of AD. First, the soft-thresholding (β value) was set based on scale-free topology criterion to construct a correlation adjacency matrix. Then, the dynamic tree cut method was used to identify different modules. During module selection, the adjacency matrix was converted to a topology overlap matrix (TOM), and modules were detected by cluster analysis. Sample clustering was performed to analyze the relationship between gene expression and clinical features. The trait-related genes were extracted from the module that had significant correlations with clinical features and with high within-module connectivity. The WGCNA was implemented using R-Studio (version 3.4.2) software.
Gene Function Enrichment Analysis
Gene Ontology (GO) and Kyoto Encyclopedia of Genes and Genomes (KEGG) pathway analyses were used to analyze the function involving the status-related genes. GO analyses included biological process (BP), molecular function (MF), and cellular component (CC). KEGG analysis was used to identify the significant pathways in which genes were enriched. The “clusterProfiler” package (Yu et al., 2012) was used to conduct the GO and KEGG analyses. p-value < 0.05 was considered statistically significant enrichment.
Protein-Protein Interaction Network Construction and Hub Gene Selection
The trait-related genes were selected from the specific modules based on the results of WGCNA. In this study, we selected the genes significantly associated with the status of AD as interesting genes and named them as status-related genes. The status-related genes were input to the STRING online tool to construct a protein–protein interaction (PPI) network, and then the network was visualized using Cytoscape software. The hub genes of the status-related genes were further screened and visualized using cytoHubba plugin (Chin et al., 2014) of Cytoscape software.
Gene Set Enrichment Analysis for the Hub Genes
Gene Set Enrichment Analysis (GSEA) method determines whether the pathways were randomly distributed at the top or bottom of the detected genes. We used the GSE118553 dataset as background gene sets to perform GSEA for each hub gene. Pathways were considered statistically significant with levels of adjusted p-value < 0.05. The “clusterProfiler” package (Yu et al., 2012) was used to conduct the GSEA.
Correlation Analysis of Hub Genes With Clinical Features
The clinical information in the GSE1297 dataset included the stage of the disease, NFT value, Braak stage, Mini-Mental State Examination (MMSE) score, sex, and age. The associations of hub genes with clinical features were analyzed using Student’s t-test, ANOVA test, or Pearson’s correlation analysis in R-Studio software.
Results
Identification Hub Genes Associated With Alzheimer’s Disease Using Weighted Gene Co-expression Network Analysis
After data preprocessing, 9,797 normalized genes profiled from the GSE118553 dataset with 401 samples (including AD, asymptomatic AD, and controls) were incorporated into the WGCNA method. The soft-thresholding power was set as 10 with the scale free index R2 as 0.85 (Figure 2A). Next, the modules were constructed using a dynamic tree-cut algorithm, and 12 modules were established (Figure 2B). Then, by integrating the clinical features with the modules, the relationship of clinical features with modules was presented, and the green module was mostly associated with the status of AD (Figures 2C,D). Thus, the genes in this module were selected, and the status-related genes were screened based on the selection criteria (selected criteria were set as the module membership >0.8 and the gene significance >0.2). Finally, we obtained 101 status-related genes that significantly associated with AD. Therefore, these status-related genes were used in the subsequent analyses.

Figure 2. Weighted gene co-expression network analysis (WGCNA) for the GSE118553 dataset. (A) The soft-thresholding powers and the scale-free fit index. (B) Dynamic dendrogram of all genes clustered based on a dissimilarity measure. (C) Heatmap of the correlation between module eigengenes and clinical features of Alzheimer’s disease (AD). (D) Distribution of gene significance in the modules associated with status of AD.
Functional Enrichment Analysis for Trait-Related Genes
The GO analysis revealed that the 101 AD status-related genes were mainly involved in the BP of axonogenesis, modulation of chemical synaptic transmission, and regulation of trans-synaptic signaling. The CC component enriched for axon, presynapse, and synaptic membrane genes, and the MF revealed structural constituents of the cytoskeleton, cation-transporting ATPase activity, and active ion transmembrane transporter activity genes. The KEGG pathway analysis revealed that these genes mainly involved the dopaminergic synapse, synaptic vesicle cycle, and GABAergic synapse (Figure 3).
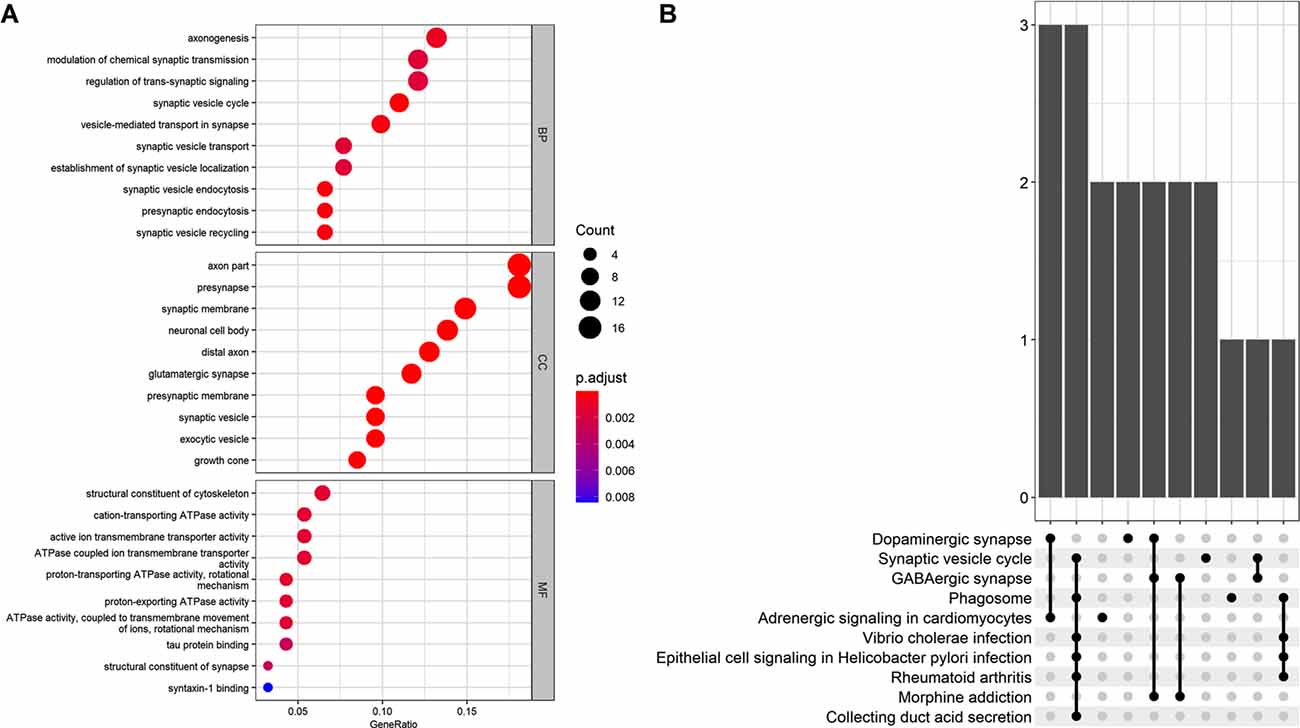
Figure 3. (A) Gene Ontology (GO) analysis for the status-related genes. (B) Kyoto Encyclopedia of Genes and Genomes (KEGG) analysis for the status-related genes.
Selection of Hub Genes From Trait-Related Genes Using Protein-Protein Interaction Network Analysis
The 101 AD status-related genes were used to construct a PPI network based on analysis using the STRING online tool. Then the PPI network was visualized by Cytoscape software, and the hub genes of the network were screened using the cytoHubba plug-in. Ten hub genes were identified, including SNAP25, ENO2, ELAVL4, GAP43, SNAP91, SYP, BSN, NEFM, and NEFL (Figures 4A,B). Among them, six genes (SNAP25, KIF1A, GAP43, BSN, SYP, and NEFL) have been widely investigated in AD in previous studies (Tien et al., 2011; Agostini et al., 2019; Jia et al., 2020; Ren et al., 2020; Wang M. et al., 2020). Therefore, we selected the remaining four hub genes (ENO2, ELAVL4, SNAP91, and NEFM) to analyze their role in AD. The expression of the four genes is shown in Figure 4C.
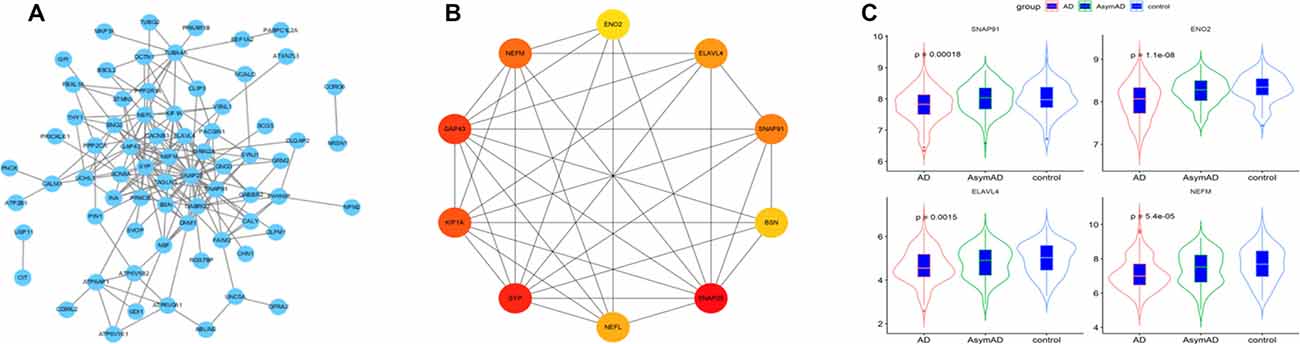
Figure 4. (A) The protein-protein interaction (PPI) network for the status-related genes. (B) Ten hub genes extracted from PPI network by cytoHubba plus-in of Cytoscape. (C) Expression of four hub genes among Alzheimer’s disease (AD), asymptomatic AD, and normal bran tissues.
Analysis of Clinical Significance of Hub Genes in Alzheimer’s Disease Using Another Independent Dataset
The clinical features of the GSE1297 dataset were extracted. To examine the associations of hub genes with the clinical features, we first compared the gene expression of different sexes with status. The results showed that NEFM was differentially expressed in different status of AD; namely, ENO2 and ELAVL4 were differentially expressed in different sexes of AD patients, while the expression of remaining genes showed no significant difference in these clinical features (Figure 5). The correlations between hub genes and clinical phenotype were calculated by Pearson’s correlation analysis. As Table 1 shows, only NEFM was remarkably correlated to the age of AD patients (p < 0.05), while the other genes have no significant correlation with the NFT score, Braak stage, MMSE score, age, and PMI score (p > 0.05).
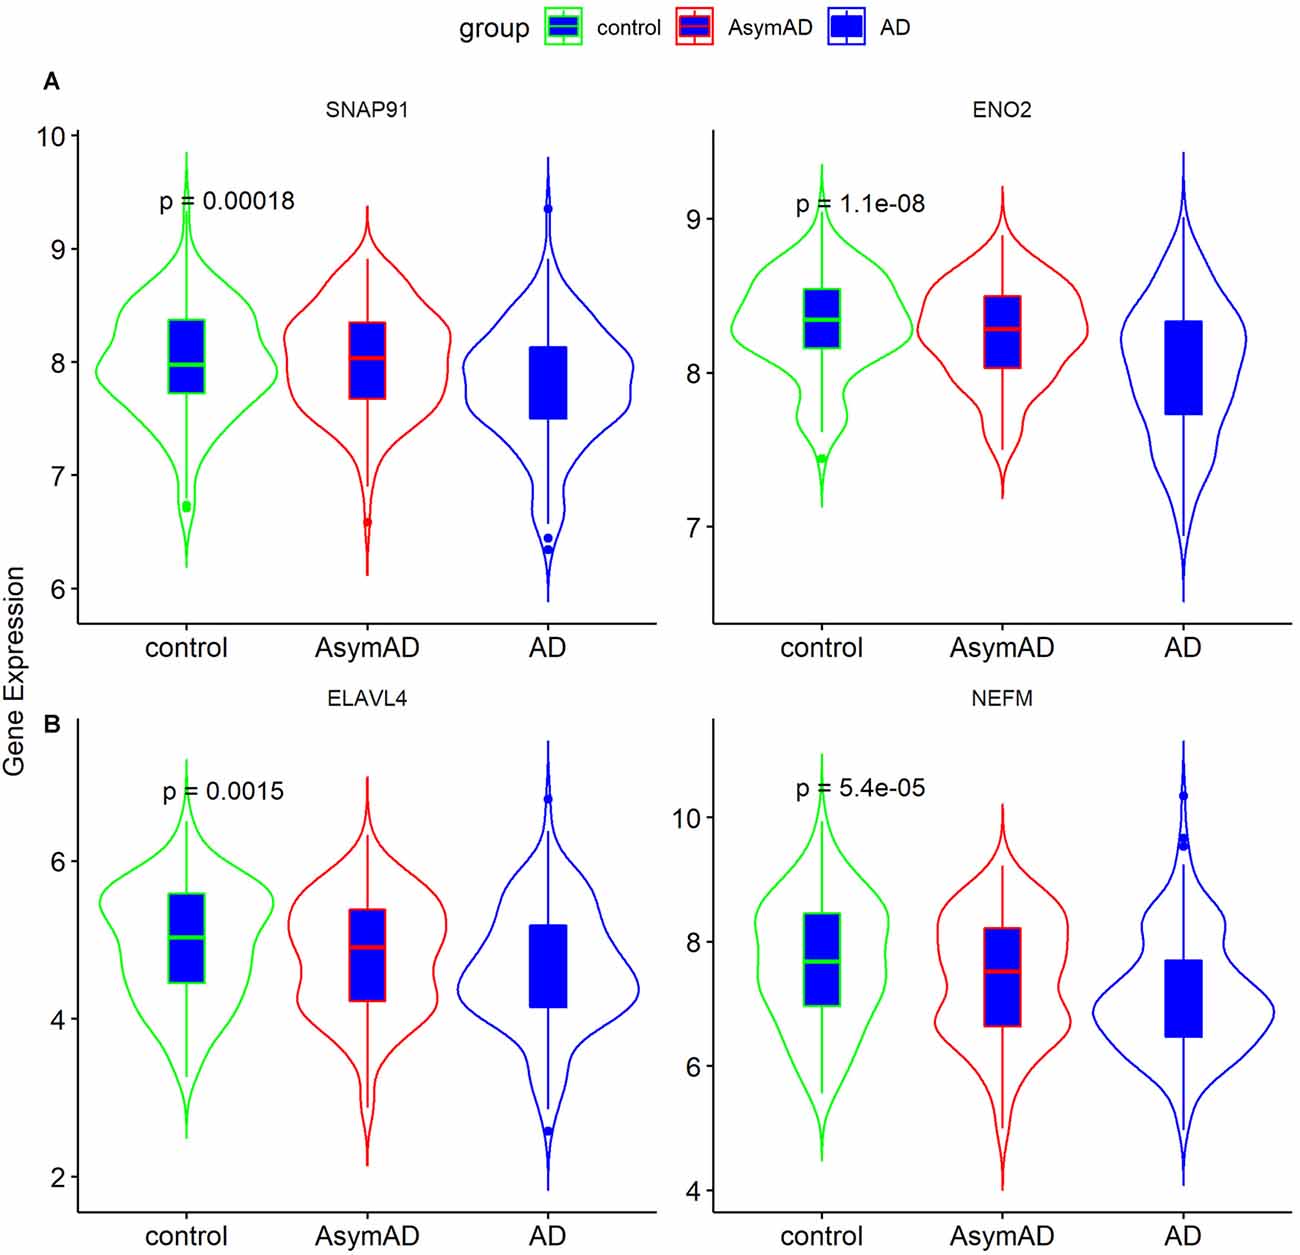
Figure 5. Expression of ENO2, ELAVL4, SNAP91, and NEFM in Alzheimer’s disease (AD) tissues. (A) Gene expression in different status (n = 31; ANOVA test). (B) Gene expression in different gender (n = 31; Student’s t-test). Data was expressed as mean ± SD, with p-value <0.05 as statistical significance.
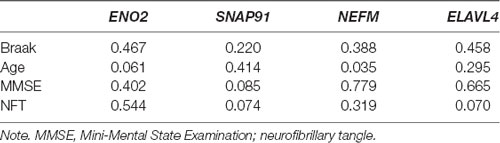
Table 1. Correlations of hub genes with the clinical features (p-value).
Validation of Hub Genes in Alzheimer’s Disease Using Another Independent Dataset
To validate the expression of the four hub genes with AD, we used another microarray dataset (GSE109887), which included 40 AD and 32 normal tissues. The results revealed that the four hub genes in AD tissues were notably down-regulated compared with normal tissues in this validated dataset, demonstrating that these hub genes were all involved in the pathogenesis of AD (Figure 6).
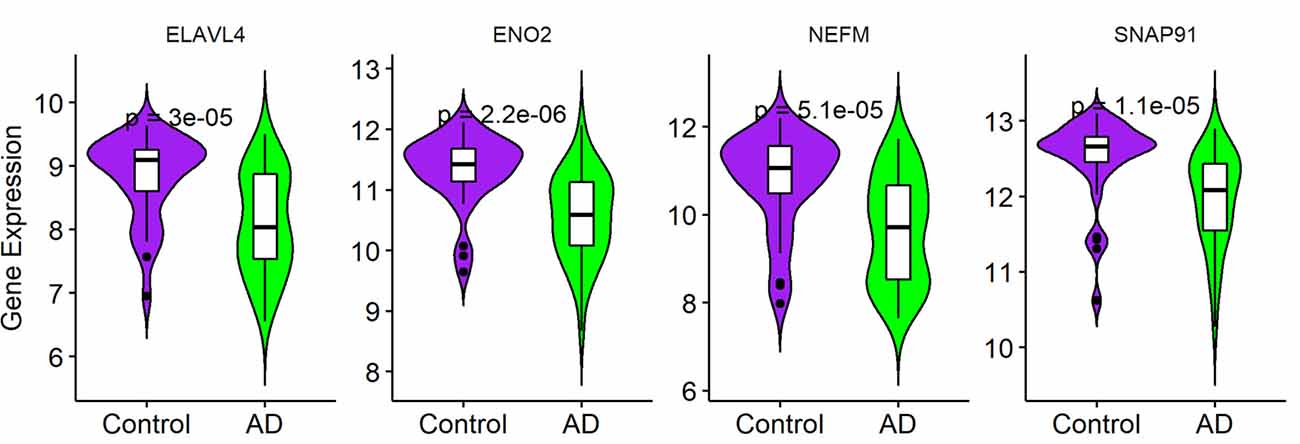
Figure 6. Validation of four hub genes in Alzheimer’s disease (AD) using GSE109887 dataset (n = 72; Student’s t-test). Data are expressed as mean ± SD, with p-value <0.05 as statistical significance.
Gene Set Enrichment Analysis for the Hub Genes
In order to identify the specific pathways that each of the four hub genes were involved in, we conducted the GSEA using the GSE118553 dataset as the background gene set. As Figure 7 illustrates, SNAP91, NEFM, and ELAVL4 were all involved in AD pathways; ENO2 was involved in a cancer pathway and the PI3K–AKT pathway; the latter pathway has also been reported in AD (Wang C. et al., 2020). These results confirmed the significant association of the four genes with AD.
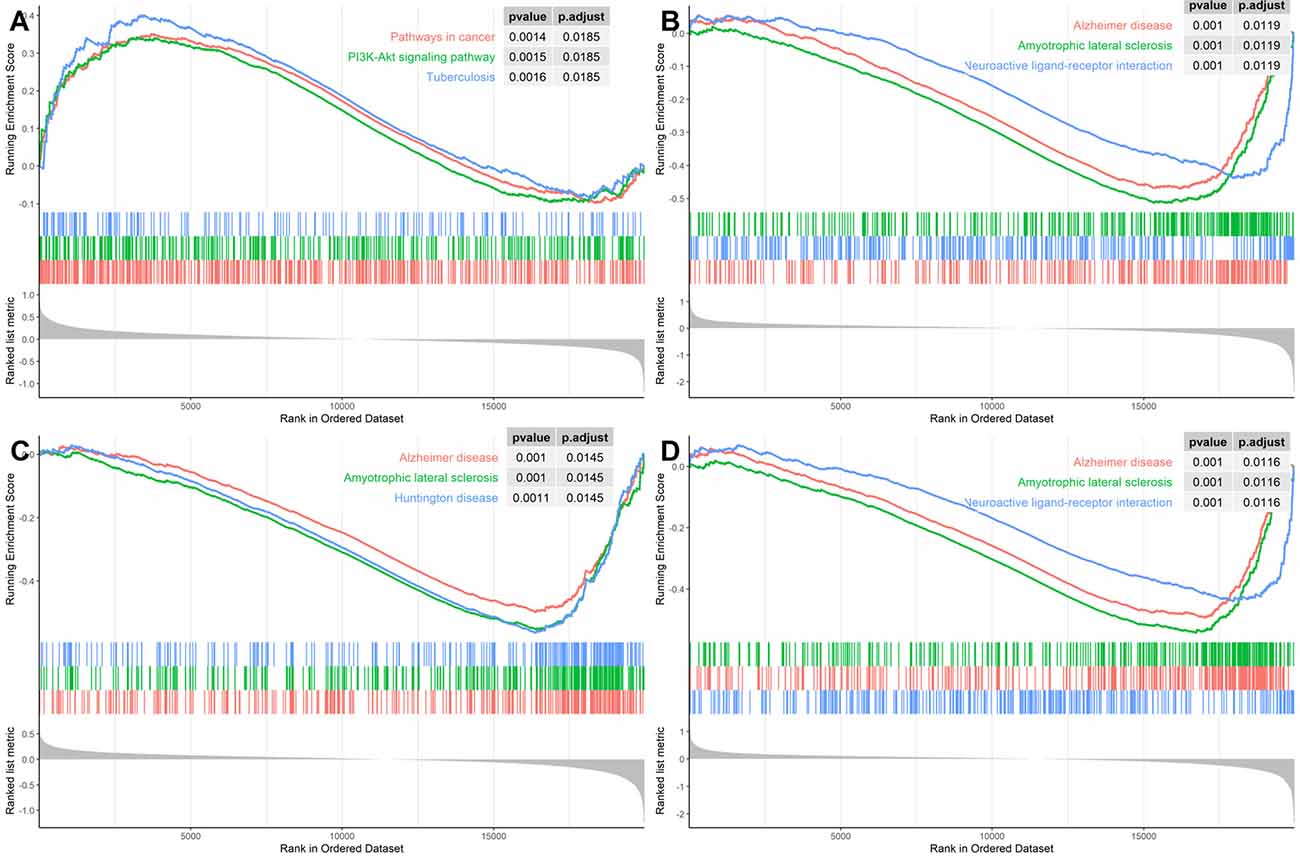
Figure 7. Gene Set Enrichment Analysis (GSEA) for the hub genes using GSE118553 dataset for (A) ENO2, (B) SNAP91, (C) NEFM, and (D) ELAVL4.
Discussion
In the present study, we performed comprehensive analyses on an AD dataset with a larger sample size. We constructed the gene co-expression network underlying AD pathogenesis and identified several gene modules clustered in this co-expression network. We screened the genes that were related to the clinical features and identified 101 genes that were remarkably related to the status of AD. By using Cytoscape and its plug-in, 10 hub genes were identified. We then analyzed four hub genes regarding which there is little knowledge in AD. The pathways of the four hub genes involved were determined, and the results indicated that these genes were all associated with AD pathways. Then, these hub genes were validated using an independent AD cohort, and the clinical feature analyses clarified the associations of these genes with AD.
Previous studies have discovered several pathways related to AD pathogenesis. For example, Wang and Wang (2020) analyzed differentially expressed genes in brain tissues and blood of AD patients compared with corresponding healthy individuals, and they found that MAPK and Wnt signaling pathways were significantly enriched in the hippocampus, temporal gyrus, and frontal gyrus. Sun et al. (2019) revealed that cancer-related and apoptosis pathways were considerably associated with AD pathogenesis. In the present study, we identified that the BPs of 101 AD status-related genes were enriched in synaptic-related signaling pathways, which is in agreement with our knowledge of the etiology of AD that synaptic failure is the pathological basis of cognitive impairment, the cardinal sign of AD (Selkoe, 2002). These results also confirmed the reliability of our study.
Among the four hub genes (ENO2, ELAVL4, SNAP91, and NEFM), although their function has been documented in other diseases, little is known regarding their role in AD. Enolase 2 (ENO2) has been found in mature neurons and is linked to brain iron accumulation-associated neurodegeneration (Takano et al., 2016). Previously, evidence has shown that the ENO2 gene promoter drives high-level transgene expression in differentiated neurons throughout the central nervous system of transgenic zebrafish (Bai et al., 2007). Friedreich’s ataxia (FA) is a neurodegenerative disease, and a recent study showed that ENO2 is a marker of mitochondrial function and/or myelination status in FA patients (McMackin et al., 2019). In addition, expression of ENO2 was reportedly linked to prognosis for several cancers, including colorectal cancer (Pan et al., 2020), lung cancer (Liu et al., 2020), and pancreatic cancer (Zheng et al., 2020). These results demonstrated that ENO2 is involved in several diseases, and its role in AD warrants further exploration.
ELAV-like RNA binding protein 4 (ELAVL4) has been found to interact with other transcripts linked to AD, such as APP and β-site APP-cleaving enzyme 1 (BACE1), and to increase the half-lives of these mRNAs (Kang et al., 2014). Expression of ELAVL4 protein was increased in mutant motor neurons and co-localized with mutant FUS in cytoplasmic speckles with altered biomechanical properties (De Santis et al., 2019). As one of the downstream targets of protein kinase C (PKC), ELAVL4 could modulate the stability and translation of specific target mRNAs involved in synaptic remodeling linked to cognitive processes (Talman et al., 2016). Taken together, ELAVL4 is linked to the pathogenesis of neurodegenerative diseases, including AD, and could possibly be a therapeutic target for AD.
Synaptosome associated protein 91 (SNAP91), also known as AP180, has been shown to be significantly increased in schizophrenia compared with normal controls (Fromer et al., 2016). In an integrated analysis of whole exome sequencing and copy number evaluation in Parkinson’s disease (PD), loss of function and missense changes in SNAP91 were observed in PD patients (Yemni et al., 2019). SNAP91 was also found to promote release site clearance and clathrin-dependent vesicle reformation in mouse cochlear inner hair cells (Kroll et al., 2020).
Neurofilament medium (NEFM) is relevant to the elongation of neuronal structures (Pezzini et al., 2017). In a larger cohort with 367 amyotrophic lateral sclerosis (ALS) patients and 101 controls, plasma NEFM levels were significantly elevated in ALS patients compared with controls (Häggmark et al., 2014). NEFM was also down-regulated in ZF-like aldosterone-producing adenomas and contributed to a D1R/D2R imbalance (Maniero et al., 2017). The above evidence indicates an association of both SNAP91 and NEFM with neurodegenerative diseases; however, their association with AD has not been reported previously, and their roles in AD still require further investigation.
In this study, we analyzed the pathways of four hub genes and the results indicated that these pathways were associated with AD or other neurodegenerative diseases, demonstrating their key roles in these diseases. In the validation analysis, the four hub genes all showed significantly different expression between AD and normal brain tissues, suggesting the robustness of our results. However, in the analysis of hub genes with the clinical features, we found that the associations were varied, indicating the different roles of these genes in the development of AD. We speculate that these results might be due to the small sample size and different brain tissues (middle temporal gyrus) of the GSE1297 dataset compared with the GSE118553 dataset; hence, these results still need to be validated in a larger sample size and using the same brain tissues.
There are several limitations to this study. First, the GSE118553 dataset contains data from two brain region tissues (cerebellum and cortex); although these two tissues are involved in the pathogenesis of AD, the robustness of our results was reduced due to the mixture of data. Second, the tissues of the validated cohort were different from those of the initial analysis; thus, the results need to be validated in another cohort using the same tissues. Third, since this study was a bioinformatics analysis, the roles of ENO2, ELAVL4, SNAP91, and NEFM need to be validated in in vivo and in vitro experiments.
Conclusion
The present study identified the novel association of four genes (ENO2, ELAVL4, SNAP91, and NEFM) with AD pathogenesis by using gene co-expression network analysis based on the clinical and pathological status of disease. The roles the four genes were also identified. These results highlight the molecular mechanism underlying AD and will assist in finding novel therapeutic targets for AD.
Data Availability Statement
The original contributions presented in the study are included in the article, further inquiries can be directed to the corresponding author/s.
Author Contributions
Study concept and design were done by B-lH and R-tH. Collection and assembly of data were performed by QY, Y-xY, and S-dZ. Data analysis and interpretation were carried out by QY, Y-xY, R-gH, and S-dZ. B-lH and H-pL revised the manuscript. All authors contributed to the article and approved the submitted version.
Funding
This study was partially supported by research funding from the National Natural Science Foundation of Guangxi (No. 2018JJA140136).
Conflict of Interest
The authors declare that the research was conducted in the absence of any commercial or financial relationships that could be construed as a potential conflict of interest.
Abbreviations
AD, Alzheimer’s disease; WGCNA, Weighted Gene Co-expression Network Analysis; ENO2, enolase 2; ELAVL4, ELAV-like RNA binding protein 4; SNAP91, synaptosome associated protein 91; NEFM, neurofilament medium.
References
Agostini, S., Mancuso, R., Liuzzo, G., Bolognesi, E., Costa, A. S., Bianchi, A., et al. (2019). Serum miRNAs expression and SNAP-25 genotype in Alzheimer’s disease. Front. Aging Neurosci. 11:52. doi: 10.3389/fnagi.2019.00052
Arvanitakis, Z., Shah, R. C., and Bennett, D. A. (2019). Diagnosis and management of dementia: review. JAMA 322, 1589–1599. doi: 10.1001/jama.2019.4782
Bai, Q., Garver, J. A., Hukriede, N. A., and Burton, E. A. (2007). Generation of a transgenic zebrafish model of Tauopathy using a novel promoter element derived from the zebrafish eno2 gene. Nucleic Acids Res. 35, 6501–6516. doi: 10.1093/nar/gkm608
Blalock, E. M., Geddes, J. W., Chen, K. C., Porter, N. M., Markesbery, W. R., and Landfield, P. W. (2004). Incipient Alzheimer’s disease: microarray correlation analyses reveal major transcriptional and tumor suppressor responses. Proc. Natl. Acad. Sci. U S A 101, 2173–2178. doi: 10.1073/pnas.0308512100
Chin, C.-H., Chen, S.-H., Wu, H.-H., Ho, C.-W., Ko, M.-T., and Lin, C. Y. (2014). cytoHubba: identifying hub objects and sub-networks from complex interactome. BMC Syst. Biol. 8:S11. doi: 10.1186/1752-0509-8-S4-S11
De Santis, R., Alfano, V., de Turris, V., Colantoni, A., Santini, L., Garone, M. G., et al. (2019). Mutant FUS and ELAVL4 (HuD) aberrant crosstalk in amyotrophic lateral sclerosis. Cell Rep. 27, 3818.e5–3831.e5. doi: 10.1016/j.celrep.2019.05.085
Fromer, M., Roussos, P., Sieberts, S. K., Johnson, J. S., Kavanagh, D. H., Perumal, T. M., et al. (2016). Gene expression elucidates functional impact of polygenic risk for schizophrenia. Nat. Neurosci. 19, 1442–1453. doi: 10.1038/nn.4399
Häggmark, A., Mikus, M., Mohsenchian, A., Hong, M. G., Forsstrom, B., Gajewska, B., et al. (2014). Plasma profiling reveals three proteins associated to amyotrophic lateral sclerosis. Ann. Clin. Transl. Neurol. 1, 544–553. doi: 10.1002/acn3.83
Hur, J.-Y., Frost, G. R., Wu, X., Crump, C., Pan, S. J., Wong, E., et al. (2020). The innate immunity protein IFITM3 modulates gamma-secretase in Alzheimer’s disease. Nature 586, 735–740. doi: 10.1038/s41586-020-2681-2
Jia, L., Zhu, M., Kong, C., Pang, Y., Zhang, H., Qiu, Q., et al. (2020). Blood neuro-exosomal synaptic proteins predict Alzheimer’s disease at the asymptomatic stage. Alzheimers Dement. doi: 10.1002/alz.12166 [Epub ahead of print].
Kang, M.-J., Abdelmohsen, K., Hutchison, E. R., Mitchell, S. J., Grammatikakis, I., Guo, R., et al. (2014). HuD regulates coding and noncoding RNA to induce APP→Aβ processing. Cell Rep. 7, 1401–1409. doi: 10.1016/j.celrep.2014.04.050
Kroll, J., Özete, O. D., Jung, S., Maritzen, T., Milosevic, I., Wichmann, C., et al. (2020). AP180 promotes release site clearance and clathrin-dependent vesicle reformation in mouse cochlear inner hair cells. J. Cell Sci. 133:jcs236737. doi: 10.1242/jcs.236737
Lardenoije, R., Roubroeks, J. A. Y., Pishva, E., Leber, M., Wagner, H., Iatrou, A., et al. (2019). Alzheimer’s disease-associated (hydroxy)methylomic changes in the brain and blood. Clin. Epigenetics 11:164. doi: 10.1186/s13148-019-0755-5
Liu, D., Mao, Y., Chen, C., Zhu, F., Lu, W., and Ma, H. (2020). Expression patterns and clinical significances of ENO2 in lung cancer: an analysis based on Oncomine database. Ann. Transl. Med. 8:639. doi: 10.21037/atm-20-3354
Madore, C., Yin, Z., Leibowitz, J., and Butovsky, O. (2020). Microglia, lifestyle stress, and neurodegeneration. Immunity 52, 222–240. doi: 10.1016/j.immuni.2019.12.003
Maniero, C., Garg, S., Zhao, W., Johnson, T. I., Zhou, J., Gurnell, M., et al. (2017). NEFM (neurofilament medium) polypeptide, a marker for zona glomerulosa cells in human adrenal, inhibits D1R (Dopamine D1 receptor)-mediated secretion of aldosterone. Hypertension 70, 357–364. doi: 10.1161/HYPERTENSIONAHA.117.09231
McMackin, M. Z., Durbin-Johnson, B., Napierala, M., Napierala, J. S., Ruiz, L., Napoli, E., et al. (2019). Potential biomarker identification for Friedreich’s ataxia using overlapping gene expression patterns in patient cells and mouse dorsal root ganglion. PLoS One 14:e0223209. doi: 10.1371/journal.pone.0223209
Pan, X., Wu, H., Chen, G., and Li, W. (2020). Prognostic value of enolase gene family in colon cancer. Med. Sci. Monit. 26:e922980. doi: 10.12659/MSM.922980
Pandey, R. S., Graham, L., Uyar, A., Preuss, C., Howell, G. R., and Carter, G. W. (2019). Genetic perturbations of disease risk genes in mice capture transcriptomic signatures of late-onset Alzheimer’s disease. Mol. Neurodegener. 14:50. doi: 10.1186/s13024-019-0351-3
Pao, P.-C., Patnaik, D., Watson, L. A., Gao, F., Pan, L., Wang, J., et al. (2020). HDAC1 modulates OGG1-initiated oxidative DNA damage repair in the aging brain and Alzheimer’s disease. Nat. Commun. 11:2484. doi: 10.1038/s41467-020-16361-y
Patel, H., Hodges, A. K., Curtis, C., Lee, S. H., Troakes, C., Dobson, R. J. B., et al. (2019). Transcriptomic analysis of probable asymptomatic and symptomatic Alzheimer brains. Brain Behav. Immun. 80, 644–656. doi: 10.1016/j.bbi.2019.05.009
Pérez-González, M., Mendioroz, M., Badesso, S., Sucunza, D., Roldan, M., Espelosin, M., et al. (2020). PLA2G4E, a candidate gene for resilience in Alzheimer s disease and a new target for dementia treatment. Prog. Neurobiol. 191:101818. doi: 10.1016/j.pneurobio.2020.101818
Pezzini, F., Bianchi, M., Benfatto, S., Griggio, F., Doccini, S., Carrozzo, R., et al. (2017). The networks of genes encoding palmitoylated proteins in axonal and synaptic compartments are affected in PPT1 overexpressing neuronal-like cells. Front. Mol. Neurosci. 10:266. doi: 10.3389/fnmol.2017.00266
Ren, J.-M., Zhang, S.-L., Wang, X.-L., Guan, Z. Z., and Qi, X.-L. (2020). Expression levels of the α7 nicotinic acetylcholine receptor in the brains of patients with Alzheimer’s disease and their effect on synaptic proteins in SH-SY5Y cells. Mol. Med. Rep. 22, 2063–2075. doi: 10.3892/mmr.2020.11253
Selkoe, D. J. (2002). Alzheimer’s disease is a synaptic failure. Science 298, 789–791. doi: 10.1126/science.1074069
Shi, Y., Liu, H., Yang, C., Xu, K., Cai, Y., Wang, Z., et al. (2020). Transcriptomic analyses for identification and prioritization of genes associated with Alzheimer’s disease in humans. Front. Bioeng. Biotechnol. 8:31. doi: 10.3389/fbioe.2020.00031
Soleimani Zakeri, N. S., Pashazadeh, S., and MotieGhader, H. (2020). Gene biomarker discovery at different stages of Alzheimer using gene co-expression network approach. Sci. Rep. 10:12210. doi: 10.1038/s41598-020-69249-8
Sun, Y., Lin, J., and Zhang, L. (2019). The application of weighted gene co-expression network analysis in identifying key modules and hub genes associated with disease status in Alzheimer’s disease. Ann. Transl. Med. 7:800. doi: 10.21037/atm.2019.12.59
Takano, K., Shiba, N., Wakui, K., Yamaguchi, T., Aida, N., Inaba, Y., et al. (2016). Elevation of neuron specific enolase and brain iron deposition on susceptibility-weighted imaging as diagnostic clues for beta-propeller protein-associated neurodegeneration in early childhood: additional case report and review of the literature. Am. J. Med. Genet. A 170A, 322–328. doi: 10.1002/ajmg.a.37432
Talman, V., Pascale, A., Jantti, M., Amadio, M., and Tuominen, R. K. (2016). Protein kinase C activation as a potential therapeutic strategy in Alzheimer’s disease: is there a role for embryonic lethal abnormal vision-like proteins? Basic Clin. Pharmacol. Toxicol. 119, 149–160. doi: 10.1111/bcpt.12581
Tien, N.-W., Wu, G.-H., Hsu, C.-C., Chang, C.-Y., and Wagner, O.-I. (2011). Tau/PTL-1 associates with kinesin-3 KIF1A/UNC-104 and affects the motor’s motility characteristics in C. elegans neurons. Neurobiol. Dis. 43, 495–506. doi: 10.1016/j.nbd.2011.04.023
Veitch, D. P., Weiner, M. W., Aisen, P. S., Beckett, L. A., Cairns, N. J., Green, R. C., et al. (2019). Understanding disease progression and improving Alzheimer’s disease clinical trials: recent highlights from the Alzheimer’s disease neuroimaging initiative. Alzheimers Dement. 15, 106–152. doi: 10.1016/j.jalz.2018.08.005
Wang, C., Hao, J., Liu, X., Li, C., Yuan, X., Lee, R. J., et al. (2020). Isoforsythiaside attenuates Alzheimer’s disease via regulating mitochondrial function through the PI3K/AKT pathway. Int. J. Mol. Sci. 21:5687. doi: 10.3390/ijms21165687
Wang, M., Wang, S., Li, Y., Cai, G., Cao, M., and Li, L. (2020). Integrated analysis and network pharmacology approaches to explore key genes of Xingnaojing for treatment of Alzheimer’s disease. Brain Behav. 10:e01610. doi: 10.1002/brb3.1610
Wang, Y., and Wang, Z. (2020). Identification of dysregulated genes and pathways of different brain regions in Alzheimer’s disease. Int. J. Neurosci. 130, 1082–1094. doi: 10.1080/00207454.2020.1720677
Yemni, E. A., Monies, D., Alkhairallah, T., Bohlega, S., Abouelhoda, M., Magrashi, A., et al. (2019). Integrated analysis of whole exome sequencing and copy number evaluation in Parkinson’s disease. Sci. Rep. 9:3344. doi: 10.1038/s41598-019-40102-x
Yu, G., Wang, L.-G., Han, Y., and He, Q.-Y. (2012). clusterProfiler: an R package for comparing biological themes among gene clusters. OMICS 16, 284–287. doi: 10.1089/omi.2011.0118
Zhao, W., Langfelder, P., Fuller, T., Dong, J., Li, A., and Hovarth, S. (2010). Weighted gene coexpression network analysis: state of the art. J. Biopharm. Stat. 20, 281–300. doi: 10.1080/10543400903572753
Keywords: Alzeheimer’s disease, gene, expreesion, pathway, miRNA
Citation: Hu R-t, Yu Q, Zhou S-d, Yin Y-x, Hu R-g, Lu H-p and Hu B-l (2020) Co-expression Network Analysis Reveals Novel Genes Underlying Alzheimer’s Disease Pathogenesis. Front. Aging Neurosci. 12:605961. doi: 10.3389/fnagi.2020.605961
Received: 14 September 2020; Accepted: 04 November 2020;
Published: 26 November 2020.
Edited by:
Christian Neri, Institut National de la Santé et de la Recherche Médicale (INSERM), FranceReviewed by:
Paul Roy Heath, The University of Sheffield, United KingdomKristina Endres, Johannes Gutenberg University Mainz, Germany
Copyright © 2020 Hu, Yu, Zhou, Yin, Hu, Lu and Hu. This is an open-access article distributed under the terms of the Creative Commons Attribution License (CC BY). The use, distribution or reproduction in other forums is permitted, provided the original author(s) and the copyright owner(s) are credited and that the original publication in this journal is cited, in accordance with accepted academic practice. No use, distribution or reproduction is permitted which does not comply with these terms.
*Correspondence: Hai-peng Lu, bGhwNjg2QHFxLmNvbQ==; Bang-li Hu, aHViYW5nbGlAZ3htdS5lZHUuY24=
† These authors have contributed equally to this work