 Maria Perticone1*
 Cherubino Di Lorenzo2
 Gennarina Arabia3
 Franco Arturi4
 Benedetto Caroleo5Bruno Tassone4Roberta Pujia4Teresa Vanessa Fiorentino4Carmelina Chiriaco6Giorgio Sesti7
 Aldo Quattrone6
 Francesco Perticone1
- 1Geriatrics Division, Department of Medical and Surgical Sciences, Magna Graecia University, Catanzaro, Italy
- 2Department of Medico-Surgical Sciences and Biotechnologies, La Sapienza University Polo Pontino, Latina, Italy
- 3Neurology Division, Department of Medical and Surgical Sciences, Magna Graecia University, Catanzaro, Italy
- 4Internal Medicine Division, Department of Medical and Surgical Sciences, Magna Graecia University, Catanzaro, Italy
- 5Geriatric Division, Azienda Ospedaliero-Universitaria Mater Domini, Catanzaro, Italy
- 6Institute of Molecular Bioimaging and Physiology, National Research Council, Catanzaro, Italy
- 7Department of Clinical and Molecular Medicine, La Sapienza University, Rome, Italy
Background: Glucose alterations are associated with impaired cognition. The 1-h-post-load plasma glucose ≥155 mg/dl in non-diabetic subjects confers an increased risk of cardiovascular events and diabetes. This pilot study aimed to investigate whether the 1-h-post-load plasma glucose ≥155 mg/dl negatively affects the subcortical regions of the brain and the cognitive functions.
Methods: We enrolled 32 non-diabetic subjects. Patients were divided into two groups based on 1-h- post-load plasma glucose value > or < 155 mg/dl: normal glucose tolerance (NGT) 1-h-high and NGT 1-h-low subjects. All subjects underwent 3 Tesla MRI and standard neuropsychological tests.
Results: NGT 1-h-high subjects showed significantly lower values of both right (4.9 ± 0.9 vs. 5.1 ± 0.9 ml) and left (4.8 ± 1.1 vs. 5.1 ± 1.1 ml) hippocampal hemisphere volume, while right hemisphere hippocampal diffusivity was lower in the NGT 1-h-high group (10.0 ± 0.6 vs. 10.6 ± 0.5 10−4 mm2s−1). NGT 1-h-high subjects also showed a poorer memory performance. In particular, for both Rey Auditory Verbal Learning Task (RAVLT)—immediate-recall and Free and Cued Selective Reminding Test (FCSRT)—delayed total recall, we found lower cognitive test scores in the NGT-1 h-high group (26.5 ± 6.3 and 10.4 ± 0.3, respectively).
Conclusions: One-hour-post-load hyperglycemia is associated with morpho-functional subcortical brain alterations and poor memory performance tests.
Introduction
Alterations of glucose metabolism, in particular impaired glucose tolerance (IGT) and type 2 diabetes mellitus (T2DM), have been associated with an increased incidence of Alzheimer's disease (AD) and vascular dementia (Exalto et al., 2012). Moreover, recently published data demonstrated a negative impact of chronically higher blood glucose levels on cognition, even in the absence of overt T2DM or IGT (Kerti et al., 2013). The association between diabetes and cognitive performance is known from many decades (Miles and Root, 1922), and over time, it has become evident that not only overt diabetes but also prediabetes are associated with cognitive alterations (Miles and Root, 1922; Carmichael et al., 2019). More recently, the Maastricht Study (Geijselaers et al., 2017) demonstrated a strong association between hyperglycemia and cognitive performance in diabetic patients independent of the cardiovascular (CV) context in which T2DM typically develops. Insulin resistance (IR) is a recognized factor in the appearance and progression of T2DM (Goldstein, 2002). Two different types of IR have been traditionally described: (1) a “central” IR, particularly expressed in the liver, and (2) a “peripheral” IR, particularly expressed in the muscles. Recently, the existence of a “cerebral” IR (Mielke et al., 2005) is defined as the failure of brain cells to respond to insulin and responsible for the appearance and progression of many forms of dementia and mild cognitive impairment (MCI) in late middle-aged adults (Willette et al., 2013, 2015). Insulin, insulin receptor, and its substrates are expressed in the whole central nervous system (Heni et al., 2014) where they regulate food intake and body weight, as well as regulate neurotransmitter release and synaptic plasticity (Arnold et al., 2018). A stream of human and experimental studies has provided convincing evidence that insulin may have an important role in many cognitive processes. Evidence indicates that the cognitive impairment commonly seen in many prediabetic/diabetic patients can be mediated by an altered signaling insulin-like growth factor (IGF) 1-insulin (Ye et al., 2002; Talbot et al., 2012). The brain structure that is particularly involved in diabetic-related MCI is the hippocampus (Convit et al., 2003; Biessels et al., 2008; Cherubin et al., 2012; Mortby et al., 2013). In particular, the measurement of mean diffusivity (MD) within the hippocampus represents an estimation of neuronal integrity, since it measures the overall degree of water diffusion in tissue and reflects the breakdown of cytoarchitecture and demyelinating processes. In addition to MD, fractional anisotropy (FA) measures the directional dominance of water diffusion and provides information about the density of nerve fibers (Beaulieu, 2002).
In recent years, we demonstrated that glucose normotolerant subjects who exhibit plasma glucose levels ≥155 mg/dl 1-h after an oral load of 75 g of glucose [normal glucose tolerance (NGT 1-h-high)] have a high prevalence of subclinical target organ damage; in particular, these subjects are characterized by an unfavorable CV risk profile (Succurro et al., 2009, 2010; Fiorentino et al., 2016) and are at an increased risk for future T2DM development (Fiorentino et al., 2015). This setting of subjects exhibits an insulin-resistant status characterized by enhanced insulin production but reduced tissue sensitivity to hormone action, and 1-h-post-load hyperglycemia can be regarded as an early marker of IR (Marcovecchio et al., 2017). Differently from prediabetic subjects, who show impaired fasting glucose (IFG) and/or IGT, NGT 1-h-high subjects have both fasting and 2-h-post-load normal plasma glucose levels.
Anyway, to our knowledge, no data are demonstrating a possible relationship between 1-h-post-load hyperglycemia and the cognitive status and hippocampal volume. Thus, we designed this pilot study to investigate if 1-h-post-load plasma glucose ≥155 mg/d negatively affects subcortical regions of the brain, in particular hippocampal volume and diffusivity and memory tests in a small cohort of glucose normotolerant subjects.
Materials and Methods
For this observational cross-sectional pilot study, 32 consecutive healthy subjects (17 NGT 1-h-high and 15 NGT 1-h-low outpatients) were enrolled and referred to the Catanzaro University Hospital for the evaluation of their CV risk profile. The inclusion criteria contained: age ≥50 years, fasting plasma glucose <100 mg/dl, 2-h-post-load plasma glucose during the oral glucose tolerance test (OGTT) <140 mg/dl at visit 1, and the mini-mental state evaluation (MMSE) score = 30 at visit 1. The exclusion criteria contained: prediabetes (defined as IFG and/or IGT), T2DM, clinically evident dementia or cognitive impairment, previous diagnosis of any disease predisposing to the risk of cognitive impairment and/or the presence of any CV risk factor (i.e., dyslipidemia, hypertension, and obesity), liver cirrhosis, family history of dementia and/or cognitive impairment, history of alcohol or drugs abuse, the use of medications influencing glucose homeostasis or cognitive functions, contraindications to undergo cerebral 3 Tesla MRI, previous transient ischemic attack or stroke, and history of malignancies.
The local ethical committee approved the protocol, and informed written consent was obtained from all participants. All investigations were performed in accordance with the principles of the Declaration of Helsinki.
Laboratory Determinations
All laboratory measurements were performed at visit 1 after a fast of at least 12 h. Plasma glucose was determined by the glucose oxidase method (Glucose Analyzer, Beckman Coulter S.p.A., Milan, Italy). Triglyceride and total low-density lipoprotein (LDL) and total high-density lipoprotein (HDL) cholesterol concentrations were measured by enzymatic methods (Roche Diagnostics GmbH, Mannheim, Germany). Serum insulin was determined in duplicate by a highly specific radioimmunoassay using two monoclonal antibodies; intra-assay CV 2.1% and inter-assay CV 2.9%. Insulin sensitivity was estimated by the Matsuda index/insulin sensitivity index (ISI), calculated as follows:
G0 = fasting plasma glucose concentration
I0 = fasting plasma insulin concentration
GMEAN = mean plasma glucose concentration during the OGTT
IMEAN = mean plasma insulin concentration during the OGTT
IR was estimated by homeostasis model assessment (HOMA-IR) according to the following equation:
HOMA = insulin (μU/ml) × glucose (mmol/L)/22.5 (Matthews et al., 1985).
A 75 g OGTT was performed with 0, 60, and 120 min sampling for plasma glucose and insulin levels measurements.
Neuropsychological Assessment
To evaluate the presence of a cognitive impairment, a neuropsychological assessment for the measurement of cognitive functions was performed by the same expert-trained neuropsychologist (CC) at visit 2 (14 ± 3 days from visit 1), avoiding possible retroactive or proactive interferences. We used the following tests for the Italian population: Rey Auditory Verbal Learning Task (RAVLT)—immediate and delayed recall (Lezak et al., 2012), Rey–Osterrieth Complex Figure Test (ROCFT)—immediate and delayed recall (Lezak et al., 2012), and Free and Cued Selective Reminding Test (FCSRT) (Frasson et al., 2011). ROCFT scores were also used to assess the visuospatial constructional ability (Lezak et al., 2012).
3 Tesla Brain MRI
At visit 2, subjects have been examined using a MRI scanner Discovery MR750 3.0T (GE Healthcare, Chicago, IL, USA) with an eight-channel head coil. All participants underwent the same MRI protocol, including whole-brain 3D T1-weighted spoiled gradient recalled (SPGR) (BRAVO, voxel size of 1 × 1 × 1 mm3), conventional two-dimensional (2D) T2-weighted, and diffusion tensor imaging (DTI). A whole-brain T1-weighted scan was obtained in the sagittal plane (SPGR; echo time/repetition time (TE/TR) = 3.7/9.2 ms; flip angle 12°; voxel size 1 × 1 × 1 mm3); DTI data were constructed from a single-shot, diffusion-weighted spin echo-planar imaging sequence (TR = 8,000 ms, TE = 68.7 ms, field-of-view (FOV) = 21 × 21 cm2, matrix 96 × 64 (zero-padded to 256 × 256), slice thickness = 3.5 mm, 36 contiguous slices, applying parallel imaging with acceleration factor = 2; and acquired voxel size = 2.2 × 3.3 × 3.5 mm3, interpolated voxel size = 0.8 × 0.8 × 3.5 mm3). The maximum b-value was 1,000 s/mm2 in 25 non-collinear directions [number of excitations (NEX) = 1], and one volume was acquired without diffusion weighting (b-value = 0 s/mm2). The hippocampal structure was analyzed using the FSL v.5.0 software package. The hippocampal volume was extracted from the whole hippocampus through a previously published protocol (Cherubini et al., 2009), while the hippocampal microstructure was assessed by MD and FA using a DTI model fitted to each voxel. A full affine transformation between FA maps and brain-extracted whole-brain volumes from T1 was used to register DTI to the T1 image; then, the transformation matrix was applied to the MD maps. The T1 was registered to the FA map with an elastic registration algorithm. The hippocampal MD and FA were measured by computing the average MD and FA in the regions of interest (den Heijer et al., 2012).
Statistical Analysis
Data were expressed as mean ± SD or as percent frequency, and comparisons between the groups were made by the t-test or the χ2-test, as appropriate. Differences were assumed to be significant at two-tailed values of p < 0.05. All analyses were performed using SPSS 20 for Mac.
Results
Clinical, biochemical, and demographic characteristics of the whole study population and of the two groups separately are reported in Table 1. As expected, NGT 1-h-high subjects showed significantly higher 1-h-post-load plasma glucose values and lower IGF levels compared with NGT 1-h-low subjects. We did not find significant differences between the groups with regard to fasting and 2-h-post-load plasma insulin, while 1-h-post-load plasma insulin was significantly higher in the NGT 1-h-high group. Furthermore, we registered significant differences in both the Matsuda index and the HOMA values, with subjects in the NGT 1-h-high group showing an impaired insulin sensitivity compared with the NGT 1-h-low group.
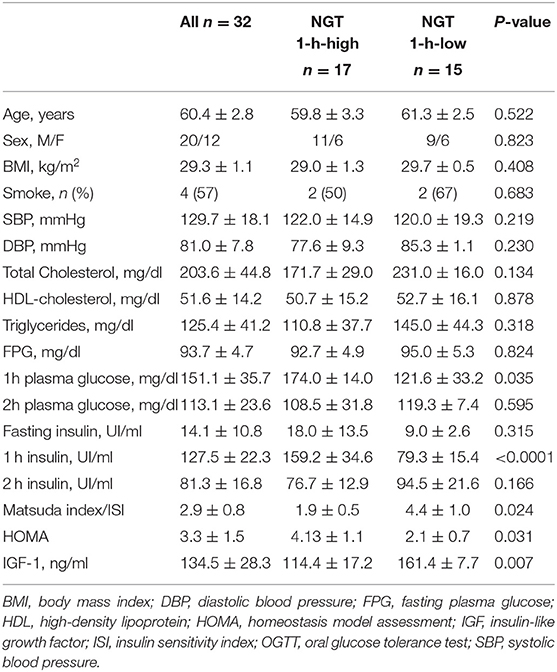
Table 1. Clinical, biochemical, and demographic characteristics of the whole study population and of the two groups separately.
In Table 2, we reported the 3 Tesla MRI parameters referred to as volume, anisotropy, and MD of all subcortical structures of the brain in the whole population and in the two groups separately. In comparison to NGT 1-h-low subjects, the NGT 1-h-high ones showed significantly lower values of left hemisphere cerebellum volume, of both left and right hippocampus volume, and of left hemisphere amygdala volume. On the contrary, in the same group, the MD of both the left and right hippocampus and MD of the left hemisphere caudate nucleus resulted higher with respect to the NGT 1-h-low group.
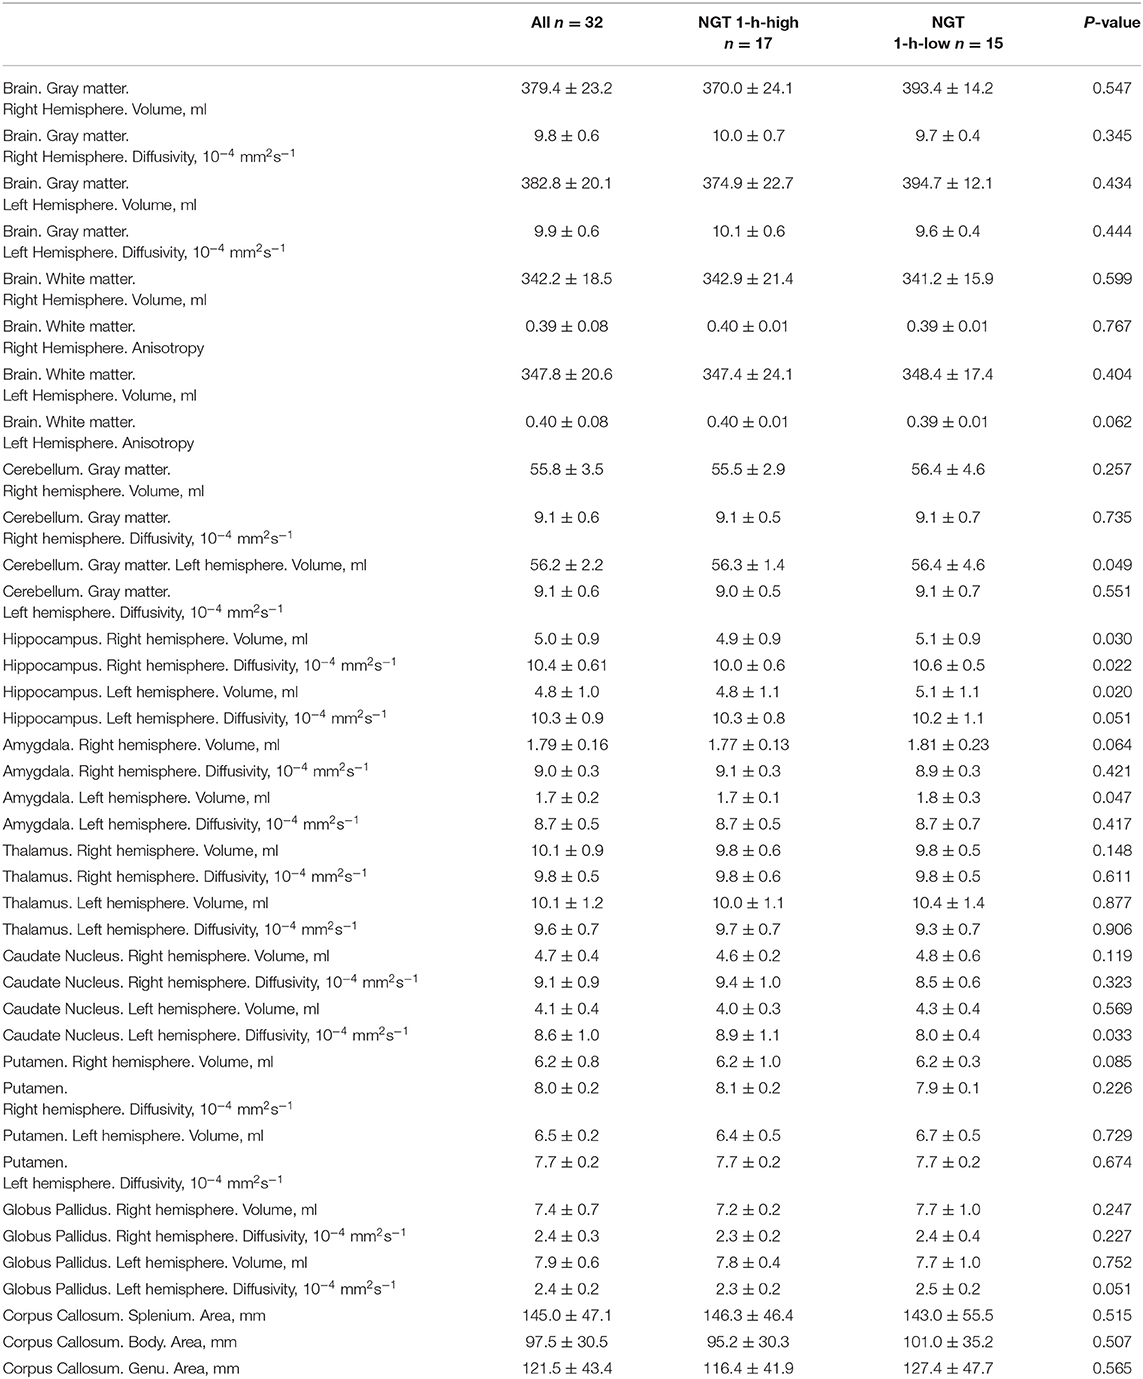
Table 2. 3 Tesla magnetic resonance parameters of the whole population and of the two groups separately.
Results of the memory performance tests are reported in Table 3. No differences between groups were detected with regard to the MMSE. The NGT 1-h-high group, in comparison to normal subjects, showed significantly a poorer performance in the following tests: immediate-recall and delayed-recall RAVLT, FCSRT immediate free recall, FCSRT delayed free recall, FCSRT delayed total recall, and ROCFT. Of note, for both the RAVLT immediate-recall and the FCSRT delayed total recall, we found pathological values in the NGT-1 h-high group.
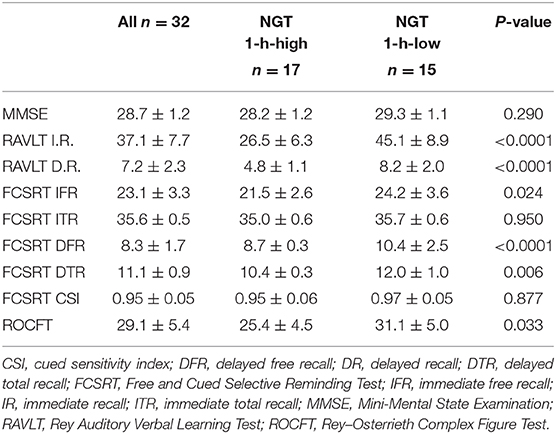
Table 3. Memory performance test results in the whole study population and in the two groups separately.
Discussion
The results of this study, even if very preliminary, demonstrate for the first time that healthy glucose normotolerant subjects with 1-h-post-load plasma glucose ≥155 mg/dl show a poorer memory function and visuoconstructive ability evaluated through ROCFT, together with a lower hippocampal volume and a higher hippocampal MD. In particular, this subset of patients showed a worse performance with regard to both immediate and delayed memory, as confirmed by the results of the neuropsychological tests.
The relationship between glucose homeostasis alterations and cognitive impairment/dementia is known for several decades. One possible explanation of the pathophysiological mechanisms underlying the appearance and progression of MCI in prediabetic/diabetic subjects is the mitochondrial overproduction of superoxide and the consequent activation of several pathways that are able to exert a toxic effect on the brain due to intracellular hyperglycemia. Glucose toxicity on neuronal structures may be exerted through a generation/scavenging imbalance of reactive oxygen species or through the advanced glycation of structural proteins in the brain (Geijselaers et al., 2017). Anyway, the hypothesis of a direct effect of hyperglycemia on the cognitive function of diabetic patients is quite controversial, since some evidence demonstrated that hyperglycemia per se is only weakly associated with cognitive performance (Brownlee, 2001). Furthermore, the study by Kerti et al. (2013) demonstrated a significant association between both long-term (HbA1c) and short-term (fasting plasma glucose) markers of hyperglycemia and worse cognitive performance and lower hippocampal volume in healthy subjects. Similar results have been obtained in the present study, in which 1-h-post-load hyperglycemia was associated with a lower hippocampal volume and a higher MD. These findings are in line with previously published results obtained in patients with T2DM (Biessels et al., 2008; Geijselaers et al., 2015), in patients with IGT (Convit et al., 2003), in patients with IFG (Cherubin et al., 2012), or in healthy subjects (Willette et al., 2013). A possible explanation could be found in the increased inflammatory response subsequent to hyperglycemia and the activation of the coagulation cascade, leading to subclinical strokes and, in turn, volume loss (Yaffe et al., 2004; Kale et al., 2006). Moreover, direct glucose toxicity may impair the integrity of the neuronal membrane, leading to an increase in extracellular water content and, as a consequence, an increased MD of the cerebral structures (Pocai et al., 2005).
Another important finding emerged in the present study is that NGT 1-h-high subjects showed higher values of HOMA, an indirect measure of IR. This condition is a well-recognized pathophysiological mechanism underlying the appearance and progression of T2DM and all glucose metabolism alterations; in the last decades, cerebral IR has been considered one of the central features of several forms of dementia, even in the absence of diabetes (Willette et al., 2013, 2015). Insulin receptors are expressed in several brain structures, especially the hypothalamus and the hippocampus. In particular, insulin action on the hypothalamus exerts a regulatory effect on metabolic pathways in the liver (Pocai et al., 2005) and in the adipose tissue (Scherer et al., 2011), while an altered hormone action at the hippocampal level may be responsible for cognitive alterations (Zhang et al., 2015).
In conclusion, the results of this pilot study, if confirmed in a wider population, could expand present information about the comprehension of the complex pathophysiological mechanisms underlying the appearance of cognitive disorders in subjects with very early glucose metabolism alterations. Furthermore, a piece of deeper knowledge about the possible implications of 1-h-post-load hyperglycemia could lead to the definition of this alteration as a “pre-prediabetic” status.
The present study has several limitations. First, this is a pilot study, in which the small sample size and the study design do not allow researchers to reach a definitive conclusion about the pathophysiological mechanisms underlying the appearance of MCI in this setting of subjects. Further studies with a larger sample size and a longitudinal observation are needed to confirm our hypothesis. Furthermore, we only tested the memory domain with standard neuropsychological tests, but we do not have information about the other domains that need to be tested in a wider population. Finally, the control group consists of “very healthy” subjects, probably not so representative of the general population.
Data Availability Statement
The raw data supporting the conclusions of this article will be made available by the authors, without undue reservation.
Ethics Statement
The studies involving human participants were reviewed and approved by Comitato Etico Calabria Centro. The patients/participants provided their written informed consent to participate in this study.
Author Contributions
MP, GA, and FA: conceptualization. CDL: methodology. CC: software. GS, AQ, and FP: validation. MP: formal analysis. BC, TF, BT, and RP: investigation. MP and CDL: writing—original draft preparation. GA and FA: writing—review and editing. MP and FP: supervision. All authors have read and agreed to the published version of the manuscript.
Conflict of Interest
The authors declare that the research was conducted in the absence of any commercial or financial relationships that could be construed as a potential conflict of interest.
Acknowledgments
We thank Dr. Alba Nardone for her great technical support. We thank the Italian Society of Internal Medicine (SIMI) for the best research prize Alberto Malliani attributed to this study during the 119° National Congress.
References
Arnold, S. E., Arvanitakis, Z., Macauley-Rambach, S. L., Koenig, A. M., Wang, H. Y., Ahima, R. S., et al. (2018). Brain insulin resistance in type 2 diabetes and Alzheimer disease: concepts and conundrums. Nat. Rev. Neurol. 14, 168–181. doi: 10.1038/nrneurol.2017.185
Beaulieu, C. (2002). The basis of anisotropic water diffusion in the nervous system: a technical review. NMR Biomed. 15, 435–455. doi: 10.1002/nbm.782
Biessels, G. J., Deary, I. J., and Ryan, C. M. (2008). Cognition and diabetes: a lifespan perspective. Lancet Neurol. 7, 184–190. doi: 10.1016/S1474-4422(08)70021-8
Brownlee, M. (2001). Biochemistry and molecular cell biology of diabetic complications. Nature 414:813–820. doi: 10.1038/414813a
Carmichael, O., Stuchlik, P., Pillai, S., Biessels, G. J., Dhullipudi, R., Madden-Rusnak, A., et al. (2019). High-normal adolescent fasting plasma glucose is associated with poorer midlife brain health: Bogalusa hearth study. J. Clin. Endocrinol. Metab. 104, 4492–4500. doi: 10.1210/jc.2018-02750
Cherubin, N., Sachdev, P., and Anstey, K. J. (2012). Higher normal fasting plasma glucose is associated with hippocampal atrophy: the PATH Study. Neurology 79, 1019–1026. doi: 10.1212/WNL.0b013e31826846de
Cherubini, A., Peran, P., Caltagirone, C., Sabatini, U., and Spalletta, G. (2009). Aging of subcortical nuclei: microstructural, mineralization and atrophy modifications measured in vivo using MRI. Neuroimage 48, 29–36. doi: 10.1016/j.neuroimage.2009.06.035
Convit, A., Wolf, O. T., Tarshish, C., and de Leon, M. J. (2003). Reduced glucose tolerance is associated with poor memory performance and hippocampal atrophy among normal elderly. Proc. Natl. Acad. Sci. U.S.A. 100, 2019–2022. doi: 10.173/pnas0336073100
den Heijer, T., van der Lijn, F., Vernooij, M. W., de Groot, M., Koudstaal, P. J., van der Lugt, A., et al. (2012). Structural and diffusion MRI measures of the hippocampus and memory performance. Neuroimage 63, 1782–1789. doi: 10.1016/j.neuroimage.2012.08.067
Exalto, L. G., Whitmer, R. A., Kappele, L. J., and Biessels, G. J. (2012). An update on type 2 diabetes, vascular dementia and Alzheimer's disease. Exp. Gerontol. 47, 858–868. doi: 10.1016/j.exger.2012.07.014
Fiorentino, T. V., Marini, M. A., Andreozzi, F., Arturi, F., Succurro, E., Perticone, M., et al. (2015). One-hour postload hyperglycemia is a stronger predictor of type 2 diabetes than impaired fasting glucose. J. Clin. Endocrinol. Metab. 100, 3744–3751. doi: 10.1210/jc.2015-2573
Fiorentino, T. V., Sesti, F., Andreozzi, F., Pedace, E., Sciacqua, A., Hribal, M. L., et al. (2016). One-hour post-load hyperglycemia combined with HbA1c identifies pre-diabetic individuals with a higher cardio-metabolic risk burden. Atherosclerosis 253, 61–69. doi: 10.1016/j.atherosclerosis.2016.08.020
Frasson, P., Ghiretti, R., Catricalà, E., Pomati, S., Marcone, A., Parisi, L., et al. (2011). Free and Cued Selective Reminding Test: an Italian normative study. Neurol. Sci. 32, 1057–1062. doi: 10.1007/s10072-011-0607-3
Geijselaers, S. L., Sep, S. J., Stehouwer, C. D., and Biessels, G. J. (2015). Glucose regulation, cognition, and brain MRI in type 2 diabetes: a systematic review. Lancet Diabetes Endocrinol 3, 75–89. doi: 10.1016/S2213-8587(14)70148-2
Geijselaers, S. L. C., Sep, S. J. S., Claessens, D., Schram, M. T., van Boxtel, M. P. J., Henry, M. R. A., et al. (2017). The role of hyperglycemia, insulin resistance, and blood pressure in diabetes-associated differences in cognitive performance – the Maastricht Study. Diabetes Care 40, 1537–1547. doi: 10.2337/dc17-0330
Goldstein, B. J. (2002). Insulin resistance as the core defect in type 2 diabetes mellitus. Am. J. Cardiol. 90, 3G−10G. doi: 10.1016/s0002-9149(02)02553-5
Heni, M., Scöpfer, P., Peter, A., Sartorius, T., Fritsche, A., Synofzik, M., et al. (2014). Evidence for altered transport of insulin across the blood-brain barrier in insulin-resistant humans. Acta Diabetol. 51, 679–681. doi: 10.1007/s00592-013-0546-y
Kale, R. A., Gupta, R. K., Saraswat, V. A., Hasan, K. M., Trivedi, R., Mishra, A. M., et al. (2006). Demonstration of interstitial cerebral edema with diffusion tensor MR imaging in type C hepatic encephalopathy. Hepatology 43, 698–706. doi: 10.1002/hep.21114
Kerti, L., Witte, A. V., Vinkler, A., Grittner, U., Rujescu, D., and Flöel, A. (2013). Higher glucose levels are associated with lower memory and reduced hippocampal microstructure. Neurology 81, 1746–1752. doi: 10.1212/01.wnl.0000435561.00234.ee
Lezak, M. D., Howieson, D. B., Bigler, E. D., and Tranel, D. (2012). Neuropsychological Assessment, 5th Edn. New York, NY: Oxford University Press.
Marcovecchio, M. L., Bagordo, M., Marisi, E., de Giorgis, T., Chiavaroli, V., Chiarelli, F., et al. (2017). One-hour post-load plasma glucose levels associated with decreased insulin sensitivity and secretion and early markers of cardiometabolic risk. J. Endocrinol. Invest. 40, 771–778. doi: 10.1007/s40618-017-0638-6
Matsuda, M., and DeFronzo, R. A. (1999). Insulin sensitivity indices obtained from oral glucose tolerance testing: comparison with the euglycemic insulin clamp. Diabetes Care 22, 1462–1470. doi: 10.2337/diacare.22.9.1462
Matthews, D. R., Hosker, J. P., Rudenski, A. S., Naylor, B. A., Treacher, D. F., and Turner, R. C. (1985). Homeostasis model assessment: insulin resistance and beta-cell function from fasting plasma glucose and insulin concentrations in man. Diabetologia 28, 412–419. doi: 10.1007/BF00280883
Mielke, J. G., Taghibiglou, C., Liu, L., Zhang, Y., Jia, Z., Adeli, K., et al. (2005). A biochemical and functional characterization of diet-induced brain insulin resistance. J. Neurochem. 93, 1568–1578. doi: 10.1111/j.1471-4159.2005.03155.x
Miles, W. E., and Root, H. F. (1922). Psychological test applied to diabetic patients. Arch. Intern. Med. 30, 767–777
Mortby, M. E., Janke, A. L., Anstey, K. J., Sachdev, P. S., and Cherubin, N. (2013). High “normal” blood glucose is associated with decreased brain volume and cognitive performance in the 60s: the PATH through life study. PLoS ONE 8:e73697. doi: 10.1371/journal.pone.0073697
Pocai, A., Lam, T. K. T., Gutierrez-Juarez, R., Obici, S., Schwartz, G. J., Bryan, J., et al. (2005). Hypothalamic K(ATP) channels control hepatic glucose production. Nature 434, 1026–1031. doi: 10.1038/nature03439
Scherer, T., O'Hare, J., Diggs-Andrews, K., Schweiger, M., Cheng, B., Lindtner, C., et al. (2011). Brain insulin controls adipose tissue lipolysis and lipogenesis. Cell Metab. 13, 183–194. doi: 10.1016/j.cmet.2011.01.008
Succurro, E., Arturi, F., Lugarà, M., Grembiale, A., Fiorentino, T. V., Caruso, V., et al. (2010). One-hour postload plasma glucose levels are associated with kidney dysfunction. Clin. J. Am. Soc. Nephrol. 5, 1922–1927. doi: 10.2215/CJN.03240410
Succurro, E., Marini, M. A., Arturi, F., Grembiale, A., Lugarà, M., Andreozzi, F., et al. (2009). Elevated one-hour post-load plasma glucose levels identifies subjects with normal glucose tolerance but early carotid atherosclerosis. Atherosclerosis 207, 245–249. doi: 10.1016/j.atherosclerosis.2009.04.006
Talbot, K., Wang, H. Y., Kazi, H., Han, L. Y., Bakshi, K. P., Stucky, A., et al. (2012). Demonstrated brain insulin resistance in Alzheimer's disease patients is associated with IGF-1 resistance, IRS-1 dysregulation, and cognitive decline. J. Clin. Invest. 122, 1316–1338. doi: 10.1172/JCI59903
Willette, A. A., Bendlin, B. B., Starks, E. J., Birdsill, A. C., Johnson, S. C., Christian, B. T., et al. (2015). Association of insulin resistance with cerebral glucose uptake in late middle-aged adults at risk for Alzheimer disease. JAMA Neurol. 72, 1013–1020. doi: 10.1001/jamaneurol.2015.0613
Willette, A. A., Xu, G., Johnson, S. C., Birdsill, A. C., Jonaitis, E. M., Sager, M. A., et al. (2013). Insulin resistance, brain atrophy, and cognitive performance in late middle-aged adults. Diabetes Care 36, 443–449. doi: 10.2337/dc12-0922
Yaffe, K., Kanaya, A., Lindquist, K., Simonsick, E. M., Harris, T., Shorr, R. I., et al. (2004). The metabolic syndrome, inflammation, and risk of cognitive decline. JAMA 292, 2237–2242. doi: 10.1001/jama.292.18.2237
Ye, P., Li, L., Lund, P. K., and D'Ercole, A. J. (2002). Deficient expression of insulin receptor substrate-1 (IRS-1) fails to block insulin-like growth factor-1 (IGF-1) stimulation of brain growth and myelination. Brain Res. Dev. Brain Res. 136, 111–121. doi: 10.1016/s0165-3806(02)00355-3
Keywords: prediabetes, mild cognitive impairment, hippocampal volume, MRI, memory test
Citation: Perticone M, Di Lorenzo C, Arabia G, Arturi F, Caroleo B, Tassone B, Pujia R, Fiorentino TV, Chiriaco C, Sesti G, Quattrone A and Perticone F (2021) One Hour-Post-load Plasma Glucose ≥155 mg/dl in Healthy Glucose Normotolerant Subjects Is Associated With Subcortical Brain MRI Alterations and Impaired Cognition: A Pilot Study. Front. Aging Neurosci. 13:608736. doi: 10.3389/fnagi.2021.608736
Received: 21 September 2020; Accepted: 07 January 2021;
Published: 04 February 2021.
Edited by:
David Baglietto-Vargas, University of Malaga, SpainReviewed by:
Francesca Trojsi, University of Campania Luigi Vanvitelli, ItalyOwen T. Carmichael, Pennington Biomedical Research Center, United States
Copyright © 2021 Perticone, Di Lorenzo, Arabia, Arturi, Caroleo, Tassone, Pujia, Fiorentino, Chiriaco, Sesti, Quattrone and Perticone. This is an open-access article distributed under the terms of the Creative Commons Attribution License (CC BY). The use, distribution or reproduction in other forums is permitted, provided the original author(s) and the copyright owner(s) are credited and that the original publication in this journal is cited, in accordance with accepted academic practice. No use, distribution or reproduction is permitted which does not comply with these terms.
*Correspondence: Maria Perticone, bWFyaWFwZXJ0aWNvbmVAdW5pY3ouaXQ=