 Jing Li
 Qihao Zhang
 Yena Che
 Nan Zhang4
 Lingfei Guo
- 1Department of Radiology, Beijing Friendship Hospital, Capital Medical University, Beijing, China
- 2Department of Radiology, Weill Cornell Medical College, Cornell University, New York City, NY, United States
- 3Department of Clinical Laboratory, Shandong Provincial Hospital Affiliated to Shandong First Medical University, Jinan, Shandong, China
- 4Department of Radiology, Shandong Provincial Hospital Affiliated to Shandong First Medical University, Jinan, Shandong, China
Purpose: The objective of this study was to determine which factors influence brain iron concentrations in deep gray matter in elderly individuals and how these factors influence regional brain iron concentrations.
Methods: A total of 105 elderly individuals were enrolled in this study. All participants underwent detailed magnetic resonance imaging (MRI) examinations from October 2018 to August 2019. Among them, 44 individuals had undergone a previous MRI examination from July 2010 to August 2011. Quantitative susceptibility mapping (QSM) was utilized as an indirect quantitative marker of brain iron, and the susceptibility values of deep gray matter structures were obtained. Univariate analysis and multiple linear regression analysis were used to investigate 11 possible determinants for cerebral iron deposition.
Results: Our results showed no sex- or hemisphere-related differences in susceptibility values in any of the regions studied. Aging was significantly correlated with increased insusceptibility values in almost all analyzed brain regions (except for the thalamus) when we compared the susceptibility values at the two time points. In a cross-sectional analysis, the relationship between gray matter nucleus susceptibility values and age was conducted using Pearson’s linear regression. Aging was significantly correlated with the susceptibility values of the globus pallidus (GP), putamen (Put), and caudate nucleus (CN), with the Put having the strongest correlations. In multiple linear regression models, associations with increased susceptibility values were found in the CN, Put, red nucleus, and dentate nucleus for individuals with a history of type 2 diabetes mellitus (T2DM). However, the patients with hypertension showed significantly reduced susceptibility values in the red nucleus and dentate nucleus. Our data suggested that smokers had increased susceptibility values in the thalamus. No significant associations were found for individuals with a history of hypercholesterolemia and Apolipoprotein E4 carrier status.
Conclusion: Our data revealed that aging, T2DM, and smoking could increase iron deposition in some deep gray matter structures. However, hypertension had the opposite effects in the red nuclei and dentate nuclei. Brain iron metabolism could be influenced by many factors in different modes. In future studies, we should strictly control for confounding factors.
Introduction
Iron is the most abundant trace element in the human body. Iron in the nervous system is also involved in many fundamental biological processes, including oxygen transportation, DNA synthesis, catecholamine neurotransmitters, and myelin formation. Iron homeostasis is needed to maintain normal physiological brain function, whereas dysregulation of iron homeostasis can cause neurotoxicity through different mechanisms (Ward et al., 2014). Abnormal increases in iron content have been reported to be associated with many neural diseases, such as Parkinson’s disease, Alzheimer’s disease (AD), and Huntington’s disease (Wu et al., 2012), but restless leg syndrome is characterized by reduced iron concentrations in the substantia nigra (SN) (Rizzo and Plazzi, 2018). In Parkinson’s disease, an increase in iron concentration is noted in the SN (Faucheux et al., 2003); however, pantothenate kinase-associated neurodegeneration is characterized by an excess of iron mainly in the globus pallidus (GP), leading to a typical MRI pattern called the eye of the tiger (Kruer et al., 2011). These facts illustrate that brain iron patterns are characteristic of disease or disease stages; therefore, investigating the physiological distribution of iron in the normal brain is very important to better understand the disease-related changes that involve iron deposition.
In addition to aging, many studies have revealed that total iron concentrations increase with age in the SN, putamen (Put), GP, caudate nucleus (CN), and cortex (Xu et al., 2008; Ramos et al., 2014), but few studies have focused specifically on elderly individuals. Age-related accumulation of iron might be an important factor that contributes to neurodegenerative processes. Because many neurodegenerative disorders involve elderly people, we selected elderly individuals in the community as our target population in this study. We expect our results to present some constructive suggestions for future studies to better investigate the complex pathophysiological processes underlying neurological disorders. Previous MRI studies that focused on differences in brain iron levels between sexes reported inconsistent findings. Whereas one study reported lower iron levels in the thalamus (Thal) and red nucleus (RN) in females than in males (Gong et al., 2015), another study did not observe any difference (Xu et al., 2008). The other objective of the present study was to detect the effects of sex on regional brain iron concentrations. Many elderly people have histories of hypertension, diabetes mellitus (DM), or hypercholesterolemia. Cerebral microbleeds (CMBs), white matter hyperintensities (WMHs), and cerebral microinfarcts are also common brain MRI findings of elderly people (Valdés Hernández et al., 2016; van Veluw et al., 2017; Haller et al., 2018). Furthermore, we estimated the influence of these factors on brain iron levels in this study.
The emergence of the quantitative susceptibility mapping (QSM) technique over the past decade (Wang and Liu, 2015) has enabled accurate and reproducible in vivo measurements of local brain iron levels under both normal and pathological conditions (Acosta-Cabronero et al., 2016; Wang et al., 2017). Many neurodegenerative disorders with brain iron accumulation are usually associated with excess iron accumulation in deep gray matter (DGM) (Schipper, 2012), and DGM plays a crucial role in regulating movements and in various types of learning (Seger, 2008). In addition, DGM has the highest iron content (Peterson et al., 2019), and susceptibility values calculated from QSM have been reported to have a strong correlation with iron concentration in the human brain, especially in DGM (Hinoda et al., 2015). Accordingly, the objective of this study was to utilize QSM as a quantitative marker of brain iron to detect possible factors influencing the iron levels of the DGM [Thal, CN, Put, GP, SN, RN, and dentate nucleus (DN)] to accurately map iron in elderly individuals in the community, which might help us to better control confounding factors in future research.
Materials and Methods
Participants
The volunteers of this study were recruited from the community. The participants signed an informed consent form approved by the Institutional Review Board of Shandong Medical Imaging Research Institute Affiliated to Shandong University (ID: 2018-002). Subjects were excluded if they had a history of neurological disease or neurological ailment, including immune, metabolic, toxic, and infectious diseases or head trauma. If the subjects had other diseases, such as malignant tumors, renal insufficiency, alcoholism, or autoimmune disease, they were excluded. All MR images were evaluated by an experienced neuroradiologist for signs of space-occupying lesions and cerebrovascular diseases. Subjects with evidence of infarct (except for lacunar infarcts) or cerebral hemorrhages (except for CMBs) were excluded from further analysis.
The final sample consisted of 105 participants (57 females and 48 males) with a mean age of 65.26 ± 6.33 years (range 50–80) and a mean education level of 11.39 ± 2.57 years (range 6–16). The history of diabetes, hypertension, hypercholesterolemia, and smoking status was taken from the participants’ self-reported medical history. Individuals with a history of type 2 DM (T2DM) or hypertension were referred to as diagnosed with T2DM or hypertensive individuals who were taking hypoglycemic drugs or antihypertensive drugs when an MRI scan was conducted. In our study, 59 (56.19%) participants had hypertension, 23 (21.90%) participants had T2DM, 32 (30.48%) participants had hyperlipidemia, and 26 (24.76%) participants smoked (details are shown in Table 1).
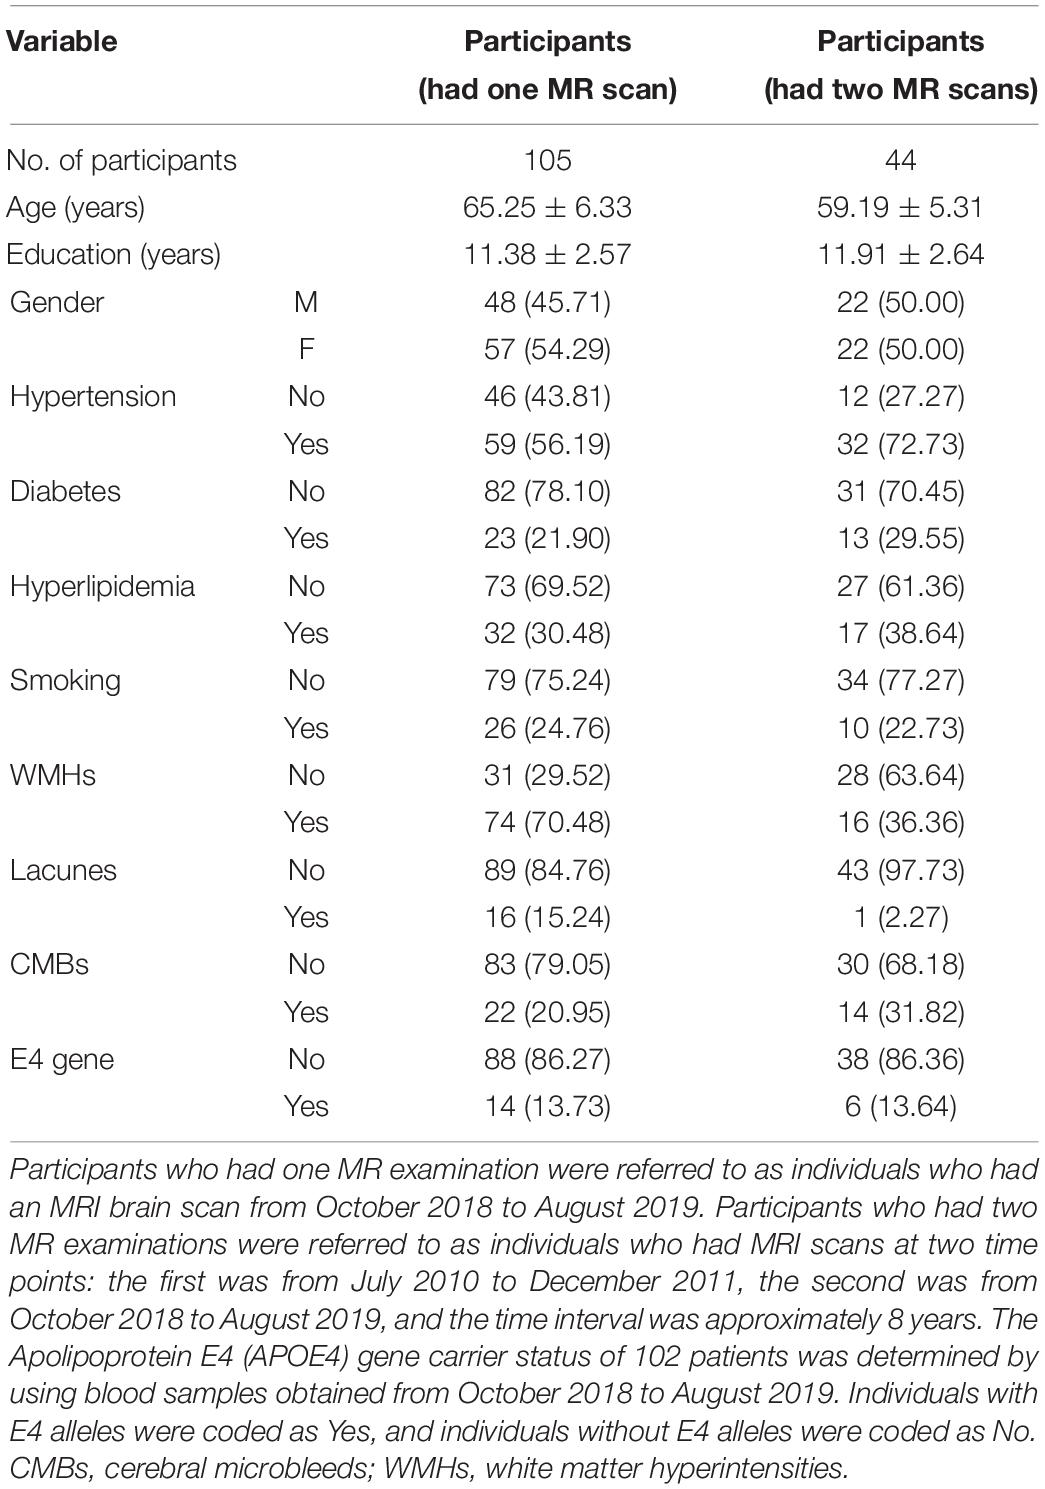
Table 1. Description of demographic characteristics and risk factors [mean ± SD or n (%)].
Among these 105 participants, 44 individuals had undergone another MRI scan in our hospital between July 2010 and December 2011, thereby providing us with an opportunity to study the age-related accumulation of brain iron using a longitudinal approach (details in Table 1). During the research, we fully considered the influence of gadolinium intake on the susceptibility values in the brain. We carefully reviewed the clinical and imaging data of 44 participants, and we followed up by telephone patients who underwent two MRI examinations. None of these patients had an enhanced MRI scan with gadolinium contrast agent.
MRI Acquisition
From October 2018 to August 2019, all subjects were imaged on a MAGNETOM Skyra 3.0 T MR scanner (Siemens Healthcare, Erlangen, Germany) using a product 32-channel head coil for signal reception. The brain scanning protocol consisted of a 3D T1-weighted (T1W) magnetization-prepared rapid gradient-echo (MPRAGE) sequence for anatomic structures [repetition time (TR) = 2,300 ms, echo time (TE) = 2.3 ms, inversion time (TI) = 900 ms, flip angle = 9°, and isotropic voxel size = 1 mm3] and a 3D multiecho gradient-echo (ME-GRE) sequence for QSM (TR = 50 ms, first TE = 6.8 ms, TE interval = 4.1 ms, number of echoes = 10, flip angle = 15°, and voxel size = 1 mm × 1 mm × 2 mm). In addition, T2-weighted (T2W) turbo spin-echo images (TR = 3,700 ms, TE = 109 ms, TI = 900 ms, flip angle = 15°, and slice thickness = 5 mm), T2W fluid-attenuated inversion recovery (FLAIR) images (TR = 8,000 ms, TE = 81 ms, TI = 2,370 ms, flip angle = 15°, and slice thickness = 5 mm), diffusion-weighted images (DWIs) (TR = 3,700 ms, TE = 65 ms, flip angle = 18°, and slice thickness = 5 mm), and susceptibility-weighted images (SWIs) (TR = 27 ms, TE = 20 ms, flip angle = 15°, and slice thickness = 5 mm) were acquired to detect brain abnormalities.
From July 2010 to December 2011, 44 participants were evaluated on a Signa 3.0T MRI scanner (Signa, HDx, General Electric Healthcare, Milwaukee, WI, United States) with an eight-channel array coil. The scanning sequences included conventional MRI sequences (T2W imaging, T2-FLAIR, and DWI), 3D T1W imaging for anatomic structure, and enhanced 3D multiecho GE T2∗-weighted angiography (ESWAN) sequences for QSM. 3D T1W images were acquired using a T1W volumetric fast spoiled gradient recalled-echo (FSPGR) sequence with the following parameters: TR = 7.3 ms, TE = 2.7 ms, TI = 850 ms, flip angle = 13°, and isotropic voxel size = 1 mm3; ESWAN sequences were acquired using a 3D-enhanced T2∗-weighted contrast flow-compensated (i.e., the gradient moment was null in all three orthogonal directions) ME-GRE (12 different TEs) sequence with the following parameters: TR = 51.6 ms, first TE = 4.4 ms, TE = 4.4–38.2 ms, TE interval = 4.8 ms, number of echoes = 8, flip angle = 20°, and voxel size = 1 mm × 1 mm × 2 mm.
Quantitative Susceptibility Mapping Preprocessing and Quantitative Analysis
Brain QSM maps were computed from ME-GRE complex image data using morphology-enabled dipole inversion with an automatic uniform cerebrospinal fluid (CSF) zero reference algorithm (MEDI + 0) (Liu et al., 2018). Briefly, a non-linear fitting of the multiecho data was performed to estimate the total field, followed by spatial field unwrapping and background field removal using the projection onto dipole fields (PDF) algorithm to compute the local field (Liu et al., 2011), which was then inverted to obtain the final susceptibility map. Structural priors (edges) within the lateral ventricles derived from the magnitude image and with a regularization term enforcing a uniform susceptibility distribution of the CSF were used in the numerical inversion to improve QSM quality and to provide CSF as an automatic susceptibility reference. The CSF mask was determined by thresholding the R2∗ map computed from the ME-GRE magnitude data and imposing voxel connectivity (Liu et al., 2018). The conventional images (T1W, T2W, and FLAIR) were processed with an automated FMRIB Software Library (FSL) pipeline, which consisted of brain data extraction using the Brain Extraction Tool (BET) algorithm (Smith, 2002), bias field correction using FMRIB’s Automated Segmentation Tool (FAST) (Zhang et al., 2001), and linear coregistration to the ME-GRE magnitude image (which is in the same space as QSM) using FMRIB’s Linear Registration Tool (FLIRT) with six degrees of freedom (Jenkinson et al., 2002). For the region of interest (ROI) analysis, FMRIB’s Integrated Registration Segmentation Tool (FIRST) (Patenaude et al., 2011) was used to segment selected subcortical GM structures (Thal, CN, Put, GP, RN, SN, and DN) on T1W images, and the resulting segmentation masks were linearly coregistered to QSM. These masks were then visually inspected and manually edited by an experienced neuroradiologist if necessary (e.g., to remove veins or CMBs with high positive susceptibility values) on QSM images using ITK-SNAP v3.8 software1. The mean susceptibility value within each ROI was recorded (Figure 1).
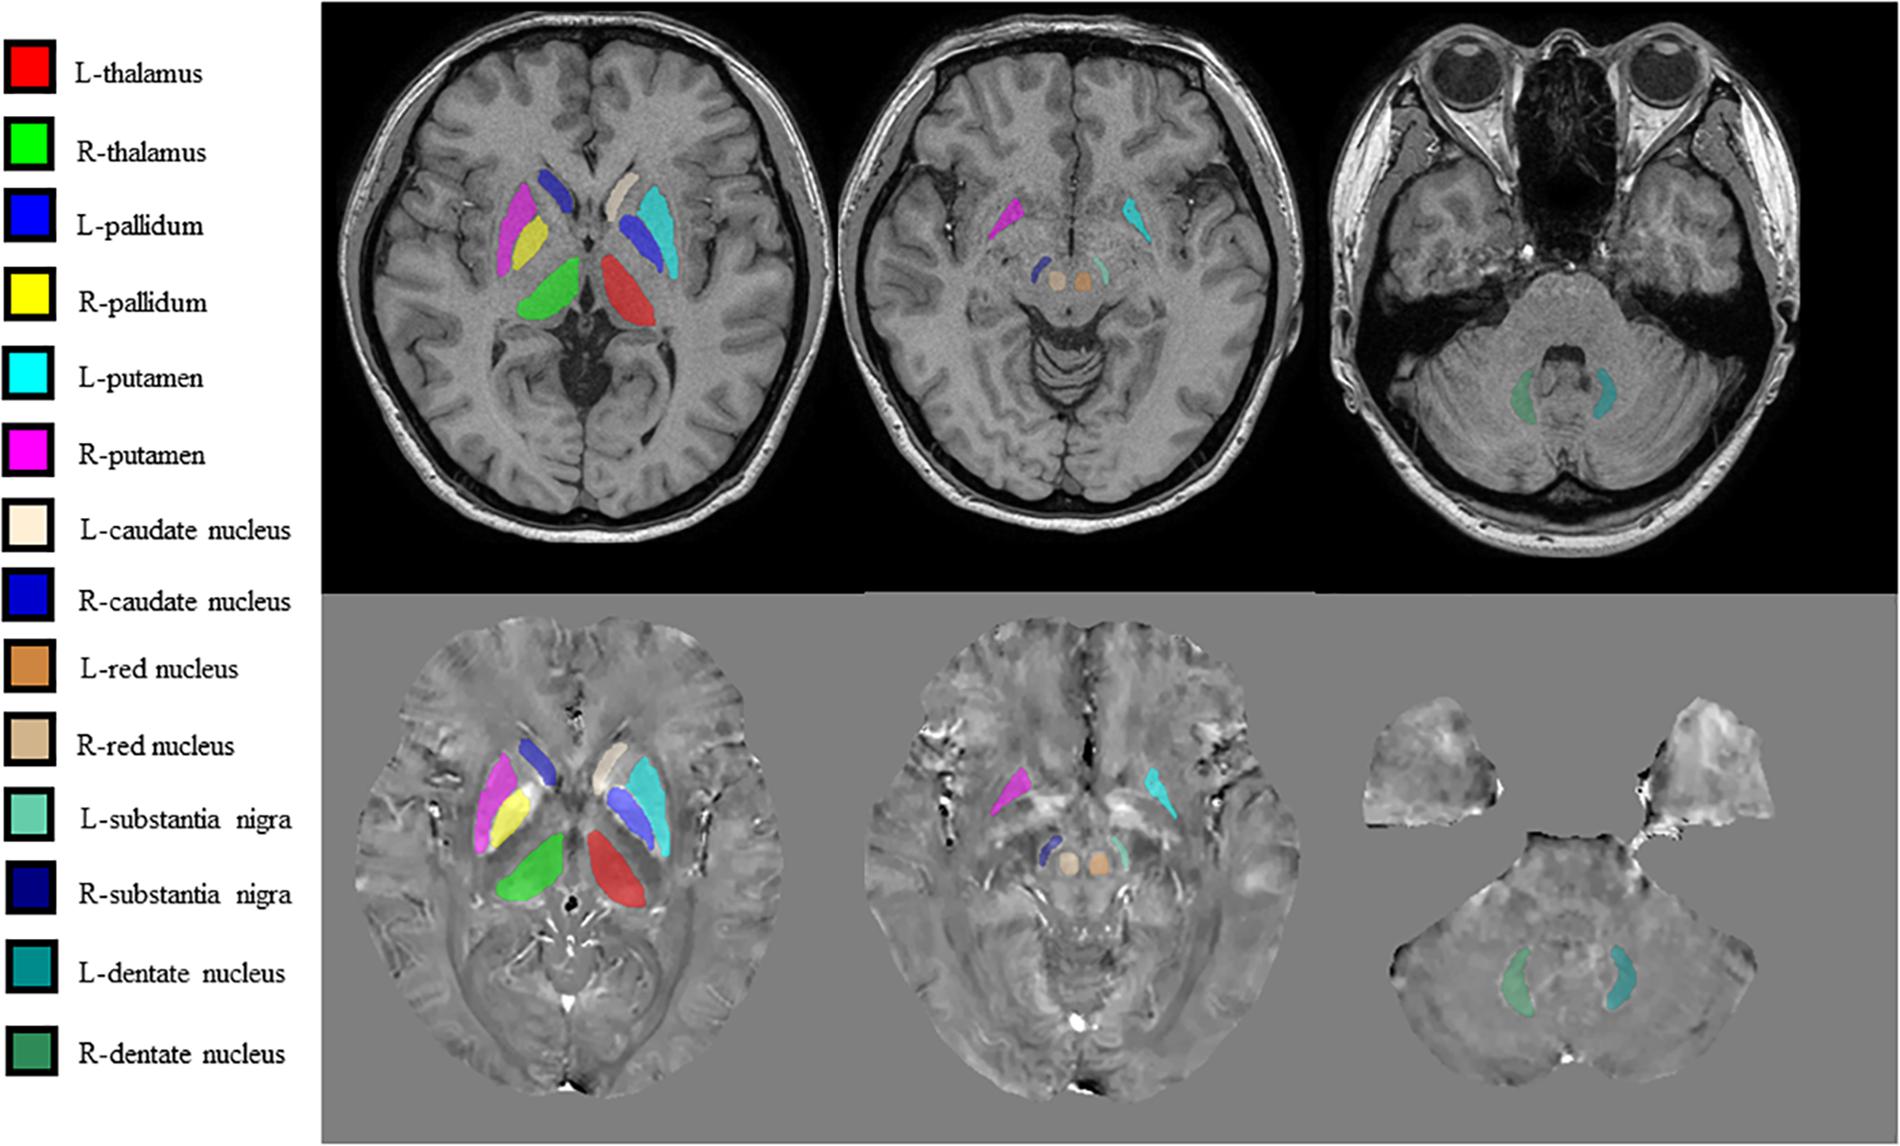
Figure 1. Regions of interest (ROIs) were traced directly on the quantitative susceptibility mapping (QSM) image and T1-weighted (T1W) images to remove veins with high positive susceptibility values on QSM.
Conventional MRI Assessment
According to the Standards for Reporting Vascular Changes on Neuroimaging (STRIVE) criteria (Wardlaw et al., 2013a), WMHs were signal abnormalities of variable size, defined as white matter hyperintense lesions on FLAIR images. Lacunes were round or ovoid, subcortical small lesions (3–15 mm in diameter) that were hypointense on T1W images and hyperintense on T2W images and had a perilesional halo on FLAIR images. CMBs were defined as small signal voids (≤10 mm in diameter) with associated blooming on T2∗-weighted images. The severity of CMBs, lacunes, and WMHs was assessed using a simple scoring method (Amin Al Olama et al., 2020). In a binary fashion (i.e., presence or absence), individuals with lacunar infarcts, WMHs, or CMBs were coded as 1; and individuals without these MRI findings were coded as 0.
APOE Genotyping
Apolipoprotein E (APOE) genotyping was conducted using standard real-time fluorescence polymerase chain reaction (PCR) methods (Calero et al., 2009). APOE4 carrier status was determined: individuals with E4 alleles were coded as 1, and individuals without E4 alleles were coded as 0.
Statistical Analysis
Statistical analysis was performed using Statistical Package for the Social Sciences software (Version 21.0 for Windows; SPSS, Chicago, IL, United States). The measurement data are presented as the mean ± standard deviation. The count data were represented in the form of n (%). The effect of different hemispheric locations was compared using a paired t-test. To test the independent association between variables and susceptibility values in DGM, we performed multiple regression analyses. Considering that our sample size is not large enough, we made variable selection before doing the multiple linear regression analysis. First, we performed a univariate analysis using an independent sample t-test and Pearson correlation analysis. Only variables for which a univariate association with susceptibility values at a p-value < 0.1 was seen were entered into the multiple regression models as independent variables (Pirpamer et al., 2016). Second, for every ROI, the multiple linear relationships between the independent parameters and the susceptibility values were estimated with a stepwise regression method, and the best multiple linear regression models were selected.
After univariate analysis, for the Thal, variables of smoking status, history of T2DM and hypertension, APOE carrier status, and whether having CMBs in the brain were introduced to the following multiple linear regression analysis. For the Put, variables of aging, history of T2DM, and whether having CMBs in the brain were introduced to the following multivariate analysis. For the CN, the variables are aging and history of T2DM; for the RN, the variables are aging, history of T2DM and hypertension, whether having lacunes in the brain; for the SN, the variables are aging and history of hypertension; for the DN, the variables are aging, gender, history of T2DM, and hypertension.
Among these 105 participants, 44 patients received two MRI examinations at two different time points. Hence, the age-related accumulation of brain iron could be analyzed longitudinally with paired t-tests. Because multiple hypotheses were tested, we used the Bonferroni method for correction to avoid type I errors.
Results
For susceptibility values, no significant effect of hemispheric location in the seven ROIs was found. Therefore, in the following analysis, we used the mean values of the left and right hemispheres (Table 2).
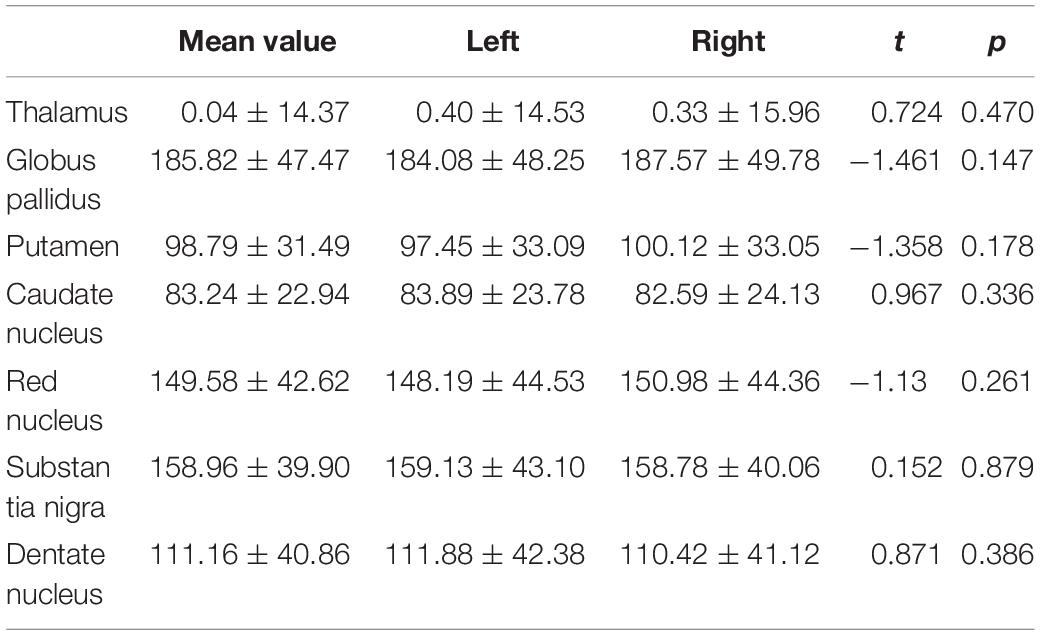
Table 2. Comparison of the susceptibility values of the gray matter nuclei between the left and right hemispheres (mean ± SD).
The longitudinal analysis of 44 individuals who had two MRI scans showed the age-related accumulation of brain iron in the GP (t = 10.763, p < 0.001), Put (t = 20.657, p < 0.001), CN (t = 10.308, p < 0.001), RN (t = 3.497, p = 0.001), SN (t = 4.976, p < 0.001), and DN (t = 8.576, p < 0.001) but not in the Thal (t = 0.659, p = 0.513) (Figure 2).
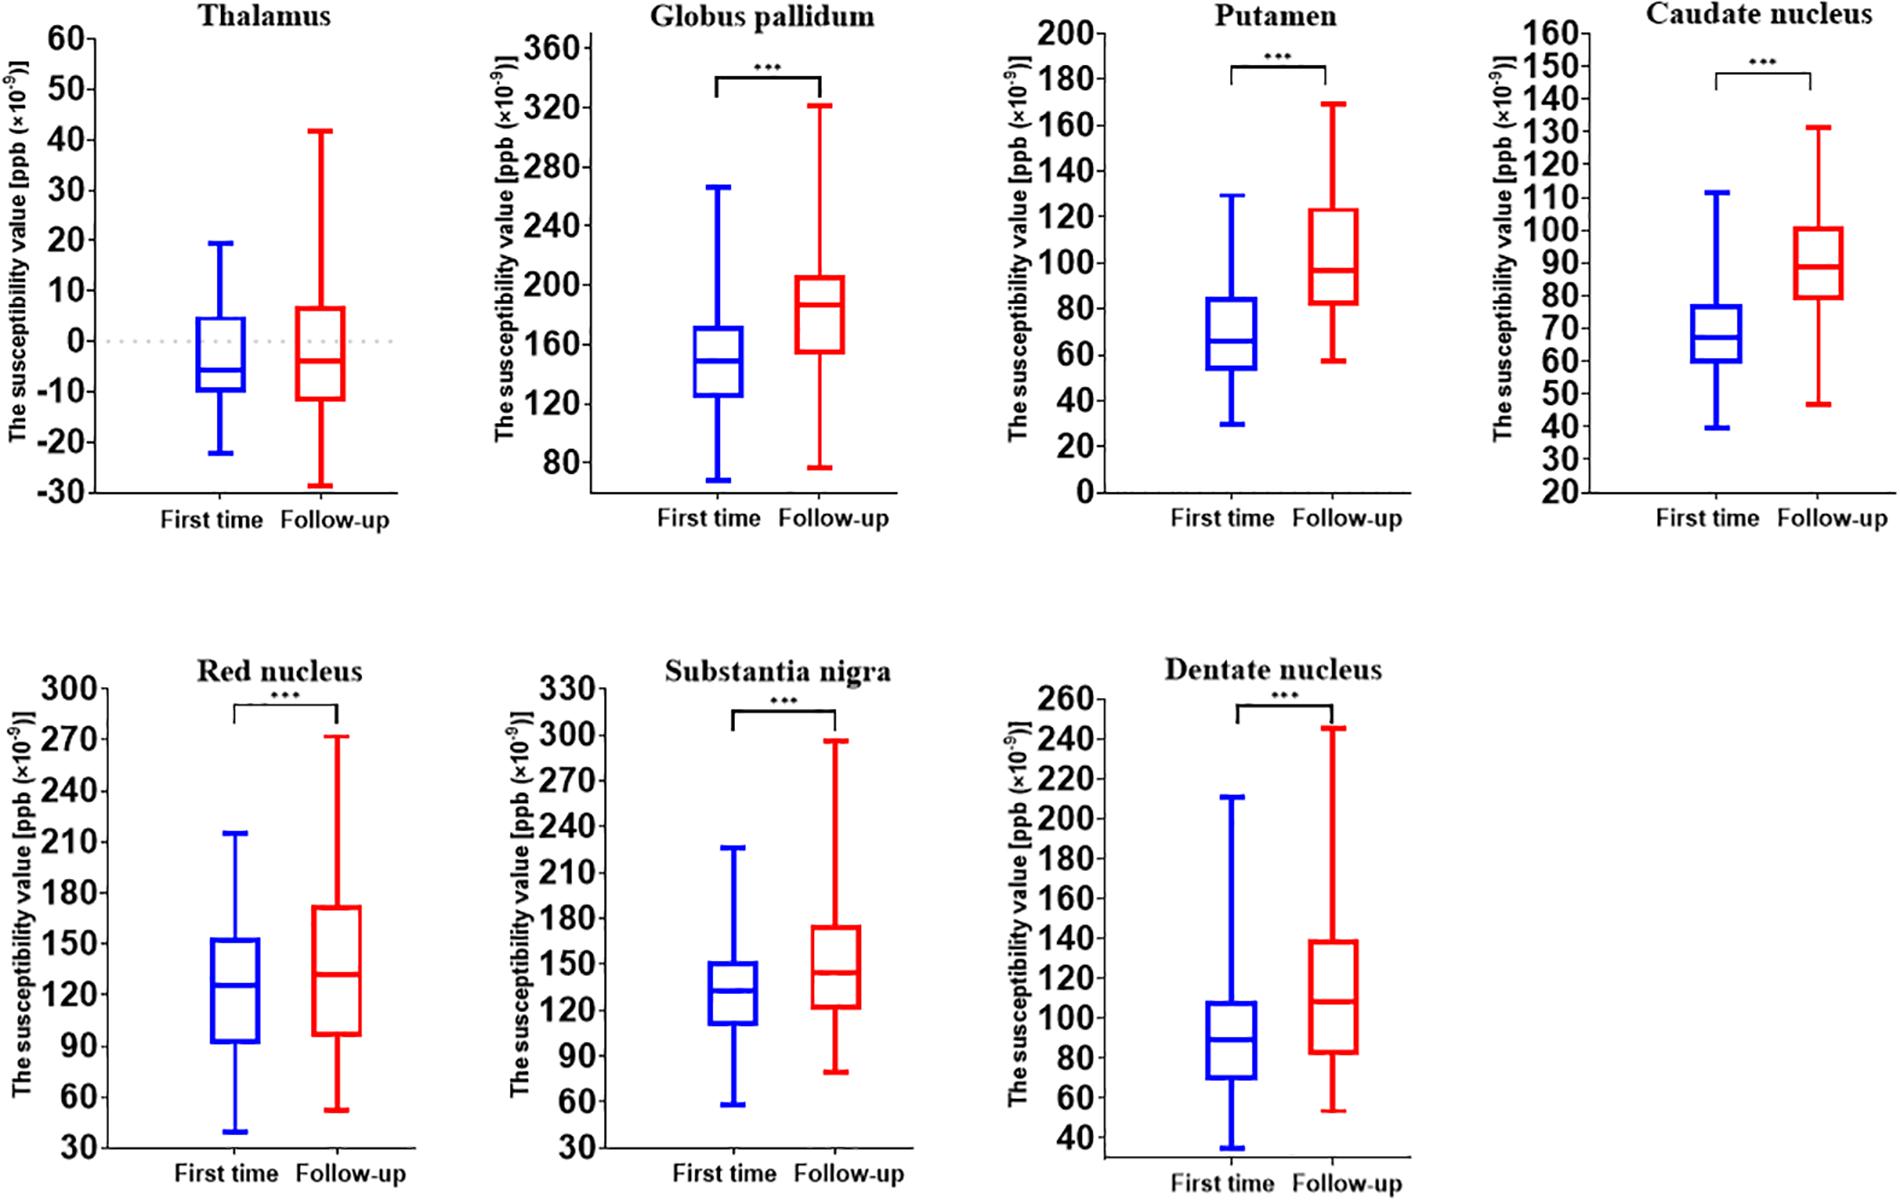
Figure 2. Comparison results of susceptibility values of gray matter nuclei between two time points (first time, July 2010 to December 2011; follow-up, October 2018 to August 2019). ***p < 0.001.
In the univariate analysis for each region, the factors with p values less than 0.1 are highlighted in italics (Table 3). Pearson’s correlation analysis showed increased rates of susceptibility values with aging varying among these regions. Put exhibited the highest rate of increase in susceptibility with aging (Table 4). Scatter plots illustrated a linear age dependency of iron concentration as measured by mean QSM susceptibility values (Figure 3).
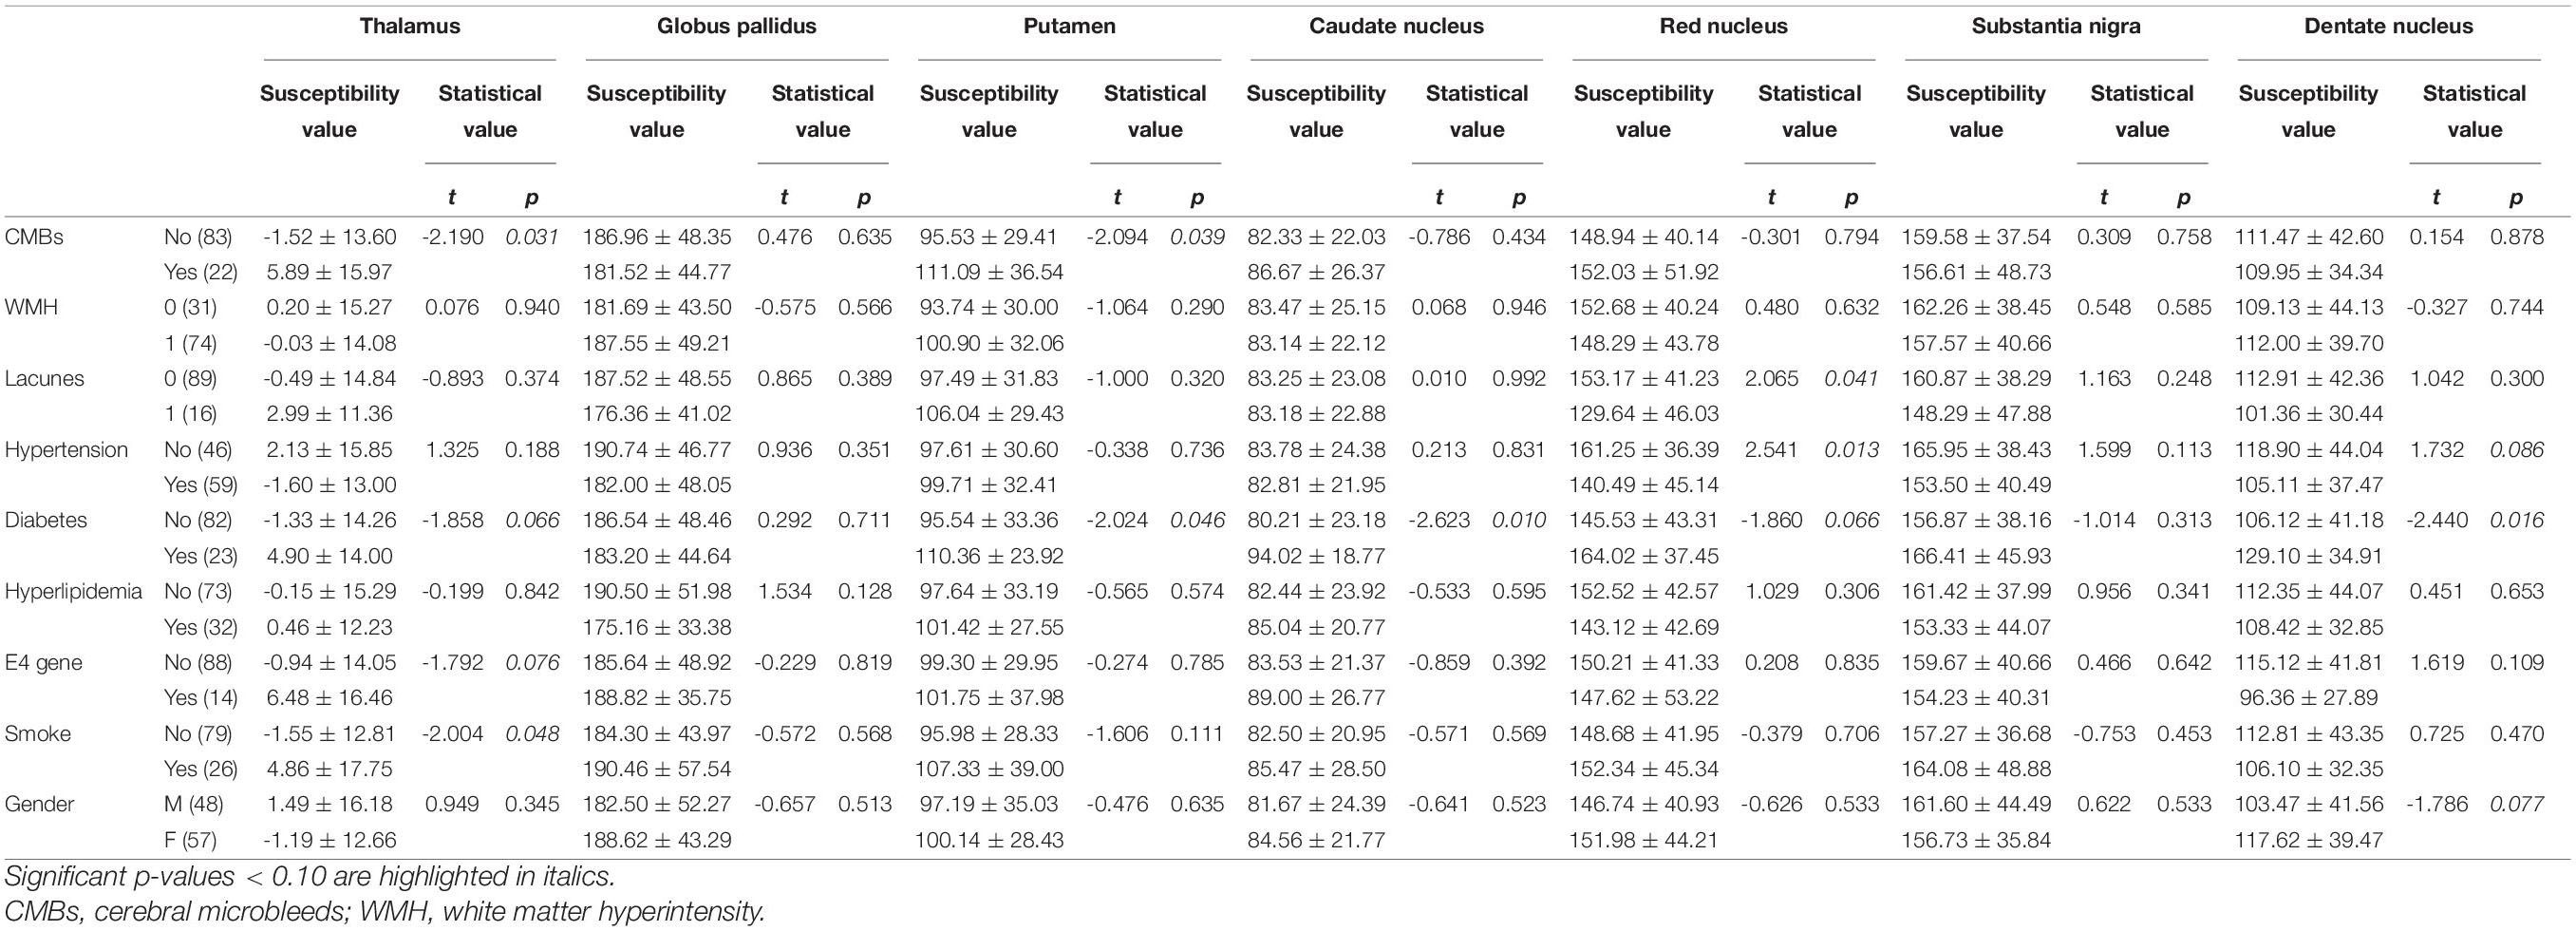
Table 3. Determinants of susceptibility values in gray matter structures: results of univariate analysis.
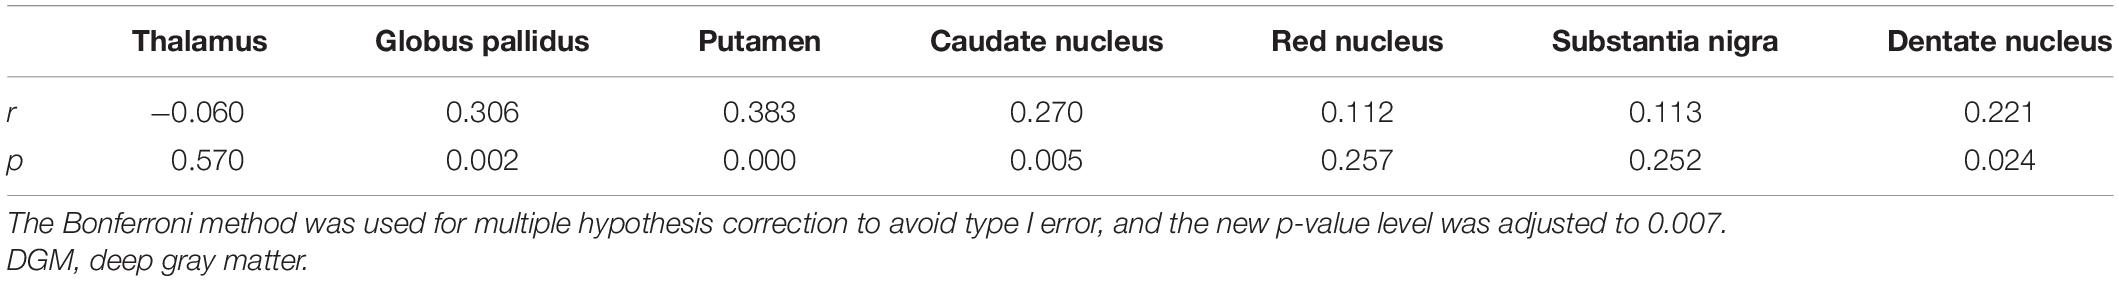
Table 4. The Pearson linear relationship between susceptibility values of DGM and age.
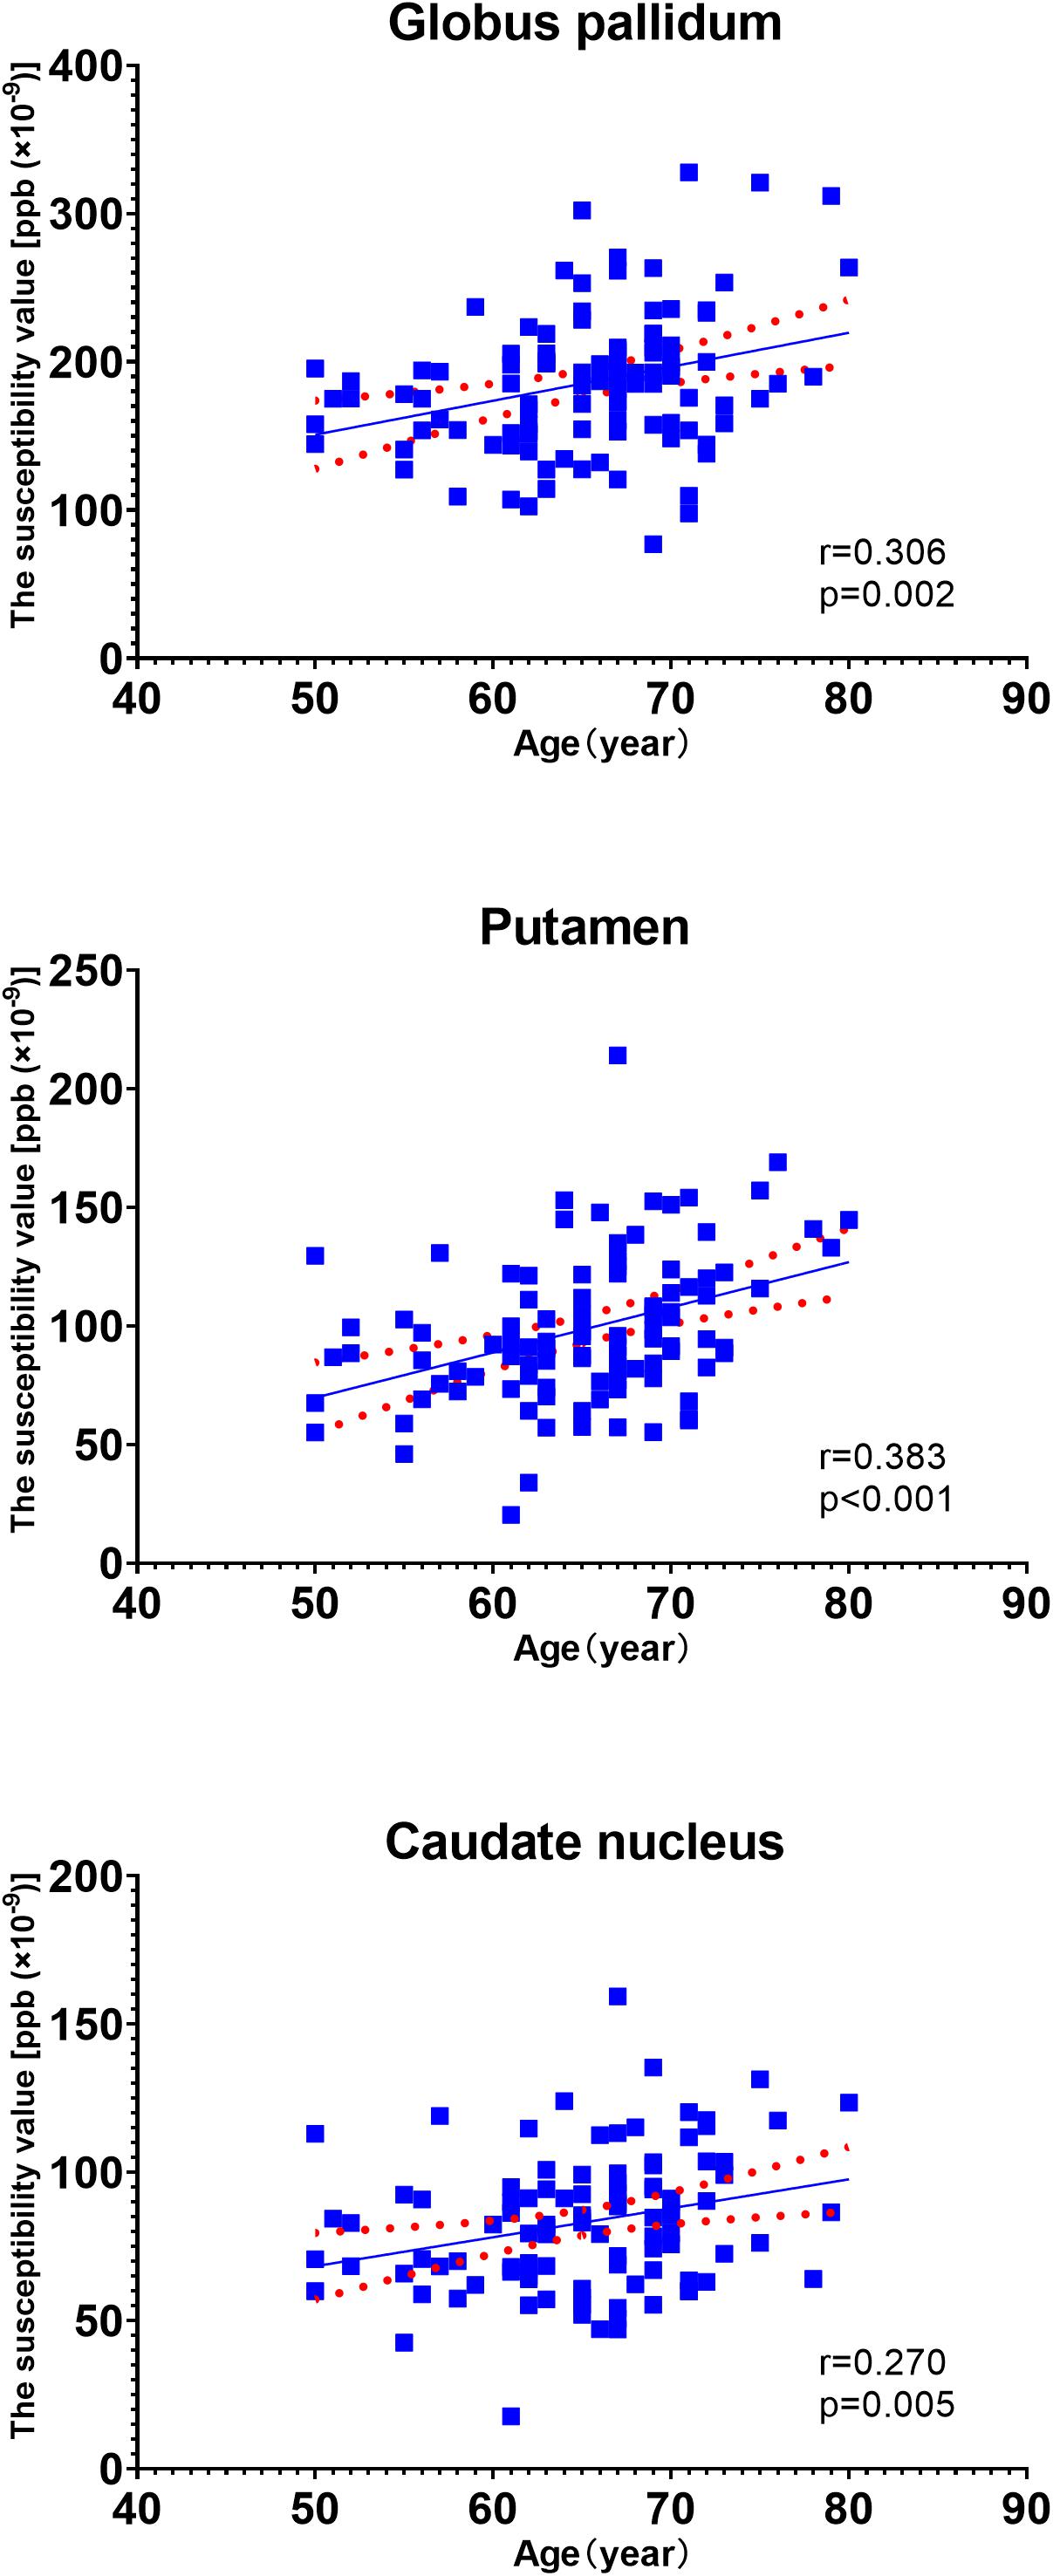
Figure 3. Scatter plots illustrating a linear age dependency of iron concentration as measured by mean quantitative susceptibility mapping (QSM) susceptibility values. The putamen exhibited the highest rate of increase in susceptibility values with aging.
Because the longitudinal analysis showed that age played a key role in susceptibility values in the DGM (except for the Thal), age was introduced into the subsequent multiple linear regression analysis. After the multiple linear regression analysis, we found that the influencing factor for Thal was smoking status (t = 2.166, p = 0.033). Regarding Put, CN, RN, and DN, the influencing factors included a history of T2DM (t = -3.094, p = 0.003; t = 2.682, p = 0.009; t = 2.069, p = 0.041; and t = 2.682, p = 0.009, respectively) and age (t = 4.257, p = 0.000; t = 2.897, p = 0.005; t = 3.164, p = 0.001; and t = 3.126, p = 0.002, respectively). In these regions, the results showed that T2DM patients had increased iron deposition. Age-related increases in susceptibility values could also be detected, and the rates of increase with aging varied among these regions. For RN and DN, a history of hypertension also influenced the susceptibility values (t = −3.236, p = 0.002; t = −2.818, p = 0.006, respectively), and patients with hypertension showed significantly lower iron content in these regions. Details of the multiple linear regression models are listed in Table 5.
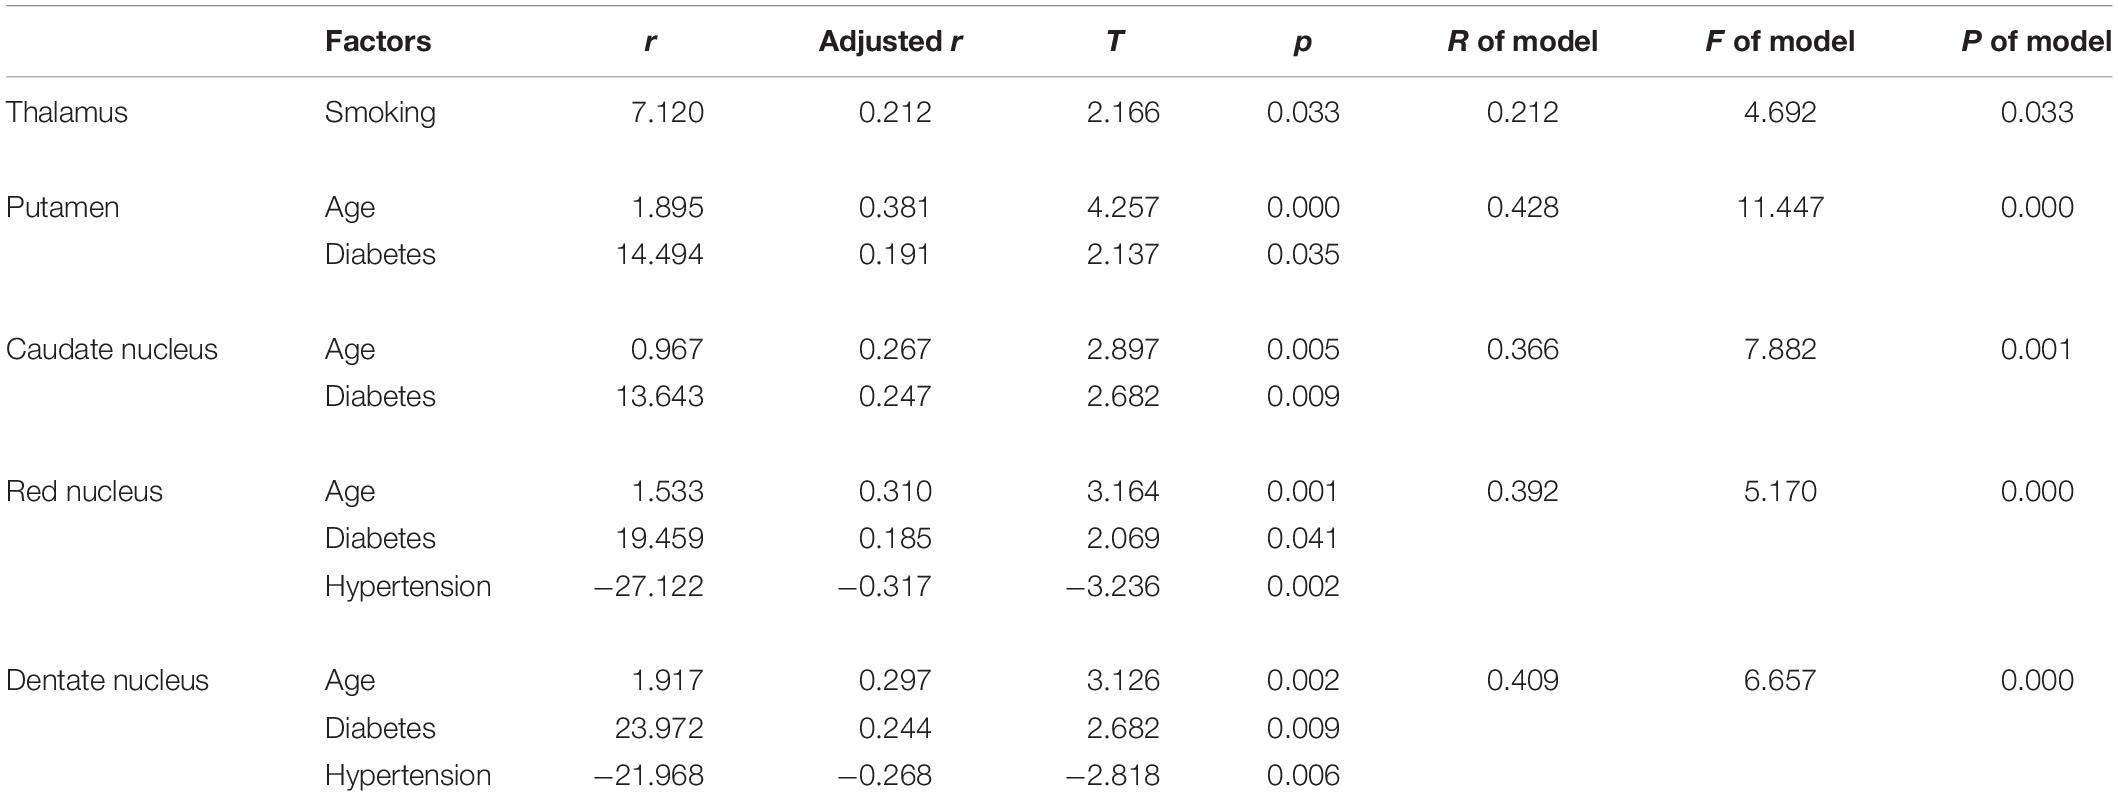
Table 5. Determinants of susceptibility values in gray matter structures: results of multiple linear stepwise regression analysis.
We analyzed interaction effects by introducing three new factors: age × history of hypertension, age × history of DM, and history of hypertension × history of DM. In the Put, CN, and RN, no interaction effects were found. However, an interaction effect was found in the DN. Aging was associated with susceptibility values only in the participants who had no hypertension or DM (data not shown).
Discussion
In this study, using the QSM method, we investigated some factors and their effects on brain iron content. These factors included hemispheric location, sex, aging, smoking status, APOE carrier status, history of T2DM, hypertension, hyperlipidemia, and some important MRI features (CMBs, WMHs, and cerebral microinfarcts) in elderly people in the community. We expect that this knowledge will help us to gain more insight into the potential abnormalities of magnetic susceptibility that arise from various neurological diseases and neural degeneration. Similar to many other studies, our data indicated significant effects of age on susceptibility values in the DGM. In the cross-sectional analysis, age-related iron deposition was found in the GN, Put, CN, and DN (Xu et al., 2008; Li et al., 2014; Gong et al., 2015). Based on the knowledge that QSM is reproducible across scanner makers, models, field strengths, and sites and could be used in clinical investigations both longitudinally and across centers (Hinoda et al., 2015; Wang et al., 2017; Wicaksono et al., 2020), the MR measures of QSM were accurate and consistent across repeated measurements and between platforms (Hobson et al., 2020). We performed a longitudinal analysis of age-related iron deposition despite different scanners in the two examinations. The results showed significant age-related increases in GN, Put, CN, RN, SN, and DN but not in Thal (Figures 4, 5). Notably, the rate of increase varies among these regions, reflecting a heterogeneous accumulation of iron in different brain tissues. The highest rate of increase was found in the Put. Our results showed no support for a linear age-related change in iron content in the Thal, consistent with some previous studies (Bilgic et al., 2012; Gong et al., 2015; Persson et al., 2015). These findings illustrated that when we intend to study the iron deposition of neurological diseases involving the DGM, especially the Put; age, as a confounding factor, should be controlled more strictly.
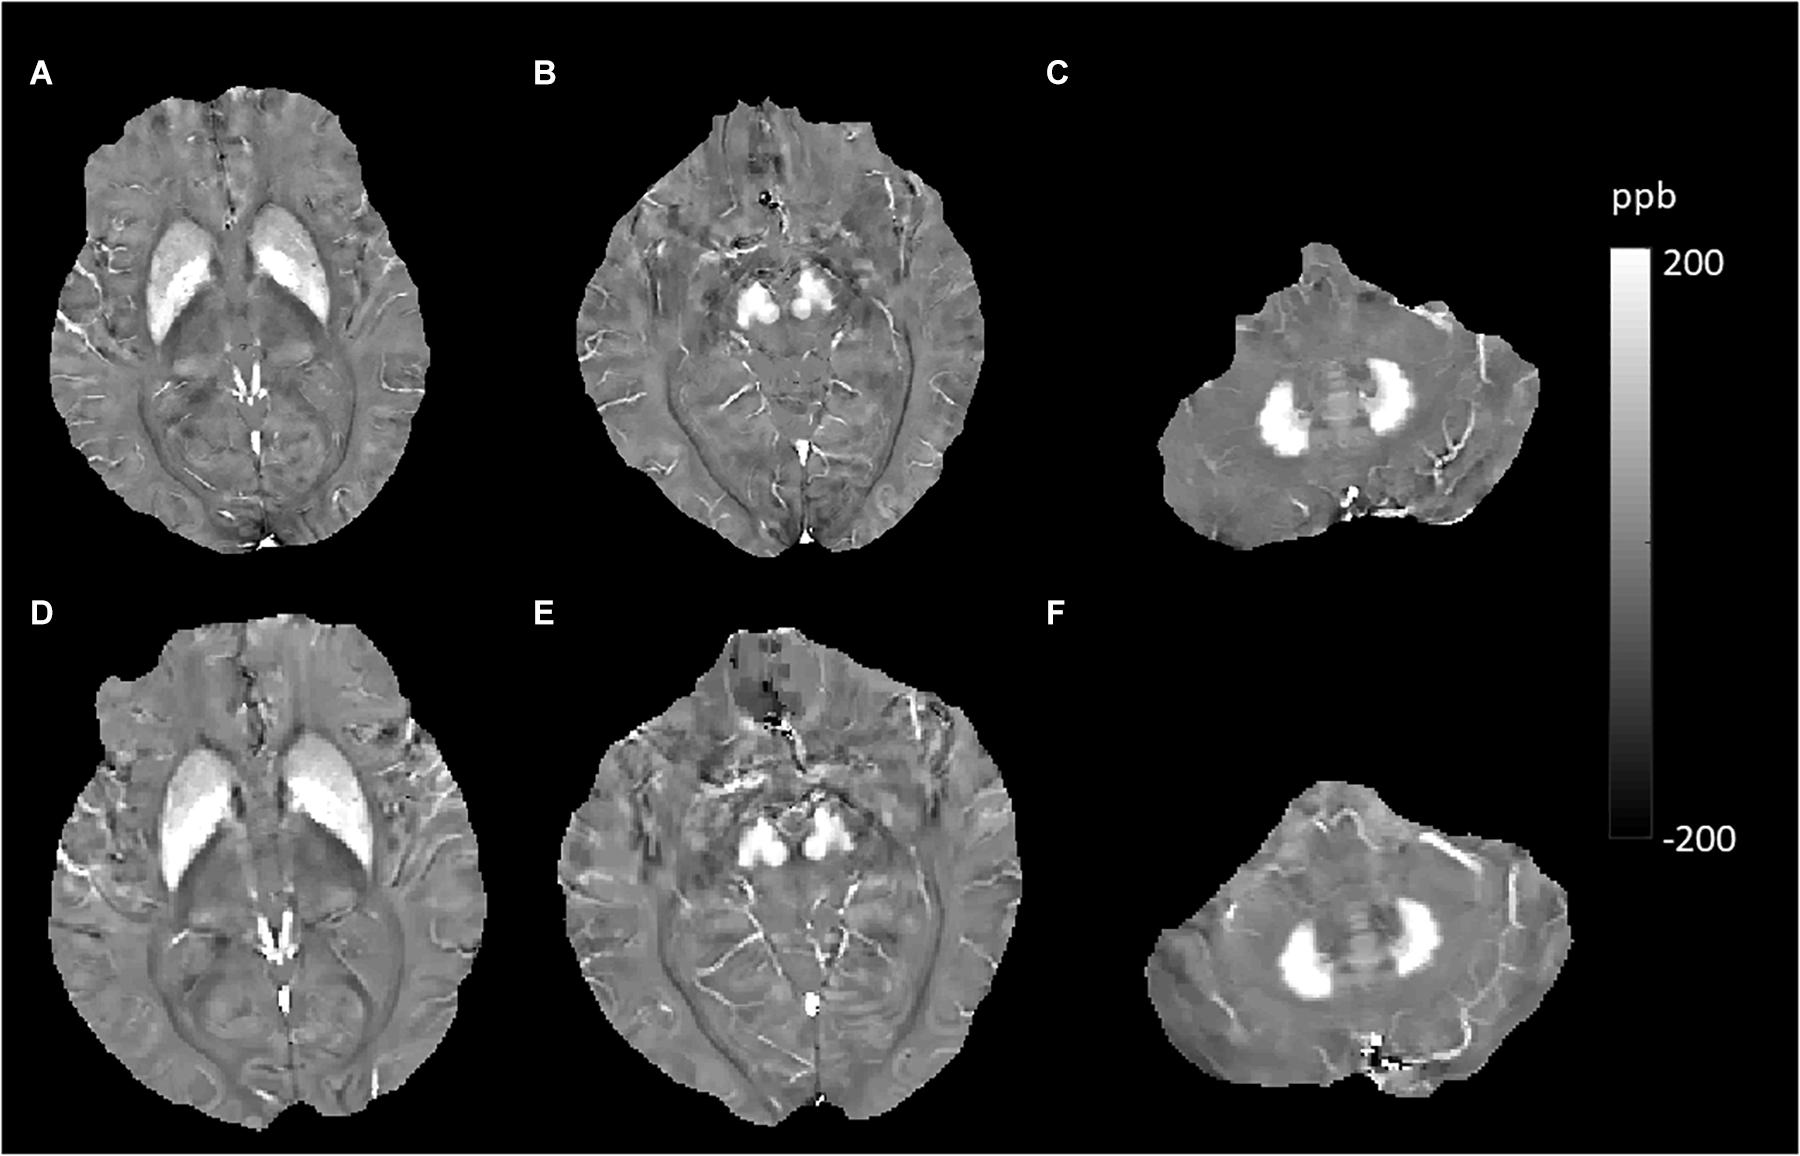
Figure 4. Evolution of susceptibility values with age in the caudate nucleus, putamen, globus pallidus, red nucleus, substantia nigra, and dentate nucleus. These images were from an 80-year-old male non-smoker without hypertension and type 2 diabetes mellitus (T2DM). The upper row (A–C) shows quantitative susceptibility mapping (QSM) images acquired in 2010, and the bottom row (D–F) shows QSM images acquired in 2019. Susceptibility values of the gray matter nuclei increased significantly over time.
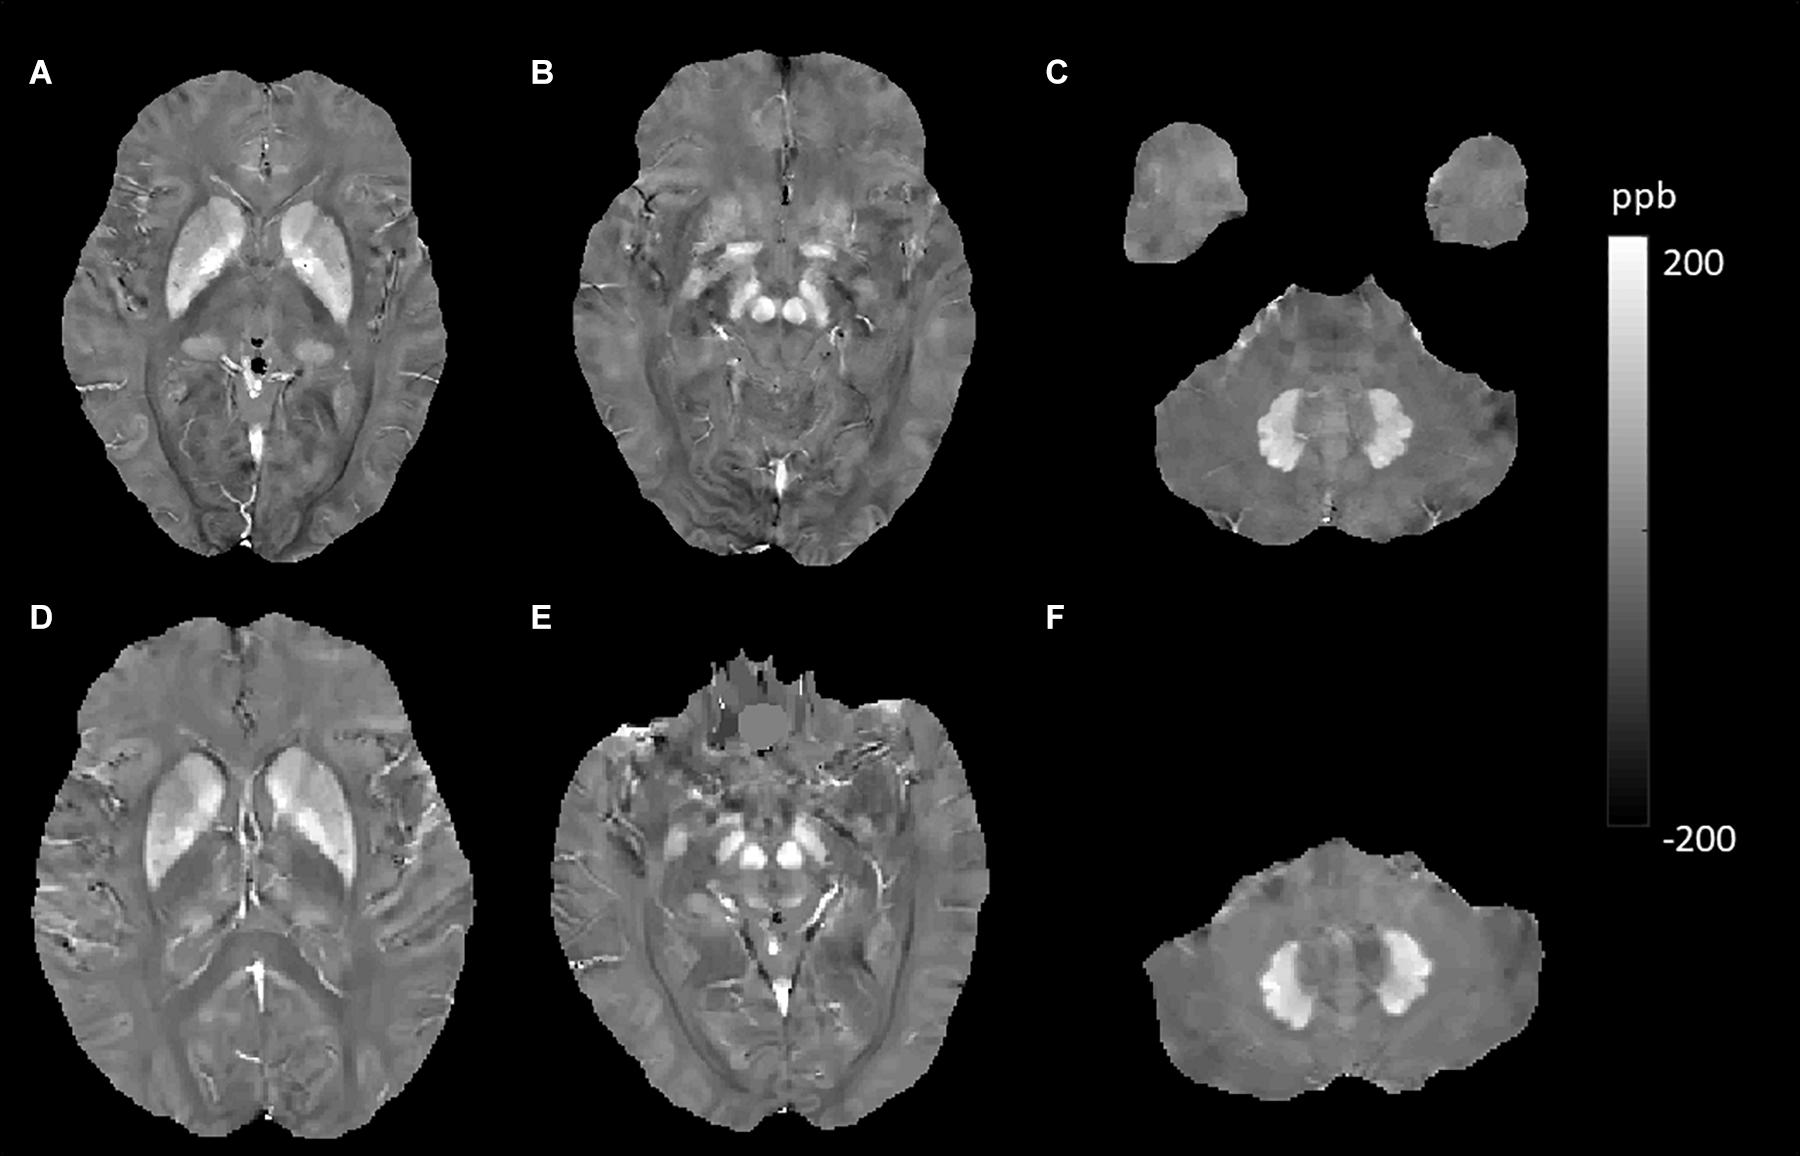
Figure 5. Evolution of susceptibility values with age in the caudate nucleus, putamen, globus pallidus, red nucleus, substantia nigra, and dentate nucleus. These images were from a 64-year-old female non-smoker without hypertension and type 2 diabetes mellitus (T2DM). The upper row (A–C) shows quantitative susceptibility mapping (QSM) images acquired in 2011, and the bottom row (D–F) shows QSM images acquired in 2019. Susceptibility values of the gray matter nuclei increased significantly over time.
In this study, we found that brain iron was abnormally deposited in patients with T2DM in several DGM, including the Put, CN, RN, and DN (Figure 6). A previous study investigated the deposition of iron in the brain in T2DM patients with mild cognitive impairment using QSM and showed similar results. They found that susceptibility values in the right CN and SN and the left Put increased and that the susceptibility of these regions was closely correlated with cognitive impairment, suggesting that iron deposition may play an important role in the process of T2DM cognitive impairment (Yang et al., 2018). The precise mechanisms underlying the higher iron concentration in T2DM are not understood, but hyperglycemia could lead to neuronal damage. Neurons have a continuous high glucose demand, and unlike muscle cells, they cannot accommodate episodic glucose uptake under the influence of insulin. Neuronal glucose uptake depends on the extracellular concentration of glucose, and cellular damage can ensue after persistent episodes of hyperglycemia (Tomlinson and Gardiner, 2008). Iron accumulation could occur as an epiphenomenon of demyelination, axonal damage, and/or neurodegeneration (Raz et al., 2015). Insulin resistance leads to high permeability of the blood–brain barrier (BBB) and triggers cognitive decline in a diabetic insulin resistance mouse model and in an AD model (Takechi et al., 2017). Increased permeability with leakage of material into the vessel wall and perivascular tissue could cause inflammation (Wardlaw et al., 2013b), and the inflammatory status of the brain could influence brain iron metabolism and lead to iron deposition (McCarthy et al., 2018). Therefore, we speculate that neuronal damage caused by hyperglycemia and permeability of the BBB caused by insulin resistance may be the reasons for iron accumulation in T2DM, but this inference needs to be substantiated by more studies.
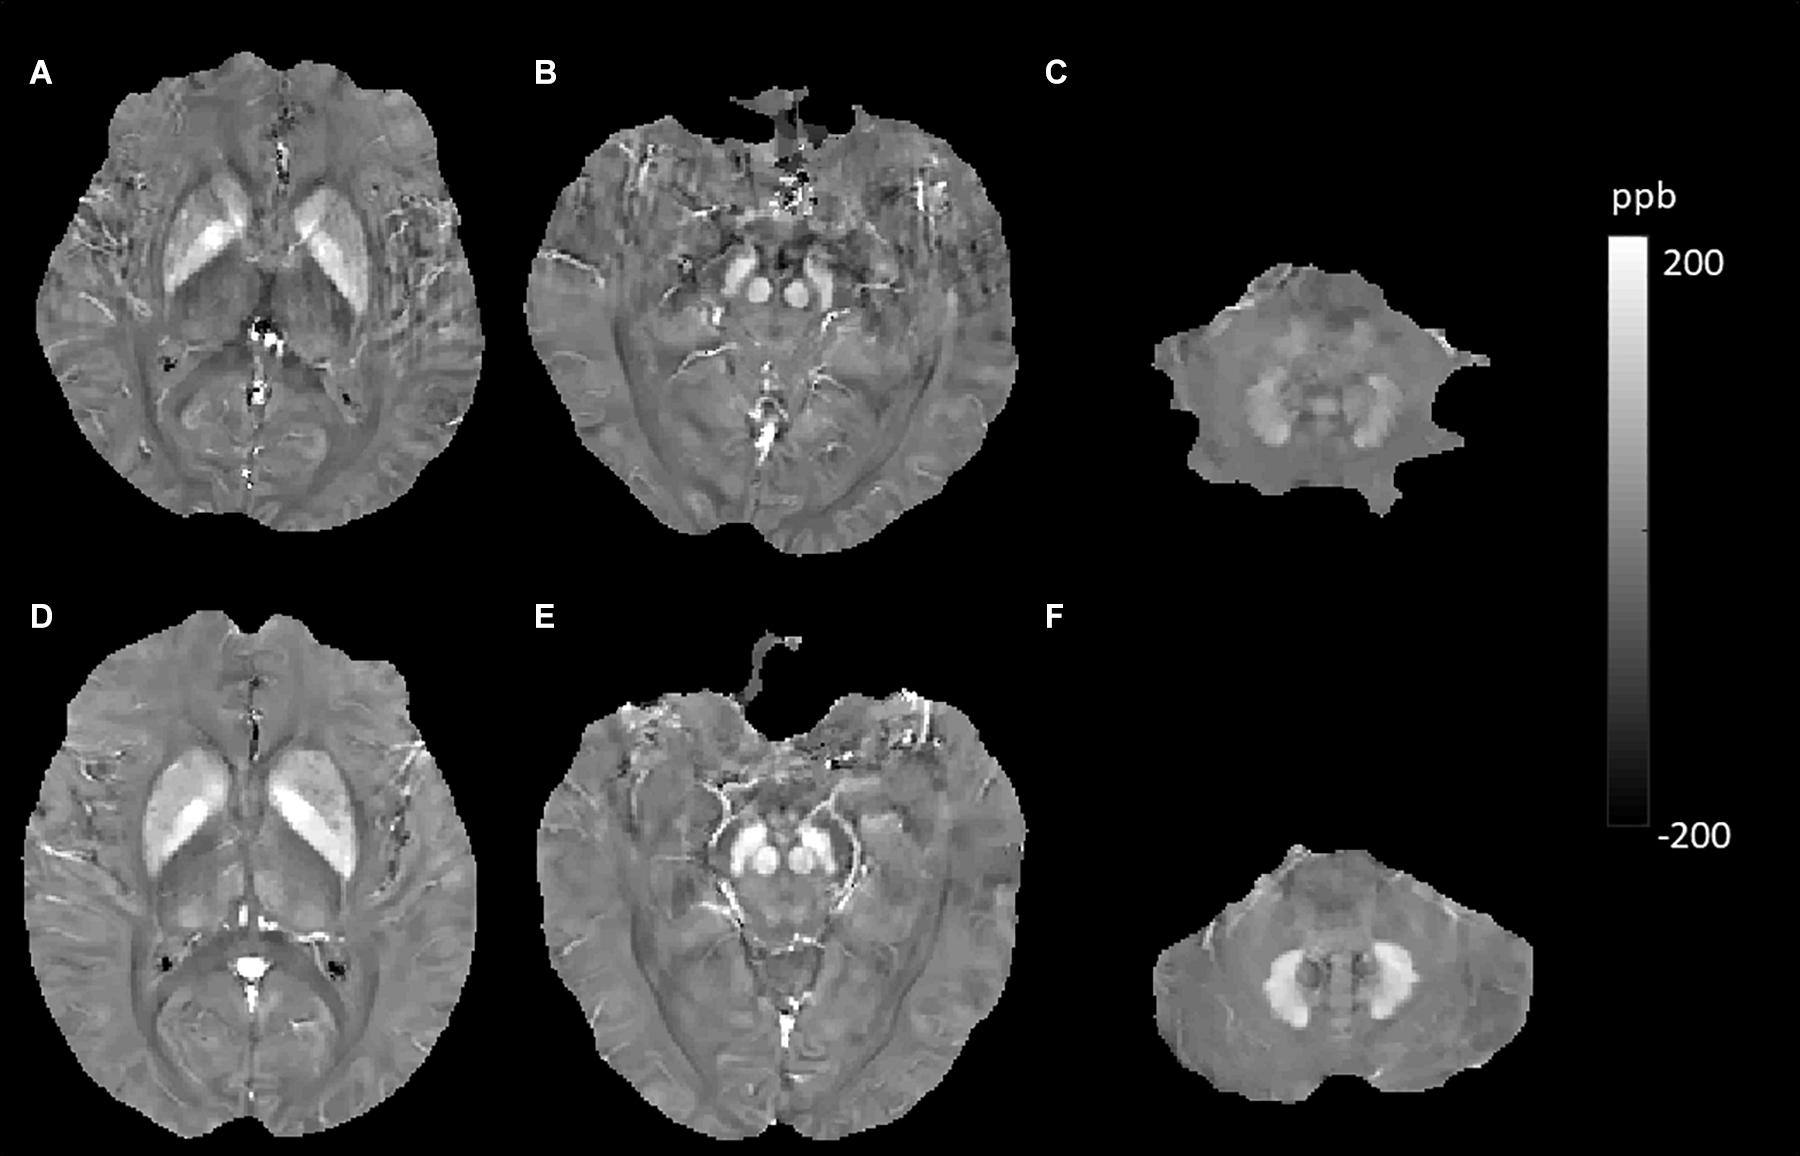
Figure 6. Evolution of susceptibility values with type 2 diabetes mellitus (T2DM) effect in the putamen, caudate nucleus, red nucleus, and dentate nucleus. The upper row (A–C) shows susceptibility images of a 55-year-old male non-smoker without hypertension and T2DM (first). The bottom row (D–F) shows quantitative susceptibility mapping (QSM) images of a 52-year-old male non-smoker with T2DM but without hypertension (second). Susceptibility values of the putamen, caudate nucleus, red nucleus, and dentate nucleus were higher in the second participant than in the first participant.
In addition to brain iron dysmetabolism in patients with hypertension, we initially speculated that the brain iron content would be increased in hypertensive patients. Conversely, we observed decreased susceptibility in the RN and DN. Many studies have suggested that increased systolic blood pressure (SBP) is associated with injury to the white matter microstructure and gray matter atrophy (Maillard et al., 2012; Fennema-Notestine et al., 2016; Carnevale et al., 2018). Few studies have examined the effect of hypertension on regional brain iron deposition. A study reported that hypertensive participants had significantly greater iron content in the hippocampus, CN, Put, entorhinal cortex, superior frontal gyrus, and primary visual cortex (Rodrigue et al., 2011). One study of cognitively impaired patients showed that DM-positive patients had lower susceptibility values, indicative of lower brain iron content, than DM-negative patients in the hippocampus and pulvinar of the Thal (Park et al., 2018); however, in that study, hypertension was more frequently found in DM-positive patients (69.6% vs. 39.1%). It was unclear whether hypertension might be the cause of the lower brain iron content that caused the mixed effects of hypertension and DM to lead to the different results. These heterogeneous results suggested that hypertension or other neurological diseases may cause complicated iron redistribution, and the white matter, cortex, and DGM may show different or completely opposite changes. This hypothesis has been verified by a study that found decreased iron levels in the temporal cortex in postmortem human brains with Parkinson’s disease (Yu et al., 2013).
Our data represented that smokers had increased brain iron levels in the Thal (Figure 7). Active and passive tobacco smoking (TS) has been associated with vascular endothelial dysfunction in a causative and dose-dependent manner primarily related to the release of reactive oxygen species (ROS), and ROS can also induce cerebral inflammation (Kaisar et al., 2018). Brain inflammation and BBB impairment could cause iron accumulation, which might lead to extraordinarily increased susceptibility values in Thal smokers. A study reporting brain iron accumulation in unexplained fetal and infant death victims with mothers who were smokers also supported our results (Lavezzi et al., 2011). In the Thal, we found that individuals who carried APOE4 had higher susceptibility values (6.48 vs. -0.94). This suggested that the APOE4 gene might aggravate brain iron deposits. Previous studies suggest that APOE4 is a major genetic risk factor for AD and poor neurological outcomes after traumatic brain injury and hemorrhage (Bell et al., 2012). APOE4 could lead to accelerated BBB breakdown and thereby cause neuronal and synaptic dysfunction (Montagne et al., 2020). These findings indicate that brain iron overload in APOE4 carriers comes from destroyed cerebrovascular integrity. However, the p-value was 0.076 (close to 0.05) in our study. This might be because the sample of APOE4 carriers was not large enough, as only 14 subjects carried the APOE4 gene in our participants. This inference requires a larger sample size to be confirmed.
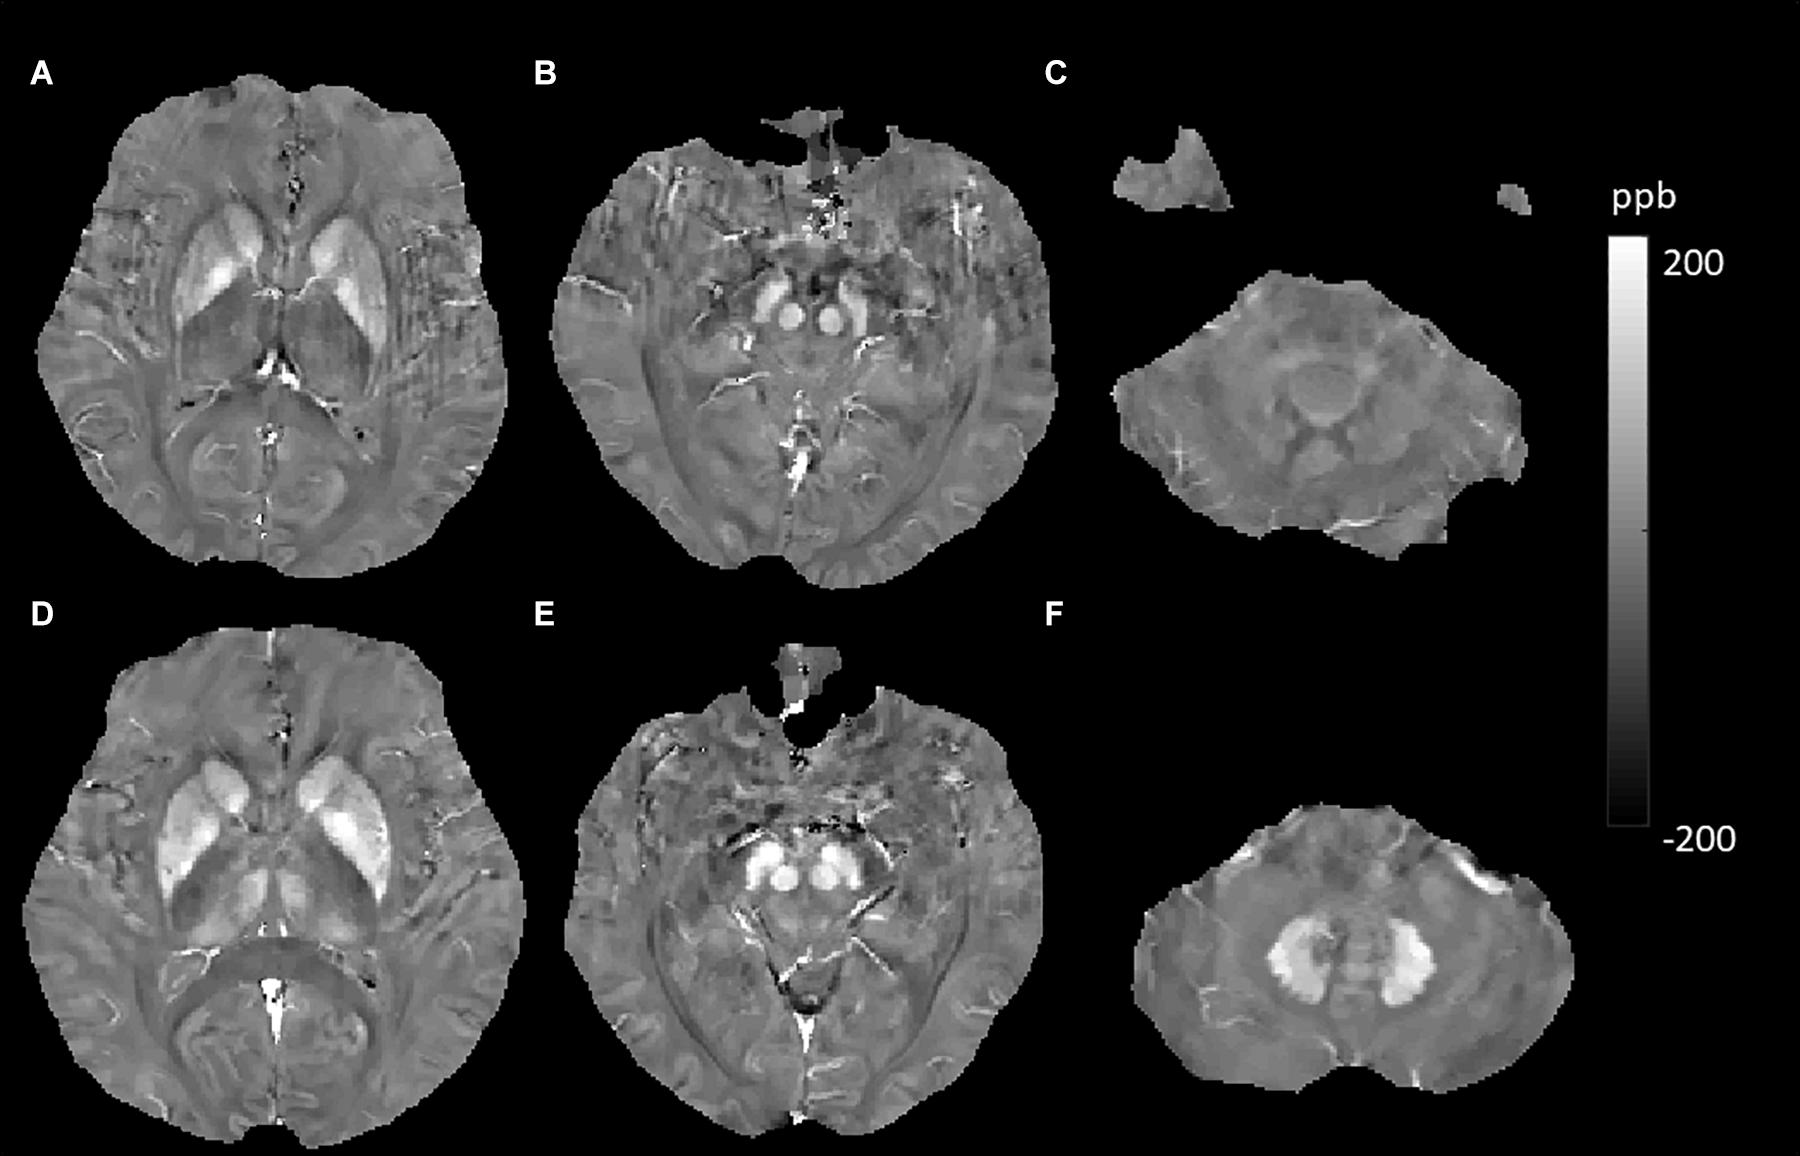
Figure 7. Evolution of susceptibility values with smoking effects in the thalamus. The upper row (A–C) shows susceptibility images of a 56-year-old male non-smoker without hypertension and type 2 diabetes mellitus (T2DM) (first). The bottom row (D–F) shows quantitative susceptibility mapping (QSM) images of a 55-year-old male smoker without hypertension and T2DM (second). The susceptibility value of the thalamus was higher in the second participant than in the first participant.
We found a slightly lower susceptibility value of the Thal than other studies, and some individuals even had negative values. We think that it may be different from the research population and related to the different ROI tracking methods. Low susceptibility in DGM was also reported in two previous QSM analyses (Kim et al., 2017; Uchida et al., 2019). These results may suffer from systematic errors in QSM reconstruction or white noise. Furthermore, all QSM images were generated using the MEDI + 0 method, which uses the value in CSF as a zero reference; this could partly eliminate the effect of systematic error and background white noise.
Previous MRI studies that focused on differences in brain iron levels between sexes and hemispheric locations reported different results (Xu et al., 2008; Gong et al., 2015; Persson et al., 2015; Chai et al., 2019; Peterson et al., 2019). However, our data showed no sex- or hemisphere-related differences in iron levels in any of the regions studied. These heterogeneous results might be caused by the differences in the characteristics of the populations studied. With more data or by using a meta-analysis (reasonably merging data from different studies), we might elucidate the sex- and hemisphere-related effects more powerful and effectively. We did not find that CMBs, WMHs, or cerebral microinfarcts influenced the brain iron levels in the studied regions; we speculated that these common brain MR findings in elderly people were caused by hypertension, T2DM, aging, or other factors related to common vascular risk factors; thus, they did not directly influence brain iron levels.
Our present study has several limitations. First, this is mainly cross-sectional research, and the sample size of the longitudinal study was relatively small. In the future, we will follow up with more individuals and provide more powerful evidence demonstrating which factors influence iron accumulation. Second, we measured iron content in brain regions that have both calcification and iron accumulation (such as the GP), which may have affected the accuracy of the iron content measurement. Third, we did not investigate white matter. Because the brain injury caused by hypertension was closely related to the white matter microstructure, iron metabolism of white matter should be evaluated in more detail in the future. Fourth, other influencing factors, such as body mass index (BMI), serum iron concentrations, and the usage of hypoglycemic drugs and antihypertensive drugs, may also induce changes in regional susceptibility values and should be investigated in the future.
Conclusion
Our data confirmed the significant effects of age on susceptibility values in DGM. The highest rate of iron deposition with aging was observed in the Put. T2DM and hypertension had the opposite effects on iron metabolism in the DGM. Our data confirmed that smokers had increased brain iron levels in the Thal. These results showed that iron metabolism is complicated and that different diseases have different patterns. These results also indicate that in future studies, we should not only pay attention to conventional factors, such as age and sex, but also consider other confounding factors, including disease history and smoking status, to better elucidate the underlying mechanisms of iron-related neurodegenerative diseases.
Data Availability Statement
The raw data supporting the conclusions of this article will be made available by the authors, without undue reservation.
Ethics Statement
The studies involving human participants were reviewed and approved by the Institutional Review Board of Shandong Medical Imaging Research Institute Affiliated to Shandong University. The patients/participants provided their written informed consent to participate in this study.
Author Contributions
JL and LG wrote the main manuscript text. QZ and YC prepared the imaging data, Figures 1–7, and the tables. NZ prepared the clinical data. LG revised the main manuscript text. All the authors reviewed the manuscript.
Funding
This work was supported by grants from the National Natural Science Foundation of China (81800840), the Natural Science Foundation of Shandong Province (ZR2020MH288), Technology Development Plan of Jinan (201302049, 201602206, and 201907052), Medical and Health Science and Technology Development Project of Shandong Province (2016WS0529 and 2019WS544), and Funding for Study Abroad Program by Shandong Province (201803059).
Conflict of Interest
The authors declare that the research was conducted in the absence of any commercial or financial relationships that could be construed as a potential conflict of interest.
Footnotes
References
Acosta-Cabronero, J., Betts, M. J., Cardenas-Blanco, A., Yang, S., and Nestor, P. J. (2016). In vivo MRI mapping of brain iron deposition across the adult lifespan. J. Neurosci. 36, 364–374. doi: 10.1523/jneurosci.1907-15.2016
Amin Al Olama, A., Wason, J. M. S., Tuladhar, A. M., van Leijsen, E. M. C., Koini, M., Hofer, E., et al. (2020). Simple MRI score aids prediction of dementia in cerebral small vessel disease. Neurology 94, e1294–e1302.
Bell, R. D., Winkler, E. A., Singh, I., Sagare, A. P., Deane, R., Wu, Z., et al. (2012). Apolipoprotein E controls cerebrovascular integrity via cyclophilin A. Nature 485, 512–516. doi: 10.1038/nature11087
Bilgic, B., Pfefferbaum, A., Rohlfing, T., Sullivan, E. V., and Adalsteinsson, E. (2012). MRI estimates of brain iron concentration in normal aging using quantitative susceptibility mapping. NeuroImage 59, 2625–2635. doi: 10.1016/j.neuroimage.2011.08.077
Calero, O., Hortigüela, R., Bullido, M. J., and Calero, M. (2009). Apolipoprotein E genotyping method by real time PCR, a fast and cost-effective alternative to the TaqMan and FRET assays. J. Neurosci. Methods 183, 238–240. doi: 10.1016/j.jneumeth.2009.06.033
Carnevale, L., D’Angelosante, V., Landolfi, A., Grillea, G., Selvetella, G., Storto, M., et al. (2018). Brain MRI fiber-tracking reveals white matter alterations in hypertensive patients without damage at conventional neuroimaging. Cardiovasc. Res. 114, 1536–1546. doi: 10.1093/cvr/cvy104
Chai, C., Wang, H., Liu, S., Chu, Z. Q., Li, J., Qian, T., et al. (2019). Increased iron deposition of deep cerebral gray matter structures in hemodialysis patients: a longitudinal study using quantitative susceptibility mapping. J. Magn. Reson. Imaging. 49, 786–799. doi: 10.1002/jmri.26226
Faucheux, B. A., Martin, M. E., Beaumont, C., Hauw, J. J., Agid, Y., and Hirsch, E. C. (2003). Neuromelanin associated redox-active iron is increased in the substantia nigra of patients with Parkinson’s disease. J. Neurochem. 86, 1142–1148. doi: 10.1046/j.1471-4159.2003.01923.x
Fennema-Notestine, C., McEvoy, L. K., Notestine, R., Panizzon, M. S., Yau, W. W., Franz, C. E., et al. (2016). White matter disease in midlife is heritable, related to hypertension, and shares some genetic influence with systolic blood pressure. NeuroImage Clin. 12, 737–745. doi: 10.1016/j.nicl.2016.10.001
Gong, N. J., Wong, C. S., Hui, E. S., Chan, C. C., and Leung, L. M. (2015). Hemisphere, gender and age-related effects on iron deposition in deep gray matter revealed by quantitative susceptibility mapping. NMR Biomed. 28, 1267–1274. doi: 10.1002/nbm.3366
Haller, S., Vernooij, M. W., Kuijer, J. P. A., Larsson, E. M., Jäger, H. R., and Barkhof, F. (2018). Cerebral microbleeds: imaging and clinical significance. Radiology 287, 11–28. doi: 10.1148/radiol.2018170803
Hinoda, T., Fushimi, Y., Okada, T., Fujimoto, K., Liu, C., Yamamoto, A., et al. (2015). Quantitative susceptibility mapping at 3 T and 1.5 T: evaluation of consistency and reproducibility. Invest. Radiol. 50, 522–530. doi: 10.1097/rli.0000000000000159
Hobson, N., Polster, S. P., Cao, Y., Flemming, K., Shu, Y., Huston, J., et al. (2020). Phantom validation of quantitative susceptibility and dynamic contrast-enhanced permeability MR sequences across instruments and sites. J. Magn. Reson. Imaging. 51, 1192–1199. doi: 10.1002/jmri.26927
Jenkinson, M., Bannister, P., Brady, M., and Smith, S. (2002). Improved optimization for the robust and accurate linear registration and motion correction of brain images. Neuroimage 17, 825–841. doi: 10.1006/nimg.2002.1132
Kaisar, M. A., Sivandzade, F., Bhalerao, A., and Cucullo, L. (2018). Conventional and electronic cigarettes dysregulate the expression of iron transporters and detoxifying enzymes at the brain vascular endothelium: in vivo evidence of a gender-specific cellular response to chronic cigarette smoke exposure. Neurosci. Lett. 682, 1–9. doi: 10.1016/j.neulet.2018.05.045
Kim, H. G., Park, S., Rhee, H. Y., Lee, K. M., Ryu, C. W., Rhee, S. J., et al. (2017). Quantitative susceptibility mapping to evaluate the early stage of Alzheimer’s disease. NeuroImage Clin. 16, 429–438. doi: 10.1016/j.nicl.2017.08.019
Kruer, M. C., Hiken, M., Gregory, A., Malandrini, A., Clark, D., Hogarth, P., et al. (2011). Novel histopathologic findings in molecularly-confirmed pantothenate kinase-associated neurodegeneration. Brain 134(Pt 4), 947–958. doi: 10.1093/brain/awr042
Lavezzi, A. M., Mohorovic, L., Alfonsi, G., Corna, M. F., and Matturri, L. (2011). Brain iron accumulation in unexplained fetal and infant death victims with smoker mothers–the possible involvement of maternal methemoglobinemia. BMC Pediatr. 11:62. doi: 10.1186/1471-2431-11-62
Li, W., Wu, B., Batrachenko, A., Bancroft-Wu, V., Morey, R. A., Shashi, V., et al. (2014). Differential developmental trajectories of magnetic susceptibility in human brain gray and white matter over the lifespan. Hum. Brain Mapp. 35, 2698–2713. doi: 10.1002/hbm.22360
Liu, T., Khalidov, I., de Rochefort, L., Spincemaille, P., Liu, J., Tsiouris, A. J., et al. (2011). A novel background field removal method for MRI using projection onto dipole fields (PDF). NMR Biomed. 24, 1129–1136. doi: 10.1002/nbm.1670
Liu, Z., Spincemaille, P., Yao, Y., Zhang, Y., and Wang, Y. (2018). MEDI+0: morphology enabled dipole inversion with automatic uniform cerebrospinal fluid zero reference for quantitative susceptibility mapping. Magn. Reson. Med. 79, 2795–2803. doi: 10.1002/mrm.26946
Maillard, P., Seshadri, S., Beiser, A., Himali, J. J., Au, R., Fletcher, E., et al. (2012). Effects of systolic blood pressure on white-matter integrity in young adults in the Framingham heart study: a cross-sectional study. Lancet Neurol. 11, 1039–1047. doi: 10.1016/s1474-4422(12)70241-7
McCarthy, R. C., Sosa, J. C., Gardeck, A. M., Baez, A. S., Lee, C. H., and Wessling-Resnick, M. (2018). Inflammation-induced iron transport and metabolism by brain microglia. J. Biol. Chem. 293, 7853–7863. doi: 10.1074/jbc.ra118.001949
Montagne, A., Nation, D. A., Sagare, A. P., Barisano, G., Sweeney, M. D., Chakhoyan, A., et al. (2020). APOE4 leads to blood-brain barrier dysfunction predicting cognitive decline. Nature 581, 71–76. doi: 10.1038/s41586-020-2247-3
Park, M., Moon, W. J., Moon, Y., Choi, J. W., Han, S. H., and Wang, Y. (2018). Region-specific susceptibility change in cognitively impaired patients with diabetes mellitus. PLoS One 13:e0205797. doi: 10.1371/journal.pone.0205797
Patenaude, B., Smith, S. M., Kennedy, D. N., and Jenkinson, M. (2011). A Bayesian model of shape and appearance for subcortical brain segmentation. Neuroimage 56, 907–922. doi: 10.1016/j.neuroimage.2011.02.046
Persson, N., Wu, J., Zhang, Q., Liu, T., Shen, J., Bao, R., et al. (2015). Age and sex related differences in subcortical brain iron concentrations among healthy adults. NeuroImage 122, 385–398. doi: 10.1016/j.neuroimage.2015.07.050
Peterson, E. T., Kwon, D., Luna, B., Larsen, B., Prouty, D., De Bellis, M. D., et al. (2019). Distribution of brain iron accrual in adolescence: evidence from cross-sectional and longitudinal analysis. Hum. Brain Mapp. 40, 1480–1495. doi: 10.1002/hbm.24461
Pirpamer, L., Hofer, E., Gesierich, B., De Guio, F., Freudenberger, P., Seiler, S., et al. (2016). Determinants of iron accumulation in the normal aging brain. Neurobiol. Aging 43, 149–155. doi: 10.1016/j.neurobiolaging.2016.04.002
Ramos, P., Santos, A., Pinto, N. R., Mendes, R., Magalhães, T., and Almeida, A. (2014). Iron levels in the human brain: a post-mortem study of anatomical region differences and age-related changes. J. Trace Elem. Med. Biol. 28, 13–17. doi: 10.1016/j.jtemb.2013.08.001
Raz, E., Branson, B., Jensen, J. H., Bester, M., Babb, J. S., Herbert, J., et al. (2015). Relationship between iron accumulation and white matter injury in multiple sclerosis: a case-control study. J. Neurol. 262, 402–409. doi: 10.1007/s00415-014-7569-3
Rizzo, G., and Plazzi, G. (2018). Neuroimaging applications in restless legs syndrome. Int. Rev. Neurobiol. 143, 31–64.
Rodrigue, K. M., Haacke, E. M., and Raz, N. (2011). Differential effects of age and history of hypertension on regional brain volumes and iron. NeuroImage 54, 750–759. doi: 10.1016/j.neuroimage.2010.09.068
Schipper, H. M. (2012). Neurodegeneration with brain iron accumulation – clinical syndromes and neuroimaging. Biochim. Biophys. Acta 1822, 350–360. doi: 10.1016/j.bbadis.2011.06.016
Seger, C. A. (2008). How do the basal ganglia contribute to categorization? their roles in generalization, response selection, and learning via feedback. Neurosci. Biobehav. Rev. 32, 265–278. doi: 10.1016/j.neubiorev.2007.07.010
Smith, S. M. (2002). Fast robust automated brain extraction. Hum. Brain Mapp. 17, 143–155. doi: 10.1002/hbm.10062
Takechi, R., Lam, V., Brook, E., Giles, C., Fimognari, N., Mooranian, A., et al. (2017). Blood-Brain barrier dysfunction precedes cognitive decline and neurodegeneration in diabetic insulin resistant mouse model: an implication for causal link. Front. Aging Neurosci. 9:399. doi: 10.3389/fnagi.2017.00399
Tomlinson, D. R., and Gardiner, N. J. (2008). Glucose neurotoxicity. Nat. Rev. Neurosci. 9, 36–45. doi: 10.1038/nrn2294
Uchida, Y., Kan, H., Sakurai, K., Arai, N., Kato, D., Kawashima, S., et al. (2019). Voxel-based quantitative susceptibility mapping in Parkinson’s disease with mild cognitive impairment. Mov. Disord. 34, 1164–1173. doi: 10.1002/mds.27717
Valdés Hernández, M., Allerhand, M., Glatz, A., Clayson, L., Muñoz Maniega, S., Gow, A., et al. (2016). Do white matter hyperintensities mediate the association between brain iron deposition and cognitive abilities in older people? Eur. J. Neurol. 23, 1202–1209. doi: 10.1111/ene.13006
van Veluw, S. J., Shih, A. Y., Smith, E. E., Chen, C., Schneider, J. A., Wardlaw, J. M., et al. (2017). Detection, risk factors, and functional consequences of cerebral microinfarcts. Lancet Neurol. 16, 730–740. doi: 10.1016/s1474-4422(17)30196-5
Wang, Y., and Liu, T. (2015). Quantitative susceptibility mapping (QSM): decoding MRI data for a tissue magnetic biomarker. Magn. Reson. Med. 73, 82–101. doi: 10.1002/mrm.25358
Wang, Y., Spincemaille, P., Liu, Z., Dimov, A., Deh, K., Li, J., et al. (2017). Clinical quantitative susceptibility mapping (QSM): biometal imaging and its emerging roles in patient care. J. Magn. Reson. Med. 46, 951–971. doi: 10.1002/jmri.25693
Ward, R. J., Zucca, F. A., Duyn, J. H., Crichton, R. R., and Zecca, L. (2014). The role of iron in brain ageing and neurodegenerative disorders. Lancet Neurol. 13, 1045–1060. doi: 10.1016/s1474-4422(14)70117-6
Wardlaw, J. M., Smith, C., and Dichgans, M. (2013b). Mechanisms of sporadic cerebral small vessel disease: insights from neuroimaging. Lancet 12, 483–497. doi: 10.1016/s1474-4422(13)70060-7
Wardlaw, J. M., Smith, E. E., Biessels, G. J., Cordonnier, C., Fazekas, F., Frayne, R., et al. (2013a). Neuroimaging standards for research into small vessel disease and its contribution to ageing and neurodegeneration. Lancet Neurol. 12, 822–838.
Wicaksono, K. P., Fushimi, Y., Nakajima, S., Yokota, Y., Oshima, S., Otani, S., et al. (2020). Two-minute quantitative susceptibility mapping from three-dimensional echo-planar imaging: accuracy, reliability, and detection performance in patients with cerebral microbleeds. Invest. Radiol. 56, 69–77. doi: 10.1097/rli.0000000000000708
Wu, B., Li, W., Guidon, A., and Liu, C. (2012). Whole brain susceptibility mapping using compressed sensing. Magn. Reson. Med. 67, 137–147. doi: 10.1002/mrm.23000
Xu, X., Wang, Q., and Zhang, M. (2008). Age, gender, and hemispheric differences in iron deposition in the human brain: an in vivo MRI study. NeuroImage 40, 35–42. doi: 10.1016/j.neuroimage.2007.11.017
Yang, Q. F., Zhou, L. N., Liu, C., Liu, D. H., Zhang, Y., Li, C., et al. (2018). Brain iron deposition in type 2 diabetes mellitus with and without mild cognitive impairmentan in vivo susceptibility mapping study. Brain Imaging Behav. 12, 1479–1487. doi: 10.1007/s11682-017-9815-7
Yu, X., Du, T., Song, N., He, Q., Shen, Y., Jiang, H., et al. (2013). Decreased iron levels in the temporal cortex in postmortem human brains with Parkinson disease. Neurology 80, 492–495. doi: 10.1212/wnl.0b013e31827f0ebb
Keywords: quantitative susceptibility mapping, multiple factor analysis, magnetic resonance imaging, iron deposition, deep gray matter
Citation: Li J, Zhang Q, Che Y, Zhang N and Guo L (2021) Iron Deposition Characteristics of Deep Gray Matter in Elderly Individuals in the Community Revealed by Quantitative Susceptibility Mapping and Multiple Factor Analysis. Front. Aging Neurosci. 13:611891. doi: 10.3389/fnagi.2021.611891
Received: 29 September 2020; Accepted: 15 March 2021;
Published: 14 April 2021.
Edited by:
David Baglietto-Vargas, University of Malaga, SpainReviewed by:
Mikko T. Huuskonen, University of Southern California, United StatesKristine Freude, University of Copenhagen, Denmark
Copyright © 2021 Li, Zhang, Che, Zhang and Guo. This is an open-access article distributed under the terms of the Creative Commons Attribution License (CC BY). The use, distribution or reproduction in other forums is permitted, provided the original author(s) and the copyright owner(s) are credited and that the original publication in this journal is cited, in accordance with accepted academic practice. No use, distribution or reproduction is permitted which does not comply with these terms.
*Correspondence: Lingfei Guo, Z2xmc2NpQDE2My5jb20=