 Arash Atrsaei1
 Clint Hansen2
 Morad Elshehabi2*
 Susanne Solbrig3,4
 Daniela Berg2,3,4
 Inga Liepelt-Scarfone3,4,5
 Walter Maetzler2
 Kamiar Aminian1
- 1Laboratory of Movement Analysis and Measurement, Ecole Polytechnique Fédérale de Lausanne (EPFL), Lausanne, Switzerland
- 2Department of Neurology, UKSH, Christian-Albrechts-University, Kiel, Germany
- 3Department of Neurodegeneration, Center for Neurology and Hertie-Institute for Clinical Brain Research, University of Tübingen, Tübingen, Germany
- 4German Center for Neurodegenerative Diseases, Tübingen, Germany
- 5IB-Hochschule, Stuttgart, Germany
In chronic disorders such as Parkinson’s disease (PD), fear of falling (FOF) is associated with falls and reduced quality of life. With inertial measurement units (IMUs) and dedicated algorithms, different aspects of mobility can be obtained during supervised tests in the lab and also during daily activities. To our best knowledge, the effect of FOF on mobility has not been investigated in both of these settings simultaneously. Our goal was to evaluate the effect of FOF on the mobility of 26 patients with PD during clinical assessments and 14 days of daily activity monitoring. Parameters related to gait, sit-to-stand transitions, and turns were extracted from IMU signals on the lower back. Fear of falling was assessed using the Falls Efficacy Scale-International (FES-I) and the patients were grouped as with (PD-FOF+) and without FOF (PD-FOF−). Mobility parameters between groups were compared using logistic regression as well as the effect size values obtained using the Wilcoxon rank-sum test. The peak angular velocity of the turn-to-sit transition of the timed-up-and-go (TUG) test had the highest discriminative power between PD-FOF+ and PD-FOF− (r-value of effect size = 0.61). Moreover, PD-FOF+ had a tendency toward lower gait speed at home and a lower amount of walking bouts, especially for shorter walking bouts. The combination of lab and daily activity parameters reached a higher discriminative power [area under the curve (AUC) = 0.75] than each setting alone (AUC = 0.68 in the lab, AUC = 0.54 at home). Comparing the gait speed between the two assessments, the PD-FOF+ showed higher gait speeds in the capacity area compared with their TUG test in the lab. The mobility parameters extracted from both lab and home-based assessments contribute to the detection of FOF in PD. This study adds further evidence to the usefulness of mobility assessments that include different environments and assessment strategies. Although this study was limited in the sample size, it still provides a helpful method to consider the daily activity measurement of the patients with PD into clinical evaluation. The obtained results can help the clinicians with a more accurate prevention and treatment strategy.
Introduction
Parkinson’s disease (PD) is a neurodegenerative disease that is associated with the degeneration of the dopaminergic nerve cells in the substantia nigra (Rai and Singh, 2020). Although currently, there is no cure for PD, treatment options such as Levodopa focus on alleviating PD symptoms. Fear of falling (FOF) is one of the most stressful symptoms for patients with PD (Frazier, 2000; Jonasson et al., 2018), leading to reduced quality of life and social isolation (Howcroft et al., 2013). Moreover, it is the strongest predictor currently known for future falls in this population (Lindholm et al., 2015), which indirectly but strongly associates FOF with the consequence of falls, such as fractures and other injuries (Bloem et al., 2001; Allen et al., 2013).
Fear of falling can be assessed by several scales of which the Falls Efficacy Scale-International (FES-I) is the most widely used to evaluate the concerns of patients about falling during various daily activities (Delbaere et al., 2010). These activities include walking, postural transitions, and turnings during daily activities. Being subjective in nature, FOF can have impacts on mobility that can be measured objectively (Rochat et al., 2010). Therefore, by the assessment of mobility, future falls can be predicted (Delbaere et al., 2004). Inertial measurement units (IMUs) enable the objective evaluation of mobility performance, both during functional tests in the lab and during daily activities. Instrumenting functional tests such as the timed-up-and-go (TUG) and five-time sit-to-stand (5xSTS) with IMUs provide a more in-depth analysis of gait and balance performance (Salarian et al., 2010; Van Lummel et al., 2016). Furthermore, IMUs can also help clinicians to evaluate the performance of patients during daily activities that are often very different from the supervised assessment in the lab and the clinic (Warmerdam et al., 2020).
The potential of IMUs to distinguish patients with falls from those without has already been shown (Howcroft et al., 2013). These studies suggest that the most promising mobility parameters to detect an increased risk of falling are in the area of gait (Marschollek et al., 2009; Greene et al., 2010; Weiss et al., 2011, 2013), postural transition (Najafi et al., 2002; Narayanan et al., 2008; Doheny et al., 2011; Weiss et al., 2011), and turning (Haertner et al., 2018). However, none of these studies investigated the contribution of FOF to these associations in detail.
In community-dwelling older adults, it has been shown that IMU-derived TUG parameters, such as total duration, turning velocity, and sit-to-stand duration, have a significant association with the FES-I total score (Williams and Nyman, 2018). Moreover, it has been shown in patients with PD that FOF affects their turning performance during the TUG test (Haertner et al., 2018). Patients with PD with FOF had significantly lower turning peak angular velocity, and PD fallers had significantly lower gait speed, compared to non-fallers (Latt et al., 2009). A drawback of the previous studies is that the performance of the participants has been studied mostly during assessments performed in the clinic while the association between FOF and the performance of the investigated cohorts during daily activities remains unknown. This is an enormous disadvantage, as daily activity and mobility are influenced by psychological and environmental factors that cannot be effectively investigated in a supervised environment (Owsley and McGwin, 2004; Feltz and Payment, 2005; Rudman et al., 2006; Kaspar et al., 2015; Evers et al., 2020; Shah et al., 2020b; Del Din et al., 2021; Maetzler et al., 2021).
Based on these findings, the first goal of this study was to determine whether there exist mobility differences between patients with PD with (PD-FOF+) and without FOF (PD-FOF−). For this purpose, we compared the IMU-derived gait, sit-to-stand, and turning parameters from the respective lab and daily activity assessments. The second goal was to determine whether daily activity assessment can complement lab assessment in differentiating PD-FOF+ from PD-FOF−. The third goal was to investigate the associations between the same parameters obtained during these two assessment settings and study their differences in PD-FOF+ and PD-FOF−.
Materials and Methods
Participants and Study Cohort
Twenty-six participants with PD were included in the analysis. The inclusion criteria were age between 50 and 85 years, PD based on the United Kingdom Brain-Bank Society criteria, and the ability to understand and communicate well with the investigator. Patients with dementia were excluded from the study (Emre et al., 2007). All participants gave their written informed consent and the study was approved by the ethics committee of the Medical Faculty of the University of Tübingen (protocol no. 686/2013BO1) (Haertner et al., 2018).
Lab Assessments
Lab assessments were performed during ON medication state and included the Unified Parkinson’s Disease Rating Scale (UPDRS-III) (Goetz et al., 2008) and the Hoehn and Yahr (H&Y) score (Hoehn and Yahr, 2001). Fear of falling was assessed with the FES-I (Yardley et al., 2005). An FES-I score > 19 was defined as the presence of FOF (Delbaere et al., 2010). The patients were also evaluated for depressive symptoms (Beck’s Depression Inventory, BDI), the amount of Levodopa equivalent dose, and quality of life (Parkinson’s Disease Questionnaire, PDQ-39).
For the mobility assessments, the participants were equipped with Mobility Lab® (APDM, Portland, United States) IMUs on the lower back and the two feet. The sampling frequency was set at 128 Hz. For the analysis, accelerometer and gyroscope data were used. All participants performed first a 7-m TUG test at their convenient speed. The TUG test includes a sit-to-stand movement, a walking phase, a 180° turn, a walking back phase, and a turn-to-sit movement. The turn-to-sit transition consists of a simultaneously performed stand-to-sit transition and a 180° turn. Then, the participants performed the 5xSTS test once with their preferred speed and once as fast as possible. Rest periods were given between these three lab mobility tests.
For the analysis of the TUG test, the lower back IMU was used to analyze the sit-to-stand and stand-to-sit postural transitions with a previously validated algorithm (Atrsaei et al., 2020). The beginning of the sit-to-stand (tb,SiSt) and the end of the stand-to-sit (te,StSi) times, as well as the sit-to-stand peak power (PTUG) were extracted. The two turns within the TUG were analyzed by another validated algorithm, using the data from the lower back IMU (Salarian et al., 2010). The end of the second turn (te,Turn2), as well as the maximum angular velocities around the vertical axis of each of the two turns (ωTUG,1 and ωTUG,2) were extracted. The total time of the TUG was calculated by subtracting the start of the sit-to-stand from the maximum value between the end of the second turn and the end of stand-to-sit: TTUG = Max(te,StSi,te,Turn2)−tb,SiSt.
The IMUs on the lower back and feet were used to extract the instantaneous gait speed during the TUG test based on the algorithm introduced in Atrsaei et al. (2021b). The mean gait speed of the whole test was calculated (VTUG,avg).
The 5xSTS tests were analyzed by the algorithm given in Atrsaei et al. (2020), using the data obtained from the lower back IMU. The following parameters were calculated: total time and mean sit-to-stand peak power of the normal (T5xSTS,N, P5xSTS,N) and the fast 5xSTS (T5xSTS,F,P5xSTS,F).
Mobility Assessment During Daily Activities
The participants were equipped with a RehaGait® IMU (Hasomed, Magdeburg, Germany) in an elastic belt on the lower back and were asked to wear the system for 14 days. The patients were instructed to plug the sensor into a personal computer to charge during the night. The following morning, the patients were asked to unplug the sensor and wear it. The data recording was started automatically right after the sensor is unplugged. Measurement phases of less than 6 h/day were discarded from the analysis. The following mobility parameters were extracted for each patient.
Gait
Walking bouts were detected by the algorithm introduced in Atrsaei et al. (2021b). Instantaneous gait speed, i.e., gait speed at each second was calculated (Atrsaei et al., 2021b). Instances in which the gait speed was less than 0.2 m/s were not included in the walking bouts as these instances can be considered as “non-gait” periods (Atrsaei et al., 2021a). Walking bouts of less than 15 s were excluded from the analysis, to have a more steady-state gait and prevent non-locomotion movements to be detected (Atrsaei et al., 2021a). The total duration of walking for each day was obtained and was expressed as the percentage of the measurement duration of the respective day. Over all the days of measurement, the minimum (GaitALL,min), average (GaitALL,avg), and maximum (GaitALL,max) values of the walking percent were calculated. For instance, when a participant was assessed over a period of 5 days, and walked 5, 10, 15, 20, and 25% of the entire daily assessment periods, respectively, the GaitALL,min, GaitALL,avg, and GaitALL,max would be 5, 15, and 25%, respectively.
The walking bouts were divided into short (between 15 and 30 s), medium (between 30 and 60 s), and long ones (longer than 60 s). Again, the minimum, average, and maximum values of the walking percentage per day for each type of walking bout were calculated. The indices SWB, MWB, and LWB were used to describe short, medium, and long walking bouts.
Over all the days of measurement stacked together, the gait speed distribution during all the walking bouts (VALL), as well as during the short (VSWB), medium (VMWB), and long (VLWB) walking bouts were obtained separately. For each of these four distributions, the median, and the 95th percentile values were calculated.
There is evidence in the literature that gait speed often has a bimodal distribution during daily activities (Van Ancum et al., 2019; Atrsaei et al., 2021a). The first mode represents the lower preferred gait speed of the participants while the second mode represents the higher preferred gait speed of the participants (Van Ancum et al., 2019). Therefore, we also extracted the first and second modes of VALL distribution as Vμ _1 and Vμ _2, respectively.
Sit-to-Stand Transitions
Sit-to-stand transitions were detected during daily activities with a validated algorithm (Atrsaei et al., 2020). For each day, the number of sit-to-stands per hour was obtained. The minimum (SiStmin), average (SiStavg), and maximum (SiStmax) number of sit-to-stands per hour were calculated over all days of measurement. Furthermore, for each sit-to-stand, the vertical peak power was determined as this parameter is a predictor of prospective falls (Regterschot et al., 2014). The distribution of all the peak power values over all the days of measurement stacked together was obtained as PH. The median of this distribution (PH,P50) and its 95th percentile (PH,P95) were calculated.
Turns
Turns were detected during daily activities with a validated algorithm (El-Gohary et al., 2014). The number of turns per hour was determined for each day. The minimum (Turnsmin), average (Turnsavg), and maximum (Turnsmax) number of turns per hour was also calculated over all the days of measurement. For each turn, the peak angular velocity around the vertical direction was obtained. The distribution of all the peak angular velocity values over all the days of measurement stacked together were obtained as ωH. The median (ωH,P50) and 95th percentile (ωH,P95) of this distribution were calculated.
Comparison Between PD-FOF+ and PD-FOF−
All the mobility parameters extracted from the lab and daily activity assessments were compared between PD-FOF+ and PD-FOF−. To exclude the potential differences due to gender and PD stage, the values were adjusted for gender and UPDRS-III with a multivariable logistic regression model. This analysis determines the odds of being PD-FOF+ considering gender (binary value, 0 for male, 1 for female), UPDRS-III (real-valued), and one of the mobility parameters (real-valued) explained in the previous section as independent variables. Moreover, the effect size (ES) (obtained by the r-value) was obtained by dividing the Wilcoxon rank-sum test statistics by the square root of the population (Ivarsson et al., 2013). An r value of about 0.1 indicates a small, 0.3 a medium, and 0.5 a large effect size, respectively (Cohen, 1992).
Fear of Falling Classification
To determine the predictive power of the extracted parameters in classifying PD-FOF+ and PD- FOF−, three classifiers based on a decision tree were used. Each classifier was trained based on one of the three sets of features mentioned below:
• 𝔽1, Lab and daily activity (selected features): From all the parameters extracted from the lab and daily activity measurements, we selected those with an absolute r value of higher than 0.2. A backward elimination method was further applied to select the optimal features (Dadashi et al., 2014).
• 𝔽2, Lab: From the set 𝔽1, the parameters from the lab assessment were used.
• 𝔽3, Daily activity: From the set 𝔽1, the parameters from daily activity assessment were used.
The decision tree approach was used due to its proven performance in classifying patient populations based on mobility biomarkers (Millor et al., 2017; Rehman et al., 2019). For all the three sets mentioned above, cross-validation was performed based on the leave-one subject-out approach. The classification performance was evaluated by sensitivity, specificity, precision, accuracy, and area under the receiver operating characteristic curve (AUC) metrics.
Lab Versus Daily Activity Assessment
For each of the two groups, the gait speed, sit-to-stand peak power, and peak angular velocity were compared between lab and daily activities. For each parameter, a paired comparison was performed with the Wilcoxon sign rank test, and the significance level was set at p = 0.05. Pearson’s correlation coefficient (ρ) was also obtained. A correlation coefficient < 0.5 was considered as low, between 0.5 and 0.7 as moderate, and >0.7 as high (Mukaka, 2012).
Moreover, each parameter obtained during the daily activities was divided by the same parameter obtained during the lab assessment. The new unitless parameters were compared between PD-FOF+ and PD-FOF− by the Wilcoxon rank-sum test.
Results
Comparison Between PD-FOF+ and PD-FOF−
The characteristics of the participants are shown in Table 1. Of the 26 participants, nine had an FES-I score > 19. The PD-FOF+ showed a trend toward higher UPDRS-III scores in comparison with the PD-FOF−. The Levodopa equivalent dose, as well as the BDI score, was not significantly different between the two groups. However, the PDQ scale, as well as its mobility subpart, were significantly different between PD-FOF+ and PD-FOF− (p < 0.001 and = 0.0014, respectively).
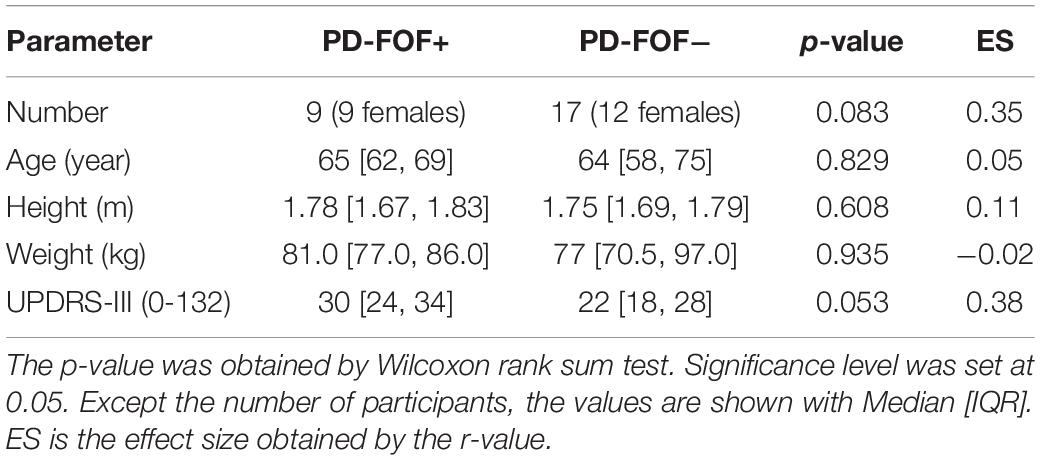
Table 1. Comparison of PD-FOF+ and PD-FOF−.
Table 2 presents results from the comparison of the lab and daily activity mobility parameters between PD-FOF+ and PD-FOF−. After the adjustment for UPDRS-III and gender, PD-FOF+ participants had significantly longer TTUG accompanied by slower ωTUG,1, ωTUG,2, and a slower VTUG,avg which, however, did not reach significance.
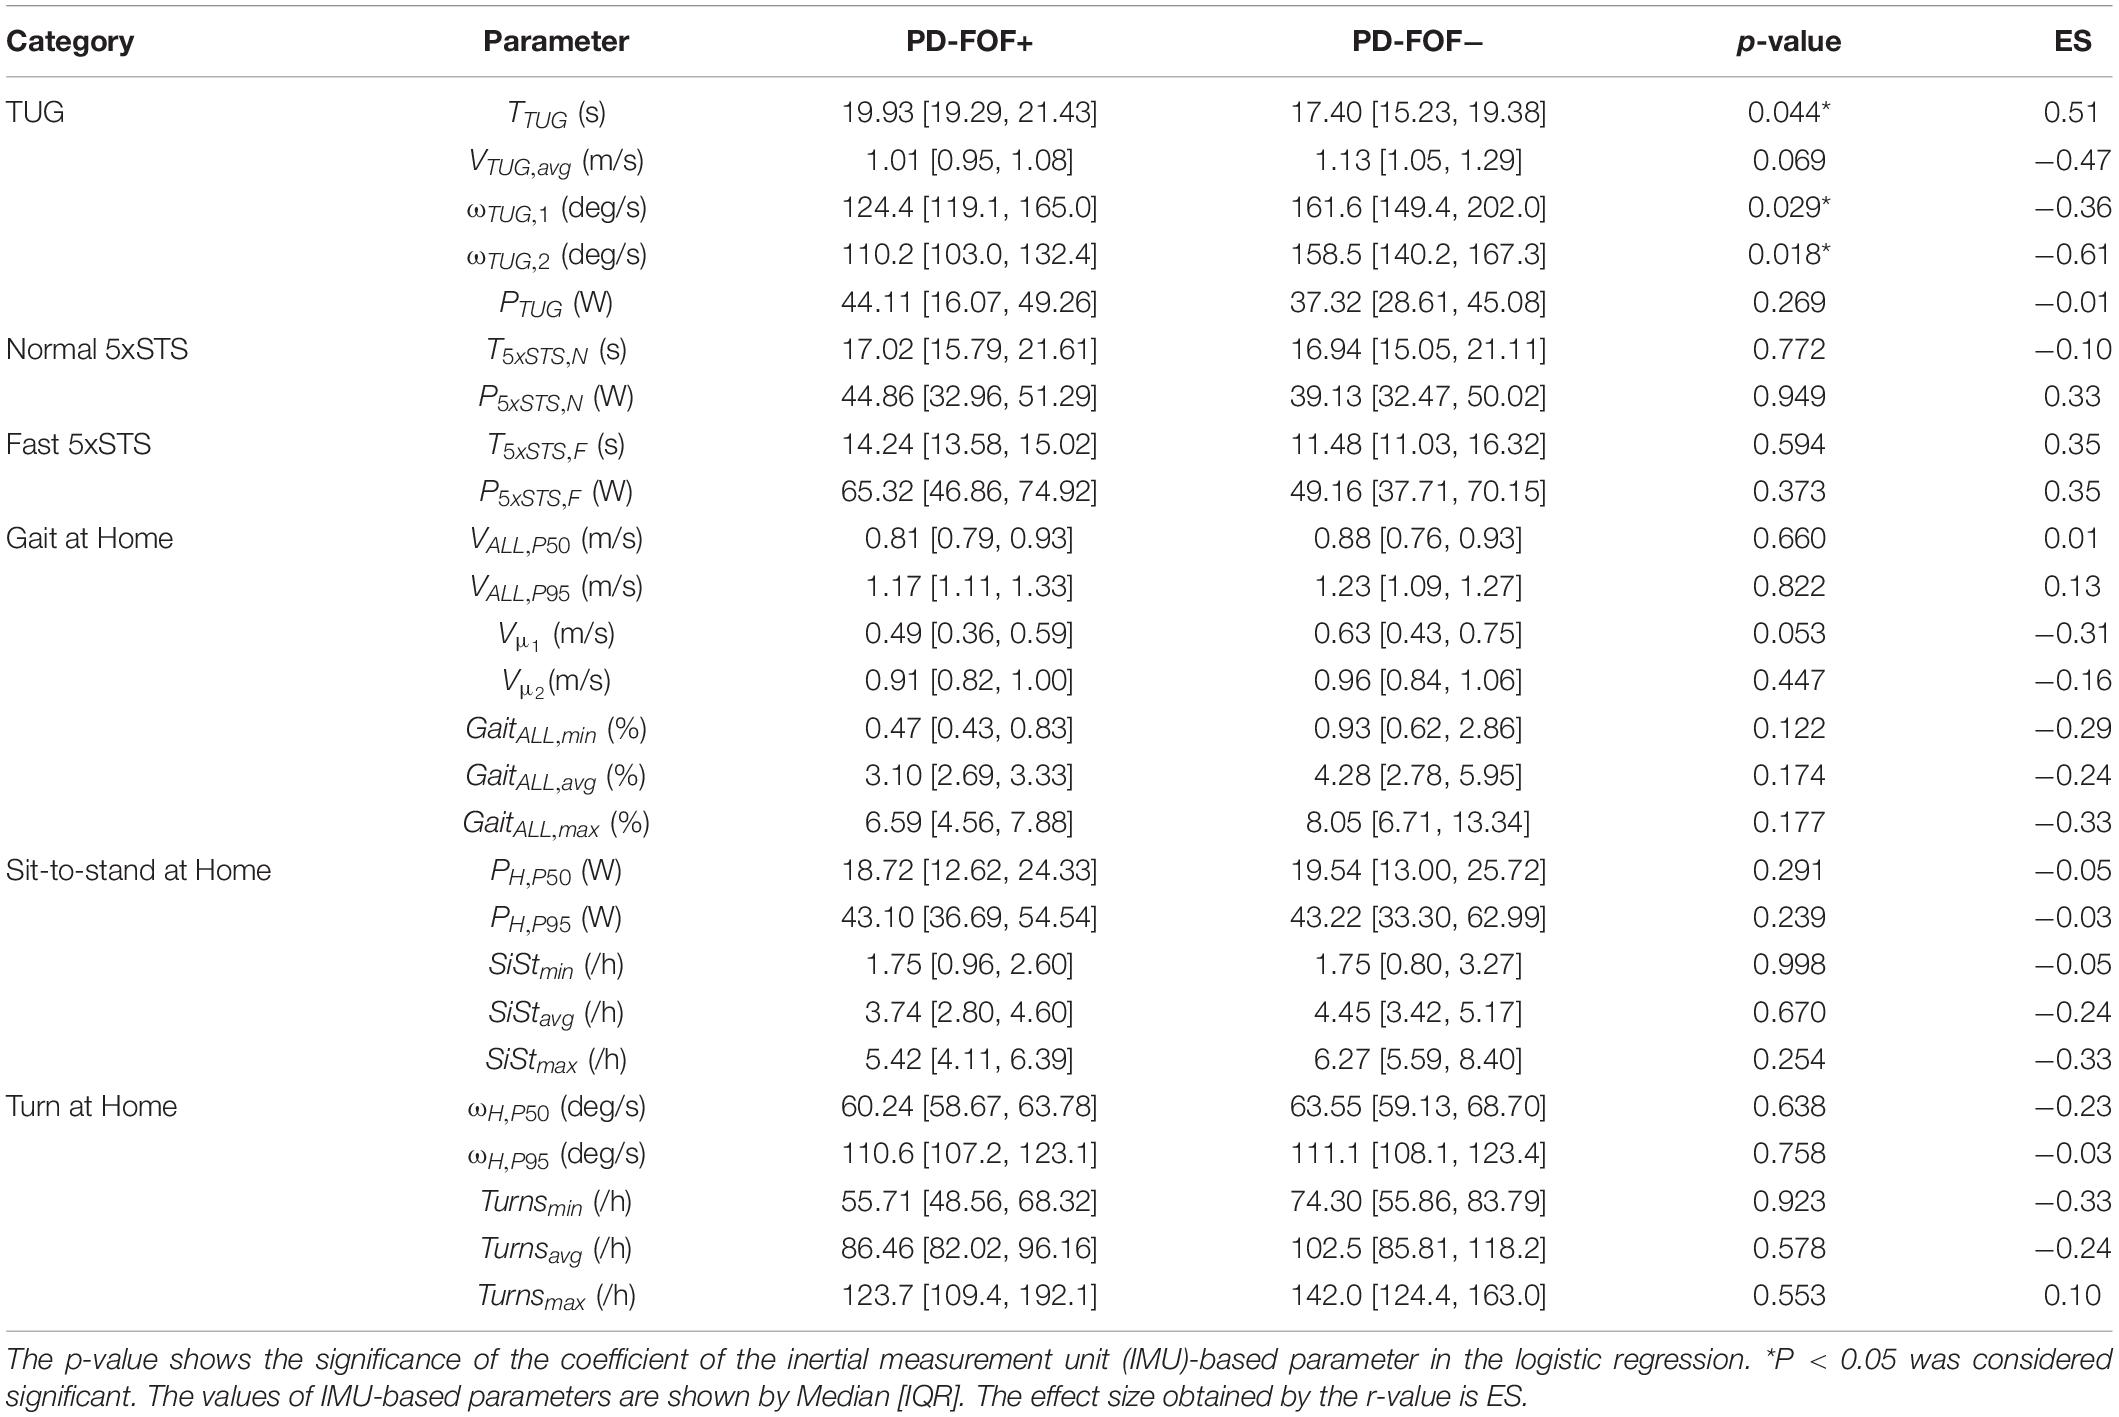
Table 2. Comparison of the extracted parameter between the group with fear of falling (FOF) (PD-FOF+) and without (PD-FOF−).
Several parameters were slightly different between the two populations although the logistic regressions showed no statistical significance. For instance, compared with PD- FOF−, PD-FOF+ had, on average, lower gait speeds during the TUG (VTUG,avg) and daily activities (Vμ _1), longer T5xSTS,F, lower percentages of walking bouts (i.e., GaitALL,min, GaitALL,avg, and GaitALL,max), and lower numbers of sit-to-stands (SiStmax) and turns (Turnsmin) per hour during daily activities.
No significant differences were found between the two groups when dividing the walking bouts based on their duration (Table 3). However, PD-FOF+ tended to have a lower percentage of short (e.g., GaitSWB,max) and long (e.g., GaitLWB,max) walking bouts, compared with PD-FOF− (Table 3).
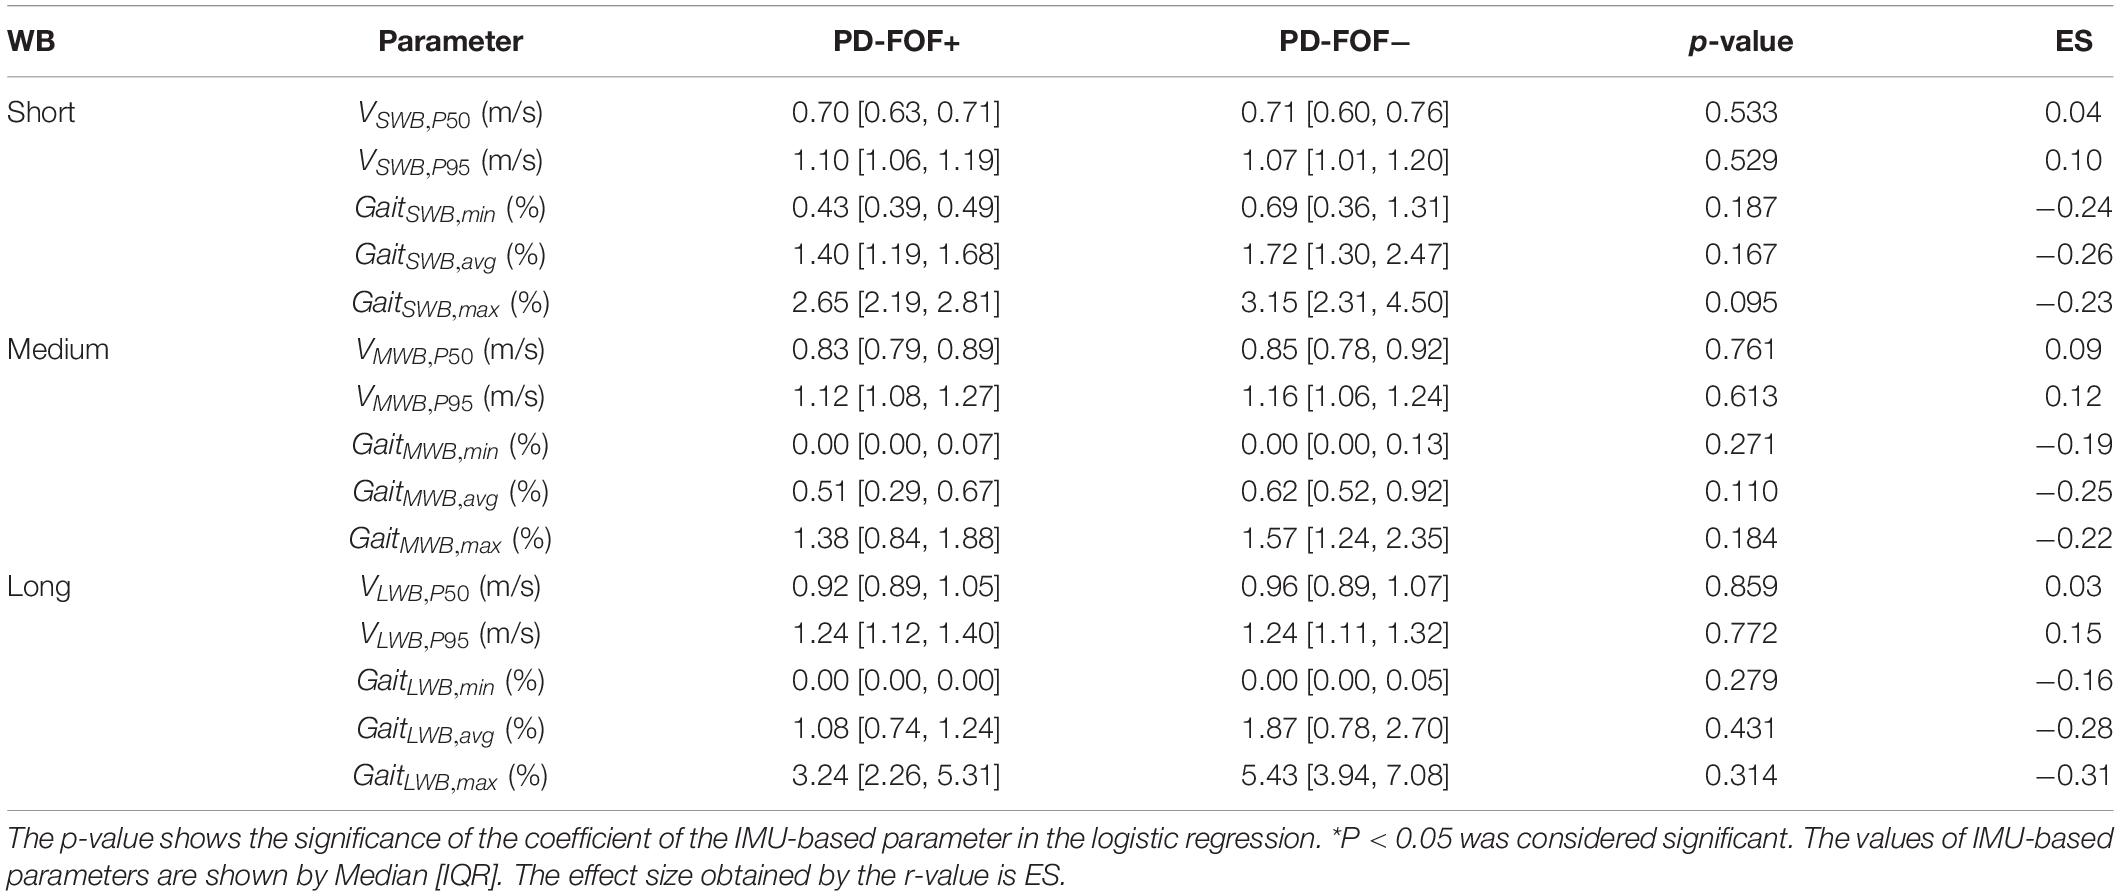
Table 3. Comparison of the extracted parameter for short, medium, and long walking bouts (WB) between PD-FOF+ and PD-FOF−.
The effect sizes of the parameters are shown in Table 2 and Figure 1 in descending order. As a general note, lab-extracted parameters showed higher effect sizes than those extracted from the daily activity assessment. ωTUG,2 had the highest effect size, followed by other parameters extracted from the TUG test (except PTUG which had a very small effect size, see also Figure 1). ωTUG,1 had a lower effect size than ωTUG,2. Directly after the TUG test, parameters ranked the T5xSTS,F and P5xSTS,F from the 5xSTS test with fast speed. The effect sizes of the parameters from the 5xSTS with normal speed (T5xSTS,N and P5xSTS,N) were lower than those from the fast version. T5xSTS,N had a smaller effect size compared with P5xSTS,N. GaitALL,max, SiStmax, Turnsmin, and Vμ _1 had the highest effect sizes among the daily activity parameters, and the median gait speed (VALL,P50) the lowest.
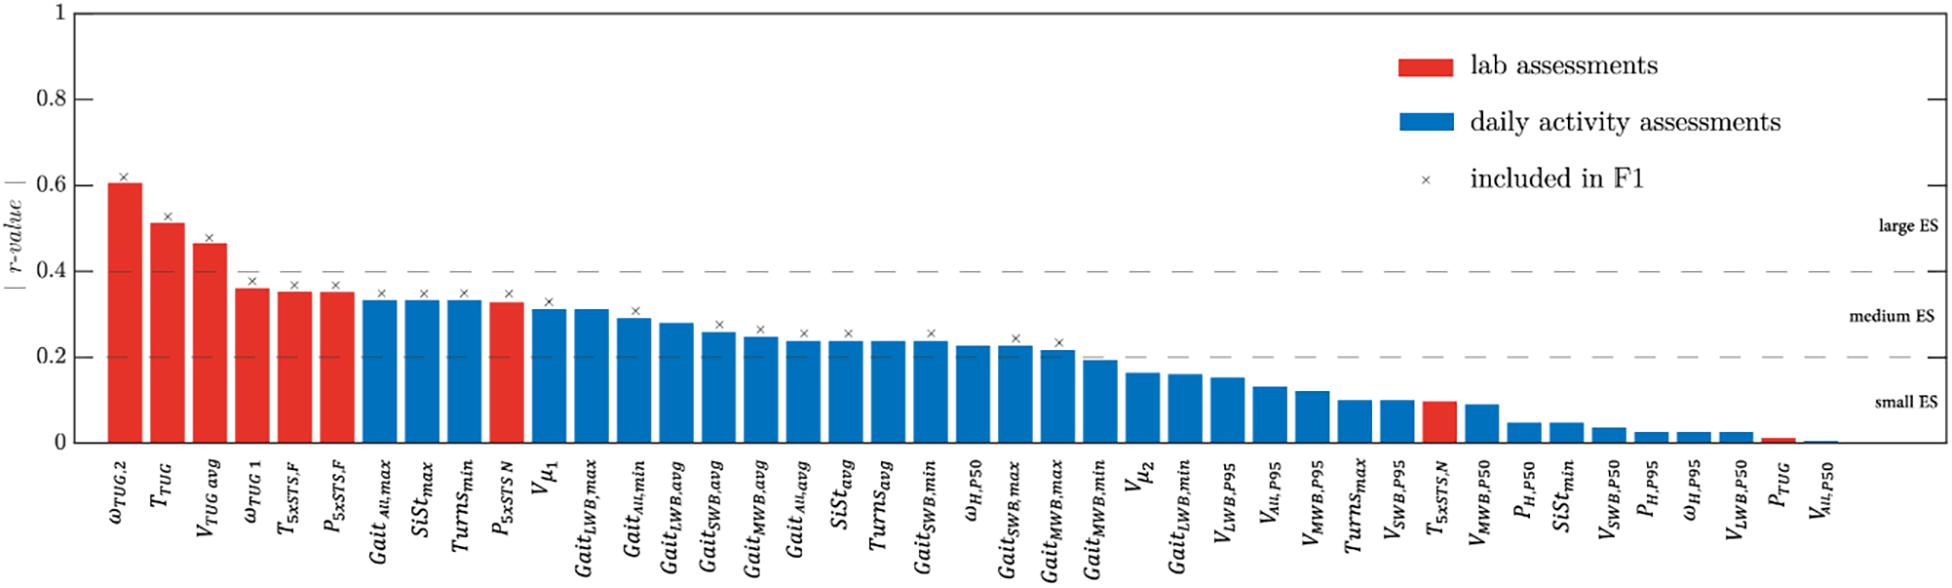
Figure 1. Absolute effect size values (r-value) of the mobility parameters extracted from the lab (in red) and daily activity assessments (in blue). The features selected for the 𝔽1 feature set are marked by a cross (see section “Fear of Falling Classification”).
Fear of Falling Classification
Out of the 41 mobility parameters, 23 had an effect size > 0.2 (Figure 1). From these parameters, 19 features (used for machine learning-based classifier; marked with x in Figure 1) were selected by the backward elimination method and used for the 𝔽1 set.
Based on the three sets of features mentioned in the “Fear of Falling Classification” section, the results of the classification are shown in Table 4. The best performance was achieved based on set 𝔽1 which was a combination of features obtained from the lab and daily activity assessments (AUC = 0.75). The accuracy of this set was higher than when using lab (𝔽2, AUC = 0.68) or daily activity (𝔽3, AUC = 0.54) features alone.
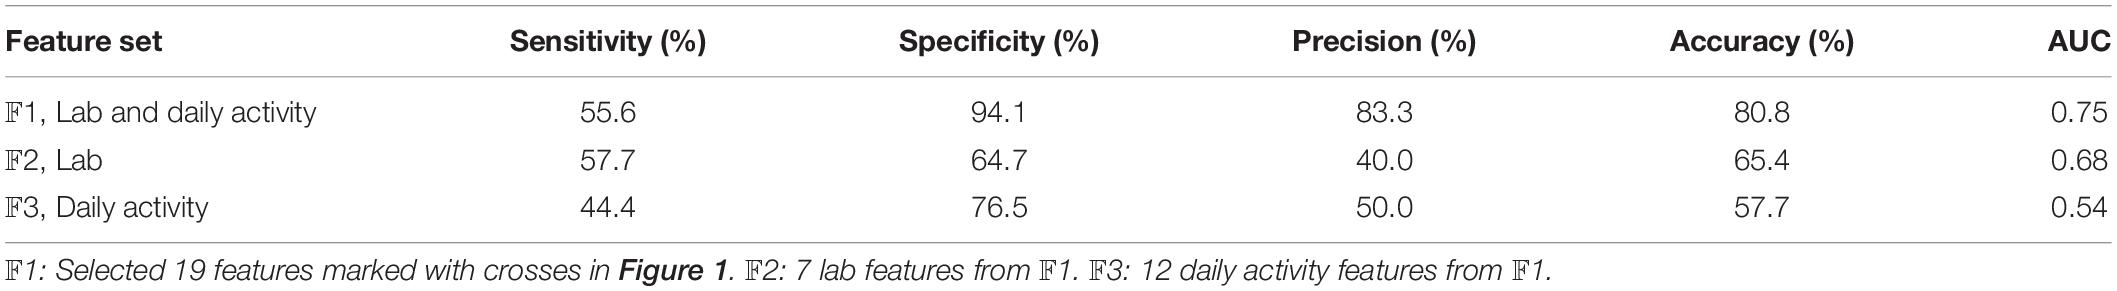
Table 4. The performance metrics of the classification of PD-FOF+ vs. PD-FOF−.
The sensitivity of the classification based on the features from the lab (𝔽2) was higher than that obtained from the daily activity features, while the specificity of the classification based on daily activity features (𝔽3) was higher. Moreover, 𝔽2 features achieved higher accuracy and AUC values, than the 𝔽3 features.
Lab Versus Daily Activity Assessment
The results of the paired comparison between lab and daily activity assessments for gait speed, sit-to-stand peak power, and turning peak angular velocity are shown in Table 5. In the PD-FOF+ group, no significant correlations were found between lab and daily activity assessments concerning gait speed. Moreover, PD-FOF+ had significantly higher gait speeds at the 95th percentile of their walking speed distributions compared with the lab (VALL,P95, VSWB,P95, VMWB,P95, and VLWB,P95). In the PD-FOF− group, VTUG,avg had a significant but low correlation with VH,P95 (ρ = 0.48). A high correlation was also observed between VTUG,avg and Vμ _2 (ρ = 0.70). Moderate correlations were observed between VTUG,avg and a gait speed of medium (VMWB,P95) and long (VLWB,P50) walking bouts (ρ = 0.59 and ρ = 0.57, respectively). The PD-FOF− group walked significantly faster during the TUG than during their daily activities.
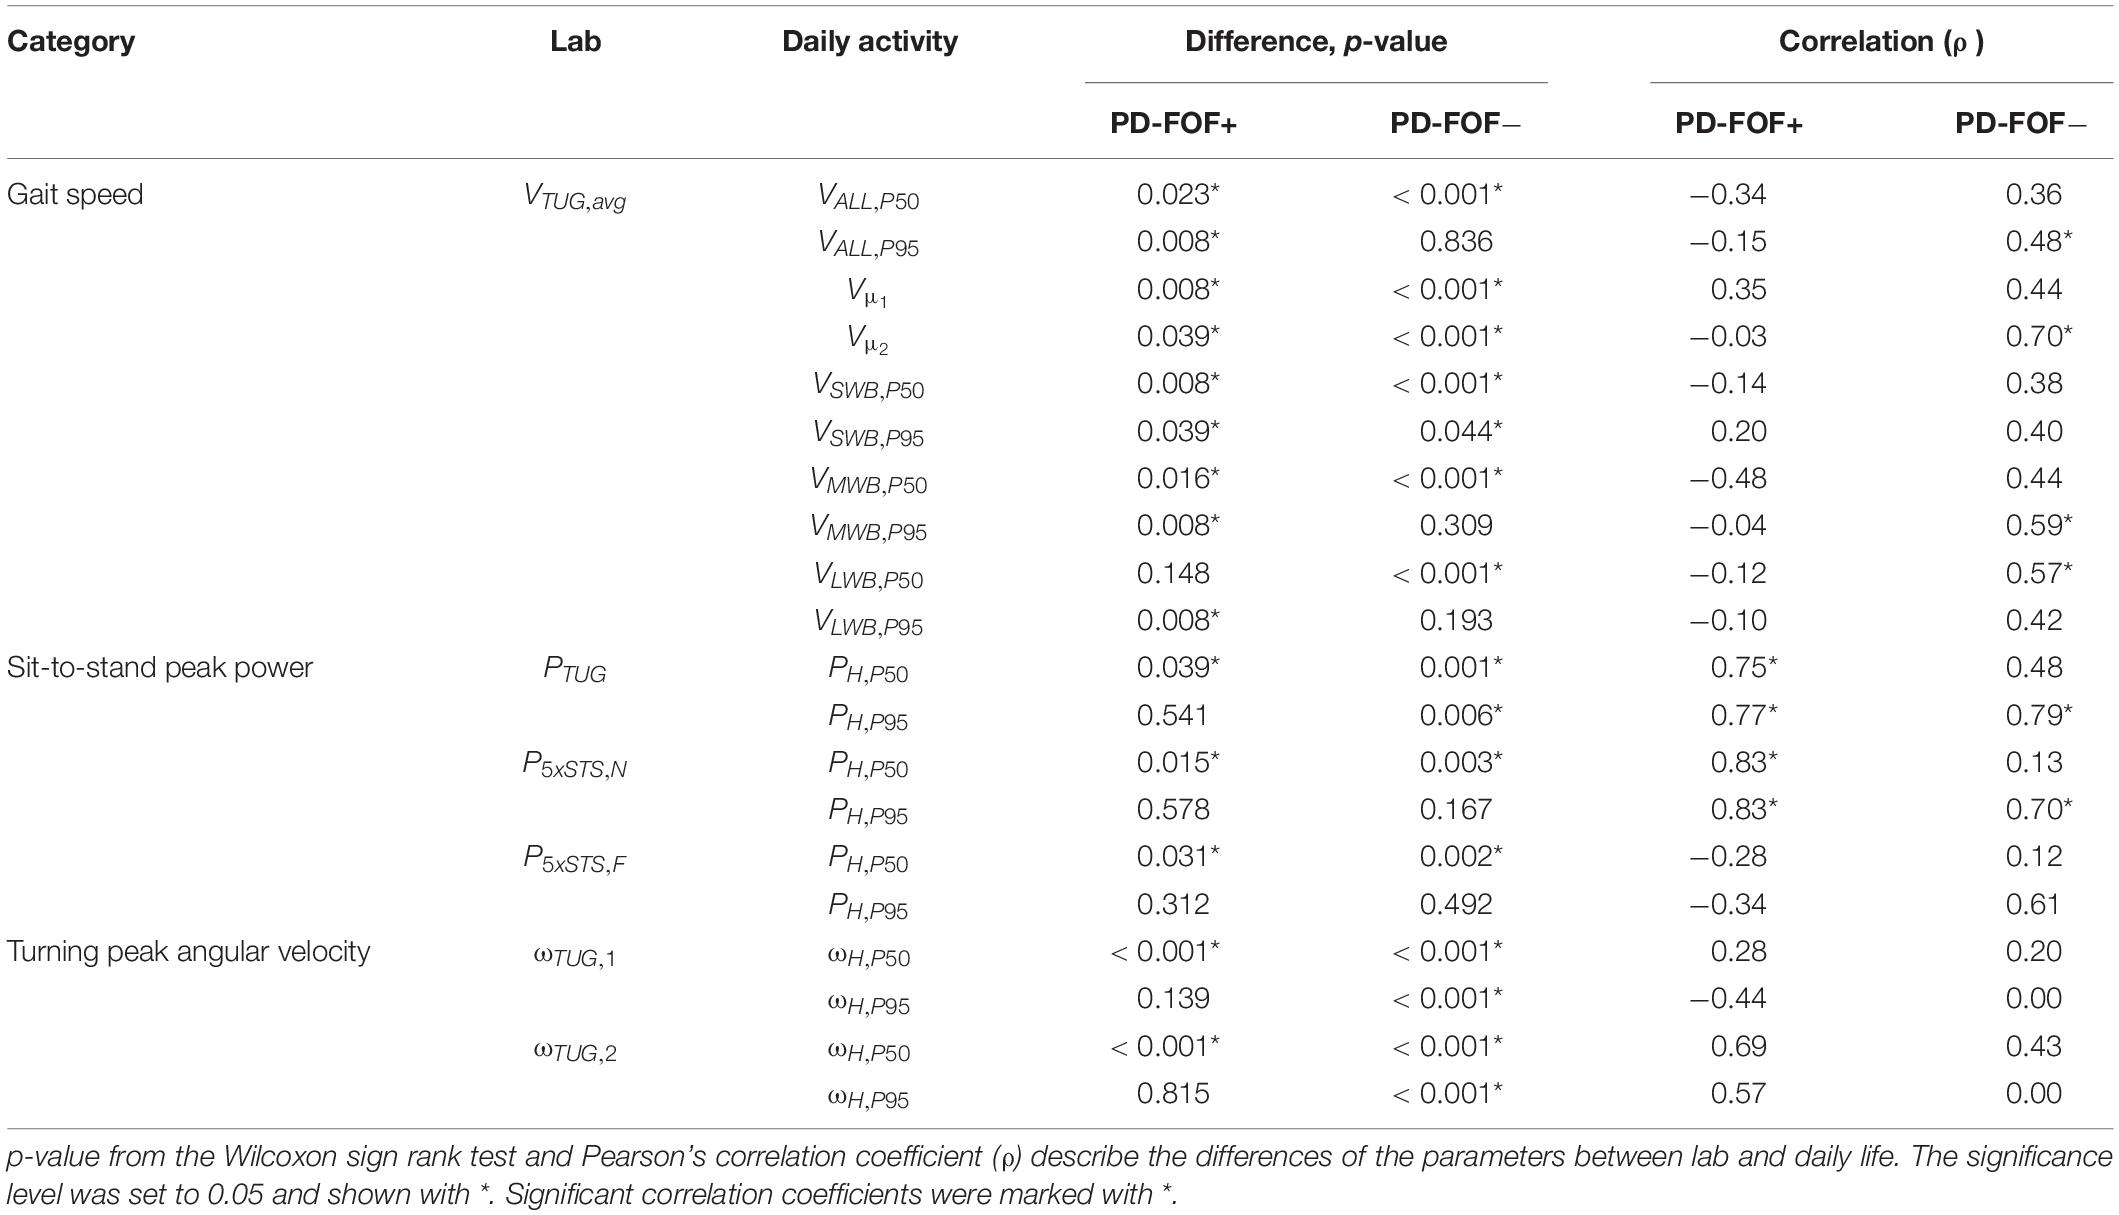
Table 5. Paired comparison of the parameters between lab and home.
Regarding the sit-to-stand peak power, a high and significant correlation was found between PTUG and PH,P95 for both groups (PD-FOF+, ρ = 0.77; PD- FOF−, ρ = 0.79). In both groups, P5xSTS,N had a high and significant correlation with PH,P95 (PD-FOF+, ρ = 0.83; PD- FOF−, ρ = 0.70). No significant correlations were found between the 5xSTS with fast speed and daily activity assessment. Both groups had significantly higher peak power during the 5xSTS tests compared with PH,P50 during daily activities. However, PH,P95 values were not significantly different from the 5xSTS tests in the lab.
Finally, for turning peak angular velocity, no significant correlations were found between the lab and daily activities in any group. For PD-FOF+, there were no significant differences between ωH,P95 and both turns of the TUG. However, PD-FOF− had faster turns in the lab, compared with the home environment.
For a better representation of lab versus daily activity parameters, the gait speed, sit-to-stand peak power, and turning peak angular velocity are presented in Figure 2 as unitless ratios (daily activity parameter divided by the respective lab parameter). Most of the ratios were less than 1 (i.e., lower value of a parameter in the daily life environment). However, a few parameters, e.g., , had values > 1, preferentially in the PD-FOF+ group. Moreover, when comparing PD-FOF+ with PD- FOF−, significant differences were found for the ratios , , , , , and , with higher ratios in the PD-FOF+ group.
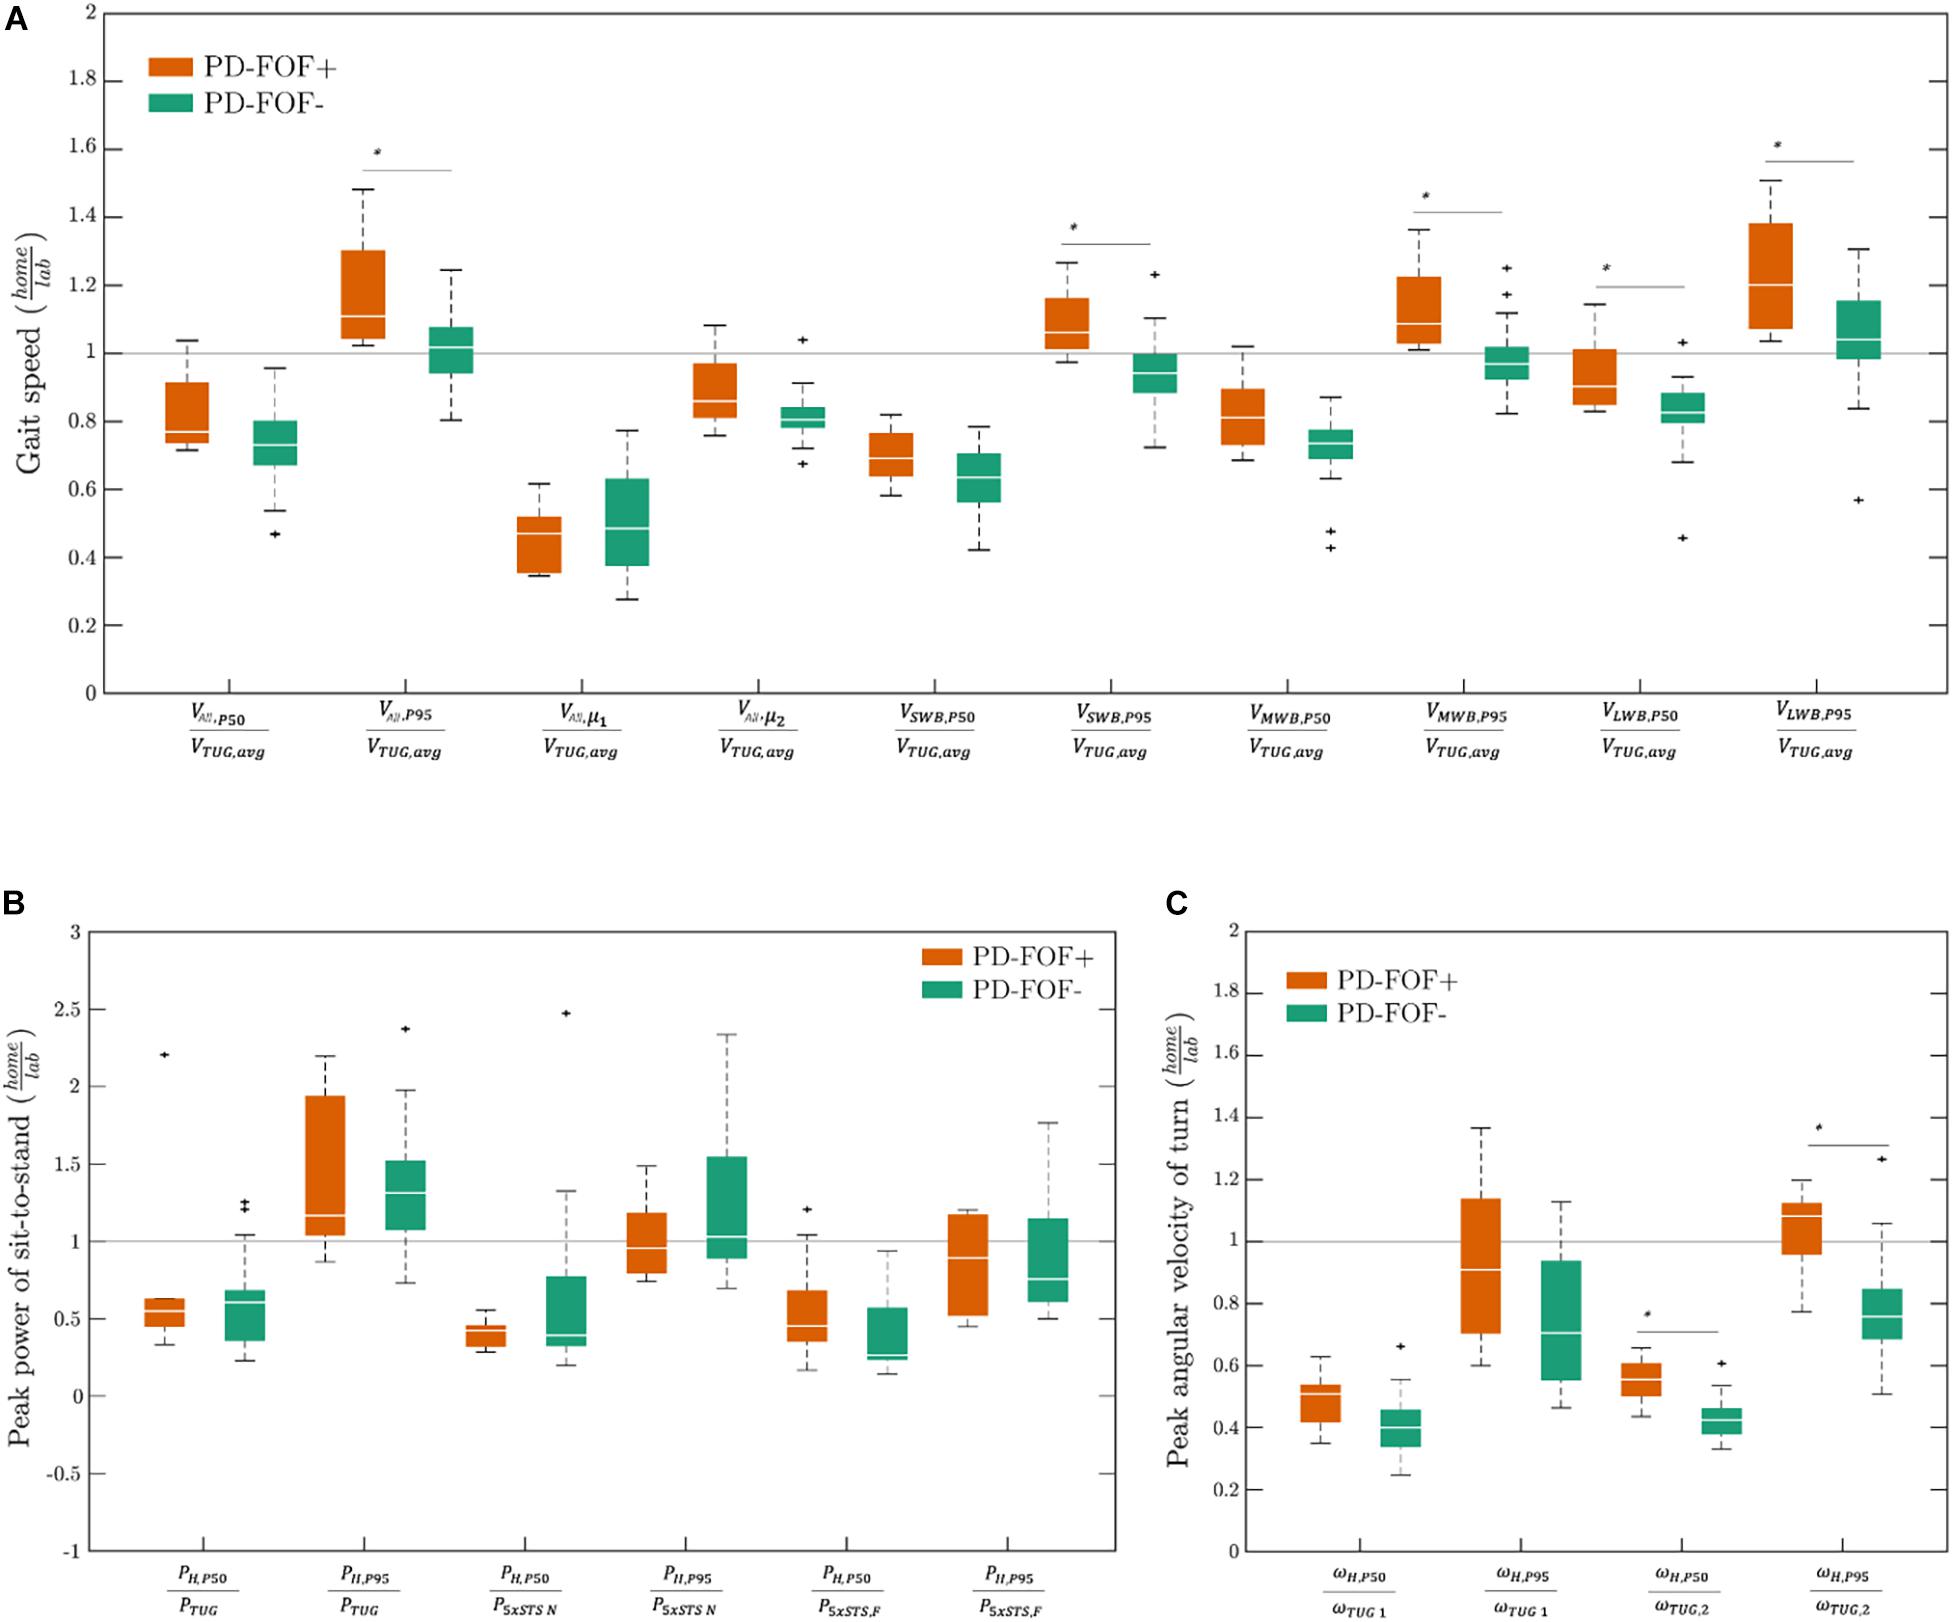
Figure 2. Unitless daily activity divided by lab parameter ratios of (A) gait speed, (B) sit-to-stand peak power, and (C) turning peak angular velocity in PD-FOF+ and PD-FOF−. Differences between the groups were analyzed by the Wilcoxon rank-sum test. Only significant differences were shown on the plots ∗p < 0.05.
Discussion
Most of the previous studies on this topic that have shown mobility-associated differences between PD-FOF+ and PD-FOF− have investigated their participants only in the lab. In this study, thanks to IMUs and dedicated algorithms, several mobility parameters were collected from patients with PD with and without FOF, when performing functional tests in the lab and living in their usual environment. The effect of FOF was investigated by quantifying the changes in mobility parameters between lab and daily life. The discriminative power between PD-FOF+ and PD-FOF− was shown by a logistic regression model considering each setting separately and in combination. And finally, the association between the lab and daily activity setting was studied by considering their correlation.
Regarding the effect of FOF on mobility, PD-FOF+ needed more time to perform the TUG test than the PD- FOF−, which was –at least partly- explained by the slower performance of the two turns included in this test (Table 2). This supports previous findings (Bryant et al., 2014; Haertner et al., 2018; Abou et al., 2021) and suggests that PD-FOF+ suffer from increased fear, especially during turns. This fear may be justified, e.g., through increased dysbalance or other constraints associated with FOF (Pourghayoomi et al., 2020). The larger difference between the two groups in the second turn, which also includes a stand- or walk-to-sit movement, may also argue for the different balance capacities between the groups. This argument is further supported by the slower peak angular velocity during the second turn compared with the first turn in the PD-FOF+ group.
In contrast to the evidence in the literature (Bryant et al., 2014), we did not observe a significant difference in gait speed between PD-FOF+ and PD-FOF− during the TUG test (VTUG,avg). As the r-value showed a large effect size for this parameter in both groups, we hypothesize that PD severity rather than FOF has a particular influence on this parameter. We performed a Wilcoxon rank-sum test on VTUG,avg without adjusting for the aforementioned confounders, and obtained a significant difference between the PD-FOF+ and PD-FOF− (p = 0.021). Therefore, more evidence with a larger dataset is required to confirm this hypothesis as most of the previous studies did not adjust the statistical analysis for potential confounders.
Although none of the 5xSTS tests could sufficiently discriminate between PD-FOF+ and PD- FOF−, the fast 5xSTS test presented larger effect sizes than the preferred speed 5xSTS test (Table 2 and Figure 1). This is an argument for including the fast version rather than the preferred speed version (Goldberg et al., 2012; Staartjes and Schröder, 2018) in the assessment panel of clinical protocols. For the 5xSTS with preferred speed, the mean peak power of sit-to-stands (P5xSTS,N) had a medium effect size while the effect size for the total duration of the test (T5xSTS,N) was low (Table 2 and Figure 1). This again highlights the usefulness of an instrumented 5xSTS test with IMUs to extract biomechanical parameters beyond the conventionally measured duration of the test (Van Lummel et al., 2016). Nevertheless, the IMU-derived sit-to-stand peak power did not differentiate PD-FOF+ from PD-FOF−. Also, the sit-to-stand peak power derived from the TUG test (PTUG) was not significantly different between the groups. An explanation can be that the PD-FOF+ group might not have particular difficulties in performing postural transitions. However, numerous studies showed the predictive power of the 5xSTS test for future falls (Buatois et al., 2008; Duncan et al., 2011; Doheny et al., 2013; Qiu et al., 2018). Therefore, our results, together with previous results, suggest that the 5xSTS test is associated with aspects of falls that are independent of FOF.
None of the parameters derived from the daily activity assessment could significantly differentiate PD-FOF+ from PD-FOF−. However, medium effect size values were observed for several parameters. Interestingly, the effect size for the lower preferred gait speed (Vμ _1) was higher than the median or 95th percentile values of gait speed distribution. This shows the importance of more precise modeling of gait speed distribution, rather than assuming a simple normal distribution of the obviously complex movements that occur in the usual environment (which was done in most of the previous studies, e.g., Toosizadeh et al., 2015; Takayanagi et al., 2019; Shah et al., 2020b). Interestingly, Vμ _1 showed a higher effect size than Vμ _2. It should be noted that Vμ _1 is assumed to correspond more to shorter walking bouts and Vμ _2 represents mostly longer walking bouts that are more likely to occur outdoors (Van Ancum et al., 2019). Thus, our results regarding the higher effect size of Vμ _1 vs. Vμ _2 suggest that shorter walking bouts are more meaningful to describe mobility performance (limitations) of PD-FOF+, and maybe an interesting therapeutic target for future trials. It could also be speculated that PD-FOF+ have more problems than PD-FOF− during multitask-walking, as shorter walking bouts have obviously a higher probability to be associated with additional tasks, compared with long walking bouts which have a high probability for reflection, e.g., walks without relevant dual-task claim. Therefore, according to Figure 1, it is not surprising that the features that remained for the classification included more parameters from short walking bouts (GaitSWB,min, GaitSWB,avg, and GaitSWB,max) than from medium and long walking bouts (GaitMWB,avg and GaitMWB,max).
In addition to GaitALL,max, SiStmax and Turnmin were among the daily activity parameters with the highest effect sizes. Thus, the number of various types of activities should also be considered in addition to parameters such as gait speed, sit-to-stand peak power, and turning peak angular velocity that characterizes these activities. Moreover, there was a tendency toward a lower amount of activity in PD-FOF+. The PDQ score was significantly lower in PD-FOF+, showing that the quality of life of the patients was highly affected by their FOF. This can explain the lower amount of daily activities in this group of patients.
After feature selection in section “Lab Versus Daily Activity Assessment,” several parameters from the lab and daily activity assessments remained in the selected features (Figure 1). Training three classifiers based on three sets of features, i.e., 𝔽1, 𝔽2, and 𝔽3, revealed that set 𝔽1 led to the most accurate classifier to distinguish the PD-FOF+ from the PD-FOF− group (Table 4). This selection, including features from both the lab and daily activity assessments, further supports the usefulness of including daily activity assessments in clinical practice as they have complementary information to the assessments performed in the lab (Maetzler et al., 2021). The more accurate classification of FOF with lab features (𝔽2), compared with daily activity features (𝔽3, Table 4), suggests that capacity aspects play an important role for the definition of FOF (Maetzler et al., 2021) and functional tests in the lab should always be performed for the evaluation in FOF. Still, the inclusion of environmental context and psychological factors from daily life is a valuable addition and can contribute to increased specificity.
Comparing the gait speed between the lab and daily activity assessments, significant correlations were found for PD-FOF− but not PD-FOF+ (Table 5). Interestingly, PD-FOF+ had higher gait speed values in the “capacity” area of their daily activity assessment compared with the lab. For these participants, , , , and had values greater than 1 (Table 5). One explanation can be that PD-FOF+ might be more cautious in non-familiar environments such as the lab. Moreover, and potentially more relevant for future management strategies, they might have been less cautious in their daily life especially when it comes to fast (and therefore more dangerous) gait episodes (Salkovic et al., 2017).
Another interesting observation, in our view, was that in PD- FOF−, VTUG,avg was significantly correlated with parameters during daily activity assessments that represent mostly the capacity aspects, i.e., VH,P95, VH,μ _2, VMWB,P95, and VLWB,P50. Moreover, the correlation between VTUG,avg and Vμ _2was high (ρ = 0.70). These findings firstly confirm the relevant association of lab parameters with daily activity parameters that are near the capacity area (Van Ancum et al., 2019; Warmerdam et al., 2020). These results suggest that capacity-associated values obtained during daily activities can indeed predict the capacity of a participant in the lab. Furthermore, the high association between VTUG,avg and Vμ _2 is again in favor of considering a bimodal gait speed distribution during daily activities (Atrsaei et al., 2021a).
Regarding the sit-to-stand peak power, PH,P95 had high correlations with PTUG and P5xSTS,N but not with P5xSTS,F (Table 5). This indicates that the 5xSTS test with preferred speed and the sit-to-stand part of the TUG test is most representative of the sit-to-stands performed during daily activities. In fact, in the TUG test, it is more accurate to name the initial postural transition as sit-to-walk rather than sit-to-stand. Since in daily life, there is often more sitting-to-walking than sitting-to-standing, the high correlation between PTUG and PH,P95 seems reasonable. Therefore, to have a better understanding of the sit-to-stand performance of patients during daily activities, clinicians should consider the 5xSTS test with preferred speed and the TUG sit-to-stand movement, rather than the fast 5xSTS test. The high association of sit-to-stand peak power between the lab and daily activity assessments was also observed in a study in community-dwelling older adults (Zhang et al., 2017). Nevertheless, as we demonstrated earlier, the 5xSTS test with fast speed had higher discriminative power for differentiating PD-FOF+ from PD-FOF−.
Our results are comparable to a very recent study on the impact of FOF on mobility parameters in a relatively large population of community-dwelling older adults (Wang et al., 2021). In that study, FOF led to a poorer mobility performance during both lab and daily activity assessments. Moreover, and comparable to this study, the consideration of both assessments showed the best discriminatory power between the presence and absence of FOF (lab assessment, AUC = 0.64; lab and daily activity assessment, AUC = 0.77). The strengths of our study, compared with the aforementioned study, are that we included postural transition and turning in addition to walking, and we assessed the daily activity over an average period of 12 (and not only 2) days (Wang et al., 2021).
Our study faces some limitations. First, our sample size could be small for statistical analyses. The observations and results could be supported more strongly with a larger population. This could explain why the parameters obtained during the daily activities did not differ significantly between PD-FOF+ and PD-FOF−. For instance, Vμ _1 was at the edge of a statistically significant difference. However, it should be noted that finding participants with a specific impairment that are willing to participate in several clinical assessments, as well as 2 weeks of activity monitoring, can be challenging. While in this study, we explored the difference between participants with low and moderate FOF, the difference between participants with low and high FOF might be more evident with mobility parameters obtained during daily activities. Using other questionnaires in addition to FES-I can also be investigated. For example, participants can be asked whether their FOF restricts their activities or not (Rochat et al., 2010).
The duration of daily activities measurements could still be increased to have a more accurate estimation of the daily routines of the patients. Nevertheless, considering the current usability of IMUs, especially for older adults, it is a bit challenging to engage the participants for more than 2 weeks of measurements. It is not surprising that in the literature, a lot of studies consider only 1 week of daily activity measurements (Storm et al., 2018; Galperin et al., 2019; Van Ancum et al., 2019; Shah et al., 2020a).
Another point of limitation can be the turning assessment during daily activities. The turning algorithm considered turns with durations of 0.5–10 s and angles > 45° (El-Gohary et al., 2014). This is a broad range, and future studies should investigate whether more specific definitions for turns that are performed in daily life have higher discriminatory power. Furthermore, the employed algorithm detected turns regardless of their occurrence during walking or sedentary behavior. Although it might be rare, participants might have been in a sitting position in a moving vehicle that had similar turning to those of a human that walks and turns at the same time. Therefore, further work is required to adapt the algorithm to detect turnings that occur during locomotion.
Another point was that since some of the unitless parameters showed significant differences between the two groups (Figure 2), we were curious if adding them to the feature set 𝔽1 will improve the classification results in Table 4. However, no improvement was observed. The reason might be that the ratio of home-derived mobility parameter divided by the same parameter obtained in the lab did not bring additional information as the information regarding both of the assessment settings was already there. Finally, to keep the data accuracy as high as possible, we excluded walking bouts < 15 s from the analysis to prevent other activities from being wrongly detected as a walking bout. However, these walking bouts contribute to a relevant portion of daily walking (Del Din et al., 2016; Shah et al., 2020c), and removing them might affect the meaningfulness of walking parameters with respect to the actual research question.
To conclude, the use of the IMU along with the dedicated algorithms allowed an unobtrusive assessment of mobility during daily activities. Although lab-based mobility parameters had generally higher discriminative power in differentiating PD-FOF+ and PD- FOF−, integrating daily activity assessments provided a more accurate classification of these patients. By comparing the same parameters from both settings, we could show for the first time that (i) considering lab and daily activity mobility parameters can lead to more accurate classification of PD-FOF+ and PD-FOF− compared with each lab and daily activity assessments alone (ii) the PD-FOF+ group performs the lab assessments with a rather cautious gait but used a rather incautious gait pattern in the usual environment; (iii) the sit-to-stand peak power of the 5xSTS test with preferred speed and of the TUG was more closely associated with sit-to-stand movement in daily life, than was the same parameter obtained from the fast 5xSTS, and (iv) the 5xSTS test with fast speed mostly measured the capacity aspects of daily activities. These results provide further insight into the daily life behavior of PD patients with FOF, can stimulate prevention and treatment strategies, and can serve as a template for further studies using these novel techniques and assessment strategies.
Data Availability Statement
The datasets generated and/or analyzed during this study are not publicly available but might be accessible from the corresponding author on reasonable request, upon joint approval from AA, CH, WM, and KA.
Ethics Statement
The studies involving human participants were reviewed and approved by Medical Faculty of the University of Tübingen (protocol no. 686/2013BO1). The patients/participants provided their written informed consent to participate in this study.
Author Contributions
AA designed the technical research and scientific question, extracted and analyzed the mobility parameters from clinical and home-based measurements, and wrote the manuscript. CH, ME, SS, DB, and IL-S performed the clinical measurements and extracted and analyzed the clinical questionnaires. AA, WM, DB, and KA discussed the results. WM, DB, and KA supervised and led the study. All the authors read, revised, and approved the final manuscript.
Funding
This study was supported by an unrestricted grant from Janssen Research and Development, a division of Janssen Pharmaceutica N.V. The funding of the study was pre-competitive and the funders did not have any influence on the design, conduction, and analysis of the results presented in this study. We acknowledge financial support by Land Schleswig-Holstein within the funding programme Open Access Publikationsfonds.
Conflict of Interest
The authors declare that the research was conducted in the absence of any commercial or financial relationships that could be construed as a potential conflict of interest.
Publisher’s Note
All claims expressed in this article are solely those of the authors and do not necessarily represent those of their affiliated organizations, or those of the publisher, the editors and the reviewers. Any product that may be evaluated in this article, or claim that may be made by its manufacturer, is not guaranteed or endorsed by the publisher.
Acknowledgments
We thank all participants that took part in the study.
References
Abou, L., Alluri, A., Fliflet, A., Du, Y., and Rice, L. A. (2021). Effectiveness of physical therapy interventions in reducing fear of falling among individuals with neurologic diseases: a systematic review and meta-analysis. Arch. Phys. Med. Rehabil. 102, 132–154. doi: 10.1016/j.apmr.2020.06.025
Allen, N. E., Schwarzel, A. K., and Canning, C. G. (2013). Recurrent falls in parkinson’s disease: a systematic review. Parkinsons Dis. 2013:906274. doi: 10.1155/2013/906274
Atrsaei, A., Dadashi, F., Hansen, C., Warmerdam, E., Mariani, B., Maetzler, W., et al. (2020). Postural transitions detection and characterization in healthy and patient populations using a single waist sensor. J. Neuroeng. Rehabil. 17:70. doi: 10.1186/s12984-020-00692-4
Atrsaei, A., Dadashi, F., Mariani, B., Gonzenbach, R., and Aminian, K. (2021b). Toward a remote assessment of walking bout and speed: application in patients with multiple sclerosis. IEEE J. Biomed. Heal. Inform. 25, 4217–4228. doi: 10.1109/JBHI.2021.3076707
Atrsaei, A., Corrà, M., Dadashi, F., Vila-Chã, N., Maia, L., Mariani, B., et al. (2021a). Gait speed in clinical and daily living assessments in Parkinson’s disease patients: performance versus capacity. NPJ Parkinsons Dis. 7:24. doi: 10.1038/s41531-021-00171-0
Bloem, B. R., Grimbergen, Y. A. M., Cramer, M., Willemsen, M., and Zwinderman, A. H. (2001). Prospective assessment of falls in Parkinson’s disease. J. Neurol. 248, 950–958. doi: 10.1007/s004150170047
Bryant, M. S., Rintala, D. H., Hou, J. G., and Protas, E. J. (2014). Influence of fear of falling on gait and balance in Parkinson’s disease. Disabil. Rehabil. 36, 744–748. doi: 10.3109/09638288.2013.814722
Buatois, S., Miljkovic, D., Manckoundia, P., Gueguen, R., Miget, P., Vançon, G., et al. (2008). Five times sit to stand test is a predictor of recurrent falls in healthy community-living subjects aged 65 and older. J. Am. Geriatr. Soc. 56, 1575–1577. doi: 10.1111/j.1532-5415.2008.01777.x
Dadashi, F., Millet, G. P., and Aminian, K. (2014). Estimation of front-crawl energy expenditure using wearable inertial measurement units. IEEE Sens. J. 14, 1020–1027. doi: 10.1109/JSEN.2013.2292585
Del Din, S., Godfrey, A., Galna, B., Lord, S., and Rochester, L. (2016). Free-living gait characteristics in ageing and Parkinson’s disease: impact of environment and ambulatory bout length. J. Neuroeng. Rehabil. 13:46. doi: 10.1186/s12984-016-0154-5
Del Din, S., Kirk, C., Yarnall, A. J., Rochester, L., and Hausdorff, J. M. (2021). Body-worn sensors for remote monitoring of Parkinson’s disease motor symptoms: vision, state of the art, and challenges ahead. J. Parkinsons. Dis. 11, S35–S47. doi: 10.3233/JPD-202471
Delbaere, K., Close, J. C. T., Mikolaizak, A. S., Sachdev, P. S., Brodaty, H., and Lord, S. R. (2010). The falls efficacy scale international (FES-I). A comprehensive longitudinal validation study. Age Ageing 39, 210–216. doi: 10.1093/ageing/afp225
Delbaere, K., Crombez, G., Vanderstraeten, G., Willems, T., and Cambier, D. (2004). Fear-related avoidance of activities, falls and physical frailty. A prospective community-based cohort study. Age Ageing 33, 368–373. doi: 10.1093/ageing/afh106
Doheny, E. P., Fan, C. W., Foran, T., Greene, B. R., Cunningham, C., and Kenny, R. A. (2011). “An instrumented sit-to-stand test used to examine differences between older fallers and non-fallers,” in Proceedings of the Annual International Conference of the IEEE Engineering in Medicine and Biology Society, (Boston, MA: IEEE), 3063–3066. doi: 10.1109/IEMBS.2011.6090837
Doheny, E. P., Walsh, C., Foran, T., Greene, B. R., Fan, C. W., Cunningham, C., et al. (2013). Falls classification using tri-axial accelerometers during the five-times-sit-to-stand test. Gait Posture 38, 1021–1025. doi: 10.1016/j.gaitpost.2013.05.013
Duncan, R. P., Leddy, A. L., and Earhart, G. M. (2011). Five times sit-to-stand test performance in Parkinson’s disease. Arch. Phys. Med. Rehabil. 92, 1431–1436. doi: 10.1016/j.apmr.2011.04.008
El-Gohary, M., Pearson, S., McNames, J., Mancini, M., Horak, F., Mellone, S., et al. (2014). Continuous monitoring of turning in patients with movement disability. Sensors 14, 356–369. doi: 10.3390/s140100356
Emre, M., Aarsland, D., Brown, R., Burn, D. J., Duyckaerts, C., Mizuno, Y., et al. (2007). Clinical diagnostic criteria for dementia associated with Parkinson’s disease. Mov. Disord. 22, 1689–1707. doi: 10.1002/mds.21507
Evers, L. J. W., Raykov, Y. P., Krijthe, J. H., Silva De Lima, A. L., Badawy, R., Claes, K., et al. (2020). Real-life gait performance as a digital biomarker for motor fluctuations: the Parkinson@Home validation study. J. Med. Internet Res. 22:e19068. doi: 10.2196/19068
Feltz, D. L., and Payment, C. A. (2005). Self-efficacy beliefs related to movement and mobility. Quest 57, 24–36. doi: 10.1080/00336297.2005.10491840
Frazier, L. D. (2000). Coping with disease-related stressors in Parkinson’s disease. Gerontologist 40, 53–63. doi: 10.1093/geront/40.1.53
Galperin, I., Hillel, I., Del Din, S., Bekkers, E. M. J., Nieuwboer, A., Abbruzzese, G., et al. (2019). Associations between daily-living physical activity and laboratory-based assessments of motor severity in patients with falls and Parkinson’s disease. Parkinsonism Relat. Disord. 62, 85–90. doi: 10.1016/j.parkreldis.2019.01.022
Goetz, C. G., Tilley, B. C., Shaftman, S. R., Stebbins, G. T., Fahn, S., Martinez-Martin, P., et al. (2008). Movement disorder society-sponsored revision of the unified parkinson’s disease rating scale (MDS-UPDRS): scale presentation and clinimetric testing results. Mov. Disord. 23, 2129–2170. doi: 10.1002/mds.22340
Goldberg, A., Chavis, M., Watkins, J., and Wilson, T. (2012). The five-times-sit-to-stand test: validity, reliability and detectable change in older females. Aging Clin. Exp. Res. 24, 339–344. doi: 10.1007/BF03325265
Greene, B. R., Odonovan, A., Romero-Ortuno, R., Cogan, L., Scanaill, C. N., and Kenny, R. A. (2010). Quantitative falls risk assessment using the timed up and go test. IEEE Trans. Biomed. Eng. 57, 2918–2926. doi: 10.1109/TBME.2010.2083659
Haertner, L., Elshehabi, M., Zaunbrecher, L., Pham, M. H., Maetzler, C., van Uem, J. M. T., et al. (2018). Effect of fear of falling on turning performance in Parkinson’s disease in the lab and at home. Front. Aging Neurosci. 10:78. doi: 10.3389/fnagi.2018.00078
Hoehn, M. M., and Yahr, M. D. (2001). Parkinsonism: onset, progression, and mortality. 1967. Neurology 57, S11–S26.
Howcroft, J., Kofman, J., and Lemaire, E. D. (2013). Review of fall risk assessment in geriatric populations using inertial sensors. J. Neuroeng. Rehabil. 10:91. doi: 10.1186/1743-0003-10-91
Ivarsson, A., Andersen, M. B., Johnson, U., and Lindwall, M. (2013). To adjust or not adjust: nonparametric effect sizes, confidence intervals, and real-world meaning. Psychol. Sport Exerc. 14, 97–102. doi: 10.1016/j.psychsport.2012.07.007
Jonasson, S. B., Nilsson, M. H., Lexell, J., and Carlsson, G. (2018). Experiences of fear of falling in persons with Parkinson’s disease - a qualitative study. BMC Geriatr. 18:44. doi: 10.1186/s12877-018-0735-1
Kaspar, R., Oswald, F., Wahl, H. W., Voss, E., and Wettstein, M. (2015). Daily mood and out-of-home mobility in older adults: does cognitive impairment matter? J. Appl. Gerontol. 34, 26–47. doi: 10.1177/0733464812466290
Latt, M. D., Menz, H. B., Fung, V. S., and Lord, S. R. (2009). Acceleration patterns of the head and pelvis during gait in older people with Parkinson’s disease: a comparison of fallers and nonfallers. J. Gerontol. A Biol. Sci. Med. Sci. 64, 700–706. doi: 10.1093/gerona/glp009
Lindholm, B., Hagell, P., Hansson, O., and Nilsson, M. H. (2015). Prediction of falls and/or near falls in people with mild Parkinson’s disease. PLoS One 10:e0117018. doi: 10.1371/journal.pone.0117018
Maetzler, W., Rochester, L., Bhidayasiri, R., Espay, A. J., Sánchez-Ferro, A., and van Uem, J. M. T. (2021). Modernizing daily function assessment in Parkinson’s disease using capacity, perception, and performance measures. Mov. Disord. 36, 76–82. doi: 10.1002/mds.28377
Marschollek, D., Nemitz, G., Gietzelt, M., Wolf, K. H., Meyer zu Schwabedissen, H., and Haux, R. (2009). Prädiktion von stürzen stationärer patienten in einer geriatrischen klinik: eine klinische studie zur kombination von assessmentdaten und einfachen, sensorisch erfassten gangparametern. Z. Gerontol. Geriatr. 42, 317–321. doi: 10.1007/s00391-009-0035-7
Millor, N., Lecumberri, P., Gomez, M., Martinez, A., Martinikorena, J., Rodriguez-Manas, L., et al. (2017). Gait velocity and chair sit-stand-sit performance improves current frailty-status identification. IEEE Trans. Neural Syst. Rehabil. Eng. 25, 2018–2025. doi: 10.1109/TNSRE.2017.2699124
Mukaka, M. M. (2012). Statistics corner: a guide to appropriate use of correlation coefficient in medical research. Malawi Med. J. 24, 69–71.
Najafi, B., Aminian, K., Loew, F., Blanc, Y., and Robert, P. A. (2002). Measurement of stand-sit and sit-stand transitions using a miniature gyroscope and its application in fall risk evaluation in the elderly. IEEE Trans. Biomed. Eng. 49, 843–851. doi: 10.1109/TBME.2002.800763
Narayanan, M. R., Scalzi, M. E., Redmond, S. J., Lord, S. R., Celler, B. G., and Lovell, N. H. (2008). “A wearable triaxial accelerometry system for longitudinal assessment of falls risk,” in Proceedings of the 30th Annual International Conference of the IEEE Engineering in Medicine and Biology Society, EMBS’08 - “Personalized Healthcare through Technology”, (New Jersey, NY: IEEE), 2840–2843. doi: 10.1109/iembs.2008.4649794
Owsley, C., and McGwin, G. (2004). Association between visual attention and mobility in older adults. J. Am. Geriatr. Soc. 52, 1901–1906. doi: 10.1111/j.1532-5415.2004.52516.x
Pourghayoomi, E., Behzadipour, S., Ramezani, M., Joghataei, M. T., and Shahidi, G. A. (2020). A new postural stability-indicator to predict the level of fear of falling in Parkinson’s disease patients. Biomed. Eng. Online 19:64. doi: 10.1186/s12938-020-00808-w
Qiu, H., Rehman, R. Z. U., Yu, X., and Xiong, S. (2018). Application of wearable inertial sensors and a new test battery for distinguishing retrospective fallers from non-fallers among community-dwelling older people. Sci. Rep. 8:16349. doi: 10.1038/s41598-018-34671-6
Rai, S. N., and Singh, P. (2020). Advancement in the modelling and therapeutics of Parkinson’s disease. J. Chem. Neuroanat. 104:101752. doi: 10.1016/j.jchemneu.2020.101752
Regterschot, G. R. H., Folkersma, M., Zhang, W., Baldus, H., Stevens, M., and Zijlstra, W. (2014). Sensitivity of sensor-based sit-to-stand peak power to the effects of training leg strength, leg power and balance in older adults. Gait Posture 39, 303–307. doi: 10.1016/j.gaitpost.2013.07.122
Rehman, R. Z. U., Del Din, S., Guan, Y., Yarnall, A. J., Shi, J. Q., and Rochester, L. (2019). Selecting clinically relevant gait characteristics for classification of early Parkinson’s disease: a comprehensive machine learning approach. Sci. Rep. 9:17269. doi: 10.1038/s41598-019-53656-7
Rochat, S., Büla, C. J., Martin, E., Seematter-Bagnoud, L., Karmaniola, A., Aminian, K., et al. (2010). What is the relationship between fear of falling and gait in well-functioning older persons aged 65 to 70 years? Arch. Phys. Med. Rehabil. 91, 879–884. doi: 10.1016/j.apmr.2010.03.005
Rudman, D. L., Friedland, J., Chipman, M., and Sciortino, P. (2006). Holding on and letting go: the perspectives of pre-seniors and seniors on driving self-regulation in later life. Can. J. Aging 25, 65–76. doi: 10.1353/cja.2006.0031
Salarian, A., Horak, F. B., Zampieri, C., Carlson-Kuhta, P., Nutt, J. G., and Aminian, K. (2010). ITUG, a sensitive and reliable measure of mobility. IEEE Trans. Neural Syst. Rehabil. Eng. 18, 303–310. doi: 10.1109/TNSRE.2010.2047606
Salkovic, D., Hobert, M. A., Bellut, C., Funer, F., Renno, S., Haertner, L., et al. (2017). Evidence for a selectively regulated prioritization shift depending on walking situations in older adults. Front. Aging Neurosci. 9:75. doi: 10.3389/fnagi.2017.00075
Shah, V. V., McNames, J., Mancini, M., Carlson-Kuhta, P., Spain, R. I., Nutt, J. G., et al. (2020b). Laboratory versus daily life gait characteristics in patients with multiple sclerosis, Parkinson’s disease, and matched controls. J. Neuroeng. Rehabil. 17:159. doi: 10.1186/s12984-020-00781-4
Shah, V. V., McNames, J., Mancini, M., Carlson-Kuhta, P., Nutt, J. G., El-Gohary, M., et al. (2020a). Digital biomarkers of mobility in Parkinson’s disease during daily living. J. Parkinsons. Dis. 10, 1099–1111. doi: 10.3233/JPD-201914
Shah, V. V., McNames, J., Harker, G., Mancini, M., Carlson-Kuhta, P., Nutt, J. G., et al. (2020c). Effect of bout length on gait measures in people with and without parkinson’s disease during daily life. Sensors 20:5769.
Staartjes, V. E., and Schröder, M. L. (2018). The five-repetition sit-to-stand test: evaluation of a simple and objective tool for the assessment of degenerative pathologies of the lumbar spine. J. Neurosurg. Spine 29, 380–387. doi: 10.3171/2018.2.SPINE171416
Storm, F. A., Nair, K. P. S., Clarke, A. J., Van der Meulen, J. M., and Mazzà, C. (2018). Free-living and laboratory gait characteristics in patients with multiple sclerosis. PLoS One 13:e0196463. doi: 10.1371/journal.pone.0196463
Takayanagi, N., Sudo, M., Yamashiro, Y., Lee, S., Kobayashi, Y., Niki, Y., et al. (2019). Relationship between daily and in-laboratory gait speed among healthy community-dwelling older adults. Sci. Rep. 9:3496. doi: 10.1038/s41598-019-39695-0
Toosizadeh, N., Mohler, J., Lei, H., Parvaneh, S., Sherman, S., and Najafi, B. (2015). Motor performance assessment in Parkinson’s disease: association between objective in-clinic, objective in-home, and subjective/semi-objective measures. PLoS One 10:e0124763. doi: 10.1371/journal.pone.0124763
Van Ancum, J. M., van Schooten, K. S., Jonkman, N. H., Huijben, B., van Lummel, R. C., Meskers, C. G. M., et al. (2019). Gait speed assessed by a 4-m walk test is not representative of daily-life gait speed in community-dwelling adults. Maturitas 121, 28–34. doi: 10.1016/j.maturitas.2018.12.008
Van Lummel, R. C., Walgaard, S., Maier, A. B., Ainsworth, E., Beek, P. J., and Van Dieën, J. H. (2016). The instrumented Sit-To-Stand test (iSTS) has greater clinical relevance than the manually recorded sit-to-stand test in older adults. PLoS One 11:e0157968. doi: 10.1371/journal.pone.0157968
Wang, C., Patriquin, M., Vaziri, A., and Najafi, B. (2021). Mobility performance in community-dwelling older adults: potential digital biomarkers of concern about falling. Gerontology 67, 365–373. doi: 10.1159/000512977
Warmerdam, E., Hausdorff, J. M., Atrsaei, A., Zhou, Y., Mirelman, A., Aminian, K., et al. (2020). Long-term unsupervised mobility assessment in movement disorders. Lancet Neurol. 19, 462–470. doi: 10.1016/S1474-4422(19)30397-7
Weiss, A., Brozgol, M., Dorfman, M., Herman, T., Shema, S., Giladi, N., et al. (2013). Does the evaluation of gait quality during daily life provide insight into fall risk? A novel approach using 3-Day accelerometer recordings. Neurorehabil. Neural Repair. 27, 742–752. doi: 10.1177/1545968313491004
Weiss, A., Herman, T., Plotnik, M., Brozgol, M., Giladi, N., and Hausdorff, J. M. (2011). An instrumented timed up and go: the added value of an accelerometer for identifying fall risk in idiopathic fallers. Physiol. Meas. 32, 2003–2018. doi: 10.1088/0967-3334/32/12/009
Williams, J. M., and Nyman, S. R. (2018). Association between the instrumented timed up and go test and cognitive function, fear of falling and quality of life in community dwelling people with dementia. J. Frailty Sarcopenia Falls 03, 185–193. doi: 10.22540/jfsf-03-185
Yardley, L., Beyer, N., Hauer, K., Kempen, G., Piot-Ziegler, C., and Todd, C. (2005). Development and initial validation of the falls efficacy scale-international (FES-I). Age Ageing 34, 614–619. doi: 10.1093/ageing/afi196
Zhang, W., Regterschot, G. R. H., Geraedts, H., Baldus, H., and Zijlstra, W. (2017). Chair rise peak power in daily life measured with a pendant sensor associates with mobility, limitation in activities, and frailty in old people. IEEE J. Biomed. Heal. Informatics 21, 211–217. doi: 10.1109/JBHI.2015.2501828
Keywords: inertial sensor, wearables, sit-to-stand, gait, turning, timed-up and go
Citation: Atrsaei A, Hansen C, Elshehabi M, Solbrig S, Berg D, Liepelt-Scarfone I, Maetzler W and Aminian K (2021) Effect of Fear of Falling on Mobility Measured During Lab and Daily Activity Assessments in Parkinson’s Disease. Front. Aging Neurosci. 13:722830. doi: 10.3389/fnagi.2021.722830
Received: 09 June 2021; Accepted: 21 October 2021;
Published: 30 November 2021.
Edited by:
Thomas Wisniewski, NYU Grossman School of Medicine, United StatesReviewed by:
Svetlana Tomic, Osijek Clinical Hospital Center, CroatiaSachchida Nand Rai, University of Allahabad, India
Copyright © 2021 Atrsaei, Hansen, Elshehabi, Solbrig, Berg, Liepelt-Scarfone, Maetzler and Aminian. This is an open-access article distributed under the terms of the Creative Commons Attribution License (CC BY). The use, distribution or reproduction in other forums is permitted, provided the original author(s) and the copyright owner(s) are credited and that the original publication in this journal is cited, in accordance with accepted academic practice. No use, distribution or reproduction is permitted which does not comply with these terms.
*Correspondence: Morad Elshehabi, bW9yYWQuZWxzaGVoYWJpQHVrc2guZGU=