Abstract
Computer-aided diagnosis (CAD) has undergone rapid development with the advent of advanced neuroimaging and machine learning methods. Nevertheless, how to extract discriminative features from the limited and high-dimensional data is not ideal, especially for amnesic mild cognitive impairment (aMCI) data based on resting-state functional magnetic resonance imaging (rs-fMRI). Furthermore, a robust and reliable system for aMCI detection is conducive to timely detecting and screening subjects at a high risk of Alzheimer’s disease (AD). In this scenario, we first develop the mask generation strategy based on within-class and between-class criterion (MGS-WBC), which primarily aims at reducing data redundancy and excavating multiscale features of the brain. Concurrently, vector generation for brain networks based on Laplacian matrix (VGBN-LM) is presented to obtain the global features of the functional network. Finally, all multiscale features are fused to further improve the diagnostic performance of aMCI. Typical classifiers for small data learning, such as naive Bayesian (NB), linear discriminant analysis (LDA), logistic regression (LR), and support vector machines (SVMs), are adopted to evaluate the diagnostic performance of aMCI. This study helps to reveal discriminative neuroimaging features, and outperforms the state-of-the-art methods, providing new insights for the intelligent construction of CAD system of aMCI.
Introduction
Alzheimer’s disease (AD), which occurs frequently in elderly individuals, is a chronic and irreversible neurodegenerative disease accompanied by brain impairments in memory, communication, and reasoning (Dadar et al., 2017). The new report indicates that more than 5.7 million individuals have been diagnosed with AD in the United States (Association, 2018). Unfortunately, as yet, there is no agreed medication or treatment protocol to cure and rehabilitate patients with AD (Xi et al., 2022). Amnesic mild cognitive impairment (aMCI), which is generally characterized by prominent deficits in memory, is widely considered as the early stage of AD due to its greater risk of conversion to AD (Bian et al., 2014; Barone et al., 2016). Accordingly, a robust and reliable system for aMCI detection is conducive to timely detecting and screening the subjects with AD at high risk, thus providing an optimal treatment period for patients.
Resting-state functional magnetic resonance imaging (rs-fMRI), which reflects the neural functional activity of the brain by measuring spontaneous blood oxygen level dependency (BOLD) signal fluctuations in a non-invasive way, has been widely employed as one of the important techniques to diagnose brain-related diseases (Li et al., 2018; Li R. et al., 2020; Sundaram et al., 2020). However, rs-fMRI data are confronted with formidable challenges to the existing pattern classification methods due to its limited data samples and high dimensions, which is not favorable for aMCI detection (Kassani et al., 2020). In consequence, existing methods for observing alterations of spontaneous neural activity, such as regional homogeneity (ReHo), the amplitude of low-frequency fluctuation (ALFF), and functional connectivity analysis, are employed to explore the biological mechanisms of brain function and reduce the redundant information of brain (Harrison et al., 2019; Liao et al., 2019; Ting et al., 2020; Xiao et al., 2020). Furthermore, the aMCI can be diagnosed using rs-fMRI data processed by the use of abovementioned methods as reported in a few studies (Zhou et al., 2014; Kim et al., 2020; Li Y. et al., 2020). Consequently, the diagnosis of aMCI based on these data can be employed for timely prevention and screening of potential patients with AD.
In this study, the data sample after preprocessing is then conducted using ReHo calculation, ALFF calculation, and functional connectivity construction, and we obtain two three-dimensional whole-brain structures and the brain functional network. Then, we develop an MGS-WBC model, which mainly consists of the intraclass volatility detection method using variable coefficient and multiscale statistical thresholds, to excavate the multiscale features and reduce the redundancy information both in the whole-brain structures and functional network. It is remarkable that the traditional approaches only use the single local features of the functional network as the input of the classifier, while ignoring its global features. Therefore, we present a VGBN-LM model that extracts the global features and then concatenates local features obtained from the MGS-WBC model to further excavate features of the functional network. Then, we fuse the features that resulted from the MGS-WBC model and VGBN-LM model to further improve the diagnostic performance of aMCI. Concurrently, to evaluate the validity of obtained features and diagnostic performance of aMCI, typical machine learning classifiers applied to the limited number of data, such as naive Bayesian (NB), linear discriminant analysis (LDA), logistic regression (LR), and support vector machines (SVMs), are utilized. Noting that the leave-one-out cross-validation is employed to avert the overfitting problem in this study (Sangnawakij and Niwitpong, 2017). This study greatly improves the diagnostic performance of aMCI compared with the traditional methods, providing new insights for the construction of the computer-aided diagnosis (CAD) system for neurodegenerative diseases, especially for aMCI.
Herein, it is not ideal how to extract discriminative features from the limited and high-dimensional data, especially for aMCI data based on rs-fMRI. Furthermore, a robust and reliable system for aMCI detection is conducive to timely detecting and screening subjects at a high risk of AD. Hence, the novel aspect of this study is that we first develop an MGS-WBC model to extract discriminative features of whole-brain structures and functional networks using volatility detection and multiple significant thresholds. In the following section, we present a VGBN-LM model that excavates the global features of the functional network and fuses its local features, thus overcoming the low availability of the network feature. Finally, all features generated from the MGS-WBC model and VGBN-LM model are concatenated to further improve the diagnostic performance of aMCI.
The remainder of the study is structured as follows: We discuss the related studies on feature extraction and the diagnosis of aMCI in the “Related Work” Section. We present data source, data acquisition, and data preprocessing in the “Materials” Section. We describe the methodologies of aMCI’s diagnostic system in the “Methods” Section. We provide the experiment results and analysis in the subsequent section and give the conclusion in the final section.
Related Work
Advanced neuroimaging, machine learning techniques, and statistical algorithms provide an opportunity to understand how the brain works between healthy control (HC) and patients with brain diseases, and to analyze the pathological mechanism of the brain (Nadarajah and Kotz, 2006; Lei et al., 2019). Additionally, rs-fMRI, which is convenient and suitable for patients with cognitive impairment who feel difficult to complete tasks, is widely employed in the study of diseases related to the central nervous system, which can reflect the functional condition of the brain under the default state. Nevertheless, how to extract discriminative features from the limited and high-dimensional data is not ideal, especially for the aMCI data based on rs-fMRI.
To address this issue, numerous previous studies have focused on excavating biomarkers associated with aMCI disease from the perspective of neuroimaging. For example, compared with the HC group, abnormal patterns of diverse-club and rich-club organizations in the functional network are revealed using the two-sample t-test in the aMCI group, indicating that the overlapping nodes might be potential biomarkers in the diagnosis of aMCI (Xue et al., 2020). Also, a previous study has revealed that abnormal alterations of ALFF in patients with aMCI are found involved in brain regions, such as the right hippocampus, parahippocampal cortex, and left lateral temporal cortex, which may act as biomarkers of disease (Xi et al., 2013). The former investigation has also confirmed that disruptive patterns of ReHo are found using the two-sample t-test in the brain, which is conducive to better comprehending the neural substrates of aMCI and can be served as biomarkers (Zhen et al., 2018). It should be noted that all the studies mentioned above are conducted using statistical methods and existing medical background knowledge to analyze the disruptive patterns of brain disease, ignoring the adoption of machine learning techniques to assess the validity and reliability of diagnostic results.
Currently, machine learning techniques have been actively adopted by researchers to design the CAD system of aMCI, which mainly aims at improving the classification performance and putting it into clinical practice (Zhang et al., 2015; Yang et al., 2021). To the limited number of data and information redundancy problems, feature selection is first implemented and then acted as the input of machine learning classifiers, which are suitable for small data learning, such as NB, LDA, LR, and SVM. A previous investigation based on the functional network classification of aMCI has elucidated that the obvious brain regions which resulted from the two-sample t-test are served as the input of SVM classifier, resulting in the ACC of 69% (Lee et al., 2015). Moreover, it has been reported that the identification ACC of aMCI is 75.35% when using significant regions of the ALFF as the input of SVM classifier (Yang et al., 2018). Up to now, the existing literature not only lacks quantity in the concerned study but also focuses on the single significant threshold method, ignoring the extraction of multiscale features in the brain.
In this study, we first develop an MGS-WBC model using validation detection and multiple significant thresholds methods to extract multiscale features both in the whole-brain structures and functional network. Concurrently, we present the VGBN-LM model to extract the global features of the functional network and fuse its local features. Finally, we fuse the extracted features generated from the MGS-WBC model and VGBN-LM model to further improve the diagnostic performance of aMCI. Compared with the traditional method, the results elucidate that the proposed methods provide the accuracy (ACC) of 89.55, 91.04, 92.54, and 94.03% with the same input data in four typical classifiers, including NB, LDA, LR, and SVM, and maximum improvements are 1.49, 1.49, 1.50, and 4.48%, respectively. Moreover, the area under the curve (AUC) on the four sequence classifiers mentioned above are 95.63, 92.69, 97.59, and 97.33%, increasing by 2.49, 1.96, 2.67, and 2.23% compared with the traditional method. It can be inferred that our aMCI diagnostic system is more suitable and reliable than the traditional method. In addition, this study can help reveal impressible and discriminative neuroimaging features, providing new insights for the construction of the CAD system of aMCI.
Materials
Description of the Data Source
In this study, the raw data samples are composed of two parts, including 39 patients with aMCI and 38 HCs. These raw data samples are obtained from the second stage of Alzheimer’s Disease Neuroimaging Initiative (ADNI) database, which helps to explore neurological biomarkers of cognitive disease and assist in the diagnosis and treatment of the disease1.
It deserves to be further mentioned that not all data samples are conformed to work demands. One data sample has been precluded due to undue head movement (cumulative translation or rotation >2 mm or 2°) and poor quality of image registration (Wang et al., 2018). Concurrently, we exclude 6 patients with aMCI and 4 HCs for inconsistent voxel size or dimension of the brain. To sum up, we end up with 33 patients with aMCI and 34 HCs in this study (Wang et al., 2020).
Data Acquisition and Preprocessing
All the data samples we focus on in this study are based on rs-fMRI obtained using a clinical 3.0-Tesla (T) scanner. Noting that each raw data sample based on rs-fMRI is composed of brains at 140 points in time. To maintain the reliability of the raw data samples, the subjects are instructed to lay flat, to close their eyes without thinking, and to keep their head in position throughout the imaging processing. We perform the scanner parameters as follows (Li W. et al., 2020): Echo time (TE) = 30 ms, repetition time (TR) = 3,000 ms, voxel size = 3.31 mm × 3.31 mm × 3.31 mm, flip angle (FA) = 80°. More detailed information about scanner parameters based on rs-fMRI data can be inquired on the ADNI’s website.
We perform raw data sample preprocessing using Resting-State fMRI Data Analysis Toolkit plus (RESTplus)2, which is based on math software MATLAB2012a3 and Statistical Parametric Mapping software (SPM12)4. The raw data preprocessing steps we adopt are depicted as follows: first, owing to the machine and human factors, the imaging signal acquired at the beginning of scanning may exhibit unstable signal ingredient factors. Thus, the first 5 time points of each data sample after imaging are discarded in this study. Also, we calibrate the brains of the remaining time points to eliminate the effects induced by discrepancies between various brains or slices. We further normalize the brains of all data samples using the echo-plane imaging (EPI) template from the original coordinate system to Montreal Neurological Institute (MNI) coordinate system due to the shape of each subject’s brain being inconsistent. Specifically, we smooth out the noise that exists in the brain using a Gaussian kernel of 6-mm full width at half maximum (FWHW) for functional network and ALFF analysis (Yang et al., 2021). After that, we remove the variables that affect the dependent variables, including nuisance cerebrospinal fluid signal, global mean signal, white matter signal, and 6 head motion parameters. Finally, the signals with important physiology meaning are obtained through a bandpass filter of 0.01–0.08 Hz (Vicente et al., 2018). Based on the steps mentioned above, the data samples after preprocessing are utilized in the following section.
Methods
Overview of the Amnesic Mild Cognitive Impairment Diagnosis System
In this study, we develop a diagnosis system for aMCI. At first, the raw data samples based on the rs-fMRI are pre-processed as depicted in the “Related Work” Section. In the next step, the data samples after preprocessing are calculated using typical approaches used to observe alterations of neuronal activity, such as ReHo, ALFF, and functional connectivity, and we obtain two whole-brain structures and one functional network for each data sample. Then, the calculated data samples are acted as the input of MGS-WBC model and VGBN-LM model we propose to extract biological features of whole-brain structures and functional networks. To evaluate the validity of obtained features, NB, LDA, LR, and SVM are utilized in this study. Furthermore, the leave-one-out cross-validation is carried out to avert the overfitting problem in this study.
In the results, the features generated by the MGS-WBC model and VGBN-LM model yield better performance than the traditional method in the aMCI detection process. The framework of our aMCI diagnosis system is illustrated in Figure 1.
FIGURE 1
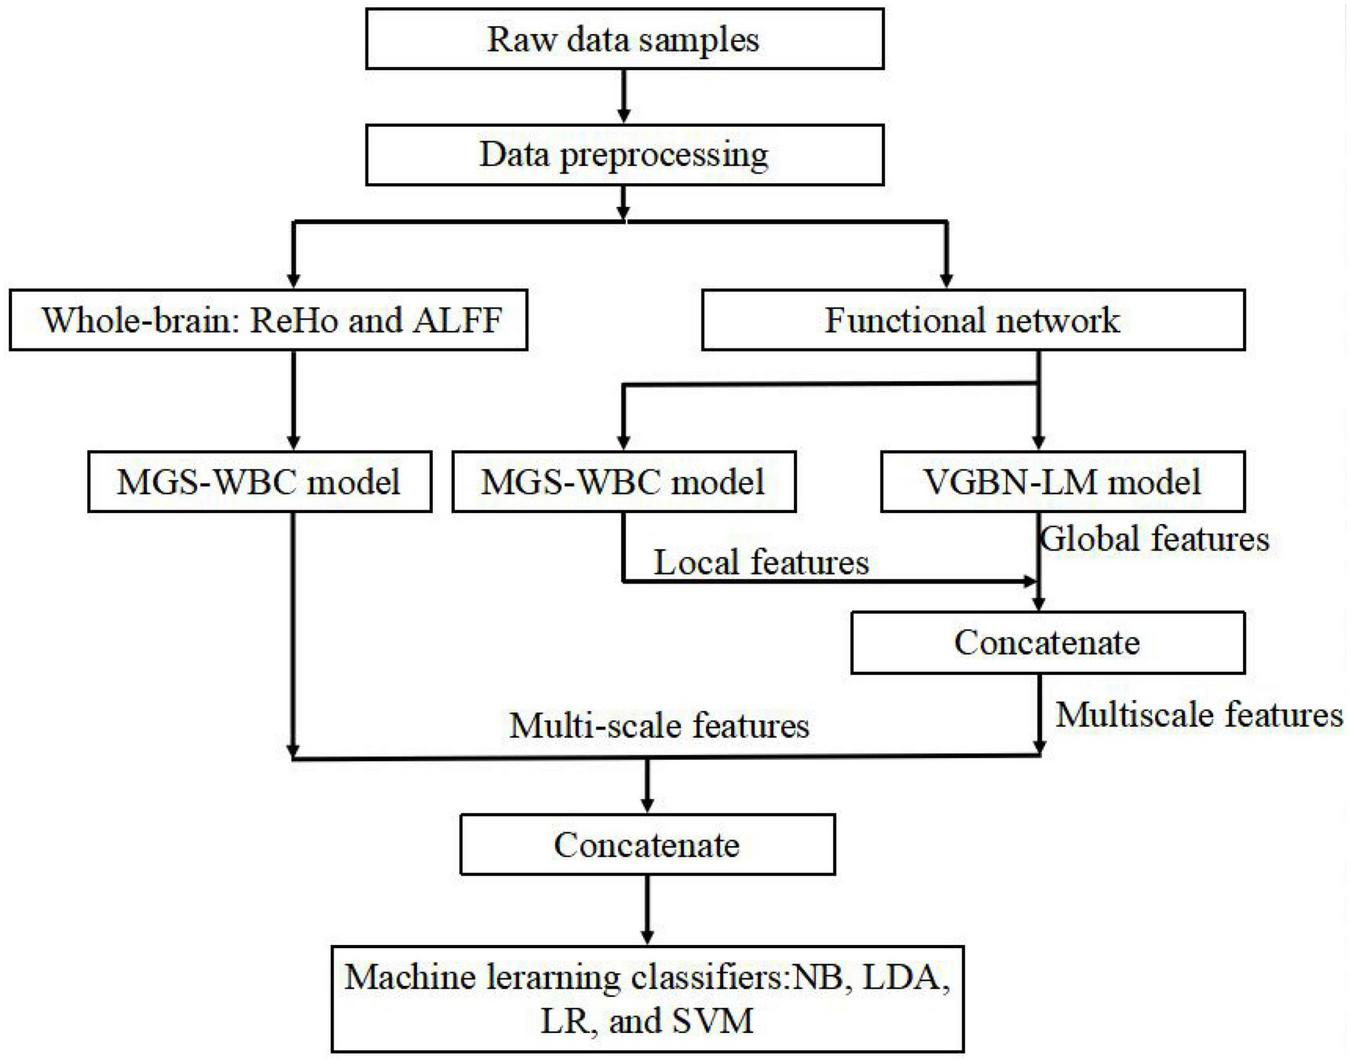
Overall framework of amnesic mild cognitive impairment (aMCI) diagnosis system.
Mask Generation Strategy Based on Within-Class and Between-Class Criterion
In this section, we develop an MGS-WBC model to reduce the redundancy both in the whole-brain structures and functional networks and to further excavate the corresponding features of multiscale significant thresholds. Remarkably, the connectivity of the functional network is constructed using the Pearson correlation coefficient (PCC), and the inputs of PCC come from the time series of the corresponding brain regions. Also, to better extract the time series of the brain, we employ the general template of anatomical automatic labeling (AAL) to segment the brain into 90 regions (Ju et al., 2019). The structure of the MGS-WBC model shown in Figure 2 mainly consists of within-class volatility detection using variable coefficient and multi-scale significant thresholds. Since the mask size using a single significant threshold of 0.001 < p < 0.05 is much larger than p < 0.001, the traditional method only uses the mask with p < 0.001 for feature extraction and ignores the effective utilization of features. Besides, for the limited amount of data with a high dimension, how to better extract discriminative features effectively corresponding to the significant threshold of 0.001 < p < 0.05 is no clear. First, intraclass volatility detection mask of the whole-brain structures and 90 × 90 functional network, which is defined as Maskvolatility, are generated using variable coefficient within the group to extract the smallest values of the first 5% (Xu et al., 2017), and the variable coefficient (VC) is defined as follows:
where denotes the average value of the selected pixel or selected brain region, n denotes the number of subjects within the group, and xj denotes the value of the selected pixel or selected brain region corresponding to the ith subject. To obtain the features under multiple significant thresholds, we use Maskvolatility and a two-sample t-test to generate the mask of 0.001 < p < 0.05, defined as Mask0.001 < p < 0.05, which makes a large difference between the averages of the classes and the fluctuations within the classes are stable. Next, we further use the traditional method that extracts the features obtained from p < 0.001 to generate a mask, defined as Maskp < 0.001. And finally, Mask0.001 < p < 0.05 and Maskp < 0.001 are concatenated as the input mask of whole-brain structures or functional networks to extract the final features. It is worth mentioning that the whole-brain structures employed in this study are calculated using the ALFF method and ReHo method, respectively, which are commonly employed to analyze neural activity in the brain and reduce the dimensions of brain data.
FIGURE 2
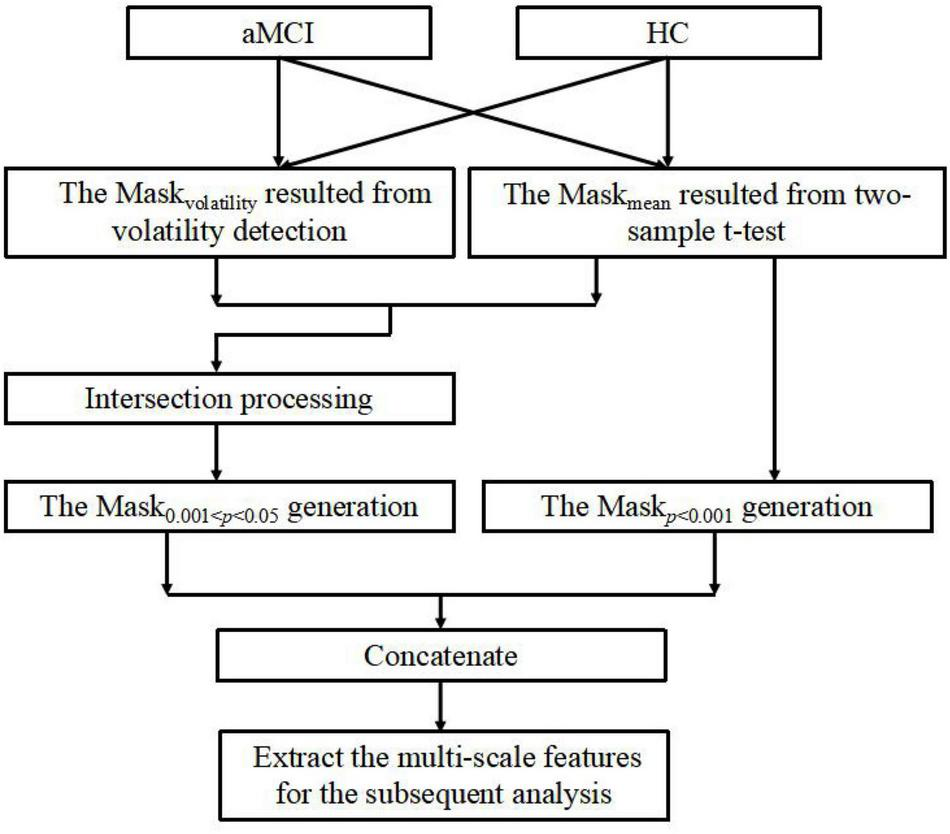
The description of mask generation strategy based on within-class and between-class criterion (MGS-WBC) model.
Vector Generation for Brain Networks Based on Laplacian Matrix
In this section, we present a VGBN-LM model for extracting the global features of the functional network. Laplacian Eigenmaps (LE) is a non-linear dimensionality reduction method, which constructs the relationship between samples from the local point of view, and can reflect the local relationship of samples to a certain extent. That is, the points related to each other are expected to be as close as possible to each other in the space after dimensionality reduction. Accordingly, we mainly use LE’s conception to extract global features of the functional network. Here is a brief introduction to the LE algorithm (Belkin and Niyogi, 2001):
Step 1: The construction of the graph is defined as G(V, W): Given n samples x1, x2…, xn in Rd, the edge connection wij between sample i and sample j is established using b nearest neighbors, and the wij can usually be constructed using Gaussian kernel function shown in (2). Notably, wij represents symmetric, D represents the node degree matrix shown in (3), and xn represents the eigenvector corresponding to the sample n.
Step 2: To maintain the identical geometric property as possible after reducing the dimension of the functional network, it can be solved as the minimization problem of yTLy. That is, if the connection value wij is larger, the values of yi and yj will be closer, as shown in (4). Thus, this reduces now to (5).
Step 3: Finally, after using the Lagrange multiplier method, the optimal result can be obtained by (6).
However, the goal of the LE algorithm is to reduce the dimension of the sample features, and the dimension of the reduced features depends on the number of minimum non-zero eigenvalues, which does not conform to the requirements of extracting the global features from the functional network in this study. Moreover, it is unable to transform the functional network from two dimensions to one dimension that maintains the global features. Thus, considering the limited and high-dimensional data, the VGBN-LM model based on the Laplacian matrix is proposed to reduce the dimension of 90 × 90 functional network and obtain the global features of functional network. Concurrently, we expect that the functional network after dimension reduction operation can maintain and reflect the identical geometric property of functional network. That is, we represent the global features of 90 × 90 functional network in terms of reduced dimension vector.
First, we construct the minimization problem based on the Laplacian matrix. More specifically, let
where σ represents the special real number and its value will be introduced later. We then use Lagrange to acquire optimal result, which can be formulated as follows:
Then, we take the derivative of y and λ of G(y, λ), respectively.
Thus, the optimal result turns to determine the solution of (11).
Nevertheless, the LE algorithm employs constraint conditions of yTDy = 1 to obtain the eigenvectors corresponding to all non-zero eigenvalues, ignoring that all the optimal results may not satisfy the original constraint condition. Moreover, the generated eigenvectors of 90 × 90 functional network cannot present its global features due to the excessive redundant features and limited amount of data.
Next, we deform Ly = λDy to obtain the optimal result, and its expression could be written as:
If λ ≠ 1, we obtain
Then, if λ = 1, it can be inferred as below:
Therefore, the optimal result of (11) can be further deformed as:
Significantly, the solution of (15) is reached by use of the backward induction. Let (λξi, yξi) represents the solutions of , then we can deduce that . Based on this, we can obtain the following
form:
where d represents the number of solutions in Ly = λDy. Concurrently, we assume that Dy = Ly have the solutions, defined as yβj, and then we make . From this, it can be deduced that the equation have the solution. Therefore, we can deduce the expression as follows:
where h represents the number of solutions in Dy = Ly. To sum up, the optimal result of (7) can be written as follows:
Remarkably, the value of σ is obtained from the optimal solution in (18). Here, the procedure of VGBN-LM model can be summarized as follows:
Step 1: Given n brain regions extracted using AAL template, we use the absolute value of PCC shown in (19) to construct the edge connection wij between brain region i and brain region j instead of Gaussian kernel function and b nearest neighbors method.
where xi and yi denote the two signals from two different brain regions, denotes the average value corresponding to xi, denotes the average value corresponding to yi, and n denotes the total number of brain regions in AAL template.
Step 2: We present (7–19) to reduce the dimension of the matrix wij from two dimensions to one dimension. Meanwhile, we maintain and reflect the global structure information in the lower dimension space to a certain degree. That is, the closer the connections between brain regions before dimension reduction, the nearer the corresponding values after dimension reduction. In this way, our generated vector yoptresulted from (18) contains global features of functional network.
Step 3: Due to the limited amount of data, the two-sample t-test method is employed to select the global features with obvious differences (p < 0.05) in the generated vector yopt, and then, we concatenate the local features obtained from MGS-WBC model for the following analysis.
Multiscale Feature Fusion
We concatenate all the generated features obtained from MGS-WBC model and VGBN-LM model to further improve the diagnostic performance of aMCI. That is, if the dimensions of two input features xinput and yinput are p and q, then the dimension of the output feature z is equal to p + q.
Classification Using Naive Bayesian, Linear Discriminant Analysis, Logistic Regression, and Support Vector Machine
As can be seen from the above data, we have obtained multiscale features of whole-brain structures and functional networks using the MGS-WBC model and VGBN-LM mode. Considering the limited amount of data, the selection of an appropriate classifier adopted in this study is crucial to evaluate the validation of obtained features and improve the diagnostic performance of aMCI. Fortunately, the SVM classifier and the LR classifier exhibit effective diagnostic performance in terms of mild cognitive impairment (MCI), and it has been exploited by the majority of researchers (Ciulli et al., 2016; Khatun et al., 2019). In addition, typical classifiers applied to small data learning, such as NB classifier and LDA classifier, are also employed to better assess the generalization ability of features. The following is a brief introduction to the classifiers mentioned above.
The NB classifier mainly uses the probability of known data to determine the classification of the unknown data (Liu et al., 2016):
(1) Each data sample x is composed of m-dimensional features, denoted by a1, a2, a3, …, am.
(2) We calculate the conditional probability for each category under each data sample. The category set is denoted as C = {l1, l2, …, lk}, hence, we calculate p(l1|x), p(l2|x), …, p(lk|x) separately.
where p(lk|x) can be deduced by (20) and k is the class number of x.
(3) If p(lf|x) = max(p(l1|x), p(l1|x), …, p(lk|x)), then lf is the category corresponding to x, where f∈(1,2, …, k).
The main idea of the LDA classifier is to ensure that the intraclass variance of each class is small, and the mean difference between classes is large in the space after the projection (Ji and Ye, 2008). Given input data set D = {(x1, y1),(x2, y2), …,(xn, yn)}, y ∈ {0,1}, meanwhile, Nj(j = 0,1) denotes the number of data samples corresponding to the category j, x denotes the input and Xj(j = 0,1) denotes the set of data samples corresponding to the category j. The mean vector of the data sample corresponding to class j can be expressed as follows:
The covariance matrix of the data sample corresponding to class j is denoted as ∑j.
Then, the divergence matrix within class is defined as Sw.
where u denotes mean value.
Simultaneously, the divergence matrix between classes can be described as Sb.
In this way, the optimization objective is rewritten as follows:
According to (21–25), it can be inferred as follows:
That is, the optimal projection direction w can be determined by calculating the mean and variance of the original two types of samples, and then, the classification is conducted on this basis.
The LR classifier is a probabilistic statistical classification model, which uses a probability score as the predicted value of the dependent variable to evaluate the mutual relation between the dependent variable and the independent variable. Specifically, we utilize the L2 regularization considering the overfitting problem in this study (Chen et al., 2011). The loss function with L2 regularization can be described as follows:
where hθ(x) is defined as:
Then, we take the derivative concerning (27).
where m represents the number of data samples, and ηrepresents the regularization coefficient. Finally, the parameters θj corresponding to the minimum loss function are obtained through continuous iteration.
The SVM classifier is to obtain the optimal separating hyperplane in the feature space to maximize the interval between positive and negative data samples on the training set. It is also worth noting that the kernel function adopted in this study is the Gaussian Radial Basis Function kernel (Zhou et al., 2014). The SVM classifier mainly works around the following optimization problems (Cristovao et al., 2022).
The Gaussian kernel is described as follows:
where C represents the penalty coefficient, xi represents the data sample, yi represents class corresponding to ith data sample, w and b represent the optimal parameters of the model, N represents the number of data, and ψi represents the relaxation variable that corresponds to the ith data sample.
In this study, the leave-one-out cross-validation is employed to avert the overfitting problem of classifiers and overcome the limited number of data, which means that one data sample is employed as the testing set and the remaining samples are employed as the training set. Besides, the parameter adjustment process of the classifier follows the optimal principle.
Evaluation Criteria
In this study, we obtain features using the MGS-WBC model and VGBN-LM model. To evaluate the validity of obtained features, the most widely used measurements for binary classification problems, such as ACC, F1-Score, and AUC, are adopted based on the confusion matrix (Kam et al., 2020).
True positive (TP), false negative (FN), false positive (FP), and true negative (TN) are defined to calculate the evaluation indicators of classifiers, as is shown in Figure 3.
FIGURE 3
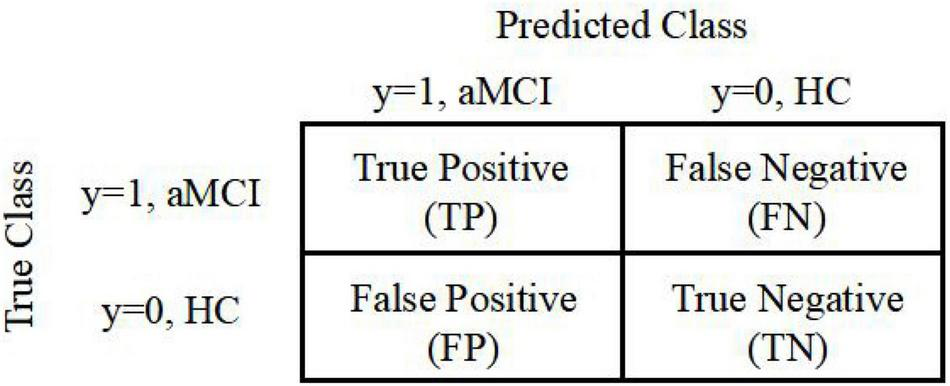
Confusion matrix used to measure the binary classification problems.
Experiment Results and Analysis
In this section, compared with the traditional method, we first analyze the diagnostic performance of aMCI by using the whole-brain structural features obtained from the MGS-WBC model as the input of four classifiers. Then, we analyze the diagnostic performance of aMCI by using the global features obtained from VGBN-LM model and local features obtained from MGS-WBC model as the input of four classifiers compared with the traditional method. In the end, we fuse all features, including whole-brain structural features, local features, and global features, to further improve the diagnostic performance of aMCI. It is notable that the order of the above four classifiers is as follows: NB, LDA, LR, and SVM.
The Performance Analysis of Whole-Brain Structural Features
In our experiments, the MGS-WBC model is adopted in two whole-brain structures, including ReHo and ALFF, to reduce the data redundancy and extract multiscale features. For the whole-brain structure calculated by ReHo, as shown in Table 1 and Figures 4, 5, we obtain 10 obvious regions of the brain using MGS-WBC model, including the right gyrus rectus (GR), left pallidum (PAL), left cingulate gyrus (CG), left supplementary motor area (SMA), left inferior cerebellum (IC), right IC, left middle temporal gyrus (MTG), left middle frontal gyrus (MFG), right MFG, and left middle occipital gyrus (MOG), while only six obvious brain regions, namely, left IC, right IC, left MTG, left MFG, right MFG, and left MOG, are found using a single significant threshold (two-sample t-test, p < 0.001). Significantly, each significant region is composed of the activated voxels in the brain. Then, the features extracted from 10 significant regions and six significant regions are separately employed as the input of classifiers, including NB, LDA, LR, and SVM, to evaluate the aMCI’s diagnostic performance. Table 2 presents the diagnostic performance of aMCI using different feature extraction methods of the whole-brain structure (ReHo). The results of MGS-WBC2 all exceed 66.67% in the four classifiers. Besides, compared with the single significant threshold in the whole-brain structures (SSW1) (Zhang et al., 2015; Yang et al., 2018), the results of MGS-WBC3 provide the ACC of 88.06, 89.55, 91.04, and 91.04% in the four classifiers, improving by 4.48, 2.98, 10.44, and 4.47%, respectively. Concurrently, the AUC are 94.12, 96.08, 96.88, and 95.72% in four classifiers, and the increases are 2.24, 1.96, 5.53, and 1.51% compared with SSW1. For F1-Score, we provide about 87.88, 89.55, 91.18, and 90.91% in four classifiers, and maximum improvements are 4.30, 2.23, 9.49, and 3.95% compared with SSW1.
TABLE 1
| Region | Peak/MNI |
t-score | Cluster size | ||
| x | y | z | |||
| R GR | 21 | −18 | −45 | −2.9046 | 5 |
| L PAL | −12 | 0 | −3 | −2.6854 | 5 |
| L CG | −15 | −6 | 36 | 2.3872 | 5 |
| L SMA | −15 | −9 | 54 | 3.3572 | 9 |
| L IC | −12 | −63 | −60 | −4.2059 | 8 |
| R IC | 24 | −69 | −48 | −3.8093 | 24 |
| L MTG | −51 | −39 | −12 | −4.0141 | 11 |
| L MFG | −48 | 42 | −15 | 4.2324 | 7 |
| R MFG | 45 | 48 | 0 | 4.1363 | 7 |
| L MOG | −45 | −66 | 3 | −3.7574 | 10 |
The extracted clusters using MGS-WBC model after ReHo calculation.
The x, y, and z coordinates are the primary peak locations in the MNI space. Cluster size ≥ 5 voxels in two-sample t-test. L, left; R, right; GR, gyrus rectus; PAL, pallidum,; CG, cingulate gyrus; SMA, supplementary motor area; IC, inferior cerebellum; MTG, middle temporal gyrus; MFG, middle frontal gyrus; MOG, middle occipital gyrus.
TABLE 2
| Classifier | Method | ACC | F1-Score | AUC |
| NB | SSW1 | 0.8358 | 0.8358 | 0.9189 |
| MGS-WBC2 | 0.6866 | 0.6667 | 0.7460 | |
| MGS-WBC3 | 0.8806 | 0.8788 | 0.9412 | |
| LDA | SSW1 | 0.8657 | 0.8732 | 0.9412 |
| MGS-WBC2 | 0.7164 | 0.6885 | 0.7799 | |
| MGS-WBC3 | 0.8955 | 0.8955 | 0.9608 | |
| LR | SSW1 | 0.8060 | 0.8169 | 0.9135 |
| MGS-WBC2 | 0.7164 | 0.7077 | 0.7861 | |
| MGS-WBC3 | 0.9104 | 0.9118 | 0.9688 | |
| SVM | SSW1 | 0.8657 | 0.8696 | 0.9421 |
| MGS-WBC2 | 0.7612 | 0.7419 | 0.7709 | |
| MGS-WBC3 | 0.9104 | 0.9091 | 0.9572 |
Performance metrics of different classifiers using MGS-WBC model after ReHo calculation.
SSW1 refers to the single significant threshold (two-sample t-test, p < 0.001) in the whole-brain structures (Zhang et al., 2015; Yang et al., 2018). MGS-WBC2 refers to the combination of volatility detection and significant threshold (0.001 < p < 0.05) in the MGS-WBC model. MGS-WBC3 refers to the fused features, that is, the final output of MGS-WBC model.
FIGURE 4
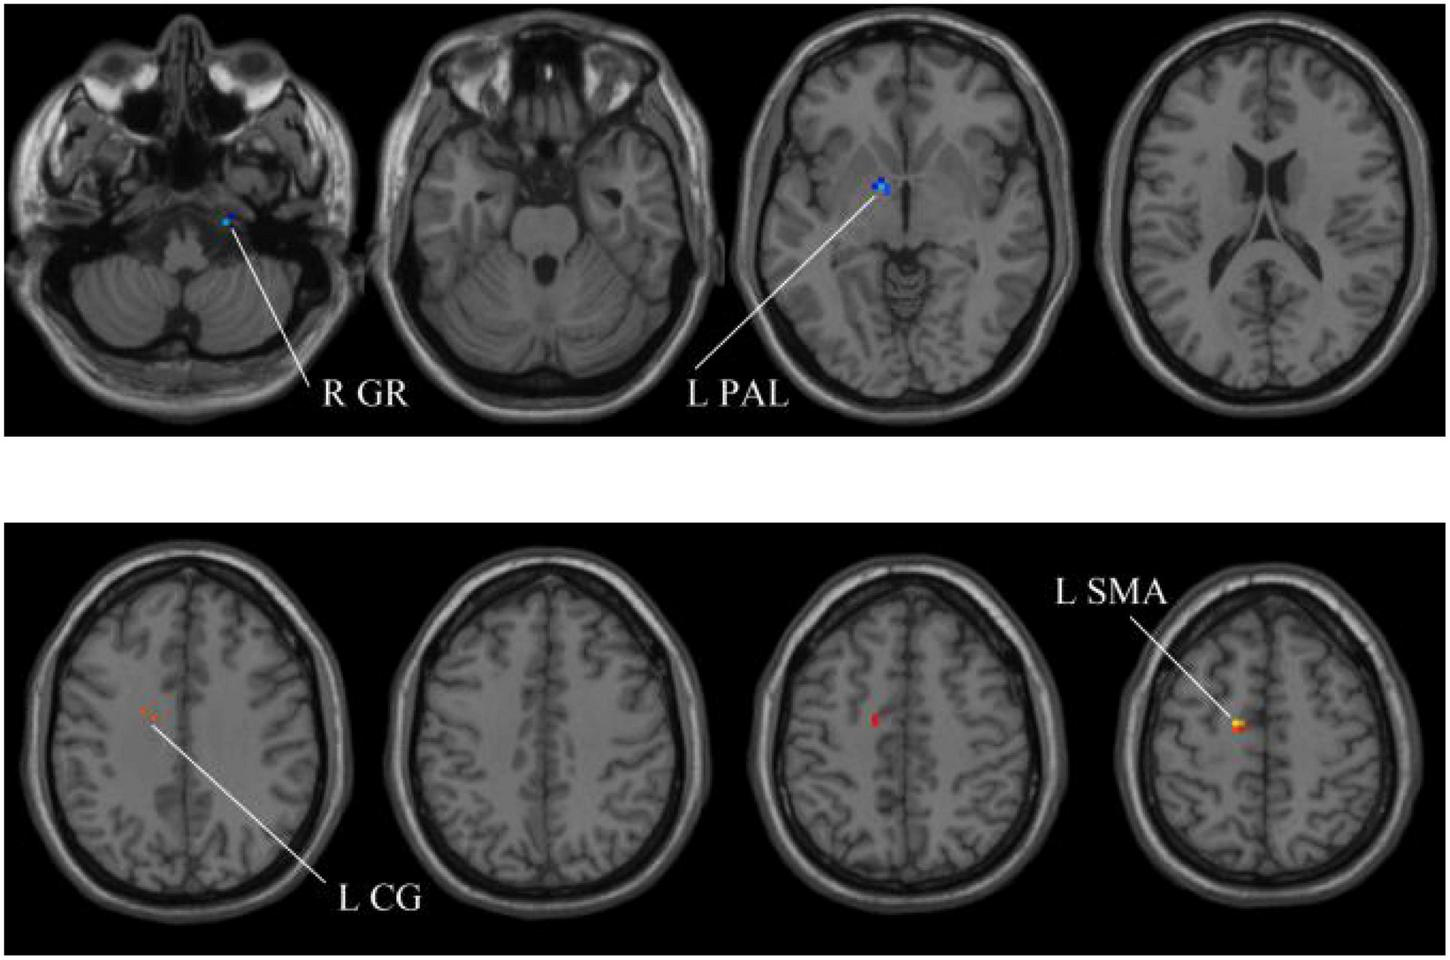
Compared with the HC group, the ReHo in aMCI group exhibits prominent differences based on MGS-WBC2. L, left; R, right; GR, gyrus rectus; PAL, pallidum; CG, cingulate gyrus; SMA, supplementary motor area.
FIGURE 5
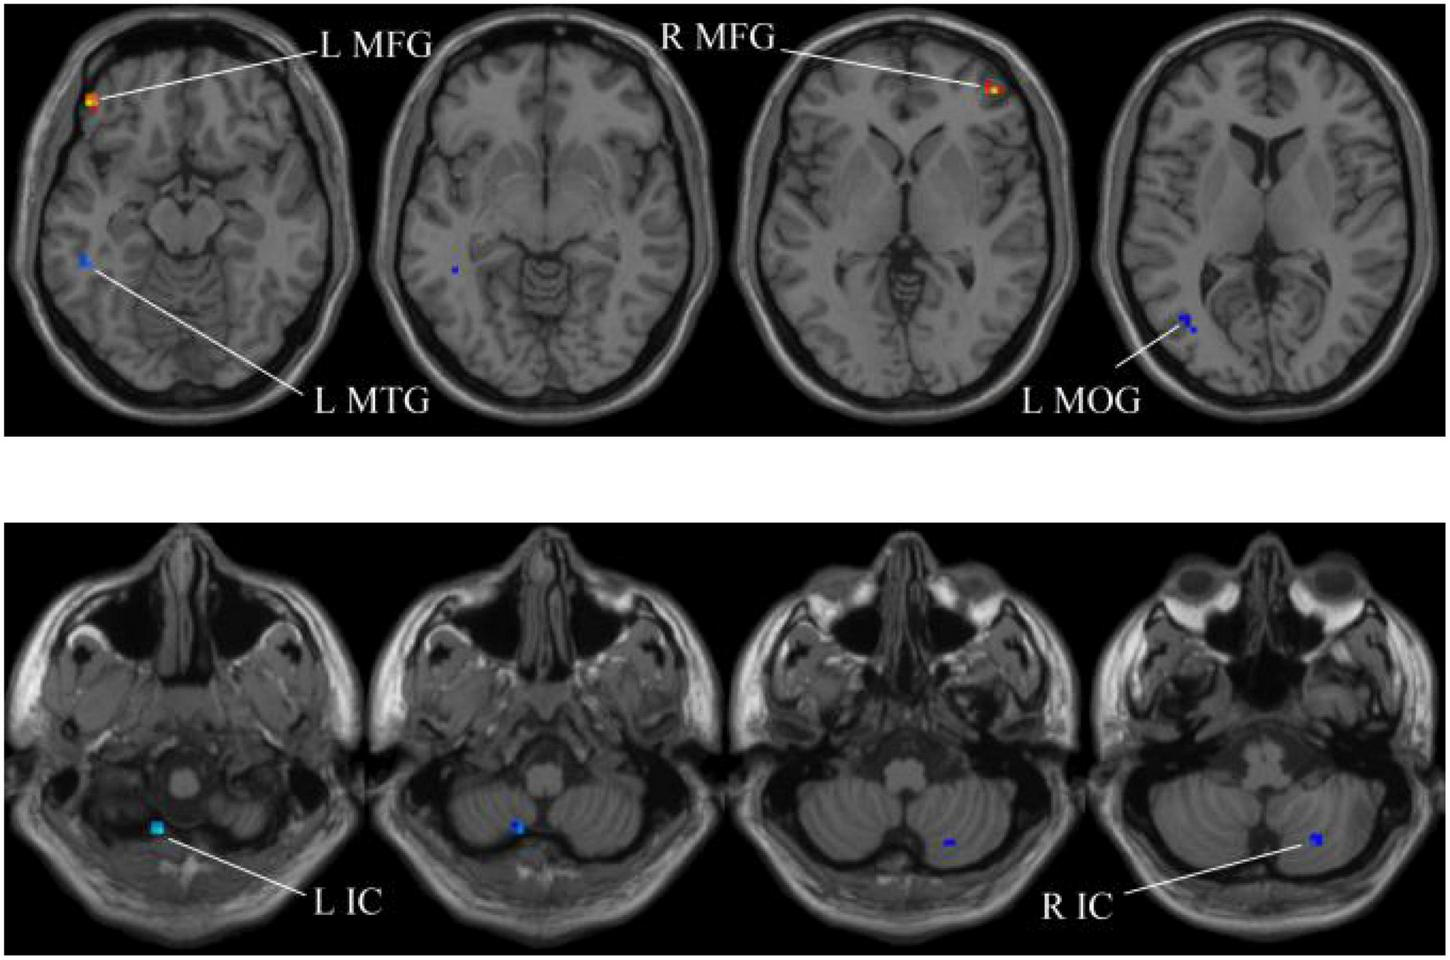
Compared with the HC group, the ReHo in aMCI group exhibits prominent differences based on SSW1. L, left; R, right; IC, inferior cerebellum; MTG, middle temporal gyrus; MFG, middle frontal gyrus; MOG, middle occipital gyrus.
Next, for the whole-brain structure after ALFF computation, as shown in Table 3 and Figure 6, only two significant regions of the brain corresponding to different locations are found, whereas no significant region exists using SSW1. As shown in Table 4, the results of MGS-WBC2 or MGS-WBC3 provide the ACC of 65.67, 73.13, 71.64, and 67.17% in four classifiers. In addition, we get the AUC of 65.67, 77.72, 77.18, and 75.22% in four classifiers. For F1-Score, we obtain 65.67, 72.73, 69.84, and 60.71% in four classifiers.
TABLE 3
| Region | Peak/MNI |
t-score | Cluster size | ||
| x | y | z | |||
| VER | 27 | 0 | 33 | 2.6341 | 21 |
| VER | 27 | −21 | 45 | −2.7783 | 5 |
The extracted clusters using MGS-WBC model after ALFF calculation.
The x, y, and z coordinates are the primary peak locations in the MNI space. Cluster size ≥ 5 voxels in two-sample t-test. VER, vermis.
FIGURE 6
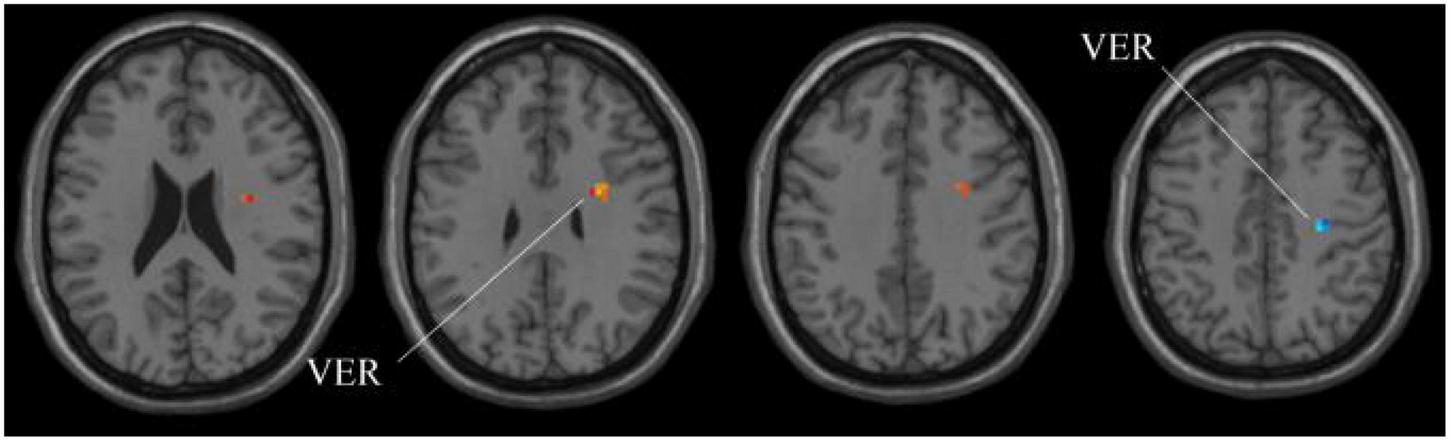
Compared with HC group, the ALFF in aMCI group exhibits prominent differences based on volatility detection in the MGS-WBC model. VER, Vermis.
TABLE 4
| Classifier | Method | ACC | F1-Score | AUC |
| NB | 0.6567 | 0.6567 | 0.6567 | |
| LDA | MGS-WBC2 | 0.7313 | 0.7273 | 0.7772 |
| LR | /MGS-WBC3 | 0.7164 | 0.6984 | 0.7718 |
| SVM | 0.6716 | 0.6071 | 0.7522 |
Performance metrics of different classifiers using MGS-WBC model after ALFF calculation.
MGS-WBC2 refers to the combination of volatility detection and significant threshold (0.001 < p < 0.05) in MGS-WBC model. MGS-WBC3 refers to the fused features, that is, the final output of MGS-WBC model.
Our goal is to make the average difference between the classes larger and the variance within the classes more stable. Consequently, we develop an MGS-WBC model using multiple significant thresholds and validation detection to generate the fused features of whole-brain structures. Through ablation experiments, it can be inferred that the features of whole-brain structures extracted using MGS-WBC can significantly improve the diagnostic performance of aMCI in typical classifiers compared with the SSW1. It indicates that the MGS-WBC model we present is valid, and the model can also effectively remove redundant information from the brain.
The Performance Analysis of Functional Network Features
In our experiments, to fully excavate the features of the functional network, we develop an MGS-WBC model to extract local features. Meanwhile, we present a VGBN-LM model to extract global features of the functional network and fuse its local features to improve the diagnostic performance of aMCI.
First, we select the local features of the functional network using MGS-WBC model to improve the diagnosis performance of aMCI. Our findings elucidate that three pairs of connected brain regions with notable differences are found using MGS-WBC2, including (45, 46), (73, 76), and (74, 76), as can be seen from Table 5. Also, two pairs of connected brain regions, such as (64, 58) and (63, 74), are found using SSW1. The brain regions involved in the local feature selection are shown in Figure 7, where the light blue ball denotes the selected brain regions, and the red line indicates that the two selected brains are connected. Notably, the number in Figure 7 and Table 6 denotes the brain regions segmented using the AAL template. The diagnosis performance of aMCI using local features resulted from the MGS-WBC model is sorted in Table 5 compared with SSF1. When the features generated from MGS-WBC2 are used as the input of the four classifiers, including NB, LDA, LR, and SVM, the classification metrics ranged from 55.38 to 69.61%. Meanwhile, the results elucidate that except for LDA, each of NB, LR, and SVM classifiers makes large improvements using MGS-WBC3 compared with SSF1. Although the ACC and F1-Score of LDA decreased by 1.49 and 0.24%, respectively, the AUC value increased by 5.35%.
TABLE 5
| Classifier | Method | ACC | F1-Score | AUC |
| NB | SSF1 | 0.7313 | 0.7188 | 0.7496 |
| MGS-WBC2 | 0.5672 | 0.5538 | 0.6346 | |
| MGS-WBC3 | 0.7463 | 0.7463 | 0.8048 | |
| LDA | SSF1 | 0.7313 | 0.7188 | 0.7531 |
| MGS-WBC2 | 0.6269 | 0.6032 | 0.6854 | |
| MGS-WBC3 | 0.7164 | 0.7164 | 0.8066 | |
| LR | SSF1 | 0.6567 | 0.5490 | 0.7308 |
| MGS-WBC2 | 0.6119 | 0.5938 | 0.6961 | |
| MGS-WBC3 | 0.7015 | 0.6667 | 0.7995 | |
| SVM | SSF1 | 0.7612 | 0.7576 | 0.7647 |
| MGS-WBC2 | 0.6418 | 0.5862 | 0.6943 | |
| MGS-WBC3 | 0.7761 | 0.7826 | 0.8324 |
Performance metrics of local features using MGS-WBC model.
SSF1 refers to the single significant threshold (p < 0.001) in the functional network (Zhang et al., 2015; Yang et al., 2018). MGS-WBC2 refers to the combination of volatility detection and significant threshold (0.001 < p < 0.05) in MGS-WBC model. MGS-WBC3 refers to the fused features, that is, the final output of MGS-WBC model.
FIGURE 7
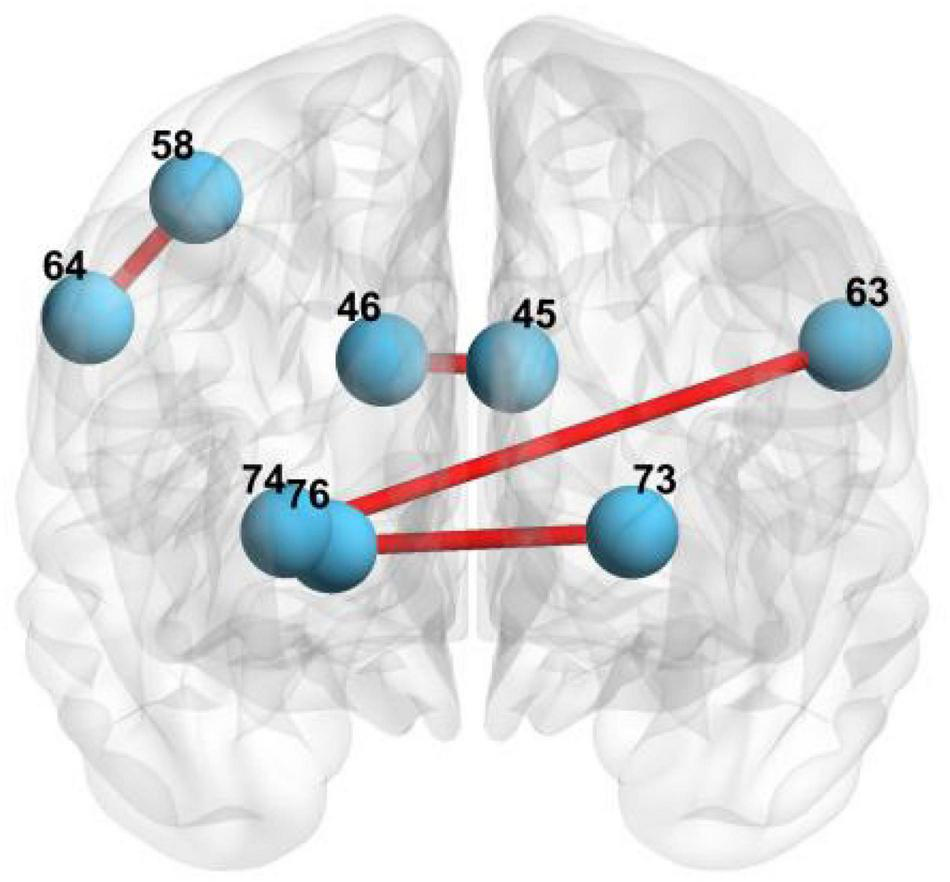
The brain regions involved in local feature selection: 45 represents the left cuneus; 46 represents right cuneus; 73 represents left putamen; 76 represents right pallidum; 74 represents right putamen; 64 represents right supramarginal gyrus; 58 represents postcentral gyrus; and 63 represents left supramarginal gyrus.
TABLE 6
| Connected regions | Group | Volatility detection | p-value |
| (45, 46) | aMCI | 0.2611 | 0.0157 |
| HC | 0.3063 | 0.0462 | |
| (73, 76) | aMCI | 0.6176 | 0.0335 |
| HC | 0.5038 | 0.0335 | |
| (74, 76) | aMCI | 0.5172 | 0.0133 |
| HC | 0.3487 | 0.0133 | |
| (64, 58) | aMCI and HC | – | 0.0006 |
| (63, 74) | aMCI and HC | – | 0.0006 |
Local feature selection of functional network using MGS-WBC model.
45 represents the left cuneus; 46 represents right cuneus; 73 represents left putamen; 76 represents right pallidum; 74 represents right putamen; 64 represents right supramarginal gyrus; 58 represents postcentral gyrus; and 63 represents left supramarginal gyrus.
We further develop a VGBN-LM model to extract global features of the functional network, including left MFG (p = 0.035, two-sample t-test), left hippocampus (p = 0.030, two-sample t-test), right hippocampus (p = 0.038, two-sample t-test), left amygdala (p = 0.009, two-sample t-test), and right amygdala (p = 0.013, two-sample t-test), and the global features, are then used as the input of classifiers to evaluate the validity of the extracted features. As summarized in Table 7, the results reveal that the ACC, F1-Score, and AUC in the four classifiers can achieve more than 61% using VGBN-LM. Moreover, the results of VGBN-LM can provide the ACC of 64.18, 62.69, 65.67, and 61.19% in four classifiers, and maximum improvements are 19.40, 5.97, 13.43, and 14.92% compared with VGBN-LM1. Also, compared to VGBN-LM1, the AUCs of the four classifiers are 69.96, 61.85, 69.79, and 67.29%, and the growth rates are 18.80 30.48, 16.49, and 27.63%. For F1-Score, we provide about 64.18, 62.69, 65.67, and 61.19% in four classifiers, increasing by 28.23, 11.31, 15.67, and 19.11% compared with VGBN-LM1. Furthermore, we reduce the number of features per data sample from 4,005 () to 5 using VGBN-LM.
TABLE 7
| Classifier | Method | ACC | F1-Score | AUC |
| NB | VGBN-LM1 | 0.4478 | 0.3934 | 0.5116 |
| VGBN-LM | 0.6418 | 0.6757 | 0.6996 | |
| LDA | VGBN-LM1 | 0.5672 | 0.5246 | 0.3137 |
| VGBN-LM | 0.6269 | 0.6377 | 0.6185 | |
| LR | VGBN-LM1 | 0.5224 | 0.5000 | 0.5330 |
| VGBN-LM | 0.6567 | 0.6567 | 0.6979 | |
| SVM | VGBN-LM1 | 0.4627 | 0.4375 | 0.3966 |
| VGBN-LM | 0.6119 | 0.6286 | 0.6729 |
Global features analysis using VGBN-LM model.
VGBN-LM1 refers to VGBN-LM model while without using two-sample t-test (p < 0.05). VGBN-LM refers to the method we propose in the “Vector Generation for Brain Networks Based on Laplacian Matrix (VGBN-LM)” Section.
Then, we fuse the multiscale features of functional network, including local features and global features, to further improve the diagnostic performance of aMCI. The local features of functional network are obtained using SSF1 and MGS-WBC2. As summarized in Table 8, using MGS-VGBN1, each of NB, LDA, LR, and SVM classifiers has a large value in ACC, F1-Score, and AUC, and its values ranged from 65.45 to 80.57%. Specifically, the results of MGS-VGBN2 provide the ACC of 76.12, 77.61, 77.61, and 79.10%, and the growth rates are 2.99, 4.48, 11.94, and 2.98% compared with SSF1. In addition, we obtain the AUC of 81.64, 81.19, 83.42, and 85.20% in four classifiers, and the improvements are 6.68, 5.88, 10.34, and 8.73% compared with SSF1. For F1-Score, we provide about 76.47, 77.61, 76.92, and 78.79% in four classifiers, and the improvements are 4.59, 5.73, 22.02, and 3.03% compared with SSF1.
TABLE 8
| Classifier | Method | ACC | F1-Score | AUC |
| NB | SSF1 | 0.7313 | 0.7188 | 0.7496 |
| MGS-VGBN1 | 0.7313 | 0.7353 | 0.7772 | |
| MGS-VGBN2 | 0.7612 | 0.7647 | 0.8164 | |
| LDA | SSF1 | 0.7313 | 0.7188 | 0.7531 |
| MGS-VGBN1 | 0.7463 | 0.7536 | 0.7763 | |
| MGS-VGBN2 | 0.7761 | 0.7761 | 0.8119 | |
| LR | SSF1 | 0.6567 | 0.5490 | 0.7308 |
| MGS-VGBN1 | 0.7164 | 0.6545 | 0.7879 | |
| MGS-VGBN2 | 0.7761 | 0.7692 | 0.8342 | |
| SVM | SSF1 | 0.7612 | 0.7576 | 0.7647 |
| MGS-VGBN1 | 0.7761 | 0.7761 | 0.8057 | |
| MGS-VGBN2 | 0.7910 | 0.7879 | 0.8520 |
Performance metrics of local and global features of functional network.
SSF1 refers to the single significant threshold (p < 0.001) in the functional network (Zhang et al., 2015; Yang et al., 2018). MGS-VGBN1 refers to local features generated from volatility detection of MGS-WBC model and global features generated from VGBN-LM model in functional network. MGS-VGBN2 refers to the fused features of functional network.
Regarding limited and high-dimensional data, we present a VGBN-LM model that excavates the global features of the functional network and fuses local features obtained by the MGS-WBC model. By ablation experiments, multiscale features of functional network we propose can greatly improve the diagnostic performance of aMCI compared to SSF1, indicating that the global features we propose can play a certain role in the intelligent diagnosis of aMCI. Besides, the features extracted by this study can accurately locate the significant regions in the brain, which is convenient for doctors to conduct further studies.
The Performance Analysis of Fused Features
In our experiments, we mainly fuse the multiscale features, including whole-brain structural features and features of functional network, to improve the diagnostic performance of aMCI.
As summarized in Table 9, compared with the single significant threshold (p < 0.001) in the whole-brain structures and function network (SSWF1) (Zhang et al., 2015; Yang et al., 2018), the ACC of NB, LDA, LR, and SVM classifiers are about 89.55, 91.04, 92.54, and 94.03%, increasing by 1.49, 1.49, 1.50, and 4.48%, respectively. Besides, this study provides the AUC of 95.63, 92.69, 97.59, and 97.33% in the four classifiers, increasing by 2.49, 1.96, 2.67, and 2.23%, respectively. For F1-Score, this study provides about 76.47, 77.61, 76.92, and 78.79% in the four classifiers, increasing by 1.67, 1.05, 1.64, and 4.26%, respectively.
TABLE 9
| Classifier | Method | ACC | F1-Score | AUC |
| NB | SSWF1 | 0.8806 | 0.8788 | 0.9314 |
| FUSE | 0.8955 | 0.8955 | 0.9563 | |
| LDA | SSWF1 | 0.8955 | 0.8986 | 0.9465 |
| FUSE | 0.9104 | 0.9091 | 0.9269 | |
| LR | SSWF1 | 0.9104 | 0.9091 | 0.9492 |
| FUSE | 0.9254 | 0.9254 | 0.9759 | |
| SVM | SSWF1 | 0.8955 | 0.8986 | 0.9510 |
| FUSE | 0.9403 | 0.9412 | 0.9733 |
The fused features analysis.
SSWF1 refers to the single significant threshold (p < 0.001) in the whole-brain structures and function network (Zhang et al., 2015; Yang et al., 2018). FUSE refers to the fused features obtained from MGS-WBC and VGBN-LM models in the whole-bran structures and functional network.
Over the years, the extraction of biomarkers of aMCI based on rs-fMRI data has been reported by numerous studies (Yang et al., 2018, 2021), yet very few studies about multiscale feature extraction of whole-brain structures and functional network due to limited data, and how to use machine learning methods to verify the effectiveness of the features. Furthermore, a robust and reliable system for aMCI detection is conducive to timely detecting and screening patients at a high risk of AD. Based on this, we extract multiscale features according to the characteristics of the brain and develop the framework of the diagnostic system. Our proposed models, including MGS-WBC model and VGBN-LM model, outperform the traditional approaches (SSWF1) (Zhang et al., 2015; Yang et al., 2018) in this study. It turns out that the fused features obtained from the MGS-WBC model and VGBN-LM model are more important than the traditional single-scale features in terms of the diagnosis of aMCI. Furthermore, our feature selection methods will make the diagnosis of aMCI more accurate and reliable, providing novel insights for the extraction of discriminative neuroimaging features.
Conclusion
In this study, we present a system for the diagnosis of aMCI. We first develop an MGS-WBC model to extract discriminative features of whole-brain structures and functional networks. Then, we propose a VGBN-LM model that excavates the global features of the functional network and fuses its local features, thus overcoming the low availability of the functional network features. Finally, we fuse all the features generated from the MGS-WBC model and VGBN-LM model to further improve the diagnostic performance of aMCI. The results demonstrate that this study outperforms the traditional method. In conclusion, the proposed feature extraction methods can be utilized to detect other similar neurological diseases of the brain, providing new insights for the intelligent construction of the CAD system. The future study contains applying our approaches to other brain diseases and verifying the robustness of the system. Besides, more data will be collected so that deep learning models can be used for accurate classification.
Publisher’s Note
All claims expressed in this article are solely those of the authors and do not necessarily represent those of their affiliated organizations, or those of the publisher, the editors and the reviewers. Any product that may be evaluated in this article, or claim that may be made by its manufacturer, is not guaranteed or endorsed by the publisher.
Statements
Data availability statement
Publicly available datasets were analyzed in this study. This data can be found here: http://adni.loni.usc.edu/.
Ethics statement
Ethical review and approval was not required for the study on human participants in accordance with the local legislation and institutional requirements. Written informed consent for participation was not required for this study in accordance with the national legislation and the institutional requirements. Ethical review and approval was not required for the animal study because publicly available datasets were analyzed in this study. This data can be found here: http://adni.loni.usc.edu/. Written informed consent was obtained from the individual(s) for the publication of any potentially identifiable images or data included in this article.
Author contributions
CC was responsible for writing the manuscript and doing the experiments. CY and EC instructed the experiments. JC was responsible for drawing pictures in the manuscript. All authors contributed to the article and approved the submitted version.
Funding
This study was supported by the Fujian Province Innovation Strategy Research Program (No. 2020R01020196) and the YongTai Institute of Artificial Intelligence.
Conflict of interest
The authors declare that the research was conducted in the absence of any commercial or financial relationships that could be construed as a potential conflict of interest.
References
1
Association A. S. (2018). 2018 Alzheimer’s disease facts and figures.Alzheimer’s Dement.14367–429. 10.21926/obm.geriatr.1904079
2
Barone E. Domenico F. Di Cassano T. Arena A. Tramutola A. Lavecchia M. et al (2016). Impairment of biliverdin reductase-A promotes brain insulin resistance in Alzheimer disease: a new paradigm.Free Radic. Biol. Med.91127–142. 10.1016/j.freeradbiomed.2015.12.012
3
Belkin M. Niyogi P. (2001). “Laplacian eigenmaps and spectral techniques for embedding and clustering,” in Proceedings of the 14th International Conference on Neural Information Processing Systems: Natural and Synthetic, (Columbia: MIT Press), 585–591. 10.1162/0899766041732396
4
Bian Z. Li Q. Wang L. Lu C. Yin S. Li X. (2014). Relative power and coherence of EEG series are related to amnestic mild cognitive impairment in diabetes.Front. Aging Neurosci.6:11. 10.3389/fnagi.2014.00011
5
Chen C. C. M. Schwender H. Keith J. Nunkesser R. Mengersen K. Macrossan P. (2011). Methods for Identifying SNP Interactions: a Review on Variations of Logic Regression, Random Forest and Bayesian Logistic Regression.IEEE/ACM Trans. Comput. Biol. Bioinform.81580–1591. 10.1109/TCBB.2011.46
6
Ciulli S. Citi L. Salvadori E. Valenti R. Poggesi A. Inzitari D. et al (2016). Prediction of Impaired Performance in Trail Making Test in MCI Patients With Small Vessel Disease Using DTI Data.IEEE J. Biomed. Health Inform.201026–1033. 10.1109/JBHI.2016.2537808
7
Cristovao F. Cascianelli S. Canakoglu A. Carman M. Nanni L. Pinoli P. et al (2022). Investigating Deep Learning Based Breast Cancer Subtyping Using Pan-Cancer and Multi-Omic Data.IEEE/ACM Transac. Comput. Biol. Bioinf.19121–134. 10.1109/TCBB.2020.3042309
8
Dadar M. Pascoal T. Manitsirikul S. Misquitta K. Fonov V. Tartaglia M. et al (2017). Validation of a Regression Technique for Segmentation of White Matter Hyperintensities in Alzheimer’s Disease.IEEE Transac. Med. Imag.361758–1768. 10.1109/TMI.2017.2693978
9
Harrison T. Maass A. Adams J. Du R. Baker S. Jagust W. (2019). Tau deposition is associated with functional isolation of the hippocampus in aging.Nat. Comm.10:4900. 10.1038/s41467-019-12921-z
10
Ji S. Ye J. (2008). Generalized linear discriminant analysis: a unified framework and efficient model selection.IEEE Transact. Neur. Netw.191768–1782. 10.1109/TNN.2008.2002078
11
Ju R. Hu C. Zhou P. Li Q. (2019). Early Diagnosis of Alzheimer’s Disease Based on Resting-State Brain Networks and Deep Learning.IEEE/ACM Trans. Comp. Biol. Bioinform.16244–257. 10.1109/TCBB.2017.2776910
12
Kam T. Zhang H. Jiao Z. Shen D. (2020). Deep Learning of Static and Dynamic Brain Functional Networks for Early MCI Detection.IEEE Transact. Med. Imag.39478–487. 10.1109/TMI.2019.2928790
13
Kassani P. Gossmann A. Wang Y. (2020). Multimodal Sparse Classifier for Adolescent Brain Age Prediction.IEEE J. Biomed. Health Inform.24336–344. 10.1109/JBHI.2019.2925710
14
Khatun S. Morshed B. Bidelman G. (2019). A Single-Channel EEG-Based Approach to Detect Mild Cognitive Impairment via Speech-Evoked Brain Responses.IEEE Transac. Neur. Syst. Rehabilit. Eng.271063–1070. 10.1109/TNSRE.2019.2911970
15
Kim H.-G. Park S. Rhee Y. H. Lee M. K. Ryu C.-W. Lee Y. S. et al (2020). Evaluation and Prediction of Early Alzheimer’s Disease Using a Machine Learning-based Optimized Combination-Feature Set on Gray Matter Volume and Quantitative Susceptibility Mapping.Curr. Alzheimer Res.17428–437. 10.2174/1567205017666200624204427
16
Lee J. Kim Y. Jeong Y. Na D. Kim J. Lee K. et al (2015). Inference of brain pathway activities for Alzheimer’s disease classification.BMC Med. Inform. Dec. MakingS1. 10.1186/1472-6947-15-S1-S1
17
Lei B. Yang P. Zhuo Y. Zhou F. Ni D. Chen S. et al (2019). Neuroimaging Retrieval via Adaptive Ensemble Manifold Learning for Brain Disease Diagnosis.IEEE J. Biomed. Health Inform.231661–1673. 10.1109/JBHI.2018.2872581
18
Li R. Rui G. Zhao C. Wang C. Fang F. Zhang Y. (2020). Functional Network Alterations in Patients With Amnestic Mild Cognitive Impairment Characterized Using Functional Near-Infrared Spectroscopy.IEEE Transact. Neural Syst. Rehabil. Eng.28123–132. 10.1109/TNSRE.2019.2956464
19
Li W. Zhang L. Qiao L. Shen D. (2020). Toward a Better Estimation of Functional Brain Network for Mild Cognitive Impairment Identification: a Transfer Learning View.IEEE J. Biomed. Health Inform.241160–1168. 10.1109/JBHI.2019.2934230
20
Li X. Zhu Z. Zhao W. Yu S. Wen D. Xie Y. et al (2018). Decreased resting-state brain signal complexity in patients with mild cognitive impairment and Alzheimer’s disease: a multi-scale entropy analysis.Biomed. Optics Exp.9:1916. 10.1364/BOE.9.001916
21
Li Y. Liu J. Tang Z. Lei B. (2020). Deep Spatial-Temporal Feature Fusion From Adaptive Dynamic Functional Connectivity for MCI Identification.IEEE Transac. Med. Imag.392818–2830. 10.1109/TMI.2020.2976825
22
Liao W. Li J. Ji G. Wu G. Long Z. Xu Q. et al (2019). Endless Fluctuations: Temporal Dynamics of the Amplitude of Low Frequency Fluctuations.IEEE Transac. Med. Imag.382523–2532. 10.1109/TMI.2019.2904555
23
Liu X. Lu R. Ma J. Chen L. Qin B. (2016). Privacy-Preserving Patient-Centric Clinical Decision Support System on Naïve Bayesian Classification.IEEE J. Biomed. Health Inform.20655–668. 10.1109/JBHI.2015.2407157
24
Nadarajah S. Kotz S. (2006). Statistical Distribution of the Measure of Coherence.IEEE Transac. Biomed. Eng.532409–2410. 10.1109/TBME.2006.883625
25
Sangnawakij P. Niwitpong S.-A. (2017). Confidence intervals for coefficients of variation in two-parameter exponential distributions.Comm. Stat.466618–6630. 10.1006/tpbi.2000.1504
26
Sundaram P. Luessi M. Bianciardi M. Stufflebeam S. Hamalainen M. Solo V. (2020). Individual Resting-State Brain Networks Enabled by Massive Multivariate Conditional Mutual Information.IEEE Trans. Med. Imag.391957–1966. 10.1109/TMI.2019.2962517
27
Ting C. Ombao H. Salleh S. Latif A. Z. A. (2020). Multi-Scale Factor Analysis of High-Dimensional Functional Connectivity in Brain Networks.IEEE Trans. Netw. Sci. Eng.7449–465. 10.1109/tnse.2018.2869862
28
Vicente T. Hoai M. Samaras D. (2018). Leave-One-Out Kernel Optimization for Shadow Detection and Removal.IEEE Trans. Patt. Analy. Mach. Intell.40682–695. 10.1109/TPAMI.2017.2691703
29
Wang M. Lian C. Yao D. Zhang D. Liu M. Shen D. (2020). Spatial-Temporal Dependency Modeling and Network Hub Detection for Functional MRI Analysis via Convolutional-Recurrent Network.IEEE Trans. Bio-Med. Eng.672241–2252. 10.1109/TBME.2019.2957921
30
Wang Z. Zheng Y. Zhu D. Bozoki A. Li T. (2018). Classification of Alzheimer’s Disease, Mild Cognitive Impairment and Normal Control Subjects Using Resting-State fMRI Based Network Connectivity Analysis.IEEE J. Transl. Eng. Health Med.6:1801009. 10.1109/JTEHM.2018.2874887
31
Xi Q. Zhao X. Wang P. Guo Q. He Y. (2013). Abnormal intrinsic brain activity in amnestic mild cognitive impairment revealed by amplitude of low-frequency fluctuation: a resting-state functional magnetic resonance imaging study.Chin. Med. J.1262912–2917.
32
Xi Y. Chen Y. Jin Y. Han G. Song M. Song T. et al (2022). Versatile nanomaterials for Alzheimer’s disease: pathogenesis inspired disease-modifying therapy.J. control. Rel.34538–61. 10.1016/j.jconrel.2022.02.034
33
Xiao L. Wang J. Kassani P. Zhang Y. Bai Y. Stephen J. et al (2020). Multi-Hypergraph Learning-Based Brain Functional Connectivity Analysis in fMRI Data.IEEE Transac. Med. Imag.391746–1758. 10.1109/TMI.2019.2957097
34
Xu B. Li Y. Kim Y. (2017). Classification of Finger Movements Based on Reflection Coefficient Variations of a Body-Worn Electrically Small Antenna.IEEE Anten. Wirel. Prop. Lett.161812–1815.
35
Xue C. Sun H. Hu G. Qi W. Yue Y. Rao J. et al (2020). Disrupted Patterns of Rich-Club and Diverse-Club Organizations in Subjective Cognitive Decline and Amnestic Mild Cognitive Impairment.Front. Neurosci.14:575652. 10.3389/fnins.2020.575652
36
Yang L. Yan Y. Wang Y. Hu X. Lu J. Chan P. et al (2018). Gradual Disturbances of the Amplitude of Low-Frequency Fluctuations (ALFF) and Fractional ALFF in Alzheimer Spectrum.Front. Neurosci.12:975. 10.3389/fnins.2018.00975
37
Yang P. Zhou F. Ni D. Xu Y. Chen S. Wang T. et al (2021). Fused Sparse Network Learning for Longitudinal Analysis of Mild Cognitive Impairment.IEEE Transac. Cybernet.51233–246. 10.1109/TCYB.2019.2940526
38
Zhang X. Hu B. Ma X. Xu L. (2015). Resting-state whole-brain functional connectivity networks for MCI classification using L2-regularized logistic regression.IEEE Transact. Nanobiosci.14237–247. 10.1109/TNB.2015.2403274
39
Zhen D. Xia W. Yi Z. Zhao P. Zhong J. Shi H. et al (2018). Alterations of brain local functional connectivity in amnestic mild cognitive impairment.Transl. Neurodegen.7:26.
40
Zhou Q. Goryawala M. Cabrerizo M. Wang J. Barker W. Loewenstein D. et al (2014). An optimal decisional space for the classification of Alzheimer’s disease and mild cognitive impairment.IEEE Transact. Bio-Med. Eng.612245–2253. 10.1109/TBME.2014.2310709
Summary
Keywords
machine learning, aMCI, MGS-WBC, multi-scale features, VGBN-LM
Citation
Cai C, Cao J, Yang C and Chen E (2022) Diagnosis of Amnesic Mild Cognitive Impairment Using MGS-WBC and VGBN-LM Algorithms. Front. Aging Neurosci. 14:893250. doi: 10.3389/fnagi.2022.893250
Received
10 March 2022
Accepted
20 April 2022
Published
30 May 2022
Volume
14 - 2022
Edited by
Yuanpeng Zhang, Nantong University, China
Reviewed by
Zhifan Gao, Sun Yat-sen University, China; Cheng Wang, Huaqiao University, China
Updates
Copyright
© 2022 Cai, Cao, Yang and Chen.
This is an open-access article distributed under the terms of the Creative Commons Attribution License (CC BY). The use, distribution or reproduction in other forums is permitted, provided the original author(s) and the copyright owner(s) are credited and that the original publication in this journal is cited, in accordance with accepted academic practice. No use, distribution or reproduction is permitted which does not comply with these terms.
*Correspondence: Chenhui Yang, ych987@126.comE. Chen, chenexm@163.com
This article was submitted to Alzheimer’s Disease and Related Dementias, a section of the journal Frontiers in Aging Neuroscience
Disclaimer
All claims expressed in this article are solely those of the authors and do not necessarily represent those of their affiliated organizations, or those of the publisher, the editors and the reviewers. Any product that may be evaluated in this article or claim that may be made by its manufacturer is not guaranteed or endorsed by the publisher.