 Xianglian Meng1
 Junlong Liu1
 Xiang Fan1
 Chenyuan Bian2
 Qingpeng Wei1
 Ziwei Wang1
 Wenjie Liu1*
 Zhuqing Jiao3*
- 1School of Computer Information and Engineering, Changzhou Institute of Technology, Changzhou, China
- 2Shandong Provincial Key Laboratory of Digital Medicine and Computer-Assisted Surgery, Affiliated Hospital of Qingdao University, Qingdao, China
- 3School of Computer Science and Artificial Intelligence, Changzhou University, Changzhou, China
Alzheimer’s disease (AD) is a neurodegenerative brain disease, and it is challenging to mine features that distinguish AD and healthy control (HC) from multiple datasets. Brain network modeling technology in AD using single-modal images often lacks supplementary information regarding multi-source resolution and has poor spatiotemporal sensitivity. In this study, we proposed a novel multi-modal LassoNet framework with a neural network for AD-related feature detection and classification. Specifically, data including two modalities of resting-state functional magnetic resonance imaging (rs-fMRI) and diffusion tensor imaging (DTI) were adopted for predicting pathological brain areas related to AD. The results of 10 repeated experiments and validation experiments in three groups prove that our proposed framework outperforms well in classification performance, generalization, and reproducibility. Also, we found discriminative brain regions, such as Hippocampus, Frontal_Inf_Orb_L, Parietal_Sup_L, Putamen_L, Fusiform_R, etc. These discoveries provide a novel method for AD research, and the experimental study demonstrates that the framework will further improve our understanding of the mechanisms underlying the development of AD.
Introduction
Alzheimer’s disease (AD) is a neurodegenerative brain disease that leads to the damage and death of brain nerve cells in disease progression. It destroys people’s memory, learning, language, cognition, life, and other abilities, and seriously affects the quality of life of patients and families (Zhang and Wang, 2015; Lam et al., 2021; Lim et al., 2021). AD risk is also greater later in life for people with cardiovascular disease, high blood pressure, and diabetes. The Alzheimer’s Association published a “2021 Alzheimer’s Disease Facts and Figures,” reporting a significant increase in AD deaths worldwide due to the COVID-19 pandemic. According to the clinical symptoms of patients, Alzheimer’s disease is divided into a normal state (normal control, NC), mild cognitive impairment (mild cognitive impairment, MCI) state, and diseased AD state. MCI manifests as a decline in memory and thinking abilities at a rate greater than the decline in perception caused by normal aging, but this decline does not interfere with normal social interaction and work. However, patients with MCI have a high probability of further deterioration to AD (Zhang et al., 2016; Wang et al., 2017). It is currently difficult to distinguish MCI from memory decline due to normal aging, and MCI involves very subtle brain changes. Therefore, the early diagnosis of MCI/AD is extremely challenging (Davis et al., 2018; Wang et al., 2018; Zhang et al., 2018; Potashman et al., 2021).
Magnetic resonance imaging (MRI) has become a hot spot in the field of AD and MCI disease research due to its non-invasiveness, multi-sequence imaging, high resolution, and strong repeatability (Zhang Y.-D. et al., 2014; Zhang et al., 2015a). Resting-state functional MRI (rs-fMRI) and MRI diffusion tensor imaging (DTI) are imaging techniques that can study brain mechanisms from the perspective of human brain functional connectivity and structural connectivity. They provide imaging evidence for the pathological studies on AD and MCI. Many studies have found the network structure related to the resting state in the cerebral cortex, which covers the brain regions that show a decline in metabolic function in the early stages of AD, including the posterior cingulate cortex and the internal parietal region (Choo et al., 2010; Hu et al., 2014; Zhang et al., 2015b; Shim et al., 2017; Wang et al., 2021). Neuroimaging data from a single modality usually can only reflect part of the brain characteristics, but many current research studies show that the fusion of information from multiple imaging modalities can reflect the brain activity mechanism more comprehensively (Zhang Q et al., 2014; Zhang and Shi, 2020; Lei et al., 2021; Jiao et al., 2022).
Functional MRI quantifies the temporal correlation between brain regions by detecting the blood oxygen level dependence (BOLD) in the human brain (Zhang and Shi, 2020; Wang et al., 2017), while DTI can track the spatial correlation of white matter fiber tracts by exploiting the kinetic mechanism of water molecule diffusion. Combining the spatiotemporal high-resolution information reflected by fMRI and DTI can comprehensively describe biological brain characteristics from a spatiotemporal perspective and improve the accuracy of brain network modeling, which is of great scientific significance for studying the neurophysiological mechanisms of AD/MCI diseases (Dyrba et al., 2015; Aderghal et al., 2020; Xu et al., 2021). Wee et al. considered the information regarding the complementary features of multiple imaging techniques, integrated multi-modal information from DTI and rs-fMRI, and used multi-kernel support vector machines to build a classifier for the study of disease classification and early prediction of MCI (Dai et al., 2019). Schonberg et al. used fMRI to define the regions of interest for DTI, providing a more comprehensive and functionally relevant white matter mapping map for preoperative preparation of brain tumors (Schonberg et al., 2006). Qi et al. propose a framework that combines DTI and fMRI multimodal imaging data to accurately identify potential neurological markers responsible for working memory deficits (Qi et al., 2018). Li et al. integrated the image information of rs-fMRI and DTI into a Lasso modeling framework for the accurate diagnosis of brain network lesions in early AD, further demonstrating that fusion of multi-modal information can effectively identify brain network features (Li et al., 2020). The above-mentioned finding proves that compared with single-modal data, more valuable features can be obtained by using multi-modal data. The multi-modal fusion method may further improve the recognition accuracy of AD/MCI (Zhang et al., 2015b; Wang et al., 2016; Mak et al., 2017).
In multi-modal neuroimaging analysis, since the features extracted from the original images tend to have higher dimensionality, only a few clinical samples contain complete multi-modal data, which will produce the curse of dimensionality. Therefore, we propose a neural network framework with Lasso regression for multi-modal image feature extraction and classification. Figure 1 illustrates the neural network framework of multi-modal neuroimaging for Alzheimer’s disease.
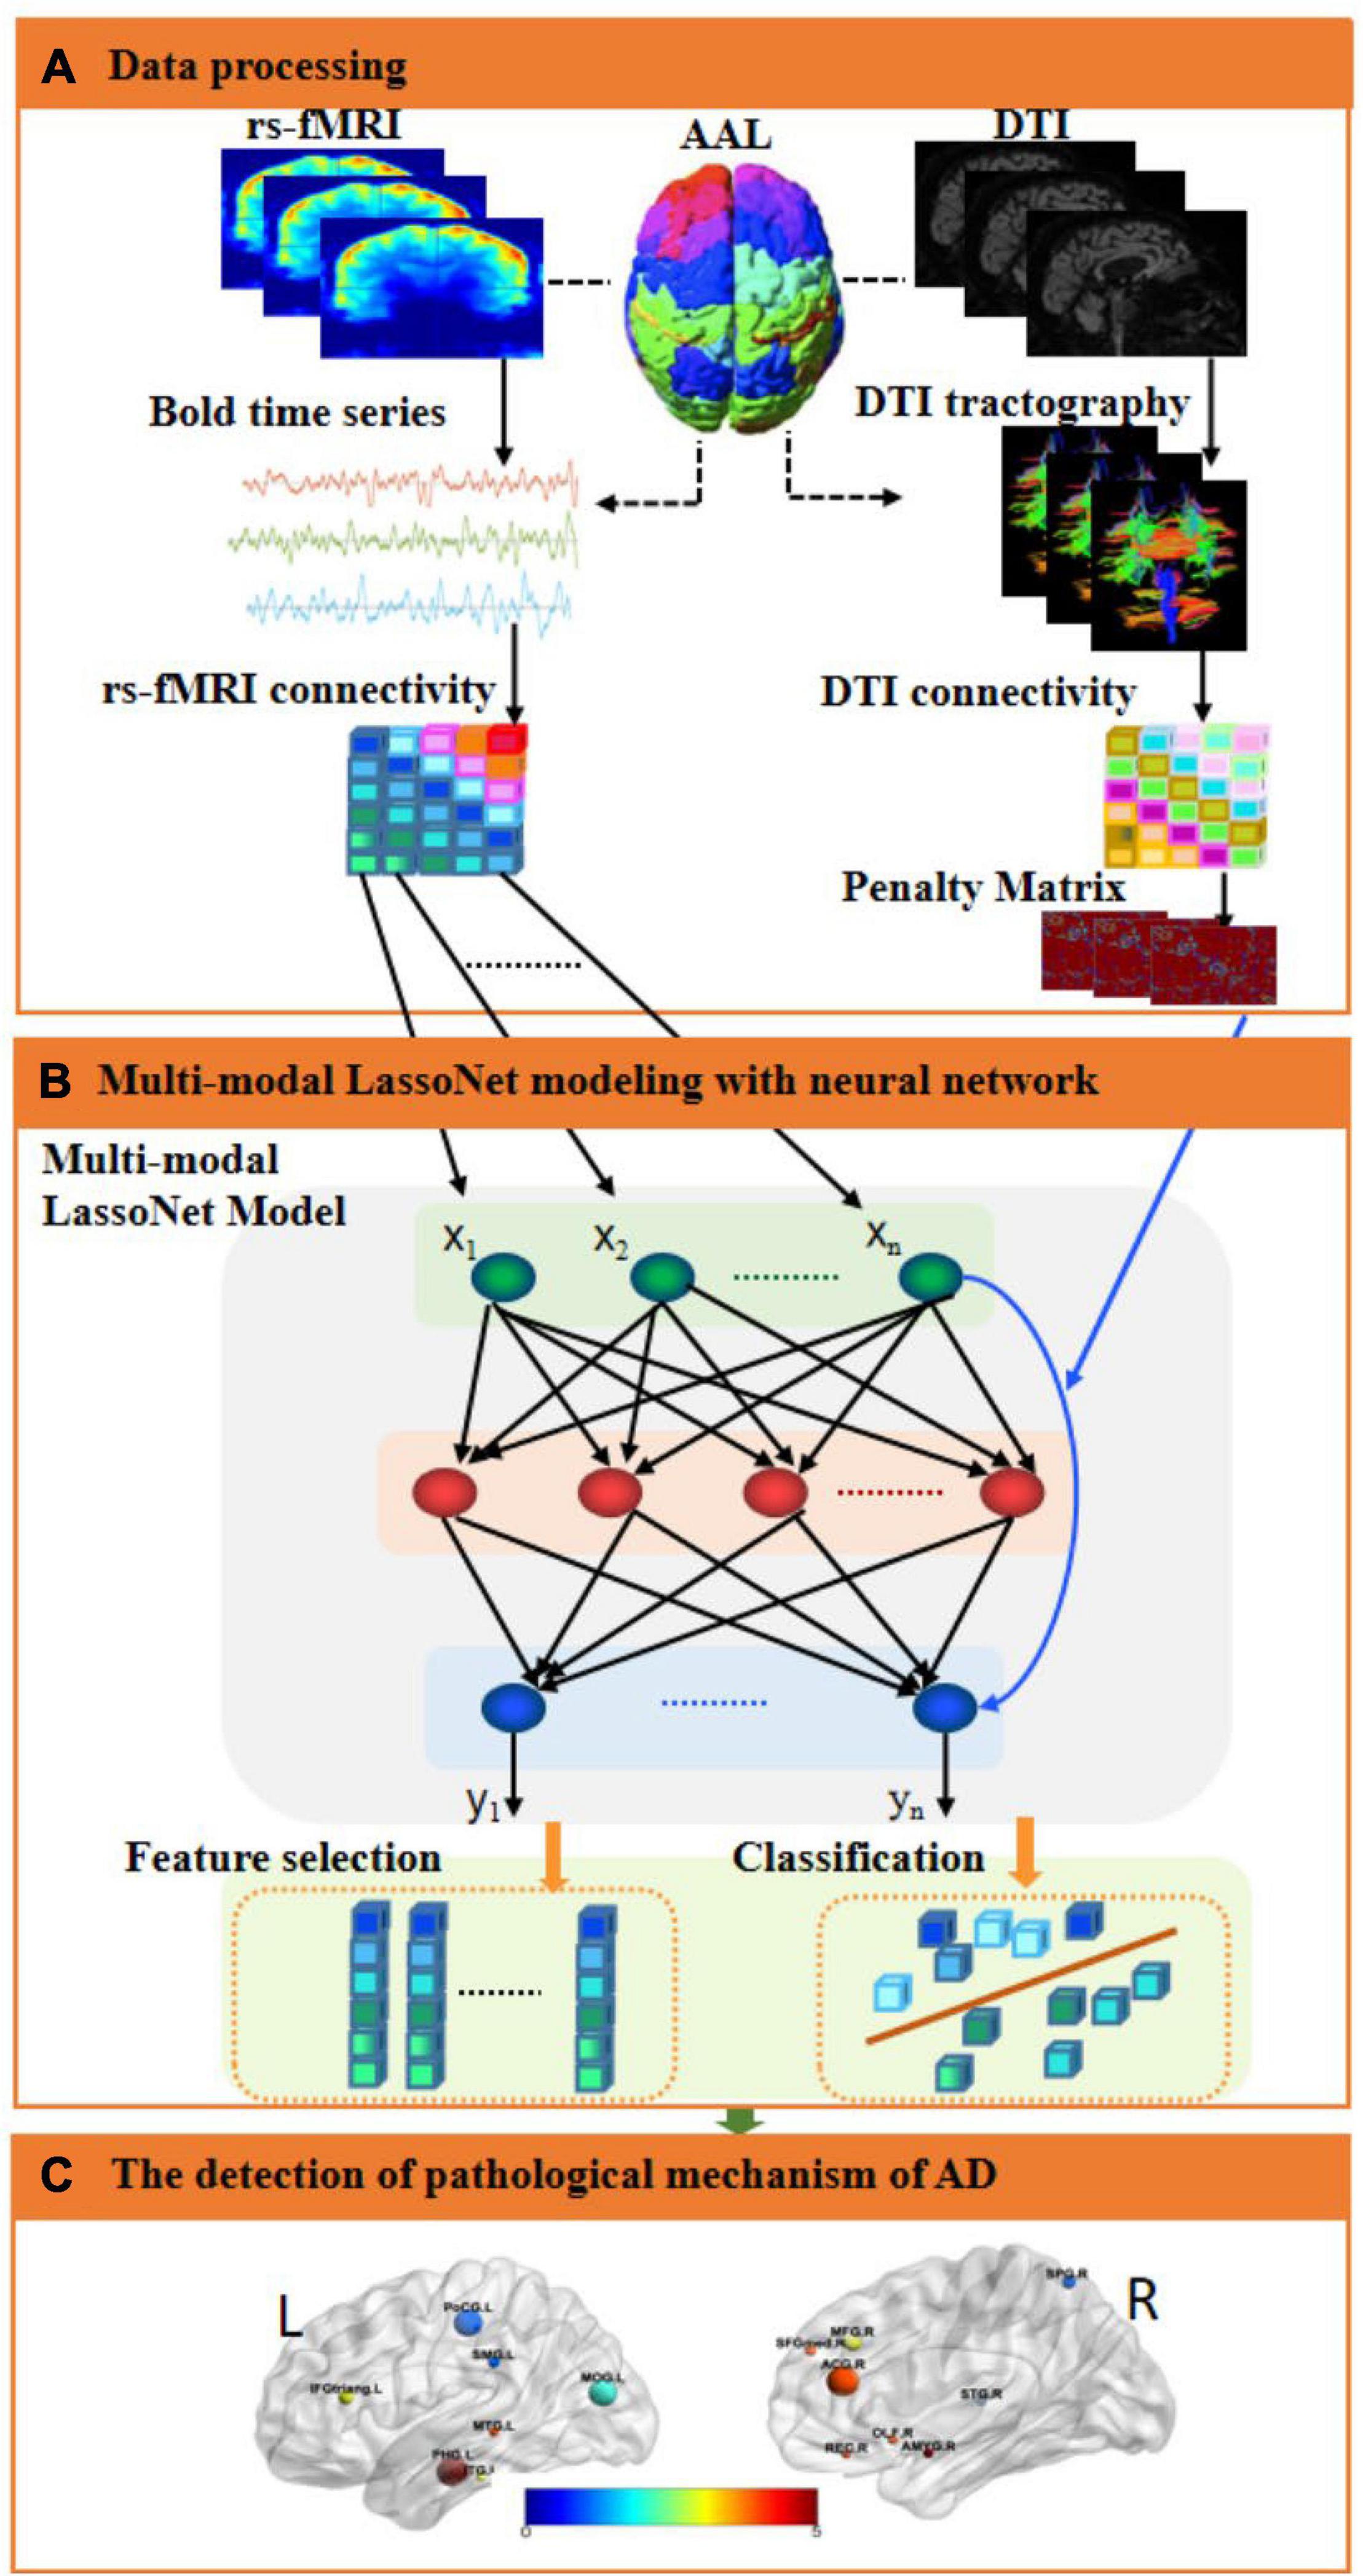
Figure 1. An illustration of the proposed multi-modal framework for AD. (A) Data processing. The fMRI and DTI images were preprocessed, and then the regions of interest were extracted as fMRI and DTI features through the AAL template, and the corresponding brain networks of fMRI and DTI were obtained, respectively. Then, computed the inverse proportional function of the structural brain network as a penalty matrix. (B) Multi-modal LassoNet Modeling with a neural network. We constructed a multi-modal network framework for feature selection and classification based on the LassoNet model. It consisted of residual connection and an arbitrary feed-forward neural network. The input to the network was the fMRI feature information. The penalty matrix was introduced to the residual connection to sparse features. (C) The detection of the pathological mechanism of AD. We visualized brain regions for selected features to analyze the affected discriminative brain regions.
Materials and Methods
Data Processing
The images of 85 subjects (33 healthy control, 29 early mild cognitive impairment, and 23 AD) were downloaded from the Alzheimer’s Disease Neuroimaging Initiative (ADNI1), including rs-fMRI and DTI. All neuroimaging data were obtained using a SIEMENS 3T MRI scanner. For the rs-fMRI images, the echo time (TE), the repetition time (TR), the flip angle, the slice thickness, and the time points were set as 30.0 ms, 3.0 s, 90, 3.4 mm, and 197, respectively. For the DTI data, the gradient directions, the echo time, the repetition time, the flip angle, and the voxel size were set as 30, 95 ms, 12.4 s, 90, and 2×2×2 ms3. For the T1 images, the TE, TR, flip angle, the slice thickness, and the T1 time were set as 3.0 ms, 2.3 s, 9.0, 1.0 mm, and 900 ms, and the collection plane was SAGITTAL. The Table 1 showed the significant differences among the three groups in terms of gender (p < 0.001), age (p < 0.001), MMSE (p < 0.001), and EDU (p < 0.001) by t-test.
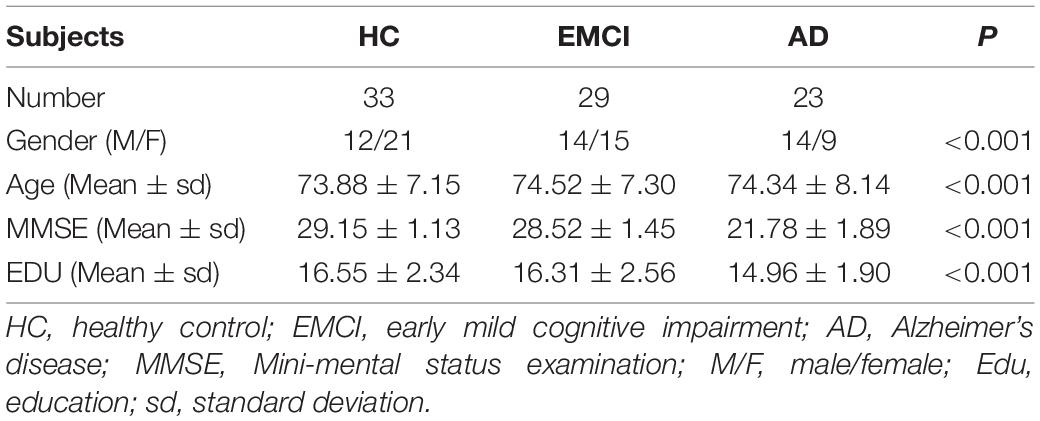
Table 1. Participant characteristics.
Data Acquisition
The rs-fMRI images were processed using SPM122 (Han and Glenn, 2018) and DPARBI 6.13 (Yan et al., 2016) as follows: (1) The raw DICOM files were converted to NIFITI format. (2) The first 10 time series nodes of each individual subject were removed manually to avoid the magnetic field inhomogeneity problem caused by the startup of the scanner and the influence of the discomfort of the subject’s initial state on the results. (3) The interslice scan times were corrected to the same time point. (4) Images with head movement beyond 2.5 mm translation or 2.5-degree rotation were removed to correct head movement during scanning. (5) The head motion, white matter signal, and cerebrospinal fluid signal were set as the main noise covariates to reduce the influence of noisy covariate signals on scan results and reduce biological artifacts. (6) Different morphological brains were standardized to the same standard template and were registered to T1 images. (7) The 4 × 4 × 4 mm3 Gaussian kernel was applied for spatial smoothing to reduce spatial noise. (8) The linear trend was removed, and 0.01–0.1 Hz filtering was applied to reduce the interference due to low-frequency and high-frequency noise. The automated anatomical labeling (AAL; Tzourio-Mazoyer et al., 2002) atlas was applied to segment the brain into 90 regions, and the time series of BOLD signals were extracted.
The DTI data were processed using FSL4 (Woolrich et al., 2009), PANDA5 (Abbasi et al., 2021), and MRIcron (NITRC: MRIcron: Tool/Resource Info) software in Ubuntu18.04 as follows: (1) The raw DICOM files were converted to NIFITI format (*.nii.gz). (2) The brain templates were estimated based on non-diffusion-weighted b0 images using the bet command. (3) The non-brain space was removed using the fslroi command and eddy current correction. (4) The diffusion tensor metric was calculated using the dtifit command. (5) Deterministic white matter tract in the brain was tracked using the dti_recon and dti_tracker commands. (6) A part of the skull tissue in the T1 images was removed using the bet command. (7) The fractional anisotropy (FA) value of each subject was registered to its corresponding T1 image using the flirt command of FSL. When DTI images were registered with other images, DTI data causing significant deformities were removed. It should be noted that the DTI images and rs-fMRI images were registered with the same T1 imaging.
Multi-Modal LassoNet Framework Construction
The rs-fMRI functional brain networks can measure temporal correlations between anatomically segmented brain regions; DTI-based structural brain networks can characterize and track spatial white matter tracts in the brain. Herein, it is considered to unify the multi-modal image information of rs-fMRI and DTI in a brain network modeling framework, combining the respective advantages of the two modalities, which can describe the dynamic mechanism of the brain network from the perspective of time and space, and realize the construction of the brain network model.
After preprocessing of fMRI images, we obtained 187 time series (BOLD signal) of 85 participants, and there were 90 ROIs in each image. Let us assume that we have n participants and i ROIs. We explored a multi-modal network framework for feature selection and classification based on the LassoNet (Yan and Bien, 2017; Chen et al., 2019). For n participant, we assumed that the fMRI time series of the i-th ROI was xi={x1i,x2i,..xdi} ∈ Rn×d,(i = 185), where d was the number of time points. Our goal was to find the best function f*(xi) for predicting y_i (the type of Alzheimer’s diagnosis). As the problem of learning f*(xi) is non-parametric, we assumed that there was no linear or quadratic restriction. The multi-modal network consisted of two parts: residual connection and arbitrary feed-forward neural network. The penalty was introduced to the residual connection to sparse features. We define G to be the class of residual feed-forward neural networks:
where gW(X) denotes a feed-forward network with weights W, W(1) ∈ ℝd×K represents the weights in the first hidden layer, and θϵRd represents the weights in the residual layer.
Let L be the empirical loss2 on the training set with fMRI time series, then L is defined as Equation 2.
where W is the weight of the first hidden part; θ is the weight of the residual part; n is the number of participants as training observations size, and ℓ is the loss function. The LassoNet model objective function is defined as Equation 3.
where is the weight of feature i and d is the data dimension.
The coupling strength of human brain functional connectivity and structural connectivity is closely related to the brain excitation process, and stronger structural brain connectivity is likely to lead to the enhancement of corresponding functional connectivity. Here, we introduced a parameter named the punishment factor to improve the LassoNet model. The punishment matrix of each DTI image is defined as the inverse proportional function of structural brain networks (Equation 4).
where ρji is the FA information between j-th brain region and i-th brain region in the DTI network, and σ is the mean of the standard deviation of all elements in the structural brain network of all participants. Equation 4 is used to penalize the estimated connection strength value between the j-th ROI and the i-th ROI.
Since each participant had a corresponding DTI structure network information D, we calculated the max feature λmax of each D using Equation 5.
where λmax=max(λa), E is the unity matrix, and x is the eigenvector. The DTI feature matrix is defined as Equation 6.
Then, we modify the LassoNet objective function to Equation 7.
So, the multi-modal LassoNet framework was constructed. We summarize the training algorithm of multi-modal LassoNet, as shown Table 2.
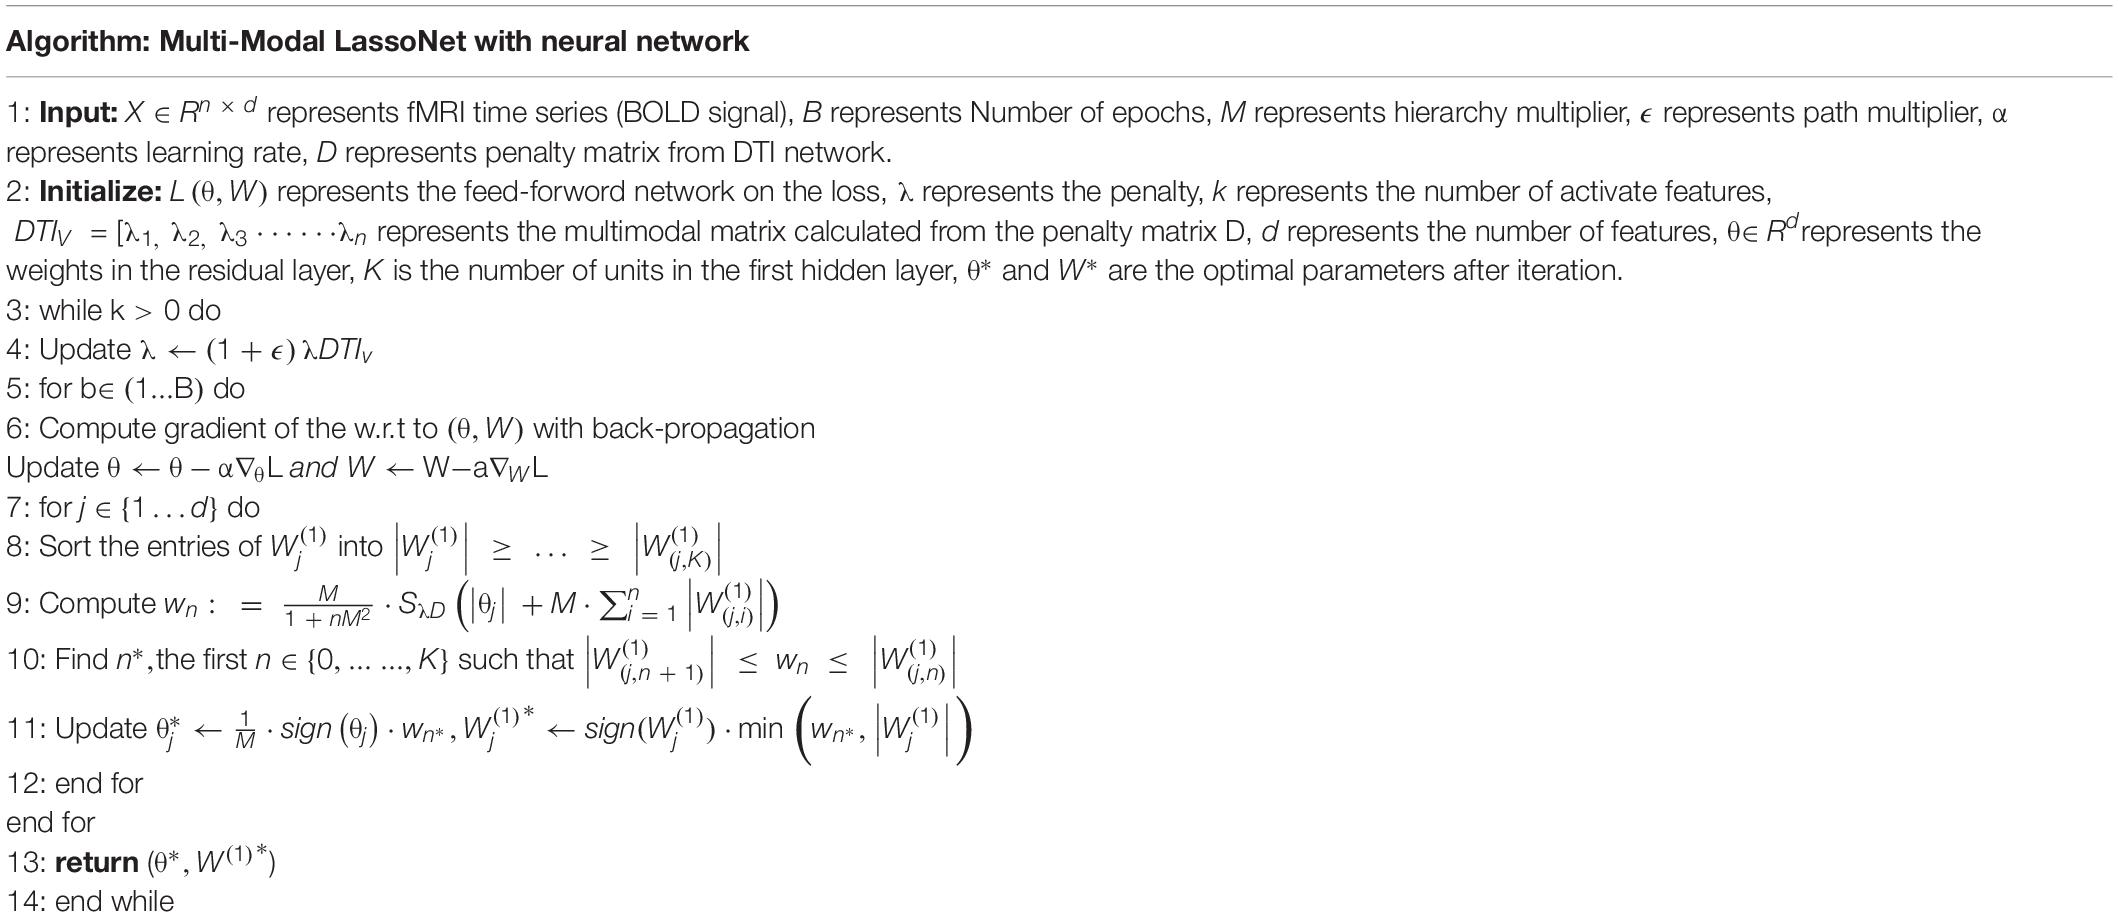
Table 2. Training algorithm of multi-modal LassoNet.
Feature Detection and Model Comparison
Using the resulting images, we obtained the initial dataset of 85 participants and 187×90features in each participant. We extracted three groups from the dataset, namely, AD-HC, AD-EMCI, and EMCI-HC. For each group, the train set, validation set, and test set were selected randomly using the ratio Strain:Svalid:Stest=6:2:2. Integrating with DTI structure network information, the Strain and Svalid were applied to filter the optimal λ and integrating with DTI structure network information. With the resulting λ, the Strain and Stest were used to detect features and get the sparse feature matrix that classified well in AD-HC, AD-EMCI, or EMCI-HC.
Since the multi-modal framework was optimized based on the LassoNet model, to determine the superiority of our proposed framework, we used the classic Lasso, Group Lasso, Sparse Group Lasso, and ElasticNet to compare the classification accuracy.
Given n data samples {(x1,y1),(x2,y2),⋯(xn,yn)},xi ∈ Rd, x_i was a d dimensional vector, that is, each observed data were composed of the values of d variables, and each yi ∈ R was a real value. Let the mapping f:Rd→R that minimize the sum of squared errors, and the optimization objective is defined as Equation 8.
The optimization objective of Lasso (Equation 8) was obtained by introducing the L1 regularization term in Equation 9.
The Lasso was applied to the group and the Group Lasso was obtained as Equation 10.
The Sparse Group Lasso was obtained by integrating the original Lasso into the Group Lasso, as Equation 11.
The definition of ElasticNet was obtained by combining L1 and L2 regularization and Lasso (Equation 12).
The same Strain and Svalid were applied to filter the optimal parameters. Using the same Strain and Stes, the experiments were repeated 10 times in all five frameworks with the optimal parameters.
Evaluation Metrics
In this study, the samples were positive and negative, and the results classified had the following cases:
True Positive (TP): the positive sample was predicted as a positive sample.
True Negative (TN): the negative sample was predicted as a negative sample.
False Positive (FP): the negative sample was predicted as a positive sample.
False Negative (FN): the positive sample was predicted as a negative sample.
ACC (accuracy) is the number of correctly classified samples divided by the total number of samples (Equation 13).
SEN (sensitivity) is the proportion of pairs of all positive samples (Equation 14).
SPE (specificity) is the proportion of pairs of all negative samples (Equation 15).
GMean is the geometric mean (Equation 16).
F1 is a comprehensive evaluation indicator. Sometimes, accuracy and sensitivity needed to be considered together as Equation 17.
The receiver operating characteristic (ROC) curve and the area under curve (AUC) value are also used to evaluate the performance of the classifier.
Results
The Results of Parameter Optimization
Initially, 187×90=16,830 features were obtained and Strain and Svalid were applied to filter the optimal parameters. The λ was the interval of (0.1, 1), and the corresponding accuracy was calculated in each group. As shown in Figure 2, the best accuracy of the AD-HC group is 92.79% and λ is 0.1. The peak value of the EMCI-HC group is at the node of 0.3. The prediction accuracy reaches a peak with a λ value of 0.2. We can also observe that the accuracy of the AD-HC group is much higher than the other two groups. This may be caused by the large difference between AD and HC. An interesting finding is that the accuracy of the AD-EMCI group is the lowest and the gap in this group is also the lowest. This proves that the similarity between AD and EMCI is higher, and the similar features make the classification more stable.
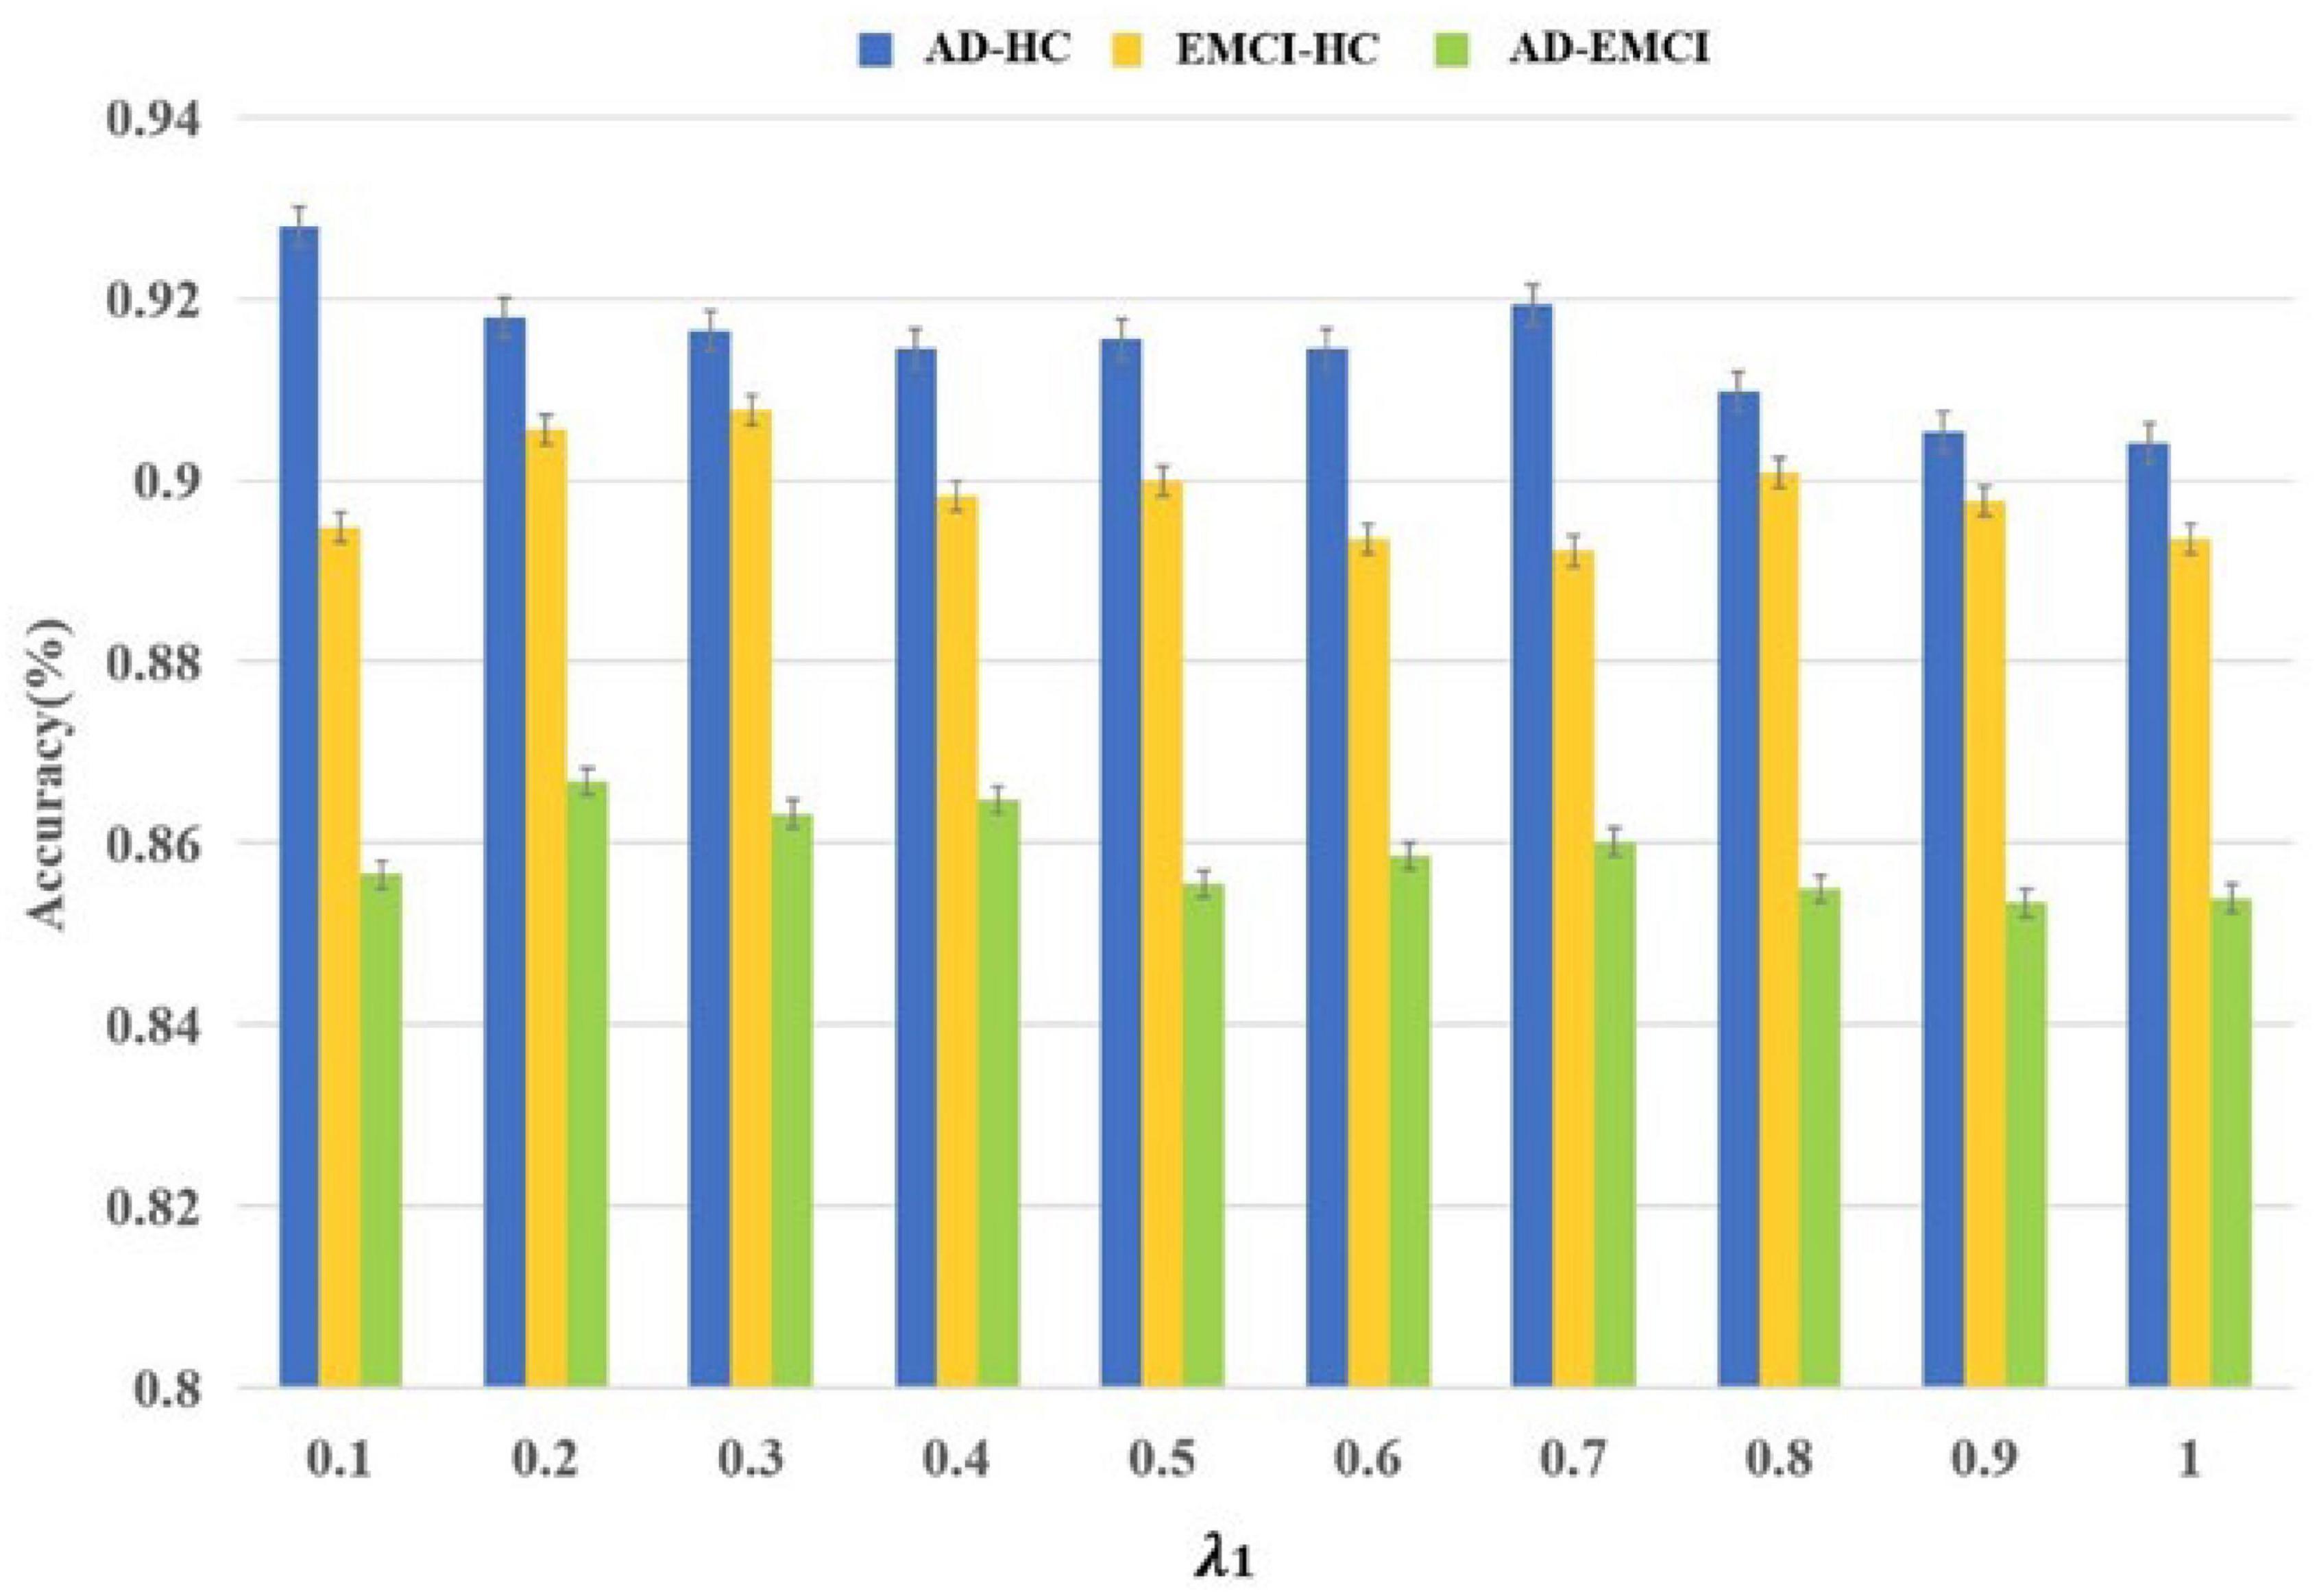
Figure 2. The relationship between the accuracies and λ.
Comparison With Other Methods
We applied the same Strain and Stest to assess the performance of the five models, and 10 independent experiments were conducted to evaluate the universality of these models. As shown in Figure 3, the Multi-modal LassoNet has good prediction accuracy, and in three groups, the accuracy of the Multi-modal LassoNet is the highest, far exceeding the other four models. The peaks of the Multi-modal LassoNet are above 90% in the AD-HC and EMCI-HC groups, and in the other four models, they are all below 90%. In the AD-EMCI group, the best accuracy is above 85%, and in the other four models, it is below 80%. Additionally, the gap of the Multi-modal LassoNet in 10 experiments is less than 2%. It can be seen from Figure 3 that the Multi-modal LassoNet framework has satisfactory classification accuracy in different groups only by adjusting the λ. The curves of the Multi-modal LassoNet also prove that the proposed framework has good stability, and the introduction of DTI information improves the classification performance of the LassoNet model.
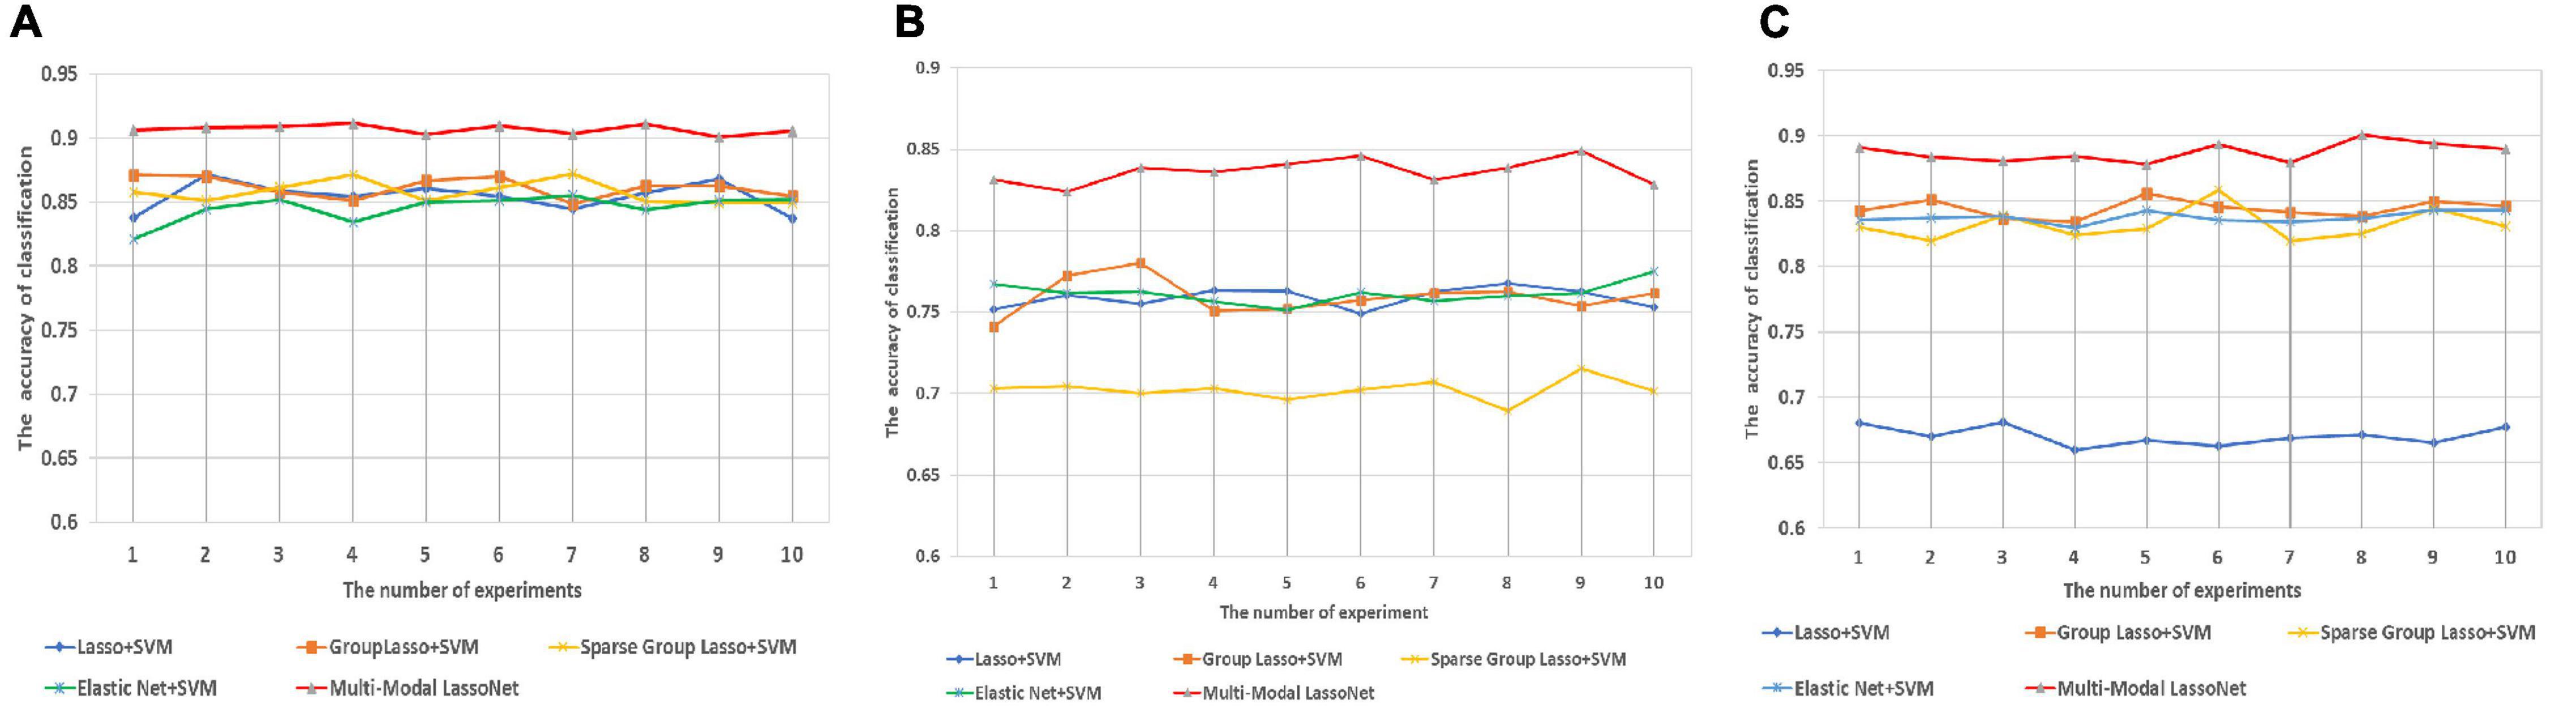
Figure 3. The prediction accuracy was obtained through 10 experiments for five methods in three groups. (A) Prediction accuracy of AD-HC group. (B) Prediction accuracy of AD-EMCI group. (C) Prediction accuracy of EMCI-HC group.
The classification information of the five methods is presented in Table 3. Multi-modal LassoNet classifiers reported very good performance. In the AD-HC group classification, ACC, SEN, SPE, GMean, and F1 were 90.68 ± 0.34, 88.81 ± 0.68, 91.91 ± 0.55, 90.34 ± 0.36, and 88.25 ± 0.52, respectively. In the AD-EMCI group classification, ACC, SEN, SPE, GMean, and F1 were 83.63 ± 0.74, 87.32 ± 1.22, 79.00 ± 1.33, 83.05 ± 0.76, and 85.70 ± 0.84, respectively. In the EMCI-HC group classification, ACC, SEN, SPE, GMean, and F1 were 88.77 ± 0.70, 90.87 ± 1.05, 87.06 ± 0.95, 88.94 ± 0.69, and 87.92 ± 0.83, respectively.
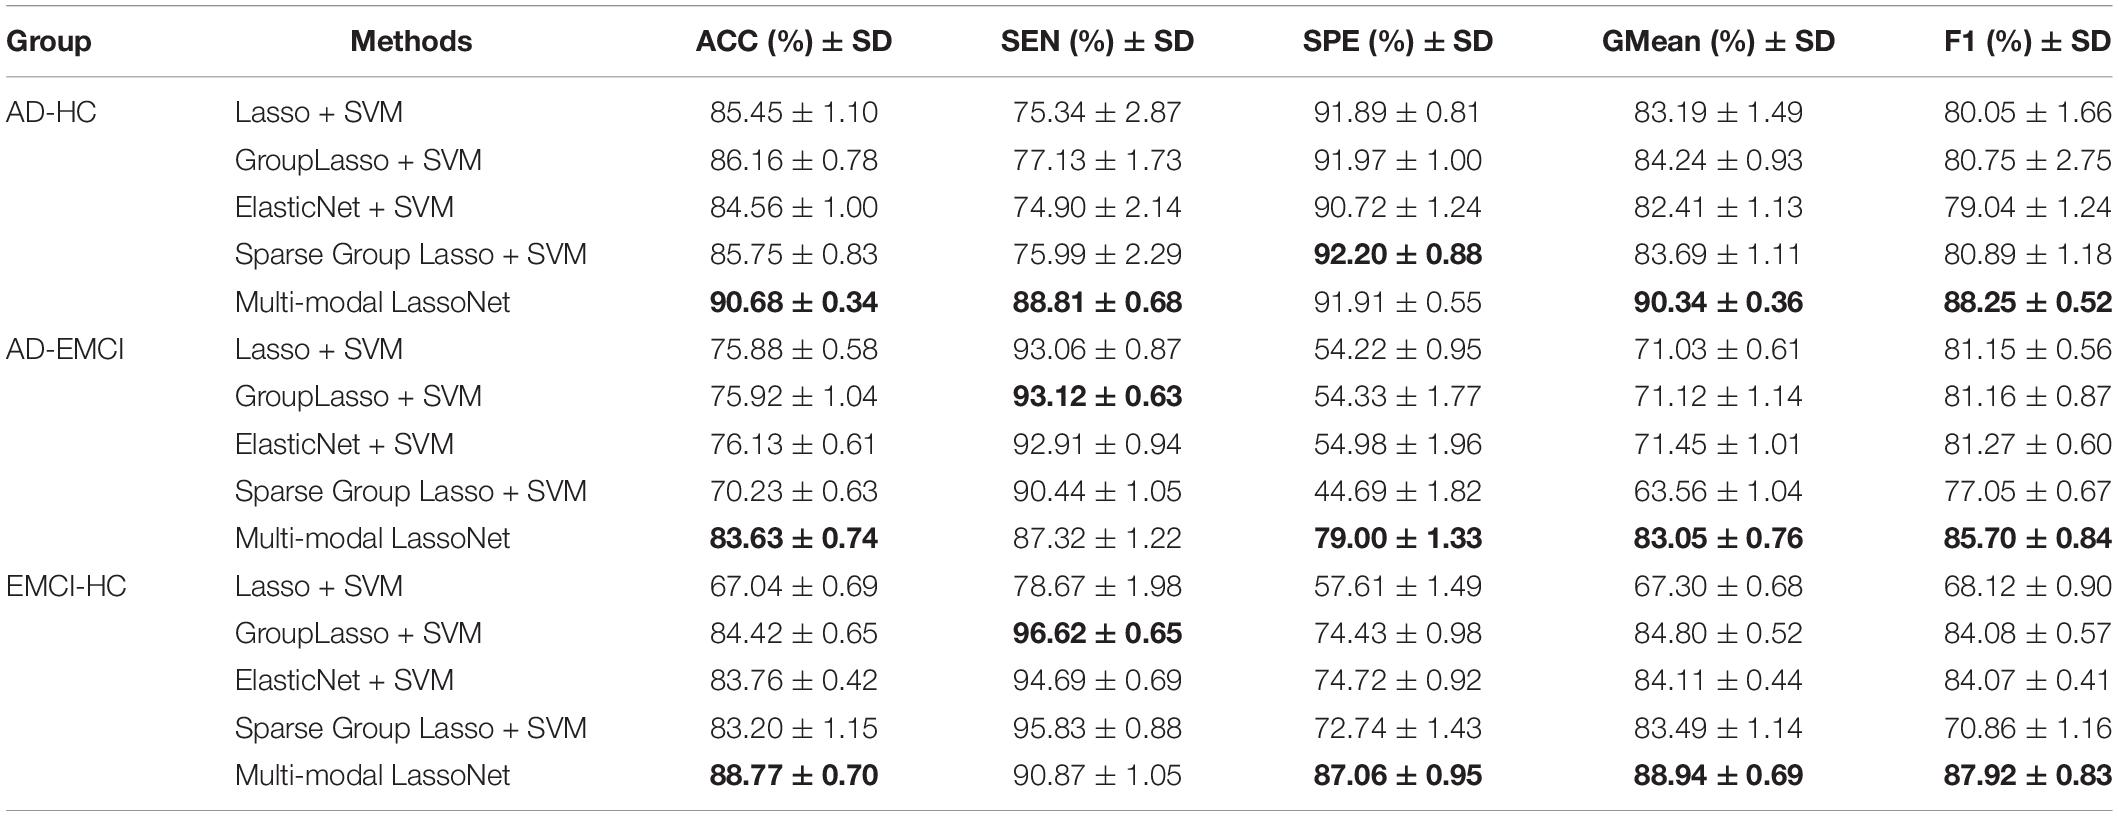
Table 3. The classification performance comparison of the five methods.
For further validation of our framework and results, we plot the ROC curves of five methods for the AD-HC, AD-EMCI, and EMCI-HC groups, as shown Figure 4. The AUC values of our proposed Multi-modal LassNet for AD-HC, AD-EMCI, and EMCI-HC groups were 0.9120, 0.8478, and 0.8975, respectively.
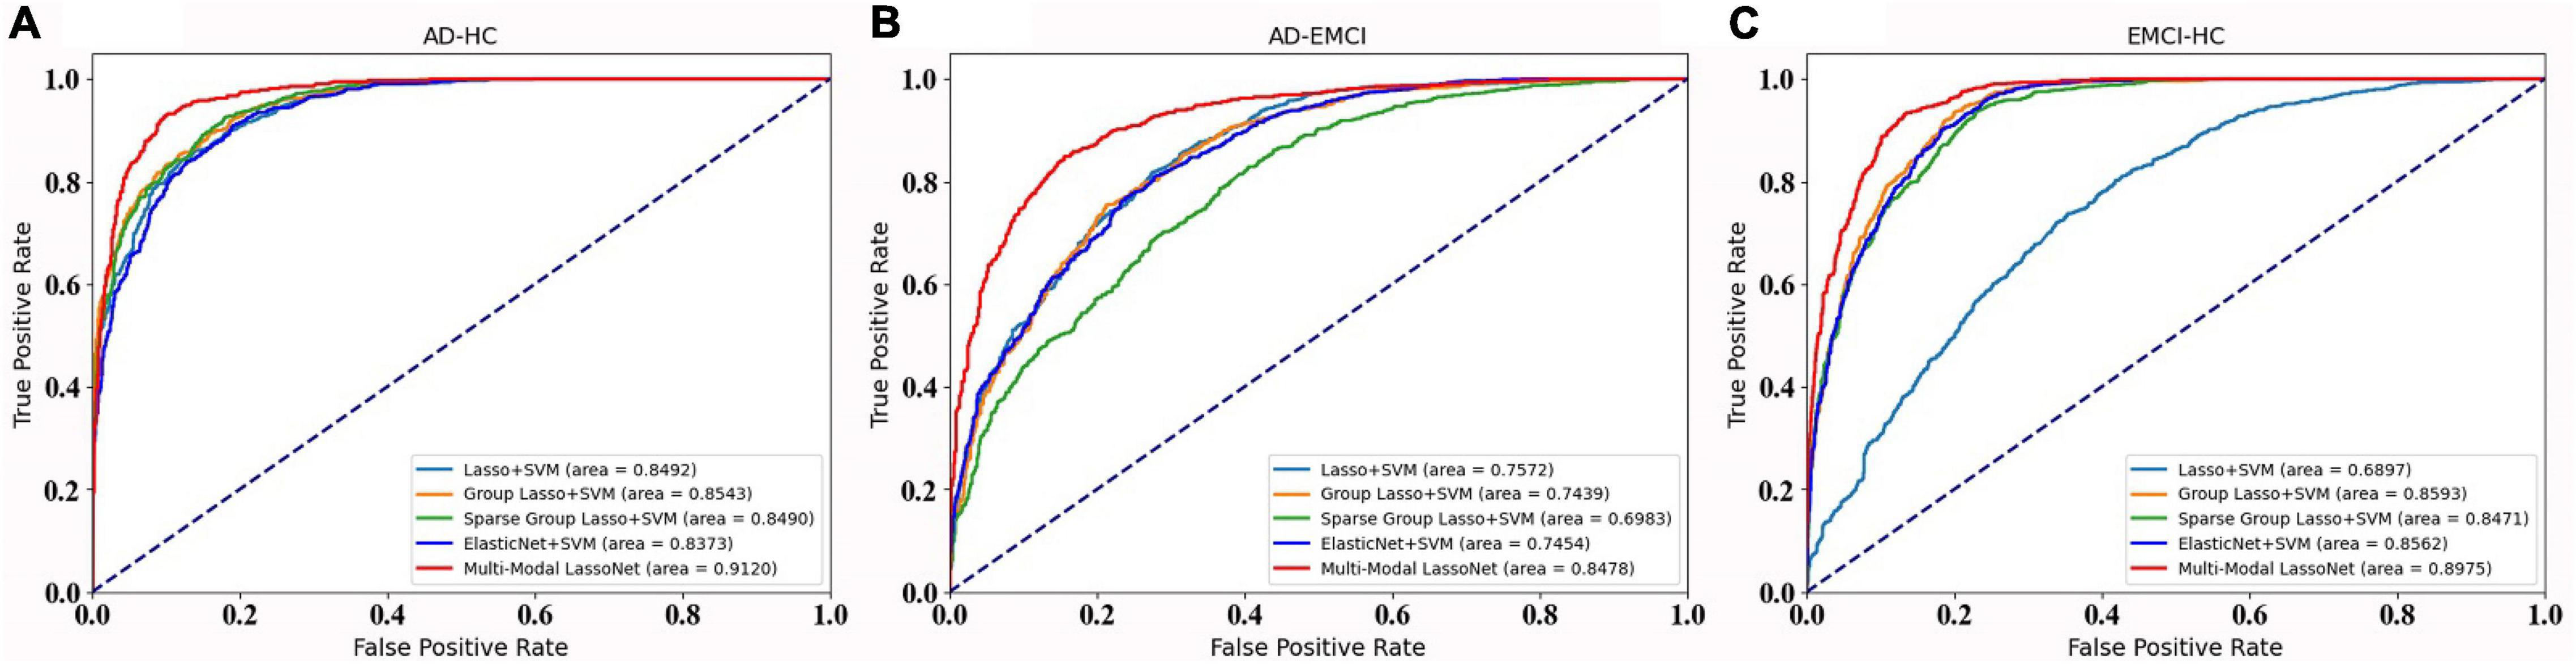
Figure 4. The ROC curve of the five methods in three groups. (A) Prediction accuracy of AD-HC group. (B) Prediction accuracy of AD-EMCI group. (C) Prediction accuracy of EMCI-HC group.
Discussion
Modeling techniques based on a single neuroimaging modality lacked the spatial and temporal high-resolution information brought by different modalities in characterizing the brain network structure, and could not fully reflect the dynamic mechanism of brain network connections (Tulay et al., 2019; Zhuang et al., 2019; Lei et al., 2020). Therefore, we proposed a multi-modal LassoNet model that was a Lasso neural network modeling framework using multi-modal information fusion. This method fused two modalities of fMRI and DTI in a sparse Lasso neural network framework and introduced connection strength and subject structure to complete the construction of a multi-modal brain network. Our proposed method mainly addresses two issues, which include the selection of AD-related brain ROIs and the classification and diagnosis of AD. The experimental results showed that the multi-LassoNet modeling of multi-modal information could facilitate higher sensitivity of disease diagnosis and effectively improved the accuracy of model classification. The good classification performance also revealed that the detected features of the multi-modal model based on fMRI and DTI reflected that the brain atrophy caused by the disease process would lead to the decrease of white matter fiber connectivity (Gupta et al., 2020). It also proved that structural connectivity and functional brain network features between connections had coupling effects.
Compared with the current popular Lasso method, Group Lasso, Sparse Lasso, and elastic network method, it was proved that the proposed multi-modal Lasso-based neural network method was higher than other methods in classification performance and had strong regularization parameter stability. It proved that fusion of multi-modal information more effectively identified brain network features. Moreover, the results indicated that the constraint effect of the DTI structural network and the introduction of the strength of the brain area connection had a certain degree of influence on the validity of the multi-modal brain network model. Table 4 shows the top 15 important brain regions with different classification results.
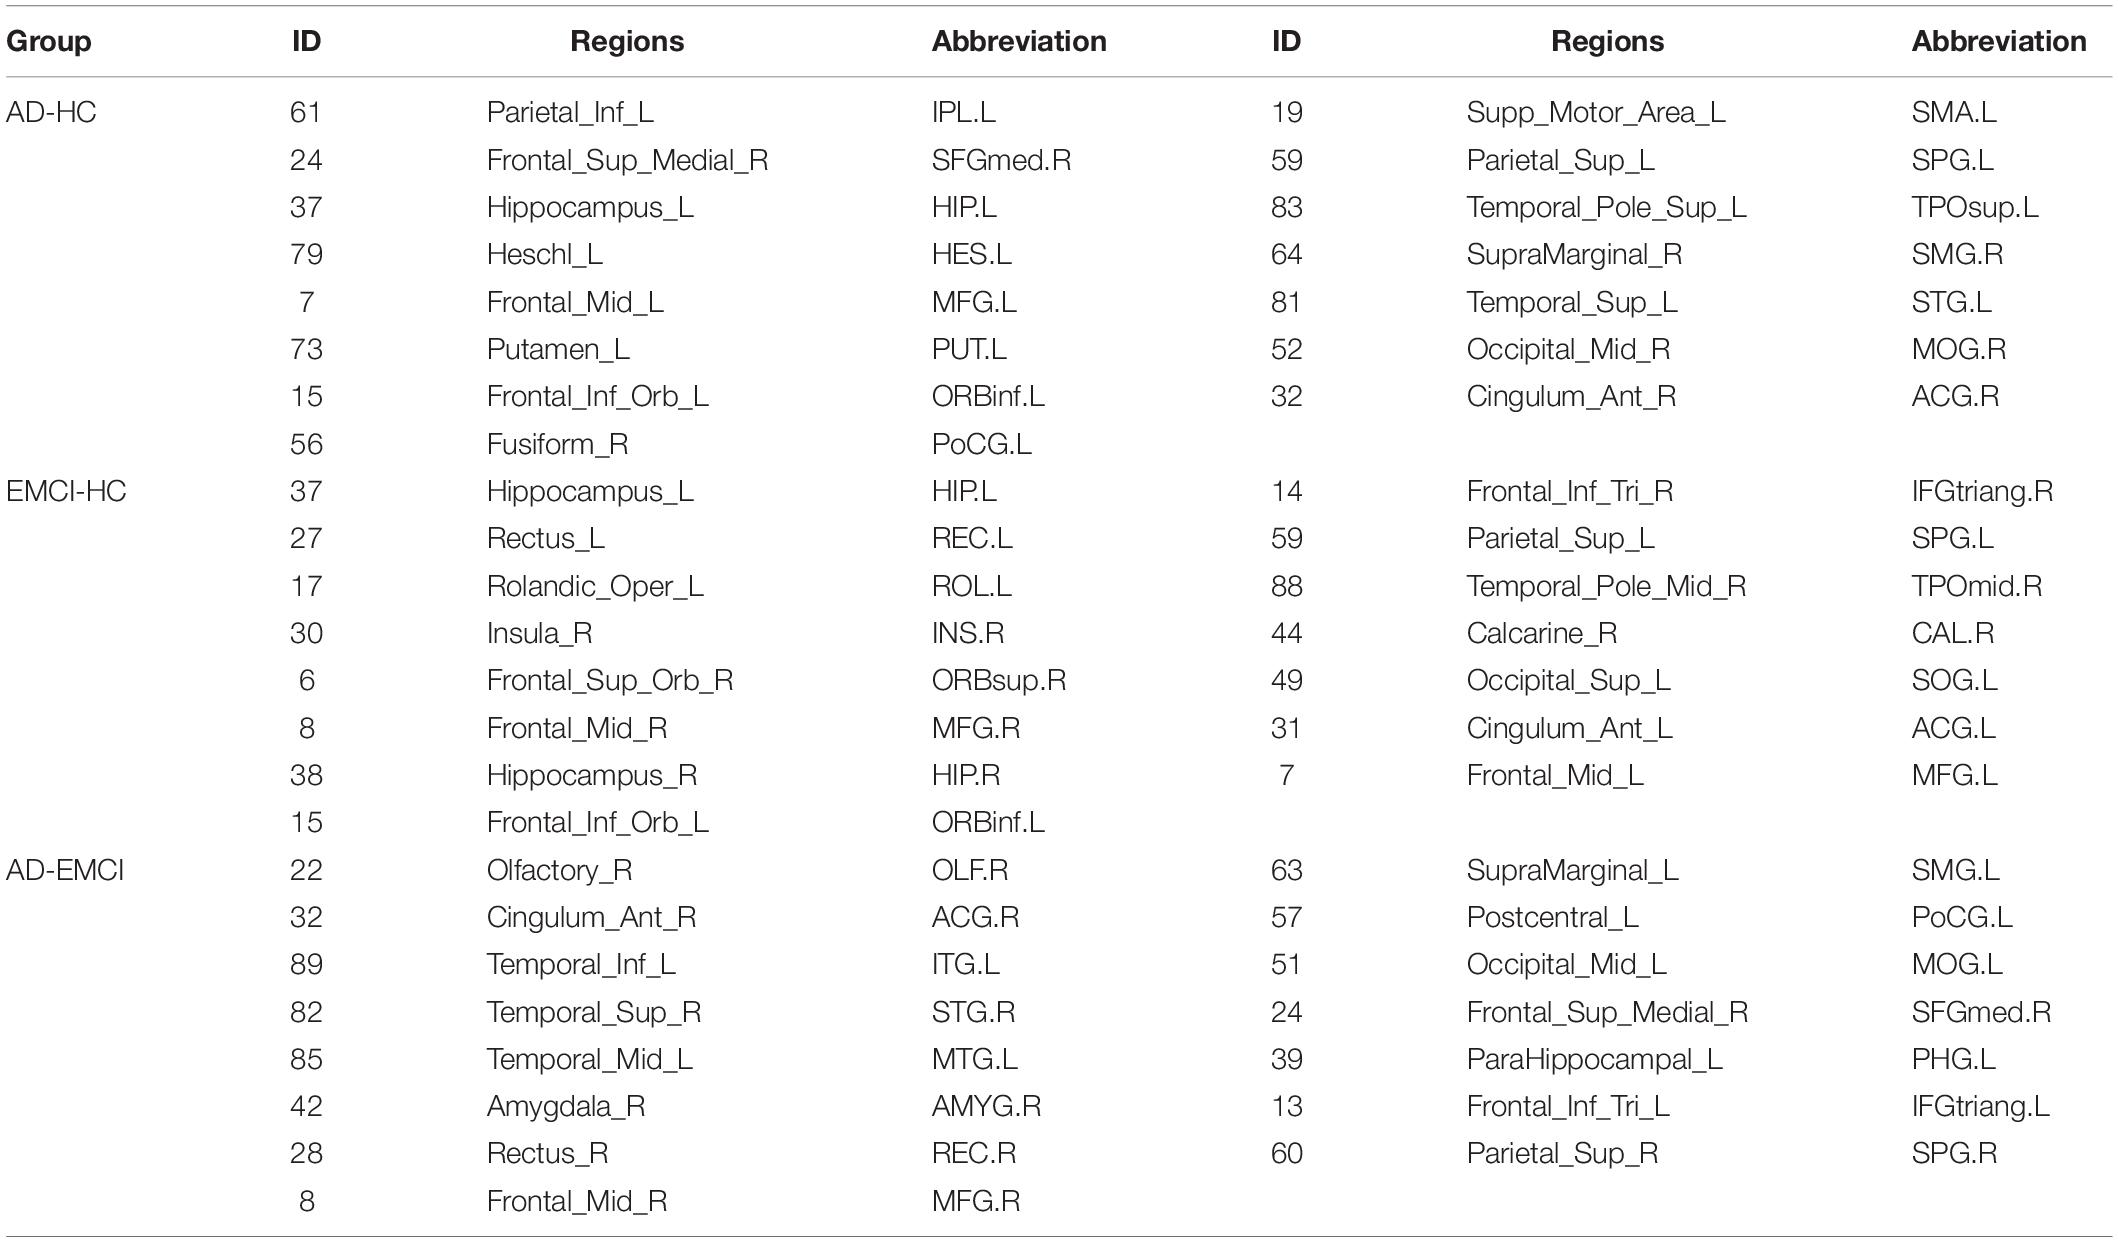
Table 4. Discriminative brain regions.
Visualization selected discriminative brain regions using the BrainNet Viewer toolbox (Xia et al., 2013), as shown in Figure 5. By analyzing the brain regions classifying AD-HC,AD-EMCI, and EMCI-HC, we found that the brain regions belonging to Hippocampus, Frontal_Inf_Orb_L, and Parietal_Sup_L were among the top 15 brain regions. Previous studies had found that the hippocampus of the brain was responsible for human memory and spatial activities and was closely related to AD pathology (Douaud et al., 2011; Fares et al., 2019). In addition, some studies had also shown that functional atrophy in the parahippocampal gyrus is an early marker of AD/MCI disease (Wang et al., 2016), and the parahippocampal gyrus shows a more distinct ability than the hippocampus in the early stage of the disease (Zhu et al., 2019). Frontal_Inf_Orb_L corresponded to the region of interest recommended by physicians for the clinical diagnosis of AD (Jiang et al., 2015). Parietal_Sup_L may be associated with the underlying mechanism of its clinical effect, and it may play a role in the potential compensatory mechanism of mobilizing more regions to complete the function after a functional decline (He et al., 2021). The Hippocampus_L and Hippocampus_R found in the AD-HC and EMCI-HC groups were reported as the pathogenic regions of AD. Chik et al. (Yuan et al., 2022) found that the neurosteroids in the hippocampus were changed during the progression of Lv et al. (2022) found that compared to the healthy mouse, the mice having TYRO protein kinase-binding protein had insufficient learning and memory abilities, and the amyloid β in the hippocampus was increased, which worsened with aging. Liu et al. (2022) proved that memory could be improved by enhancing the functional activity in the hippocampus and the medial prefrontal cortex. Moreover, the hippocampus region was not found in AD-EMCI. This gives a message that the difference in the hippocampus between AD and EMCI is not obvious, and their main difference is found in other brain regions, such as the Amygdala_R, which is not found in the other two groups. Hong et al. (2022) reported tau deposition in the parahippocampus and amygdala by studying positron emission tomography (PET) images in patients with AD. The amygdala atrophy was found in mild AD subjects and could be used to predict the Mini-Mental State Examination scores and hippocampal atrophy (Poulin et al., 2011).
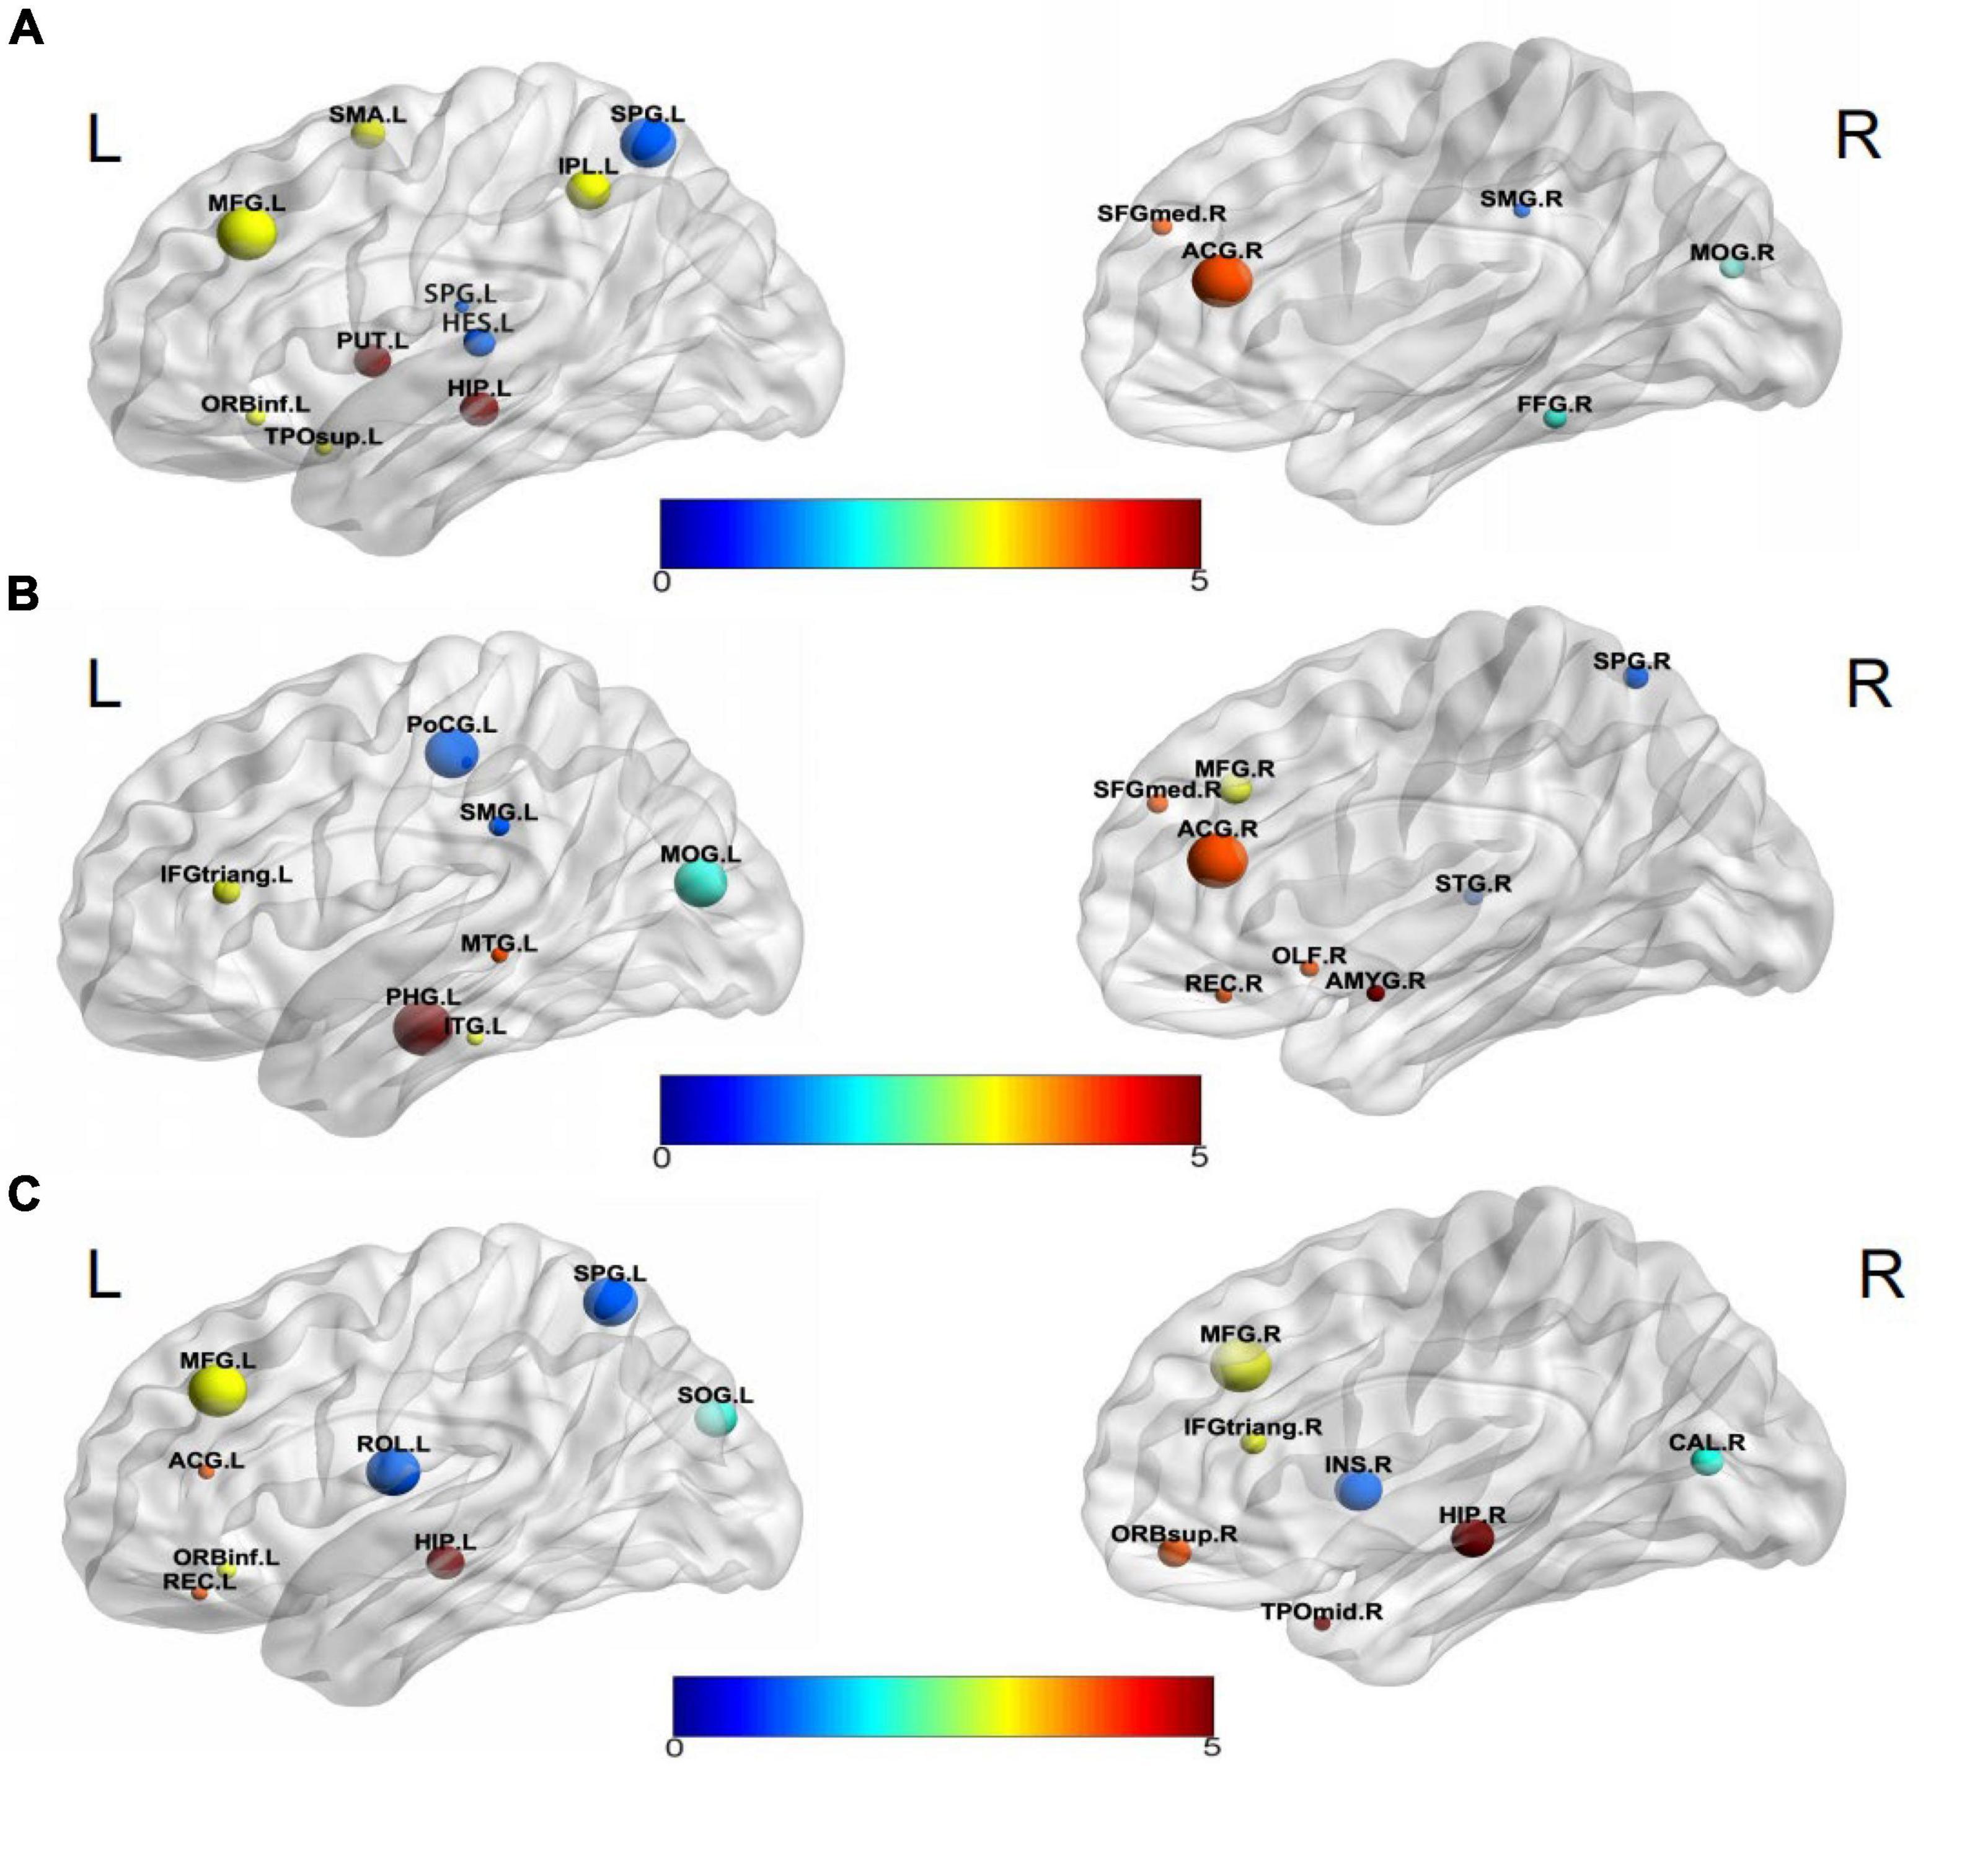
Figure 5. Visualization of discriminative brain regions. (A) AD-HC, (B) AD-EMCI, and (C) EMCI-HC.
In addition, the Putamen_L was reported to be the earliest brain region to show increased Aβ deposition and is a marker of cognitive decline (Zammit et al., 2020; Cogswell et al., 2021). The Fusiform_R was confirmed to be a characteristic region of AD (Guo et al., 2017; Sprung et al., 2021). Brain network analysis results generally had a high sensitivity to segmentation template selection. Different segmentation templates produced different brain network topology structures, which might potentially affect the reproducibility of model classification performance. The segmentation template used in this paper was the AAL structure of 90 brain regions. However, in the future, the robustness value of the proposed method would be further verified from the perspectives of multiple segmentation scales.
In this study, a deterministic fiber tracking technique derived from DTI images was used to construct a structural brain network in a multi-modal modeling framework. But this tracking method only considered the trajectories where white matter fibers cross or diverge (Lei et al., 2021). Therefore, there may be biases in determining the most reasonable fiber configuration, affecting the accuracy of structural network construction. Future research work will consider adopting a more efficient probabilistic fiber tract-tracing strategy to obtain the probability value of brain area connection to complete accurate multi-modal brain network construction.
In this study, we proposed a novel multi-modal LassoNet framework for the discriminant analysis of features. This research is an attempt to apply fMRI and DTI multi-modal information and sparse representation technology to the research of neural network framework, and provides a new idea for designing a brain network modeling framework that integrates more modal information in the future. The features of multi-modal data can be fused to obtain more comprehensive pathological information. Compared to the conventional methods, the proposed method seeks to identify AD-related brain ROIs and in the classification and diagnosis of AD. The high-performance classification implied that the proposed multi-modal LassoNet framework was beneficial for the early diagnosis and prediction of AD disease.
Data Availability Statement
Publicly available datasets were analyzed in this study. Data used in preparation of this article were obtained from the Alzheimer’s Disease Neuroimaging Initiative (ADNI) database (YWRuaS5sb25pLnVzYy5lZHU=). The data is available at http://adni.loni.usc.edu/.
Ethics Statement
Ethical review and approval was not required for the study on human participants. Data collection and sharing for this project were obtained from the Alzheimer’s Disease Neuroimaging Initiative (ADNI).
Author Contributions
XM, CB, WL, and ZJ led and supervised the research. XM, WL, and ZJ designed the research and wrote the article. XF, QW, and ZW performed data preprocessing. XM, JL, WL, and ZJ performed feature extraction and selection by the multi-modal LassoNnet framework. XF, QW, and CB did a discriminative analysis of brain regions. All authors contributed to the article and approved the submitted version.
Funding
This research was funded by the National Natural Science Foundation of China (61901063 and 51877013), MOE (Ministry of Education in China) Project of Humanities and Social Sciences (19YJCZH120), the Science and Technology Plan Project of Changzhou (CE20205042 and CJ20210155), and by Jiangsu Provincial Key Research and Development Program (BE2021636). This work was also sponsored by Qing Lan Project of Jiangsu Province.
Conflict of Interest
The authors declare that the research was conducted in the absence of any commercial or financial relationships that could be construed as a potential conflict of interest.
Publisher’s Note
All claims expressed in this article are solely those of the authors and do not necessarily represent those of their affiliated organizations, or those of the publisher, the editors and the reviewers. Any product that may be evaluated in this article, or claim that may be made by its manufacturer, is not guaranteed or endorsed by the publisher.
Acknowledgments
Data used in the preparation of this article were obtained from the Alzheimer’s Disease Neuroimaging Initiative (ADNI) database (adni.loni.usc.edu). As such, the investigators within the ADNI contributed to the design and implementation of ADNI and/or provided data but did not participate in the analysis or writing of this report. A complete listing of ADNI investigators can be found at: http://adni.loni.usc.edu/wp-content/uploads/how_to_apply/ADNI_Acknowledgement_List.pdf.
Footnotes
- ^ www.adni-info.org
- ^ https://www.fil.ion.ucl.ac.uk/spm/software/spm12/
- ^ http://rfmri.org/DPABI
- ^ https://fsl.fmrib.ox.ac.uk/fsl/fslwiki/
- ^ https://www.nitrc.org/frs/?group_id=582
References
Abbasi, W. A., Abbas, S. A., and Andleeb, S. (2021). PANDA: Predicting the change in proteins binding affinity upon mutations by finding a signal in primary structures. J. Bioinform. Comput. Biol. 19:2150015. doi: 10.1142/S0219720021500153
Aderghal, K., Afdel, K., Benois-Pineau, J., and Catheline, G. (2020). Improving Alzheimer’s stage categorization with Convolutional Neural Network using transfer learning and different magnetic resonance imaging modalities. Heliyon 6:e05652. doi: 10.1016/j.heliyon.2020.e05652
Chen, Z., Zeng, W., Yang, Z., Yu, L., Fu, C. W., and Qu, H. (2019). LassoNet: deep Lasso-Selection of 3D Point Clouds. IEEE Trans. Vis. Comput. Graph. 2019:2934332. doi: 10.1109/tvcg.2019.2934332
Choo, I. H., Lee, D. Y., Oh, J. S., Lee, J. S., Lee, D. S., Song, I. C., et al. (2010). Posterior cingulate cortex atrophy and regional cingulum disruption in mild cognitive impairment and Alzheimer’s disease. Neurobiol. Aging 31, 772–779. doi: 10.1016/j.neurobiolaging.2008.06.015
Cogswell, P. M., Wiste, H. J., Senjem, M. L., Gunter, J. L., Weigand, S. D., Schwarz, C. G., et al. (2021). Associations of quantitative susceptibility mapping with Alzheimer’s disease clinical and imaging markers. Neuroimage 224:117433. doi: 10.1016/j.neuroimage.2020.117433
Dai, Z., Lin, Q., Li, T., Wang, X., Yuan, H., Yu, X., et al. (2019). Disrupted structural and functional brain networks in Alzheimer’s disease. Neurobiol. Aging 75, 71–82. doi: 10.1016/j.neurobiolaging.2018.11.005
Davis, M. T. O. C., Johnson, S., Cline, S., Merikle, E., Martenyi, F., et al. (2018). Estimating Alzheimer’s Disease Progression Rates from Normal Cognition Through Mild Cognitive Impairment and Stages of Dementia. Curr. Alzheimer. Res. 15, 777–788. doi: 10.2174/1567205015666180119092427
Douaud, G., Jbabdi, S., Behrens, T. E., Menke, R. A., Gass, A., Monsch, A. U., et al. (2011). DTI measures in crossing-fibre areas: increased diffusion anisotropy reveals early white matter alteration in MCI and mild Alzheimer’s disease. Neuroimage 55, 880–890. doi: 10.1016/j.neuroimage.2010.12.008
Dyrba, M., Grothe, M., Kirste, T., and Teipel, S. J. (2015). Multimodal analysis of functional and structural disconnection in Alzheimer’s disease using multiple kernel SVM. Hum. Brain Mapp. 36, 2118–2131. doi: 10.1002/hbm.22759
Fares, J., Bou Diab, Z., Nabha, S., and Fares, Y. (2019). Neurogenesis in the adult hippocampus: history, regulation, and prospective roles. Int. J. Neurosci. 129, 598–611. doi: 10.1080/00207454.2018.1545771
Guo, Z., Liu, X., Li, J., Wei, F., Hou, H., Chen, X., et al. (2017). Fractional amplitude of low-frequency fluctuations is disrupted in Alzheimer’s disease with depression. Clin. Neurophysiol. 128, 1344–1349. doi: 10.1016/j.clinph.2017.05.003
Gupta, Y., Kim, J. I., Kim, B. C., and Kwon, G. R. (2020). Classification and Graphical Analysis of Alzheimer’s Disease and Its Prodromal Stage Using Multimodal Features From Structural, Diffusion, and Functional Neuroimaging Data and the APOE Genotype. Front. Aging Neurosci. 12:238. doi: 10.3389/fnagi.2020.00238
Han, H., and Glenn, A. L. (2018). Evaluating methods of correcting for multiple comparisons implemented in SPM12 in social neuroscience fMRI studies: an example from moral psychology. Soc. Neurosci. 13, 257–267. doi: 10.1080/17470919.2017.1324521
He, F., Li, Y., Li, C., Fan, L., Liu, T., and Wang, J. (2021). Repeated anodal high-definition transcranial direct current stimulation over the left dorsolateral prefrontal cortex in mild cognitive impairment patients increased regional homogeneity in multiple brain regions. PLoS One 16:e0256100. doi: 10.1371/journal.pone.0256100
Hong, J., Kang, S. K., Alberts, I., Lu, J., Sznitman, R., Lee, J. S., et al. (2022). Image-level trajectory inference of tau pathology using variational autoencoder for Flortaucipir PET. Eur. J. Nucl. Med. Mole. Imag. 2022:5662. doi: 10.1007/s00259-021-05662-z
Hu, Z., Wu, L., Jia, J., and Han, Y. (2014). Advances in longitudinal studies of amnestic mild cognitive impairment and Alzheimer’s disease based on multi-modal MRI techniques. Neurosci. Bull 30, 198–206. doi: 10.1007/s12264-013-1407-y
Jiang, J., Duan, H., Huang, Z., and Yu, Z. (2015). Study of amyloid-β peptide functional brain networks in AD, MCI and HC. Biomed. Mater. Eng. 26, (Suppl. 1), S2197–S2205. doi: 10.3233/bme-151525
Jiao, Z., Chen, S., Shi, H., and Xu, J. (2022). Multi-Modal Feature Selection with Feature Correlation and Feature Structure Fusion for MCI and AD Classification. Brain Sci. 12:80. doi: 10.3390/brainsci12010080
Lam, J., Lee, J., Liu, C. Y., Lozano, A. M., and Lee, D. J. (2021). Deep Brain Stimulation for Alzheimer’s Disease: tackling Circuit Dysfunction. Neuromodulation 24, 171–186. doi: 10.1111/ner.13305
Lei, B., Cheng, N., Frangi, A. F., Wei, Y., Yu, B., Liang, L., et al. (2021). Auto-weighted centralised multi-task learning via integrating functional and structural connectivity for subjective cognitive decline diagnosis. Med. Image Anal. 74:102248. doi: 10.1016/j.media.2021.102248
Lei, D., Pinaya, W. H. L., Young, J., van Amelsvoort, T., Marcelis, M., Donohoe, G., et al. (2020). Integrating machining learning and multimodal neuroimaging to detect schizophrenia at the level of the individual. Hum. Brain Mapp. 41, 1119–1135. doi: 10.1002/hbm.24863
Li, J., Bian, C., Chen, D., Meng, X., Luo, H., Liang, H., et al. (2020). Persistent Feature Analysis of Multimodal Brain Networks Using Generalized Fused Lasso for EMCI Identification. Med. Image Comp. Comp. Assist. Interv. 12267, 44–52. doi: 10.1007/978-3-030-59728-3_5
Lim, B., Prassas, I., and Diamandis, E. P. (2021). Alzheimer Disease Pathogenesis: The Role of Autoimmunity. J. Appl. Lab. Med. 6, 756–764. doi: 10.1093/jalm/jfaa171
Liu, W., Li, J., Li, L., Zhang, Y., Yang, M., Liang, S., et al. (2022). Enhanced Medial Prefrontal Cortex and Hippocampal Activity Improves Memory Generalization in APP/PS1 Mice: a Multimodal Animal MRI Study. Front. Cell. Neurosci. 16:848967–848967. doi: 10.3389/fncel.2022.848967
Lv, Z., Xu, T., Li, R., Zheng, D., Li, Y., Li, W., et al. (2022). Downregulation of m6A Methyltransferase in the Hippocampus of Tyrobp (-/-) Mice and Implications for Learning and Memory Deficits. Front. Neurosci. 16:739201–739201. doi: 10.3389/fnins.2022.739201
Mak, E., Gabel, S., Su, L., Williams, G. B., Arnold, R., Passamonti, L., et al. (2017). Multi-modal MRI investigation of volumetric and microstructural changes in the hippocampus and its subfields in mild cognitive impairment, Alzheimer’s disease, and dementia with Lewy bodies. Int. Psychogeriatr. 29, 545–555. doi: 10.1017/s1041610216002143
Potashman, M., Buessing, M., Levitchi Benea, M., Cummings, J., Borson, S., Pemberton-Ross, P., et al. (2021). Estimating Progression Rates Across the Spectrum of Alzheimer’s Disease for Amyloid-Positive Individuals Using National Alzheimer’s Coordinating Center Data. Neurol. Ther. 10, 941–953. doi: 10.1007/s40120-021-00272-1
Poulin, S. P., Dautoff, R., Morris, J. C., Barrett, L. F., and Dickerson, B. C. (2011). Amygdala atrophy is prominent in early Alzheimer’s disease and relates to symptom severity. Psychiatry Res. 194, 7–13. doi: 10.1016/j.pscychresns.2011.06.014
Qi, S., Calhoun, V. D., van Erp, T. G. M., Bustillo, J., Damaraju, E., Turner, J. A., et al. (2018). Multimodal Fusion With Reference: searching for Joint Neuromarkers of Working Memory Deficits in Schizophrenia. IEEE Trans. Med. Imag. 37, 93–105. doi: 10.1109/tmi.2017.2725306
Schonberg, T., Pianka, P., Hendler, T., Pasternak, O., and Assaf, Y. (2006). Characterization of displaced white matter by brain tumors using combined DTI and fMRI. Neuroimage 30, 1100–1111. doi: 10.1016/j.neuroimage.2005.11.015
Shim, G., Choi, K. Y., Kim, D., Suh, S. I., Lee, S., Jeong, H. G., et al. (2017). Predicting neurocognitive function with hippocampal volumes and DTI metrics in patients with Alzheimer’s dementia and mild cognitive impairment. Brain Behav. 7:e00766. doi: 10.1002/brb3.766
Sprung, J., Warner, D. O., Knopman, D. S., Petersen, R. C., Mielke, M. M., and Jack, C. R. Jr., et al. (2021). Brain MRI after critical care admission: a longitudinal imaging study. J. Crit. Care 62, 117–123. doi: 10.1016/j.jcrc.2020.11.024
Tulay, E. E., Metin, B., Tarhan, N., and Arıkan, M. K. (2019). Multimodal Neuroimaging: Basic Concepts and Classification of Neuropsychiatric Diseases. Clin. EEG Neurosci. 50, 20–33. doi: 10.1177/1550059418782093
Tzourio-Mazoyer, N., Landeau, B., Papathanassiou, D., Crivello, F., Etard, O., Delcroix, N., et al. (2002). Automated Anatomical Labeling of Activations in SPM Using a Macroscopic Anatomical Parcellation of the MNI MRI Single-Subject Brain. NeuroImage 15, 273–289. doi: 10.1006/nimg.2001.0978
Wang, S., Zhang, Y., Liu, G., Phillips, P., and Yuan, T. F. (2016). Detection of Alzheimer’s Disease by Three-Dimensional Displacement Field Estimation in Structural Magnetic Resonance Imaging. J. Alzheimers Dis. 50, 233–248. doi: 10.3233/jad-150848
Wang, S. H., Du, S., Zhang, Y., Phillips, P., Wu, L. N., Chen, X. Q., et al. (2017). Alzheimer’s Disease Detection by Pseudo Zernike Moment and Linear Regression Classification. CNS Neurol. Disord. Drug Targets 16, 11–15. doi: 10.2174/1871527315666161111123024
Wang, S.-H., Zhang, Y., Li, Y.-J., Jia, W.-J., Liu, F.-Y., Yang, M.-M., et al. (2018). Single slice based detection for Alzheimer’s disease via wavelet entropy and multilayer perceptron trained by biogeography-based optimization. Multimedia Tools Appl. 77, 10393–10417. doi: 10.1007/s11042-016-4222-4
Wang, S. H., Zhou, Q., Yang, M., and Zhang, Y. D. (2021). ADVIAN: Alzheimer’s Disease VGG-Inspired Attention Network Based on Convolutional Block Attention Module and Multiple Way Data Augmentation. Front. Aging Neurosci. 13:687456. doi: 10.3389/fnagi.2021.687456
Woolrich, M. W., Jbabdi, S., Patenaude, B., Chappell, M., Makni, S., Behrens, T., et al. (2009). Bayesian analysis of neuroimaging data in FSL. Neuroimage 1(Suppl.), S173–S186. doi: 10.1016/j.neuroimage.2008.10.055
Xia, M., Wang, J., and He, Y. (2013). BrainNet Viewer: a network visualization tool for human brain connectomics. PLoS One 8:e68910. doi: 10.1371/journal.pone.0068910
Xu, X., Wang, T., Li, W., Li, H., Xu, B., Zhang, M., et al. (2021). Morphological, Structural, and Functional Networks Highlight the Role of the Cortical-Subcortical Circuit in Individuals With Subjective Cognitive Decline. Front. Aging Neurosci. 13:688113. doi: 10.3389/fnagi.2021.688113
Yan, C. G., Wang, X. D., Zuo, X. N., and Zang, Y. F. (2016). DPABI: data Processing & Analysis for (Resting-State) Brain Imaging. Neuroinformatics 14, 339–351. doi: 10.1007/s12021-016-9299-4
Yan, X., and Bien, J. J. S. S. (2017). Hierarchical Sparse Modeling: a Choice of Two Group Lasso Formulations. Statist. Sci. 32, 531–560.
Yuan, K., Zeng, T., and Chen, L. (2022). Interpreting Functional Impact of Genetic Variations by Network QTL for Genotype–Phenotype Association Study. Front. Cell Dev. Biol. 9:2022. doi: 10.3389/fcell.2021.720321
Zammit, M. D., Laymon, C. M., Tudorascu, D. L., Hartley, S. L., Piro-Gambetti, B., Johnson, S. C., et al. (2020). Patterns of glucose hypometabolism in Down syndrome resemble sporadic Alzheimer’s disease except for the putamen. Alzheimers Dement 12:e12138. doi: 10.1002/dad2.12138
Zhang, Q., Alexander, M., and Ryner, L. (2014). Multimodality Neurological Data Visualization with Multi-VOI Based DTI Fiber Dynamic Integration. IEEE J. Biomed. Health Inform. 20:2367026. doi: 10.1109/JBHI.2014.2367026
Zhang, Y.-D., Wang, S., and Dong, Z. (2014). Classification of Alzheimer Disease Based on Structural Magnetic Resonance Imaging by Kernel Support Vector Machine Decision Tree. Prog. Electrom. Res. 144, 185–191. doi: 10.2528/PIER13121310
Zhang, T., and Shi, M. (2020). Multi-modal neuroimaging feature fusion for diagnosis of Alzheimer’s disease. J. Neurosci. Methods 341:108795. doi: 10.1016/j.jneumeth.2020.108795
Zhang, Y., Dong, Z., Phillips, P., Wang, S., Ji, G., Yang, J., et al. (2015a). Detection of subjects and brain regions related to Alzheimer’s disease using 3D MRI scans based on eigenbrain and machine learning. Front. Comput. Neurosci. 9:66. doi: 10.3389/fncom.2015.00066
Zhang, Y., Wang, S., Phillips, P., Dong, Z., Ji, G., and Yang, J. (2015b). Detection of Alzheimer’s disease and mild cognitive impairment based on structural volumetric MR images using 3D-DWT and WTA-KSVM trained by PSOTVAC. Biomed. Signal Proc. Control 21, 58–73. doi: 10.1016/j.bspc.2015.05.014
Zhang, Y., and Wang, S. (2015). Detection of Alzheimer’s disease by displacement field and machine learning. PeerJ. 3:e1251. doi: 10.7717/peerj.1251
Zhang, Y., Wang, S., Phillips, P., Yang, J., and Yuan, T.-F. (2016). Three-Dimensional Eigenbrain for the Detection of Subjects and Brain Regions Related with Alzheimer’s Disease. J. Alzheimer’s Dis. 50, 1163–1179. doi: 10.3233/JAD-150988
Zhang, Y., Wang, S., Sui, Y., Yang, M., Liu, B., Cheng, H., et al. (2018). Multivariate Approach for Alzheimer’s Disease Detection Using Stationary Wavelet Entropy and Predator-Prey Particle Swarm Optimization. J. Alzheimers Dis. 65, 855–869. doi: 10.3233/jad-170069
Zhu, J., Zhao, Y. P., and Zhang, Y. Q. (2019). The rs-fMRI study of effects of fornix and hippocampus-related brain function after the transcallosal interforniceal approach. Brain Res. Bull. 150, 207–215. doi: 10.1016/j.brainresbull.2019.05.014
Keywords: multi-modal, LassoNet, resting state functional magnetic resonance imaging, diffusion tensor imaging, feature detection
Citation: Meng X, Liu J, Fan X, Bian C, Wei Q, Wang Z, Liu W and Jiao Z (2022) Multi-Modal Neuroimaging Neural Network-Based Feature Detection for Diagnosis of Alzheimer’s Disease. Front. Aging Neurosci. 14:911220. doi: 10.3389/fnagi.2022.911220
Received: 02 April 2022; Accepted: 19 April 2022;
Published: 16 May 2022.
Edited by:
Yu-Dong Zhang, University of Leicester, United KingdomReviewed by:
Yang Zhou, Harbin Medical University Cancer Hospital, ChinaYing Wang, Guangdong Provincial People’s Hospital, China
Copyright © 2022 Meng, Liu, Fan, Bian, Wei, Wang, Liu and Jiao. This is an open-access article distributed under the terms of the Creative Commons Attribution License (CC BY). The use, distribution or reproduction in other forums is permitted, provided the original author(s) and the copyright owner(s) are credited and that the original publication in this journal is cited, in accordance with accepted academic practice. No use, distribution or reproduction is permitted which does not comply with these terms.
*Correspondence: Wenjie Liu, bGl1d2pAY3p1c3QuZWR1LmNu; Zhuqing Jiao, anpxQGNjenUuZWR1LmNu