 Marta Gómez-Gonzalo1,2 Gabriele Losi1,2 Marco Brondi3,4 Laura Uva5 Sebastian Sulis Sato3,4
 Marco de Curtis5 Gian Michele Ratto3,6
 Giorgio Carmignoto1,2*
- 1 Institute of Neuroscience, National Research Council, Padova, Italy
- 2 Department of Experimental Biomedical Sciences, University of Padova, Padova, Italy
- 3 NEST, Institute Nanoscience, National Research Council, Pisa, Italy
- 4 Istituto Italiano di Tecnologia, Center for Nanotechnology Innovation NEST, Scuola Normale Superiore, Pisa, Italy
- 5 Neurophysiology and Experimental Epileptology Unit, Fondazione Istituto Neurologico Carlo Besta, Milano, Italy
- 6 Institute of Neuroscience, National Research Council, Pisa, Italy
Activation of astrocytes by neuronal signals plays a central role in the control of neuronal activity-dependent blood flow changes in the normal brain. The cellular pathways that mediate neurovascular coupling in the epileptic brain remain, however, poorly defined. In a cortical slice model of epilepsy, we found that the ictal, seizure-like discharge, and only to a minor extent the interictal discharge, evokes both a Ca2+ increase in astrocyte endfeet and a vasomotor response. We also observed that rapid ictal discharge-induced arteriole responses were regularly preceded by Ca2+ elevations in endfeet and were abolished by pharmacological inhibition of Ca2+ signals in these astrocyte processes. Under these latter conditions, arterioles exhibited after the ictal discharge only slowly developing vasodilations. The poor efficacy of interictal discharges, compared with ictal discharges, to activate endfeet was confirmed also in the intact in vitro isolated guinea pig brain. Although the possibility of a direct contribution of neurons, in particular in the late response of cerebral blood vessels to epileptic discharges, should be taken into account, our study supports the view that astrocytes are central for neurovascular coupling also in the epileptic brain. The massive endfeet Ca2+ elevations evoked by ictal discharges and the poor response to interictal events represent new information potentially relevant to interpret data from diagnostic brain imaging techniques, such as functional magnetic resonance, utilized in the clinic to localize neural activity and to optimize neurosurgery of untreatable epilepsies.
Introduction
Epilepsy is a common neurological disease characterized by two types of abnormalities at the electrographic recordings termed ictal and interictal events. At a cellular level these events reflect intense and highly synchronous discharges that involve large numbers of cortical neurons (Traub and Wong, 1982; Avoli et al., 1996, 2002; De Curtis and Avanzini, 2001; Jefferys, 2003). In both animal models and patients, the epileptic discharge can evoke drastic increases in cerebral blood flow (CBF) aimed to meet the high metabolic demand caused by this intense neuronal activity (Kuhl et al., 1980). Whether or not this CBF increase can compensate for the metabolic unbalance generated in these circumstances is a long standing debate. An inadequate blood supply, indeed, is hypothesized to contribute to diffuse neuronal damage in a chronic epileptic focus.
While our understanding of the cellular mechanisms that control neurovascular coupling during normal brain activity made significant advances over the last decade (Zonta et al., 2003; Cauli et al., 2004; Mulligan and Macvicar, 2004; Filosa et al., 2006; Metea and Newman, 2006; Straub et al., 2006; Takano et al., 2006; Gordon et al., 2008), our knowledge of the mechanism at the basis of the neurovascular coupling in the epileptic brain remains largely undefined (Zimmermann et al., 2008). Insights into the signaling pathways that mediate the blood vessel response during epileptic activity can thus be useful to clarify the role of the neurovascular unit (neuronal, glial, and vascular cells) in the pathological consequences of epilepsies.
The local CBF increase and the consequent metabolic change evoked by intense neuronal activity contribute also to the signal detected with various imaging techniques, such as single-photon emission computed tomography (SPECT) and functional magnetic resonance imaging (fMRI), that are increasingly used in both basic and clinical research. Importantly, fMRI is also commonly utilized to define the epileptogenic zone and to guide surgical therapy of untreatable focal epilepsies (Gotman et al., 2006). However, due to the high metabolic demand of abnormally active neurons, the cellular pathways and molecular mechanisms underlying the CBF response under epileptic circumstances and during seizures may be different from those at the basis of the neurovascular coupling in the normal brain (Haydon and Carmignoto, 2006; Carmignoto and Gomez-Gonzalo, 2010). Therefore, a direct verification of the relationship between epileptic discharges and blood flow responses may be crucial for aiding not only our understanding of the progression of the chronic epileptic state, but also for a proper scientific and diagnostic interpretation of metabolic imaging data in epileptic patients (Iadecola, 2004)
The aim of the present study was to clarify whether the glial cell astrocytes, that in the normal brain are activated by neuronal signals to regulate local CBF changes, play a similar role in the response of cerebral blood vessels to epileptiform discharges. By using the cortical slice and the whole in vitro isolated guinea pig brain preparations as models of seizures, we found that ictal, seizure-like discharges were rapidly followed by large Ca2+ elevations in astrocyte endfeet. Activation of endfeet regularly preceded and could be causally related to the vasomotor response of cerebral arterioles to epileptic discharges.
Materials and Methods
All experimental procedures were in accordance with the Italian and EU regulation on animal welfare and were approved by the Italian Ministry of Health. All efforts were made to avoid suffering of animals.
Slice Preparation
Coronal neocortical–hippocampal slices of 380 μm were obtained from 36 Wistar rats at postnatal days 13–17, as previously described (Fellin et al., 2004). Briefly, brain was removed and transferred to ice-cold solution containing (in mM): NaCl, 120; KCl, 3.2; KH2PO4, 1; NaHCO3, 26; MgCl2, 2; CaCl2, 1; glucose, 10; Na-pyruvate, 2, and ascorbic acid, 0.6 at pH 7.4 (with O2 95%, CO2 5%). Coronal slices were obtained by cutting with a Leica Vibratome VT1000S (Mannheim, Germany) in the presence of the ionotropic glutamate receptor inhibitor, kynurenic acid (2 mM) to reduce glutamate excitotoxicity. Slices were recovered for 15 min at 37°C and then loaded with the Ca2+ sensitive dye Oregon Green 488 BAPTA-1 AM (OGB-1, Invitrogen, Carlsbad, CA, USA; 20 μM) for 60–90 min at 37°C. Loading was performed in the cutting solution containing sulfinpyrazone (200 μM, to limit the secretion of the fluorescent dye in its free acid form), pluronic F-127 (0.12%, to prevent fluorescent dye aggregations), and kynurenic acid (1 mM). After loading, slices were recovered and kept at room temperature for at least 30 min.
Induction of Epileptiform Activity in the Slice Preparation
During the experiments rat brain slices were continuously perfused in a submerged chamber (Warner Instruments, CT, USA) with an external recording solution, at 33–35°C, containing (in mM): NaCl, 120; KCl, 3.2; KH2PO4, 1; NaHCO3, 26; MgCl2, 1; CaCl2, 2; glucose, 10; sulfinpyrazone, 0.2 at pH 7.4 (with O2 95%, CO2 5%). Slices were allowed to stabilize for at least 15 min before perfusion with a solution containing 50 μM of the GABAA-receptor inhibitor picrotoxin and 0 mM MgCl2. The vast majority of the slices developed spontaneous epileptiform activities within 5 min from the onset of the picrotoxin/zero-Mg2+ perfusion.
Imaging of Ca2+ Signal and Arterioles in Cortical Slices
A Leica TCS SP2 RS confocal microscope equipped with a 40× objective (NA 0.80) was used for Ca2+ imaging and, when indicated, simultaneous DIC-like images, with a time frame acquisition of 1.24 s. The fluorescent signal collected is displayed as a pseudocolor image and the used look-up-table is indicated in each figure. Laser emission at 488 nm was used for excitation of OGB-1. Interictal and ictal discharges involve a large neuronal population and fundamentally differ in their duration. In Ca2+ imaging experiments, the duration of the Ca2+ increase during isolated interictal events was less than 3 s (D’antuono et al., 2010), while ictal discharges were sustained for tens of seconds with a final oscillatory pattern corresponding to the highly synchronous after discharges. Post-ictal depression was also consistently observed after an ictal event. Occasionally, we recorded sequences of two–four interictal events occurring at very short intervals, and were classified as neither interictal nor ictal discharge. Because of their intermediate nature and infrequency, we did not quantify the effects of these events on endfeet and arterioles.
Endfeet and perivascular astrocytic processes enwrapping cerebral arterioles were easily identified in brain slices. Their location and morphology were also consistent with those from individual astrocytes selectively loaded with the fluorescent dye Lucifer yellow (Zonta et al., 2003) and those expressing enhanced green fluorescent protein (EGFP) under the control of the glial fibrillary acidic protein (GFAP) promoter. In a number of experiments, astrocytes and endfeet were identified after 15 min slice incubation with 100 nM sulforhodamine 101, i.e., an astrocyte-specific marker (SR101, Invitrogen; Nimmerjahn et al., 2004). As previously reported (Pasti et al., 1997; Gomez-Gonzalo et al., 2010), a high-potassium stimulation (40–60 mM) was applied in the presence of TTX at the end of some experiments to identify astrocytes and neurons according to their different response kinetics to this stimulation. Given that endfeet enwrap completely the arteriole wall, and individual endfoot could not be unambiguously distinguished, the different response of endfeet to interictal and ictal discharges was quantitatively expressed as a percentage of the arteriole length showing a Ca2+ elevation with respect to the entire length of the arteriole under study. To evaluate the Ca2+ change in putative individual endfoot, we drew the regions of interest (ROIs) outlining the pixels that showed a similar fluorescence signal either at rest or during the epileptiform activity. Cross-correlation plots were obtained by averaging the cross-correlation function of the Ca2+ change time series from each pair of ROIs from astrocyte endfeet. The Ca2+ change, as measured by ΔF/F0, was normalized before analysis and the cross-correlation function generated in MATLAB.
DIC-like images obtained with the confocal microscope were employed to analyze the arteriole diameter. We selected arterioles from cortical layer II–V at a depth between 30 and 60 μm that showed structures reminiscent of vascular myocytes, had a discernible luminal diameter of 5–20 μm and could be controlled for their integrity for a length of at least 100 μm (Zonta et al., 2003). To measure the diameter change we compared the intraluminal area of the arteriole along a length of at least 20 μm. The frequency of diameter measurement was adapted to the derivative of the signal. In other terms, we increased the frequency of measurement up to the value of the maximum frame acquisition rate (1.24 s/frame) in the time window where the diameter showed the largest change. Only diameter changes higher than 5% were considered significant. When indicated, arterioles were preconstricted with the thromboxane A2 analog U46619 (300 nM) for at least 30 min before slice perfusion with picrotoxin/zero-Mg2+. This represents an equilibration period for checking also the stability of arteriole diameter. A few arterioles that exhibited significant changes in their diameter were discarded. U46619 was maintained for the entire duration of the experiment. The change in the arteriole diameter eventually induced by the epileptic discharge often recovered only partially. Since the response of arterioles to the second ictal discharge could be affected by this defective recovery, we analyzed only the vasomotor response of arterioles to the first ictal discharge and to the interictal events which occurred before the first ictal discharge. Accordingly, the Ca2+ elevation in both neurons and astrocyte endfeet that we described here are related to these events.
Traces show the time course of the changes in the fluorescent signal measured as ΔF/F0. In the slices incubated with both OGB-1 and SR101, we performed a ratiometric-like evaluation of the fluorescence calcium dye change in endfeet and astrocyte soma during the ictal discharge by calculating the ratio OGB-1 (green) signal/SR101(red) signal. The timing for the onset of the slow Ca2+ elevation in astrocytes was determined on the basis of a threshold criterion. The onset was identified by the change in ΔF/F0 that was higher than 2 SD over the average baseline and remained above this value in the successive two frames. A similar strategy was used to determine the onset of vasodilation. Data are shown as means ± SEM. Student’s t-test and Yates’ chi-square test were used, with p values ≤ 0.05 taken as statistically significant *p < 0.05; **p < 0.01).
Imaging of Ca2+ Signal in the Guinea Pig Brain Preparation
Brains from postnatal day 14–20 guinea pigs were isolated and perfused in vitro at a rate of 5.5 ml/min through the basilar artery (De Curtis et al., 1991, 1998) with a solution containing (in mM): NaCl, 126; KCl, 3; KH2PO4, 1.2; MgSO4, 1.3; CaCl2, 2.4; NaHCO3, 26; glucose, 15; and 3% dextran M.W. 70.000, oxygenated with a 95% O2–5% CO2 gas mixture (pH 7.3). The dye OGB-1-AM (50 μg) was diluted in 5 μl of standard pluronic/DMSO solution and 75 μl of saline, and filtered through a 0.2-μm microfilter (Millipore). A patch pipette (3–4 MΩ) was used to pressure inject (1–2 min at 4 PSI) the Ca2+ dye at a cortical depth of about 200 μm via a picospritzer (NPI, D). Following this procedure, the Ca2+ signal from astrocytes and neuropile was monitored by using a FluoView 300 scanning head customized for two-photon microscopy equipped with a 5-W Verdi-Mira laser (Coherent) tuned at 830 nm and external photomultipliers (Hamamatsu) or with a Prairie Ultima scanning microscope equipped with a 40× objective (NA 0.90) and a 10-W Verdi-Mira laser (Coherent) tuned at 830 nm. Images were acquired with an average frame period of 300 ms (single frame duration depending on the dimension of the imaged field), with dwell time of 4.4 μs. The PMT gain and resolution (256 × 256 pixel per each field) were kept constant, while the intensity of the laser on the sample was adjusted to provide a good signal/noise ratio with negligible bleaching. The Ca2+ change was measured as ΔF/(F0 − dark) where dark was the estimated mean dark signal, i.e., the PMT signal measured when the laser was turned off. The Ca2+ changes were considered responses when the change in ΔF/(F0 − dark) were more than 2 SD over the average baseline and remained above this value in the three successive frames. In the guinea pig brain, astrocytes were identified using SR101 (Nimmerjahn et al., 2004), dissolved in the same solution of the systemic perfusion without dextrane and applied at 100 μM to the cortical surface. OGB-1 and SR101 fluorescence signal were collected simultaneously with two external photomultipliers. The SR101 signal was used to build a mask for each image of the sequence to isolate the fluorescence of astrocytes from the surrounding neuropile. The mask isolates pixels in each frame where the OGB-1 and SR101 signals co-localize, and the ΔF/(F0 − dark) value in each ROI is plotted (computed by custom macros under ImageJ) against the corresponding electrophysiological recording. The mean fluorescent signal from each field acquired across 20 consecutive frames is displayed as a pseudocolor image and the relative intensity range of the look-up-table used is indicated as a color scale bar. All experiments were performed at 33–35°C.
Electrophysiological Recordings
Whole-cell patch-clamp recordings from cortical neurons were performed using standard procedures and an Axopatch-200B amplifier (Molecular Devices, Union City, CA, USA), as previously reported (Fellin et al., 2004). Typical pipette resistance was 3–4 MΩ. Data were filtered at 1 kHz and sampled at 5 kHz with a Digidata 1320 interface and pClamp8 software (Molecular Devices, CA, USA). Whole-cell intracellular pipette solution was (in mM): K-Gluconate, 145; MgCl2, 2; EGTA, 0.5; Na2ATP, 2; Na2GTP, 0.2; HEPES, 10; to pH 7.2 with KOH; and contained a low concentration (∼10 μM) of OGB-1 (Invitrogen, CA, USA). Field potentials were recorded from the in vitro isolated guinea pig brain with the same saline-filled micropipettes used to deliver OGB-1-AM, via a multichannel differential amplifier (NPI Electronics, D). Allignement of Ca2+ and electrophysiological signals was achieved by triggering with a synchronization signal produced by the confocal microscope. Tip potential was measured against a ground reference placed in the recording chamber by means of a voltage follower coupled to an amplifier.
Data analysis was performed with Clampfit 8 and Origin 6.0 (Microcal Software, Northampton, MA, USA).
Drugs
Kynurenic acid was obtained from Ascent Scientific (Weston-Super-Mare, UK); sulfinpyrazone, picrotoxin, cyclopiazonic acid (CPA), adenosine, and bicuculline methiodide from Sigma-Aldrich (Milano, I); U46619 from Cayman Chemical (Ann Arbor, MI, USA) and pluronic F-127 from Invitrogen (CA, USA).
Results
Picrotoxin/Zero-Mg2+ as a Model of Interictal and Ictal Epileptiform Activity
Perfusion of young rat neocortical slices with the GABAA-receptor inhibitor picrotoxin in the virtual absence of Mg2+ rapidly evoked epileptiform activities composed of both interictal and ictal (seizure-like) events. As revealed by Ca2+ imaging coupled to patch-clamp recordings, the pattern of Ca2+ changes from a patched neuron (Figure 1A, blue trace) follows faithfully the action potential (AP) burst that characterizes the isolated, short-lasting interictal events, as well as the sequence of AP bursts of the ictal event lasting tens of seconds (Figure 1A, black trace). Neuronal Ca2+ imaging during both interictal and ictal events demonstrated that the onset and general pattern of Ca2+ changes in all other neurons from cortical slices preincubated with OGB-1-AM are similar to that observed in the patched neuron (Figures 1B,C). The Ca2+ signal from neurons can thus be used to determine the precise onset of the epileptic discharge and to classify events in interictal and ictal discharges. Notably, we recently showed that the Ca2+ signal from neurons not only correlates with AP firing recorded from individual patched neurons, but also with the change in the field potential which reflects the epileptiform activity of a neuronal population (Losi et al., 2010).
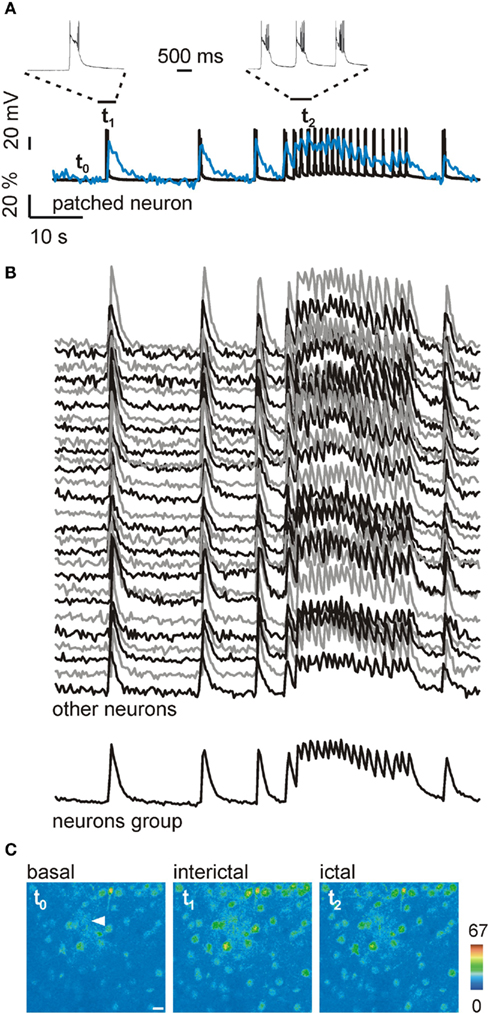
Figure 1. Interictal and ictal events in cortical neurons. (A) AP bursts (black trace) and Ca2+ change (blue trace) from a patched neuron reflecting three successive isolated interictal discharges and a prolonged ictal discharge elicited by cortical slice perfusion with picrotoxin/zero-Mg2+. t0−2 mark the timing for the images shown in (C); insets, expanded time scale of an interictal event (left) and the initial AP bursts of the ictal discharge (right). (B) Ca2+ changes from individual unpatched neurons and mean Ca2+ change of all neurons from the field of recording (measured as a grouped ROI) which reflect the same epileptiform events shown in (A). (C) Pseudocolor images of a cortical slice showing the Ca2+ levels in basal conditions (t0) and during an interictal (t1) and an ictal event (t2). The white arrowhead marks the patched neuron. Scale bar, 10 μm.
Ictal but Not Interictal Events Trigger Massive Ca2+ Elevations in Astrocyte Endfeet
In neocortical slices preincubated with OGB-1-AM, we could monitor the Ca2+ signal from both neurons and astrocytes. The simultaneous monitoring of Ca2+ signals from these cells and DIC-like images revealed that astrocyte perivascular processes (endfeet) outlining cerebral arterioles are also nicely loaded with the Ca2+ dye (Figures 2A,B; see also Figure 5C). As indicated by the synchronous Ca2+ elevations in neurons, slice perfusion with picrotoxin/zero-Mg2+ evoked interictal and ictal epileptiform activities (Figures 2C,D, t1 and t3, respectively; see also Movie S1 in Supplementary Material). However, ictal but not interictal discharges evoke massive Ca2+ elevations in neocortical astrocytes, as we recently reported for the entorhinal cortex (Gomez-Gonzalo et al., 2010). Interictal and ictal events in the neocortex had different effects not only on astrocyte soma but also on astrocyte endfeet: while interictal events evoked a weak response (Figures 2C,D, t2), the ictal event evoked a diffuse endfeet Ca2+ elevation (Figures 2C,D, t4). The Movie S1 in Supplementary Material clearly illustrates that three subsequent isolated interictal events evoked a weak activation of a few endfeet, while an ictal discharge evoked a large Ca2+ elevation in almost all the endfeet covering the arteriole wall. Cross-correlation analysis revealed that the Ca2+ elevation triggered in endfeet by the ictal discharge was highly correlated (Figure 2E, mean delay ± SEM, 2.1 ± 0.3 s, range, 0 – 3.73 s). Quantitative analysis indicates that less than 10% of the endfeet showed a Ca2+ transient following interictal events (n = 26), while more than 80% of the endfeet were activated by the ictal event (n = 44; Figure 2F). To confirm that the perivascular structures covering the arteriole wall and showing ictal discharge-evoked Ca2+ elevations were astrocyte endfeet, slices were loaded with both OGB-1-AM and the astrocyte-specific marker SR101. Figure 3A shows that the soma of astrocytes from the cortical parenchyma (arrowheads) and the perivascular structures are both loaded with OGB-1 and SR101. These SR101 structures completely enwrap the arteriole wall and exhibited a rapid and homogeneous Ca2+ elevation in response to the ictal discharge (Figures 3A,B; n = 3).
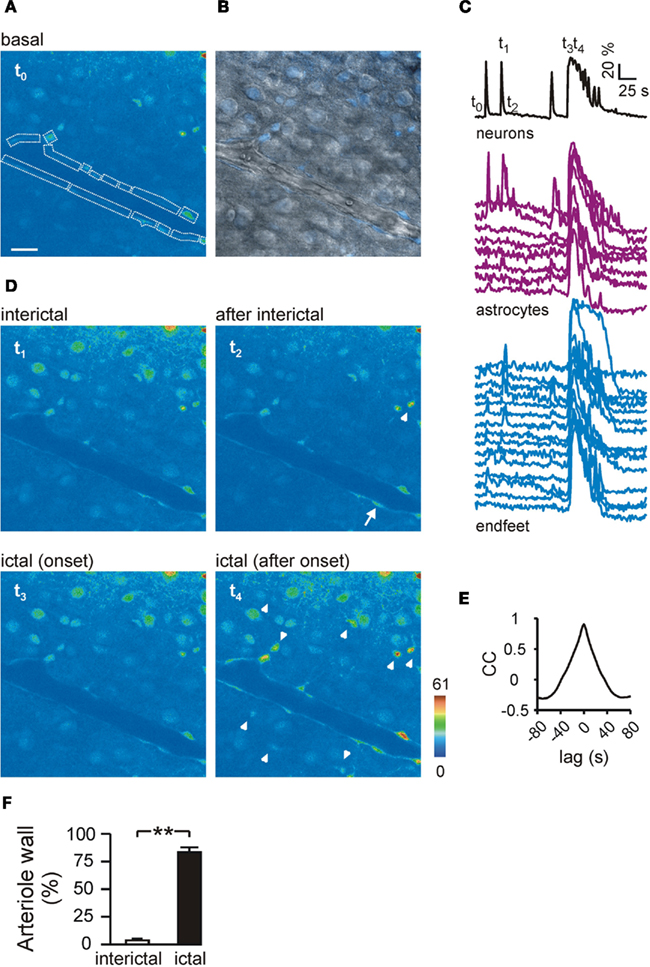
Figure 2. Ictal, but not interictal discharges induce a diffuse Ca2+ elevation in astrocyte endfeet from cortical slices. (A) Pseudocolor image of the OGB-1 fluorescence signal from a cortical slice at basal conditions (t0). Perivascular astrocyte and endfeet are marked by dashed lines. Scale bar, 10 μm. (B) Merged image of the pseudocolor fluorescence image and DIC-like image of the same field showing OGB-1-loaded endfeet outlining the wall of a cerebral arteriole. Note that both endothelial and smooth muscle cells at the inner part of the arteriole wall are not loaded with the Ca2+ dye. (C) Time course of the Ca2+ changes from grouped neurons, individual astrocytes and endfeet. t0–4 mark the timing for corresponding images shown in (A,D). (D) Sequence of pseudocolor images illustrating the synchronous Ca2+ elevation in neurons reflecting an interictal event (t1), the following activation of a Ca2+ increase in isolated endfoot (arrow) and astrocyte (arrowhead, t2), the synchronous activation of neurons reflecting the ictal event (t3), and the following massive Ca2+ elevation in astrocytes (arrowheads) and endfeet (t4). (E) Mean cross-correlation (CC) of the Ca2+ response in pairs of endfeet shown in (C). (F) Mean percentage of endfeet activated by interictal or ictal discharges.
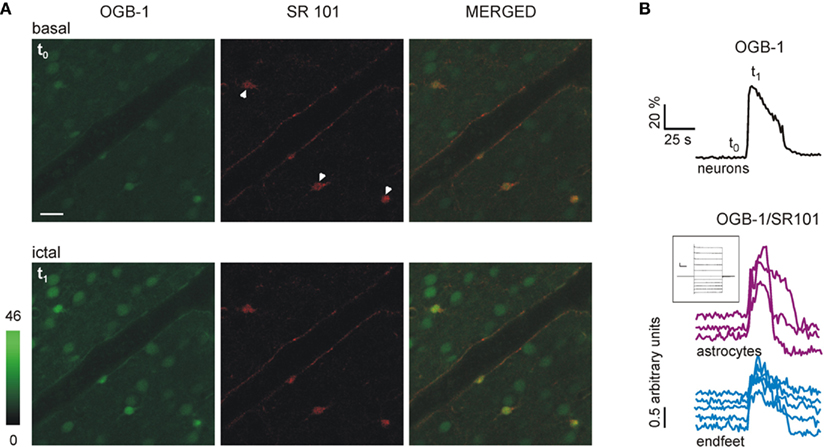
Figure 3. Perivascular structures showing ictal discharge-evoked Ca2+ elevations are labeled with the astrocyte-specific marker SR101. (A) Pseudocolor images illustrating the OGB-1 green signal (left panel,), the red SR101 signal (middle panel) and the merged image (right panel) from a cortical slice at basal conditions (t0) and during an ictal discharge (t1). Scale bar, 20 μm. Three SR101-loaded astrocyte soma are indicated (middle panel, arrowheads). (B) Time course of the Ca2+ signal changes from grouped neurons (measured as ΔF/F0 of the OGB-1 signal) and from individual astrocytes and endfeet (measured as the ratio OGB-1 (green) signal/SR101(red) signal). Inset, whole-cell current profile upon hyperpolarizing and depolarizing voltage steps from one of the SR101-positive astrocyte (scale bars, 500 pA, 50 ms). t0 and t1 mark the timing for corresponding images shown in (A).
To validate in an intact brain preparation the findings obtained in cortical slices, we used the in vitro isolated, whole brain from young adult guinea pigs. This is a close-to-in vivo preparation extensively utilized to study limbic activities in conditions of normal excitability and during seizures (De Curtis et al., 1991, 1998). We simultaneously recorded the extracellular field potential and Ca2+ signals by 2 photon-laser scanning microscopy (2P-LSM) during epileptiform activities induced by arterial application of the GABAA-receptor antagonist bicuculline methiodide (50 μM, 3 min). Cortical Ca2+ signals in neuropil were tightly correlated with the changes in the field potential recorded during the seizure discharge (Figure 4B). As in brain slices, in this close-to-in vivo condition seizure-like events regularly evoked Ca2+ elevations in astrocyte endfeet (Figures 4A,B), whereas interictal events failed to activate similar responses (Figures 4C,D). Quantitative analysis indicates that less than 1% of all the interictal events recorded (n = 143) triggered in endfeet a Ca2+ transient while 100% of the ictal events (n = 7) induced a large endfeet Ca2+ response (Figure 4E).
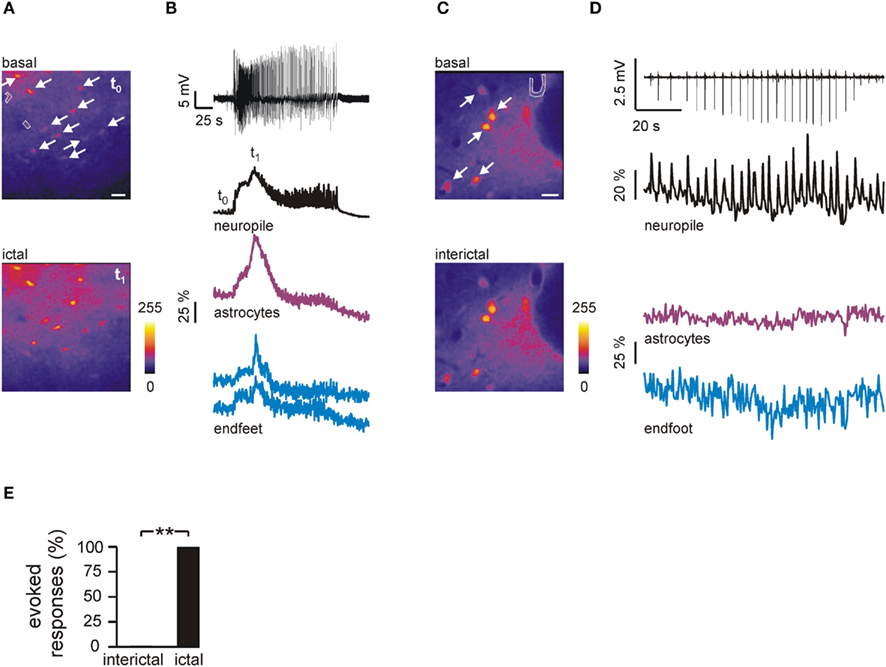
Figure 4. Ictal, but not interictal discharges induce a diffuse Ca2+ elevation in astrocyte endfeet in the guinea pig brain preparation. (A) Pseudocolor images illustrating the mean Ca2+ signal at basal conditions (t0) and during an ictal discharge (t1) induced by arterial perfusion with bicuculline in the guinea pig brain. Two endfeet are marked by dashed lines whereas white arrows mark the soma of several astrocytes. Scale bar, 40 μm. (B) Time course of the field potential (upper trace) and Ca2+ signal changes from neuropile, grouped astrocytes and two endfeet during the ictal discharge. t0 and t1 mark the timing for corresponding images shown in (A). (C) Pseudocolor images illustrating the mean Ca2+ signal at basal conditions and during the first two interictal events shown in (D). The dashed line and arrows mark one endfoot and astrocytes, respectively. Scale bar, 20 μm. (D) Time course of the field potential (upper trace) and Ca2+ signal from neuropile, grouped astrocytes and one endfoot during interictal discharges in the guinea pig brain. (E) Mean percentage of interictal and ictal discharges evoking a response in endfeet.
Ictal but Not Interictal Discharges Evoked an Arteriole Response
By recording simultaneously the Ca2+ fluorescence signal and the DIC image in cortical slice preparations, we evaluated the changes in the intraluminal diameter of arterioles in response to ictal and interictal discharges, as well as the temporal relationship between the arteriole response and the Ca2+ elevation in endfeet. In the example illustrated in Figures 5A,B, the massive activation of endfeet by the ictal discharge was followed by a vasoconstriction (−19.8%, Movie S2 in Supplementary Material) initiating 1.2 s after the Ca2+ elevation onset. This constrictive response was observed in 9 of 12 arterioles examined and it was likely due to the lack of intraluminal blood flow and of the myogenic tone that in slice preparations cause arterioles to be in a dilated state. To analyze more appropriately the nature of the response associated with the epileptic discharges in brain slice preparations, a certain degree of constriction that mimics the natural occurring myogenic tone of blood vessels in vivo (Sagher et al., 1993; Fergus et al., 1995; Fergus and Lee, 1997; Harkin et al., 1997a,b; Lovick et al., 1999) was pharmacologically induced with the thromboxane A2 analog U46619 (300 nM; mean preconstriction, −30.9 ± 3.9%, n = 26), before slice perfusion with picrotoxin/zero-Mg2+ (Akopov et al., 1996; Librizzi et al., 2000). In the preconstricted arteriole illustrated in Figure 5C, the massive and highly correlated Ca2+ elevation triggered by the ictal discharge in endfeet was followed by a dilation that initiated with a 1.2-s delay with respect to the Ca2+ peak in endfeet, and 8.68 s after the ictal discharge onset (Figures 5C,D; Movie S3 in Supplementary Material). Cross-correlation analysis revealed that the Ca2+ response in the different endfeet was highly correlated (Figure 5E). A dilating response to the ictal discharge (mean 111.7 ± 2.7%; 100% = basal diameter) was observed in 17 of 26 preconstricted arterioles examined, while three arterioles still responded to the ictal discharge with a small constriction. All together, the ictal discharge evoked either a dilating or a constrictive response in 29 of 38 preconstricted and non-preconstricted arterioles examined (Figure 5F). In contrast, only 2 of 17 interictal events evoked a vasomotor response (Figure 5F), as expected by the poor activation of endfeet in response to this type of epileptic discharge (Figure 2F).
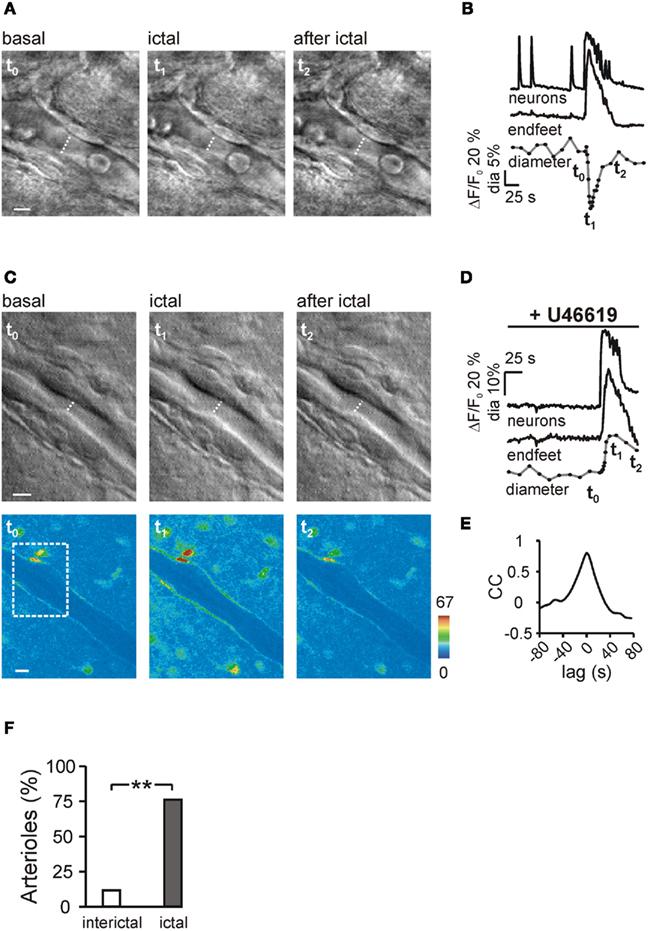
Figure 5. Ictal discharge-evoked arteriole responses. (A) DIC-like images of a portion of the arteriole shown in Figure 2 before (t0), during (t1), and after the ictal discharge (t2). The transient vasoconstriction evoked by the ictal discharge is indicated by the dashed line corresponding to the intraluminal diameter of the arteriole. Scale bar, 5 μm. (B) Ca2+ changes from grouped neurons and endfeet, and the diameter change of the same arteriole shown in (A) during the epileptiform activity. In this and the others figures, the dots indicate the timing of diameter measurement. Note the absence of diameter change after the interictal discharges and the constriction after the ictal discharge. t0–2 mark the timing for the images shown in (A). (C) DIC-like images (scale bar, 5 μm) and pseudocolor images (scale bar, 10 μm) of a cortical arteriole preconstricted with U46619 before (t0), during (t1) and after an ictal discharge (t2). Dashed rectangle in the pseudocolor image indicates the area shown in the DIC-like images. (D) Ca2+ changes of the group of neurons and endfeet and diameter change of the arteriole shown in C during the ictal discharge. (E) Mean cross-correlation (CC) of the Ca2+ response in pairs of endfeet from the arteriole shown in (C). (F) Percentage of arterioles showing a vasomotor response (either dilating or constrictive in nature) to interictal and ictal discharges.
The ictal discharge-induced vasodilating response in preconstricted arterioles initiated with variable delays (mean delay ± SEM, 10.6 ± 2.8 s; n = 17; Figure 6A). In most arterioles (13 of 17), vasodilation initiated with a delay of less than 10 s (mean delay, 5.5 ± 0.7 s) after the ictal discharge onset (Figure 6A, filled circles), shortly after the Ca2+ peak in endfeet (mean delay, 1.8 ± 0.6 s; Figure 6B). In the four remaining arterioles, the dilation initiated with a delay longer than 10 s with respect to both the ictal discharge onset (mean, 27.0 ± 7.7 s; p < 0.01; Figure 6A, open circles), and the Ca2+ peak in endfeet (21.4 ± 6.8 s). The loose association between the Ca2+ increase in endfeet and the vasodilation observed in these arterioles suggests that only the early, but not the late response of arterioles to the ictal discharge could be dependent on Ca2+ elevations in endfeet. To address this hypothesis, slices were incubated with cyclopiazonic acid (CPA), an inhibitor of the endoplasmic reticulum Ca2+-ATPase, which leads to the clearance of Ca2+ from the intracellular Ca2+ stores. Notably, Ca2+ signals in endfeet are essentially based on InsP3-induced Ca2+ release from intracellular Ca2+ stores (Straub et al., 2006). In CPA-incubated slices, the ictal discharge had a reduced duration, but the number of bursts during the initial 10 s of the discharge, i.e., the time window for the initiation of early vasodilations, was unchanged with respect to controls (Figures 6E,F,G). Under these conditions, the ictal discharge failed to trigger significant Ca2+ elevations in endfeet and it also failed to trigger early vasodilations (Figures 6A,C,D). The ictal discharge evoked, indeed, either no arteriole diameter changes (n = 7) or only a delayed vasodilation that initiated 23.7 ± 1.9 s (n = 5) with respect to the ictal discharge onset (Figure 6A). These results suggest that the early, but not the late dilating response of arterioles to the ictal discharge is mediated by Ca2+ elevations in endfeet.
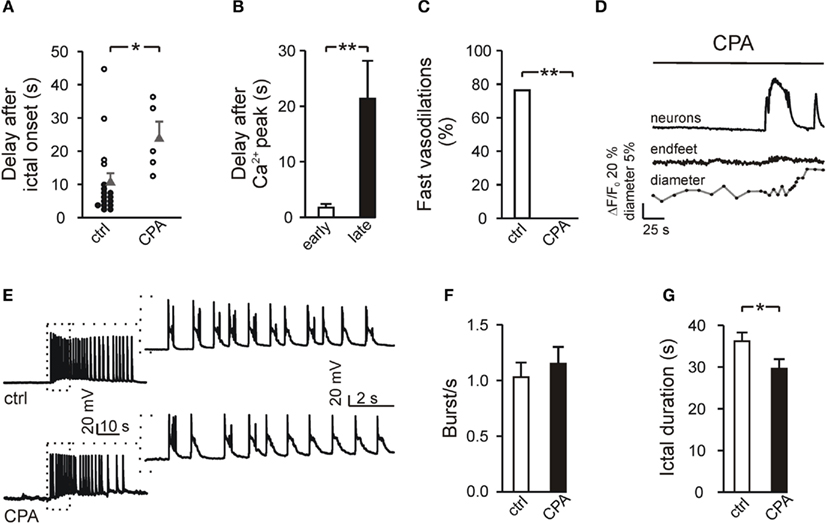
Figure 6. Ictal events trigger vasodilations with different delays. (A) Timing for the onset of vasodilations with respect to the ictal discharge onset, in U46619-preconstricted arterioles under control conditions and after inhibition of Ca2+ signal in endfeet by CPA. Filled and open symbols indicate vasodilations initiating within and after 10 s, respectively, after ictal discharge onset. Gray triangles, means ± SEM. (B) Mean delay of early (<10 s, n = 13) and late (>10 s, n = 4) vasodilations in U46619-preconstricted arterioles with respect to the Ca2+ peak in endfeet. (C) Percentage of U46619-preconstricted arterioles showing fast vasodilations in response to the ictal discharge in control slices and in slices incubated with CPA. (D) Delayed dilation of a preconstricted arteriole in response to the ictal discharge from a CPA-incubated slice. Note also the absence of Ca2+ elevations in endfeet. (E) Current-clamp recordings from a cortical pyramidal neuron of an ictal discharge in a control (top) and a CPA-incubated (bottom) slice. The insets show the first 10 s of the ictal discharge at an enlarged time scale. (F) Mean frequency of the bursts measured during the first 10 s of the ictal discharge elicited under control conditions (n = 4) and in the presence of CPA (n = 4). (G) Mean duration of the ictal discharge, as measured by the Ca2+ change, in control and CPA-incubated slices.
We next asked whether the absence of short latency responses of arterioles to the ictal discharge in CPA treated slices could be due to a direct effect of CPA on smooth muscle cells affecting their intrinsic ability to relax. We thus used a local application of a vasodilating agent, adenosine, that acts on arterioles independently of astrocytes. We found that vascular responsiveness was not compromised in arterioles from CPA-incubated slices since a short pressure pulse applied to a glass pipette containing 1 mM adenosine evoked a vasodilating response as rapid as that observed in arterioles from control slices (mean ± SEM, 3.2 ± 0.3 s, n = 4 and 4.7 ± 1 s, n = 3, in control and CPA-incubated slices, respectively) and of similar amplitude (mean ± SEM, 7.7 ± 1.6%, n = 4 and 7.8 ± 1.1%, n = 3, in control and CPA-incubated slices, respectively; Figure 7).
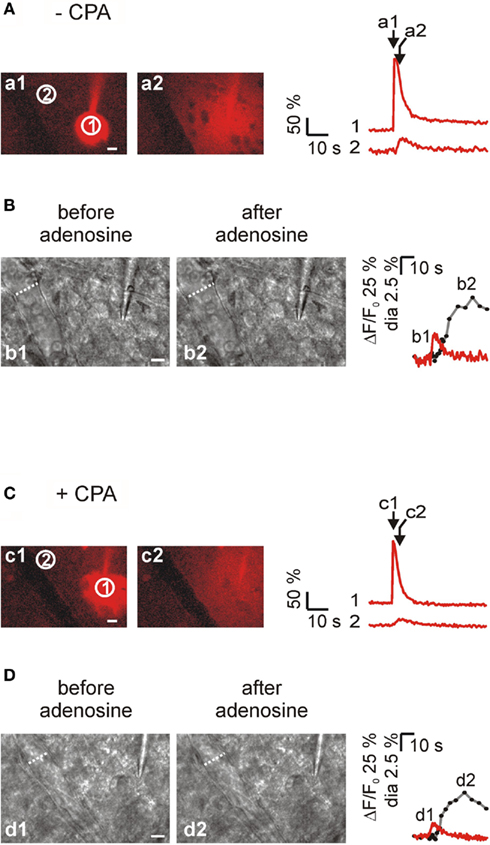
Figure 7. The ability of arterioles to dilate rapidly in response to local adenosine applications is unaffected by CPA. (A) Left, two successive images (a1 and a2) illustrating the diffusion of the fluorescent dye Texas Red after a pressure pulse applied to a pipette. Texas Red was used as an indication for the diffusion of adenosine that was also included in the pipette at 1 mM; right, time course of Texas Red diffusion in proximity to the pipette tip (ROI 1) and to an arteriole (ROI 2). (B) Left, DIC-like images of the preconstricted arteriole from the experiment shown in A before (b1) and after (b2) the adenosine application. Traces show the time course of vasodilation (gray trace, diameter of the arteriole) in response to adenosine and the time course (red trace) of the fluorescence signal in the region close to the portion of arteriole monitored (ROI 2). The dilating response initiated 2.8 s after the peak of the fluorescent signal in ROI 2. (C,D) The response of a preconstricted arteriole to local adenosine application was unaffected by CPA. The dilating response in this arteriole initiated 3.4 s after the fluorescence peak in ROI 2. Scale bars, 10 μm.
Discussion
We showed that large Ca2+ elevations are activated in astrocyte endfeet by the ictal, seizure-like discharge and this activation represents an important signaling pathway in the control of neurovascular coupling during epileptiform activity.
Ictal, but Not Interictal Discharges Massively Activate Endfeet and Arteriole Responses
In different models of focal epilepsies developed on slices from the rat entorhinal cortex, we recently observed that the ictal discharge-evoked massive and synchronous Ca2+ elevations in a large number of astrocytes, while the Ca2+ elevations induced by interictal discharges were rare and they occurred only in isolated astrocytes (Gomez-Gonzalo et al., 2010). In the present study, we observed a similar behavior in the astrocytes of the neocortex and we also observed that the processes of these cells in contact with cerebral vessels exhibited large Ca2+ elevations in response to the ictal, but not the interictal discharge. A higher amount of glutamate released during the ictal than the interictal discharge may account for the large activation of astrocytes that ultimately results in the massive Ca2+ elevation in endfeet. Accordingly, ictal discharges were also found to be largely more effective than interictal discharges in evoking a prompt arteriole response. The weak activation of endfeet by interictal events is unlikely due to experimental conditions associated with brain slice preparations, since interictal events failed to activate endfeet also in the close-to-in vivo isolated guinea pig brain preparation. Indeed, in the intact brain of the isolated and arterially perfused whole guinea pig brain preparation (De Curtis et al., 1998), we previously showed that a Ca2+ change in astrocytes of the entorhinal cortex evoked by an interictal discharge was a rare event, while ictal discharges evoked massive Ca2+ elevations in astrocytes (Gomez-Gonzalo et al., 2010). Here we observed in the same preparation that also the endfeet of the astrocytes are activated by ictal, but not by interictal discharges.
Our observations can be important for interpretation of blood oxygen level-dependent (BOLD) signals with fMRI. The change in this signal reflects the change of the oxygen level in brain tissue due to increased CBF, cerebral blood volume, and metabolic rate of oxygen utilization. It is generally believed that the metabolic needs of neurons dictate the CBF increase, and this CBF response is quantitatively related to the intensity of neuronal activities. The observations reported in the present study strengthen the hypothesis that fMRI data do not reflects neuronal activities only (Iadecola and Nedergaard, 2007). The massive Ca2+ elevations in astrocytes evoked by the ictal discharge represents, indeed, a powerful stimulus for the activation of processes, such as gliotransmitter release, that increase considerably energy consumption in these cells. It follows that astrocytes themselves could account for a significant proportion of energy consumption in the brain. Noteworthy is also that by visualizing the local CBF increase evoked by epileptic discharges (with the correlated EEG signal), fMRI has the potential to become a valuable, non-invasive technique for presurgical localization of the epileptogenic focus in patients with intractable epilepsies (Gotman et al., 2006). Because interictal spikes occur at relatively high frequency in epileptic patients, simultaneous fMRI–EEG studies have been focused on these epileptiform activities to investigate the relationship between epileptic episodes and CBF. A number of reports revealed, however, that interictal spikes have either no effects or are frequently associated with decreased rather than with increased BOLD signals (Yamamoto and Kato, 2002; Archer et al., 2003; Bagshaw et al., 2004; Kobayashi et al., 2006). The poor ability of interictal discharges with respect to the ictal discharges in evoking marked CBF responses has been also indirectly revealed by recordings of intrinsic optical signals in vivo (Zhao et al., 2009). Our observations provide further evidence that it may be inappropriate to rely on interictal events to localize the epileptogenic focus.
By revealing that interictal discharges fail to activate significantly the arteriole response, our study suggests that during interictal activities the CBF increase can be inadequate to meet the high metabolic demand of neurons leading to cerebral hypoxia and brain damage. A reduced neurovascular coupling during interictal activities may also contribute to the hypometabolism observed with fluorodeoxyglucose positron emission tomography (PET) imaging in the epileptogenic zone (Van Paesschen et al., 2007) and with neurological symptoms that may be associated with progressive functional impairment of the epileptogenic region (Girouard and Iadecola, 2006; Zimmermann et al., 2008).
The Ictal Discharge Evokes also Astrocyte-Independent Vasodilations
Previous studies revealed that Ca2+ elevations in astrocyte endfeet activated by various stimuli, including neuronal afferent stimulation (Zonta et al., 2003), mGluR agonists (Zonta et al., 2003; Mulligan and Macvicar, 2004), or caged-Ca2+ photolysis in brain slices (Mulligan and Macvicar, 2004; Metea and Newman, 2006; Gordon et al., 2008) as well as light stimulation or caged-Ca2+ photolysis in retina preparations (Metea and Newman, 2006), were followed by an arteriole response with a few second delay. Our observation that ictal-induced vasodilations initiated with different delays suggests that different signaling pathways mediate the blood vessel response during epileptiform activities. The early dilating response that we observed in most arterioles, is likely mediated by astrocytes since it initiated shortly (1.8 ± 0.6 s) after Ca2+ elevations in endfeet. In support of this conclusion, we observed that the early arteriole response to the ictal discharge was abolished after Ca2+ signal inhibition in endfeet by CPA. The absence of early vasodilations was unlikely due to direct effects of CPA on smooth muscle cells since arterioles from CPA slices dilated rapidly in response to adenosine applications. The intrinsic capability of smooth muscle cells to relax and thus to mediate rapid vasodilations was thus preserved in CPA slices. However, given that after slice incubation with CPA, the intracellular Ca2+ compartments are empty in both astrocytes and neurons, we can not completely rule out the possibility that a vasodilating factor released from neurons through a mechanism that involves an intracellular Ca2+ release pathway, contributes to ictal discharge-mediated early vasodilations. Noteworthy is that in CPA-incubated slices the duration of the ictal discharge was significantly reduced with respect to controls. In the same picrotoxin/zero-Mg2+ model used here, we recently observed that after partial inhibition of astrocyte Ca2+ signal by either 2-methyl-6-(phenylethynyl)-pyridine (MPEP) or pyridoxal phosphate-6-azophenyl-2′,4′-disulfonic acid (PPADS), i.e., mGluR and purinergic receptor antagonists, respectively, the ictal discharge duration in entorhinal cortex was also significantly reduced (Gomez-Gonzalo et al., 2010).
The delayed dilating response that we observed in several arterioles initiated more than 20 s after the Ca2+ increase in endfeet. Such a loose association between these two events suggests that Ca2+ signals in astrocytes may have no role in late vasodilations. This hypothesis is consistent with our observation that late, but not early vasodilations, were unaffected by inhibition of Ca2+ elevations in endfeet. Delayed vasodilations may be mediated by factors, not necessarily of astrocytic origin, that develop along with the ictal discharge, such as an extracellular K+ elevation (Knot et al., 1996; Horiuchi et al., 2002; Filosa et al., 2006), a perivascular acidosis (Lindauer et al., 2003), and an increase in extracellular adenosine (Boison, 2005). This issue needs to be clarified in future studies. Given that an essential feature of the neurovascular coupling is the rapidity of the blood vessel response to local neuronal activity, it is unlikely that the late vasodilating response can serve to adequately meet the rapid increase in the metabolic demand of hyperactive neurons.
Conclusion
By revealing that Ca2+ elevations in astrocyte endfeet are activated by epileptiform activities our study provides new insights into the cellular pathways at the basis of the hemodynamic changes in the epileptic brain. This massive activation of astrocytes by the ictal seizure-like discharge is thus a process that can increase considerably energy consumption in the brain. This aspect should be taken into account for an accurate interpretation of modern brain imaging data that are commonly believed to reflect neuronal activities only.
Conflict of Interest Statement
The authors declare that the research was conducted in the absence of any commercial or financial relationships that could be construed as a potential conflict of interest.
Acknowledgments
We thank Paulo Magalhães and Brian MacVicar for critical reading of the manuscript, and Mario Cammarota for data analysis. This work was supported by grants from the European Community 7th Framework Program (NeuroGlia, HEALTH-F2-2007-202167), Telethon Italy (GGP07278), Strategic Projects of the University of Padova and CARIPARO foundation. Marta Gómez-Gonzalo was also supported by the MEC (Spain).
Supplementary Material
The Supplementary Material for this article can be found online at http://www.frontiersin.org/cellular_neuroscience/10.3389/fncel.2011.00008/abstract
Movie S1. Ictal, but not interictal discharges trigger a massive activation of astrocyte endfeet. This movie shows the synchronous Ca2+ increase in cortical neurons that reflects interictal and ictal discharges (as reported in Figure 2) evoked by slice perfusion with picrotoxin/zero-Mg2+. Note that interictal discharges activate a Ca2+ elevation in isolated endfeet, while the ictal discharge evokes a large Ca2+ response in most endfeet. Time frame, 1.24 s.
Movie S2. Ictal, but not interictal discharges evoke a constriction in a non-preconstricted arteriole. This movie shows the merged image sequence of the pseudocolor fluorescence images (as reported in Movie S1) and the corresponding DIC-like images during both interictal and ictal discharges. Note that ictal, but not interictal discharges trigger a vasoconstriction after massive activation of endfeet. Time frame, 1.24 s.
Movie S3. Ictal discharge-evoked dilation of a preconstricted arteriole. This movie shows the merged image sequence of the pseudocolor fluorescence images and the corresponding DIC-like images during an ictal discharge. A diffuse dilating response occurs shortly after the activation of endfeet by the ictal discharge. Note also the constriction evoked by the ictal discharge in a small portion of the same arteriole. Time frame, 1.24 s.
References
Akopov, S., Sercombe, R., and Seylaz, J. (1996). Cerebrovascular reactivity: role of endothelium/platelet/ leukocyte interactions. Cerebrovasc. Brain Metab. Rev. 8, 11–94.
Archer, J. S., Abbott, D. F., Waites, A. B., and Jackson, G. D. (2003). fMRI “deactivation” of the posterior cingulate during generalized spike and wave. Neuroimage 20, 1915–1922.
Avoli, M., Barbarosie, M., Lucke, A., Nagao, T., Lopantsev, V., and Kohling, R. (1996). Synchronous GABA-mediated potentials and epileptiform discharges in the rat limbic system in vitro. J. Neurosci. 16, 3912–3924.
Avoli, M., D’antuono, M., Louvel, J., Kohling, R., Biagini, G., Pumain, R., D’arcangelo, G., and Tancredi, V. (2002). Network and pharmacological mechanisms leading to epileptiform synchronization in the limbic system in vitro. Prog. Neurobiol. 68, 167–207.
Bagshaw, A. P., Aghakhani, Y., Benar, C. G., Kobayashi, E., Hawco, C., Dubeau, F., Pike, G. B., and Gotman, J. (2004). EEG-fMRI of focal epileptic spikes: analysis with multiple haemodynamic functions and comparison with gadolinium-enhanced MR angiograms. Hum. Brain Mapp. 22, 179–192.
Boison, D. (2005). Adenosine and epilepsy: from therapeutic rationale to new therapeutic strategies. Neuroscientist 11, 25–36.
Carmignoto, G., and Gomez-Gonzalo, M. (2010). The contribution of astrocyte signalling to neurovascular coupling. Brain Res. Rev. 63, 138–148.
Cauli, B., Tong, X.-K., Rancillac, A., Serluca, N., Lambolez, B., Rossier, J., and Hamel, E. (2004). Cortical GABA interneurons in neurovascular coupling: relays for subcortical vasoactive pathways. J. Neurosci. 24, 8940–8949.
D’antuono, M., Kohling, R., Ricalzone, S., Gotman, J., Biagini, G., and Avoli, M. (2010). Antiepileptic drugs abolish ictal but not interictal epileptiform discharges in vitro. Epilepsia 51, 423–431.
De Curtis, M., and Avanzini, G. (2001). Interictal spikes in focal epileptogenesis. Prog. Neurobiol. 63, 541–567.
De Curtis, M., Biella, G., Buccellati, C., and Folco, G. (1998). Simultaneous investigation of the neuronal and vascular compartments in the guinea pig brain isolated in vitro. Brain Res. Brain Res. Protoc. 3, 221–228.
De Curtis, M., Pare, D., and Llinas, R. R. (1991). The electrophysiology of the olfactory-hippocampal circuit in the isolated and perfused adult mammalian brain in vitro. Hippocampus 1, 341–354.
Fellin, T., Pascual, O., Gobbo, S., Pozzan, T., Haydon, P. G., and Carmignoto, G. (2004). Neuronal synchrony mediated by astrocytic glutamate through activation of extrasynaptic NMDA receptors. Neuron 43, 729–743.
Fergus, A., Jin, Y., Thai, Q. A., Kassell, N. F., and Lee, K. S. (1995). Vasodilatory actions of calcitonin gene-related peptide and nitric oxide in parenchymal microvessels of the rat hippocampus. Brain Res. 694, 78–84.
Fergus, A., and Lee, K. S. (1997). Regulation of cerebral microvessels by glutamatergic mechanisms. Brain Res. 754, 35–45.
Filosa, J. A., Bonev, A. D., Straub, S. V., Meredith, A. L., Wilkerson, M. K., Aldrich, R. W., and Nelson, M. T. (2006). Local potassium signaling couples neuronal activity to vasodilation in the brain. Nat. Neurosci. 9, 1397–1403.
Girouard, H., and Iadecola, C. (2006). Neurovascular coupling in the normal brain and in hypertension, stroke, and Alzheimer disease. J. Appl. Physiol. 100, 328–335.
Gomez-Gonzalo, M., Losi, G., Chiavegato, A., Zonta, M., Cammarota, M., Brondi, M., Vetri, F., Uva, L., Pozzan, T., De Curtis, M., Ratto, G. M., and Carmignoto, G. (2010). An excitatory loop with astrocytes contributes to drive neurons to seizure threshold. PLoS Biol. 8, e1000352. doi:10.1371/journal.pbio.1000352
Gordon, G. R., Choi, H. B., Rungta, R. L., Ellis-Davies, G. C., and Macvicar, B. A. (2008). Brain metabolism dictates the polarity of astrocyte control over arterioles. Nature 456, 745–749.
Gotman, J., Kobayashi, E., Bagshaw, A. P., Benar, C. G., and Dubeau, F. (2006). Combining EEG and fMRI: a multimodal tool for epilepsy research. Magn. Reson. Imaging 23, 906–920.
Harkin, C. P., Hudetz, A. G., Schmeling, W. T., Kampine, J. P., and Farber, N. E. (1997a). Halothane-induced dilatation of intraparenchymal arterioles in rat brain slices: a comparison to sodium nitroprusside. Anesthesiology 86, 885–894.
Harkin, C. P., Schmeling, W. T., Kampine, J. P., and Farber, N. E. (1997b). The effects of hyper- and hypocarbia on intraparenchymal arterioles in rat brain slices. Neuroreport 8, 1841–1844.
Haydon, P. G., and Carmignoto, G. (2006). Astrocyte control of synaptic transmission and neurovascular coupling. Physiol. Rev. 86, 1009–1031.
Horiuchi, T., Dietrich, H. H., Hongo, K., Goto, T., and Dacey, R. G. Jr. (2002). Role of endothelial nitric oxide and smooth muscle potassium channels in cerebral arteriolar dilation in response to acidosis. Stroke 33, 844–849.
Iadecola, C. (2004). Neurovascular regulation in the normal brain and in Alzheimer’s disease. Nat. Rev. Neurosci. 5, 347–360.
Iadecola, C., and Nedergaard, M. (2007). Glial regulation of the cerebral microvasculature. Nat. Neurosci. 10, 1369–1376.
Jefferys, J. G. R. (2003). Models and mechanisms of experimental epilepsies. Epilepsia 44(Suppl. 12), 44–50.
Knot, H. J., Zimmermann, P. A., and Nelson, M. T. (1996). Extracellular K(+)-induced hyperpolarizations and dilatations of rat coronary and cerebral arteries involve inward rectifier K(+) channels. J. Physiol. 492, 419–430.
Kobayashi, E., Bagshaw, A. P., Grova, C., Dubeau, F., and Gotman, J. (2006). Negative BOLD responses to epileptic spikes. Hum. Brain Mapp. 27, 488–497.
Kuhl, D. E., Engel, J. Jr., Phelps, M. E., and Selin, C. (1980). Epileptic patterns of local cerebral metabolism and perfusion in humans determined by emission computed tomography of 18FDG and 13NH3. Ann. Neurol. 8, 348–360.
Librizzi, L., Folco, G., and De Curtis, M. (2000). Nitric oxide synthase inhibitors unmask acetylcholine-mediated constriction of cerebral vessels in the in vitro isolated guinea-pig brain. Neuroscience 101, 283–287.
Lindauer, U., Vogt, J., Schuh-Hofer, S., Dreier, J. P., and Dirnagl, U. (2003). Cerebrovascular vasodilation to extraluminal acidosis occurs via combined activation of ATP-sensitive and Ca2 + -activated potassium channels. J. Cereb. Blood Flow Metab. 23, 1227–1238.
Losi, G., Cammarota, M., Chiavegato, A., Gomez-Gonzalo, M., and Carmignoto, G. (2010). A new experimental model of focal seizures in the entorhinal cortex. Epilepsia 51, 1493–1502.
Lovick, T. A., Brown, L. A., and Key, B. J. (1999). Neurovascular relationships in hippocampal slices: physiological and anatomical studies of mechanisms underlying flow-metabolism coupling in intraparenchymal microvessels. Neuroscience 92, 47–60.
Metea, M. R., and Newman, E. A. (2006). Glial cells dilate and constrict blood vessels: a mechanism of neurovascular coupling. J. Neurosci. 26, 2862–2870.
Mulligan, S. J., and Macvicar, B. A. (2004). Calcium transients in astrocyte endfeet cause cerebrovascular constrictions. Nature 431, 195–199.
Nimmerjahn, A., Kirchhoff, F., Kerr, J. N., and Helmchen, F. (2004). Sulforhodamine 101 as a specific marker of astroglia in the neocortex in vivo. Nat. Methods 1, 31–37.
Pasti, L., Volterra, A., Pozzan, T., and Carmignoto, G. (1997). Intracellular calcium oscillations in astrocytes: a highly plastic, bidirectional form of communication between neurons and astrocytes in situ. J. Neurosci. 17, 7817–7830.
Sagher, O., Zhang, X. Q., Szeto, W., Thai, Q. A., Jin, Y., Kassell, N. F., and Lee, K. S. (1993). Live computerized videomicroscopy of cerebral microvessels in brain slices. J. Cereb. Blood Flow Metab. 13, 676–682.
Straub, S. V., Bonev, A. D., Wilkerson, M. K., and Nelson, M. T. (2006). Dynamic inositol trisphosphate-mediated calcium signals within astrocytic endfeet underlie vasodilation of cerebral arterioles. J. Gen. Physiol. 128, 659–669.
Takano, T., Tian, G.-F., Peng, W., Lou, N., Libionka, W., Han, X., and Nedergaard, M. (2006). Astrocyte-mediated control of cerebral blood flow. Nat. Neurosci. 9, 260–267.
Traub, R. D., and Wong, R. K. (1982). Cellular mechanism of neuronal synchronization in epilepsy. Science 216, 745–747.
Van Paesschen, W., Dupont, P., Sunaert, S., Goffin, K., and Van Laere, K. (2007). The use of SPECT and PET in routine clinical practice in epilepsy. Curr. Opin. Neurol. 20, 194–202.
Yamamoto, T., and Kato, T. (2002). Paradoxical correlation between signal in functional magnetic resonance imaging and deoxygenated haemoglobin content in capillaries: a new theoretical explanation. Phys. Med. Biol. 47, 1121–1141.
Zhao, M., Ma, H., Suh, M., and Schwartz, T. H. (2009). Spatiotemporal dynamics of perfusion and oximetry during ictal discharges in the rat neocortex. J. Neurosci. 29, 2814–2823.
Zimmermann, A., Domoki, F., and Bari, F. (2008). Seizure-induced alterations in cerebrovascular function in the neonate. Dev. Neurosci. 30, 293–305.
Keywords: epilepsy, calcium, neurovascular coupling
Citation: Gómez-Gonzalo M, Losi G, Brondi M, Uva L, Sato SS, Curtis Md, Ratto GM and Carmignoto G (2011) Ictal but not interictal epileptic discharges activate astrocyte endfeet and elicit cerebral arteriole responses. Front. Cell. Neurosci. 5:8. doi: 10.3389/fncel.2011.00008
Received: 07 March 2011; Accepted: 06 June 2011;
Published online: 17 June 2011.
Edited by:
Yehezkel Ben-Ari, Institut National de la Santé et de la Recherche Médicale, FranceReviewed by:
John Huguenard, Stanford University School of Medicine, USAHuibert D. Mansvelder, Vrije Universiteit University, Netherlands
Copyright: © 2011 Gómez-Gonzalo, Losi, Brondi, Uva, Sato, Curtis, Ratto and Carmignoto. This is an open-access article subject to a non-exclusive license between the authors and Frontiers Media SA, which permits use, distribution and reproduction in other forums, provided the original authors and source are credited and other Frontiers conditions are complied with.
*Correspondence: Giorgio Carmignoto, Institute of Neuroscience, National Research Council, Padova, Italy; Department of Experimental Biomedical Sciences, University of Padova, Viale G. Colombo 3, 35121 Padova, Italy. e-mail: giorgio.carmignoto@ bio.unipd.it