 Carolina Leon-Pinzon
 Montserrat G. Cercós
 Paula Noguez
 Citlali Trueta
 Francisco F. De-Miguel
- 1Instituto de Fisiología Celular-Neurociencias, Universidad Nacional Autónoma de México, México D.F., México
- 2Departamento de Neurofisiología, Instituto Nacional de Psiquiatriìa Ramoìn de la Fuente Munñiz, México D.F., México
The soma of many neurons releases large amounts of transmitter molecules through an exocytosis process that continues for hundreds of seconds after the end of the triggering stimulus. Transmitters released in this way modulate the activity of neurons, glia and blood vessels over vast volumes of the nervous system. Here we studied how somatic exocytosis is maintained for such long periods in the absence of electrical stimulation and transmembrane Ca2+ entry. Somatic exocytosis of serotonin from dense core vesicles could be triggered by a train of 10 action potentials at 20 Hz in Retzius neurons of the leech. However, the same number of action potentials produced at 1 Hz failed to evoke any exocytosis. The 20-Hz train evoked exocytosis through a sequence of intracellular Ca2+ transients, with each transient having a different origin, timing and intracellular distribution. Upon electrical stimulation, transmembrane Ca2+ entry through L-type channels activated Ca2+-induced Ca2+ release. A resulting fast Ca2+ transient evoked an early exocytosis of serotonin from sparse vesicles resting close to the plasma membrane. This Ca2+ transient also triggered the transport of distant clusters of vesicles toward the plasma membrane. Upon exocytosis, the released serotonin activated autoreceptors coupled to phospholipase C, which in turn produced an intracellular Ca2+ increase in the submembrane shell. This localized Ca2+ increase evoked new exocytosis as the vesicles in the clusters arrived gradually at the plasma membrane. In this way, the extracellular serotonin elevated the intracellular Ca2+ and this Ca2+ evoked more exocytosis. The resulting positive feedback loop maintained exocytosis for the following hundreds of seconds until the last vesicles in the clusters fused. Since somatic exocytosis displays similar kinetics in neurons releasing different types of transmitters, the data presented here contributes to understand the cellular basis of paracrine neurotransmission.
Introduction
In addition to the canonical release of transmitters from synapses, many neuron types release transmitters or peptides by exocytosis from their soma (For review see Trueta and De-Miguel, 2012). A brief train of impulses at high frequency or a long depolarization evoke a “large-scale” somatic exocytosis, in which large amounts of transmitter molecules are released for hundreds of seconds (Puopolo et al., 2001; Trueta et al., 2003; Soldo et al., 2004; Zhang et al., 2007; Kaushalya et al., 2008). This release seems to be responsible for the modulation of many functions in the nervous system (for review see Trueta and De-Miguel, 2012). Since somatic exocytosis depends on transmembrane Ca2+ entry (Sun and Poo, 1987; Chen et al., 1996; Jaffe et al., 1998; Puopolo et al., 2001; Trueta et al., 2003; Soldo et al., 2004; Huang et al., 2007; Kaushalya et al., 2008; Hirasawa et al., 2009), one wonders how it is maintained for such long periods after electrical stimulation and transmembrane Ca2+ entry have ended.
To study this problem we took advantage of the serotonergic Retzius neurons of the leech, in which most fine mechanisms of serotonin (5-HT) exocytosis from the synapses and soma were first elucidated (For review see Nicholls and Kuffler, 1990; De-Miguel and Trueta, 2005). The size of these neurons and the possibility to isolate them and keep them in culture provide excellent experimental conditions to understand cellular principles of 5-HT neurotransmission that have later been confirmed in other neuron types, including those of mammals (for review see Trueta and De-Miguel, 2012). The large soma (60–80 μm diameter) of Retzius neurons contains 5-HT packaged in 100-nm diameter dense core vesicles (Coggeshall, 1972; Bruns et al., 2000). At rest, hundreds of these vesicles are tightly assembled in clusters that remain at a distance from the plasma membrane (De-Miguel et al., 2012; Trueta and De-Miguel, 2012). In response to a train of 10 action potentials at 20 Hz, a microtubule-based transport mobilizes 80–110 of these vesicle clusters to different spots of the plasma membrane (Trueta et al., 2004, 2012; De-Miguel et al., 2012) where all the vesicles in each cluster undergo exocytosis within the following 100–400 s (De-Miguel et al., 2012). Other vesicle clusters may fuse later at the same plasma membrane spot in response to the same stimulation train (De-Miguel et al., 2012). We have estimated that a single 20-Hz train evokes exocytosis from 60,000 to 100,000 vesicles/soma. By contrast, stimulation with 10 impulses delivered at 1 Hz fails to evoke this large-scale exocytosis, and in electron micrographs the vesicle clusters appear at their resting positions (Trueta et al., 2003; De-Miguel et al., 2012). Somatic exocytosis is abolished by blocking transmembrane Ca2+ entry through L-type Ca2+ channels (Trueta et al., 2003), or reduced by blocking Ca2+-induced Ca2+ release (Trueta et al., 2004). However, how Ca2+ entry evokes such delayed somatic exocytosis and how exocytosis is sustained yet need to be explored. The answer to these questions would provide the cellular basis to understand the wider phenomenon of the paracrine modulation of the nervous system.
In this study we dissected the steps from electrical stimulation until the end of the large-scale somatic exocytosis. Exocytosis was stimulated by a train of 10 action potentials at 20 Hz upon intracellular injection of current pulses. The kinetics of exocytosis from single vesicle clusters was accurately measured from the cumulative fluorescence of FM styryl dyes as vesicles fused with the plasma membrane and were retrieved just below the neuronal surface (Betz and Bewick, 1992). This was possible, since upon endocytosis the vesicle clusters remain in the submembrane shell for minutes before being recycled (Trueta et al., 2012). The amount of exocytosis was quantified as the number of FM1-43 fluorescent spots/soma (Betz and Bewick, 1992), which indicates the number of vesicle clusters that underwent exocytosis. The kinetics of the intracellular Ca2+ changes was measured from fluorescence increases of Ca2+-sensitive dyes injected intracellularly (Gee et al., 2000).
Materials and Methods
Ethics Statement
Animal research was conducted according to the statements of the Animal Committee of the Instituto de Fisiología Celular, UNAM, México.
Isolation and Culture of Neurons
Imaging experiments were performed in cultured Retzius neurons of leeches Hirudo verbana (Siddall et al., 2007). Individual neurons were isolated by suction through a glass pipette (Dietzel et al., 1986). Neurons were then rinsed several times in L-15 culture medium (Sigma-Aldrich) supplemented with 6 mg ml−1 glucose, 0.1 mg ml−1 gentamicin and 2% heat- inactivated fetal bovine serum and then plated on glass-bottomed culture dishes pre-coated with concanavalin-A (Sigma-Aldrich). Experiments were performed at 18°C after 1–8 days in culture.
Electrical Stimulation and Recording
Electrical stimulation consisted of trains of 10 action potentials produced by 10-ms current pulses delivered at 1 or 20 Hz (Trueta et al., 2003; De-Miguel et al., 2012) through a borosilicate microelectrode with a resistance of 18–30 MΩ when filled with 2 M potassium acetate (KAc). The amplitude of the current pulses was adjusted in every neuron between 5 and 8 nA, so that each pulse would produce one action potential. The neuronal resting potential was maintained at −60 mV by direct current injection. Electrical recordings were acquired by an intracellular amplifier AxoClamp 2B (Axon Instruments) connected to an analog-to-digital board Digidata 1200 (Axon Instruments) that acquired at a sampling frequency of 20 KHz using pCLAMP9 software (Axon Instruments). Data were stored in a PC.
To test for possible 5-HT activation of transmembrane currents, voltage clamp and transmembrane current recordings were made under discontinuous single-electrode voltage-clamp conditions. The quality of the clamp conditions was tested by continuously monitoring the time constant of the system at fast speed. The voltage was clamped at −60 mV and stimulation consisted of 10 voltage pulses of 10 ms to +10 mV at 20 Hz. Action potentials during the 20-Hz train could not be clamped. However, good voltage clamp conditions were obtained after the train and there were no significant current changes in the minutes following stimulation.
Measurements of Exocytosis
We measured the cumulative fluorescence increase of FM styryl dyes (Molecular Probes) produced by the progressive exo/endocytosis of dense core vesicles in the clusters (Betz and Bewick, 1992; De-Miguel et al., 2012). FM1-43 (Molecular Probes) was used for measuring only exocytosis and FM4-64 (Molecular Probes) was used in combination with Fluo-4 for simultaneous measurements of exocytosis and Ca2+. Both compounds were added to the bath at a final 2 μM dilution and 10 min later neurons were impaled and hyperpolarized to −60 mV by DC current injection to avoid spontaneous firing. The values of exocytosis were measured as the number of FM1-43 spots/soma normalized to the 91 spots/soma produced in response to 20-Hz stimulation. These data were obtained from previous experiments (Trueta et al., 2003, 2004). The reason for using our previous data was that due to their photo-damage equivalent spot-counting could not be made in the neurons that had been used for kinetic measurements. The counts in response to 20-Hz stimulation were considered as 100%, since at this frequency somatic exocytosis reaches its saturation levels (Trueta and De-Miguel, in preparation).
Measurements of Intracellular Ca2+ Increases
Relative changes in the intracellular Ca2+ concentration were measured with the Ca2+-sensitive fluorescent dyes Fluo-4 and Fluo-5F pentapotassium salt (Molecular probes). An advantage of these Fluo dyes is that both can be excited with a single wavelength and therefore allow a fast (100 ms/image) imaging rate and /or long acquisition periods when compared with ratiometric dyes, thus reducing bleaching and neuron damage. This was particularly critical for our experiments when imaging simultaneously Ca2+ and exocytosis, since two images were acquired for each time point over several minutes. To calibrate the Ca2+ concentrations we also tried Fura-2 imaging. However, the high sampling speed necessary to detect the fast Ca2+ transient required to double the imaging rates and neurons in these conditions were damaged rapidly by the Fura-2 excitation and emission wavelengths. For this reason we sacrificed the concentration measurements to correlate the precise kinetics of the Ca2+ transients with those of exocytosis. Dyes had to be injected by iontophoresis since Retzius neurons do not retain esterase-coupled dyes. For this, the dyes were dissolved in water at a concentration of 5 mM and were injected into the soma by a 4 nA hyperpolarizing current for 4-6 min using borosilicate microelectrodes. The electrode tip was back-filled with the dye solution and the microelectrode was then filled with 0.1 M KCl. Imaging was made 10–15 min after the dye had been loaded.
Pitfalls and Considerations in the Use of Ca2+ Sensitive Dyes
Although we detected Ca2+ spikes in response to individual action potentials with both Fluo dyes, the low affinity (2.5 μM) Fluo-5F could not detect the small Ca2+ transient described in the results sections. For this reason most of the experiments reported here were made by using the higher affinity (Kd = 345 nM) Fluo-4, with which we consistently detected the small Ca2+ transient. A major concern of the use of high affinity dyes for our purposes is the possibility that dye saturation distorts the kinetics of the Ca2+ dynamics and exocytosis. However, that the kinetics of the fast Ca2+ transient obtained with either Fluo dye were identical suggested that Fluo-4 was not saturated under our experimental conditions. This was further tested by the addition of ionomycin (5 μM) to neurons injected with high affinity dye after recording the transient evoked by 20 Hz stimulation. Ionomycin produced fluorescence increases to levels high above the peak fluorescence of the Ca2+ transients. In addition, neurons that became damaged during the experiments had similar fluorescence increases. These evidences indicate that the somatic Ca2+ increases in response to electrical stimulation were not produced under dye-saturation conditions.
We also assume that any distortion of the intracellular Ca2+ kinetics due to buffering by Fluo-4 did not affect significantly our results, since such distortions occur within miliseconds (Sala and Hernández-Cruz, 1990; Neher and Augustine, 1992; Sabatini and Regehr, 1998) while the time courses of the Ca2+ transients we recorded ranged from hundreds of miliseconds to minutes. Moreover, the time courses of these distortions are usually faster than our imaging sampling speed. For all these reasons, the Ca2+ kinetics we report seem accurate descriptions of the intracellular Ca2+ dynamics. It is relevant also to mention here that the kinetics of exocytosis were similar with and without injection of Ca2+ sensitive dye. This indicates that Fluo-4 is not producing significant changes in the Ca2+ or exocytosis dynamics. In this regard, somatic exocytosis in our experiments responded in the presence of high affinity dyes similarly to chromaffin cells loaded with Fura-2 (Augustine and Neher, 1992; Neher and Augustine, 1992; Chow et al., 1996; Klingauf and Neher, 1997), in which exocytosis also occurs from dense core vesicles and is slower than in synapses.
Fluorescence Imaging
For experiments using a single dye individual neurons were viewed at their soma equator with a Nikon Eclipse TE 200 inverted microscope through a Nikon 100X oil-immersion objective (NA 1.40). Fluorescence measurements of FM1-43 or Fluo-4 were performed with excitation and emission wavelengths at 488 and 535 nm respectively. A cooled CCD camera (IMAGO, Till Vision) acquired image sequences of 640 × 480 pixels. To study fast Fluo-4 fluorescence transients in response to the stimulation trains, images were acquired every 100 ms for 60 s. To follow FM styryl dye changes or the long-lasting Fluo-4 transients, separate images were acquired every 2 s for 15 min. The image sequences were stored digitally by using TILLvisION software.
For simultaneous recordings of exocytosis and Ca2+ signals, confocal imaging of FM4-64 and Fluo-4 fluorescence was carried out using an Olympus Fluoview FV1000 upright confocal scanning microscope using 473 nm for Fluo-4 excitation and 560 nm for FM4-64 excitation. For the simultaneous imaging fluorescence was acquired with a 60X water immersion objective (1.1 NA). Fluorescence was detected in parallel by a spectral-based detector capturing 503–543 nm for the Fluo-4 emission and 600–700 nm for the FM4-64 emission. Time-lapse sequences were made by acquiring an image every 2 s for 20 min. Images were stored digitally by using Fluoview 3.1 software (Olympus).
Image Analysis
We used Image-J software (National Institutes of Health) for most of the analysis. The time series of images were aligned with the StackReg plug-in. The mean fluorescence intensity was measured along time or space sequences from 1.8 to 2 μm2 regions of interest (ROIs) that contained a fluorescent spot. These areas were chosen because they correspond to the average area of a vesicle cluster (Trueta et al., 2003; De-Miguel et al., 2012). To calculate the fluorescence changes relative to the resting fluorescence, the average intensity in the 20 frames before stimulation (F0) was subtracted from the intensity of that ROI at each time [F(t)]. The difference was divided by F0, to generate ΔF/F0. For simplicity, throughout the text and figures this normalization is referred to as dF/F. Surface plots were made by using an RGB 8 bit color scale calibrated in the dynamic interval. Plotting and curve fitting were performed using Igor Pro 6.2 software (Wavemetrics). Data are presented as mean ± s.e.m. Statistical comparisons were performed using unpaired two tailed Student's t-test.
Pharmacology
To block L-type Ca2+ channels we used nimodipine (10 μM; Sigma-Aldrich); to eliminate Ca2+-induced Ca2+ release we used a combination of ryanodine (100 μM, Invitrogen) and thapsigargin (1.6 μM; Invitrogen). 5-HT receptors were blocked with methysergide (140 μM; Sigma-Aldrich) and to block PLC neurons were preincubated for 30 min with U-73122 (10 μM; Sigma-Aldrich). All drugs were applied to the bathing fluid from 500X stock solutions 15 min before images were taken, except for U-73122, which was added 30 min before.
Electron Microscopy
The general procedures were as in Trueta et al. (2012). In brief, neurons in isolated segmental ganglia were stimulated with 10 trains of 10 impulses at a frequency of 1 Hz delivered at 1 min intervals. Ganglia were then perfused with 0.08 M cacodylate buffer (pH 7.4; Sigma-Aldrich) and fixed for 60 min with 0.6% glutaraldehyde and 0.4% paraformaldehyde, followed by post-fixation for 60 min in 1.0% osmium tetroxide (Kuffler et al., 1987). Thin (70–100 nm) sections were observed in a JEOL 1010 electron microscope (JEOL USA Inc.). Electron micrographs were digitized at 1200 dpi in CMYK mode. For illustration purposes endoplasmic reticulum (ER) was pseudo-colored by using the fast selection and the color equilibrium tools of Photoshop (Adobe).
Results
Kinetics of Somatic Exocytosis and Intracellular Ca2+
Electrical stimulation of individual neurons with a 20-Hz train (Figure 1A, left) lasting 0.5 s produced somatic exocytosis for up to 400 s, as seen by the kinetics of the formation of fluorescent FM1-43 spots in the soma periphery (Figure 1B). Each spot was formed by the integrated fluorescence upon exocytosis from the vesicles in one cluster (De-Miguel et al., 2012). The fluorescence kinetics of 61% of the spots studied in 19 neurons had a sigmoidal shape (Figure 1C, light red traces). The rest of the spots displayed two and occasionally three sigmoidal fluorescence increases (Figure 1C, dark red), each of which was due to the fusion of a subsequent vesicle cluster. We have previously shown (De-Miguel et al., 2012) that the sigmoidal shape of the fluorescence kinetics has the following components: its latency is determined by the resting distance from the vesicle clusters to the plasma membrane and by the transport velocity of the vesicle cluster; the slope of the fluorescence increase expresses the rate of exocytosis; the plateau is reached upon the end of exocytosis, and the maximum fluorescence level is proportional to the cumulative number of vesicles that fused. As expected from our previous experience, stimulation with a 1-Hz train failed to produce a significant formation of FM1-43 fluorescence spots (Figure 1C, gray traces). Consistently, electron micrographs of neurons stimulated at this frequency showed the vesicle clusters at their resting positions (Supplementary Figure 1).
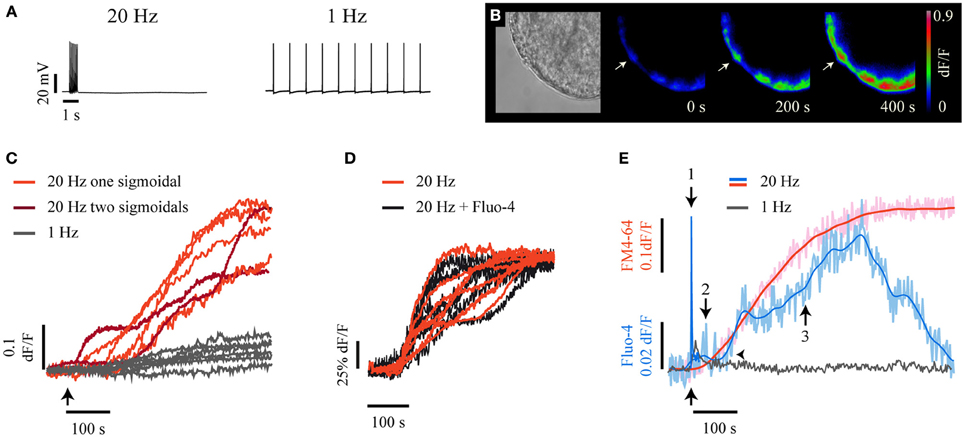
Figure 1. High frequency electrical stimulation evokes long-lasting somatic exocytosis and Ca2+ signals. (A) Intracellular recordings of trains of 10 impulses at 20 Hz (left) and 1 Hz (right) produced upon intracellular injection of current pulses. (B) Time course of FM1-43 fluorescence increases. On the left is a bright field equatorial image of a soma. Scale bar = 10 μm. The sequence on the right shows FM1-43 fluorescence increases at 200 and 400 s following 20-Hz electrical stimulation (time = 0 s). The arrow points to a well-delimited fluorescent spot of the sort used for our kinetic measurements. The color scale on the right indicates the fluorescence levels in arbitrary units. (C) Kinetics of FM1-43 fluorescence from six individual spots, each produced by a different neuron in response to 20-Hz stimulation. The arrow indicates the onset of stimulation. The light-red kinetics were described by one sigmoidal, while the two dark-red kinetics were described by two or three sigmoidal steps. The gray traces were obtained from equivalent membrane areas from six other neurons stimulated at 1 Hz. These neurons did not form fluorescent spots in response to electrical stimulation. (D) The kinetics of FM4-64 fluorescence upon 20 Hz stimulation were similar in neurons loaded with Fluo-4 (black traces) or in the absence of the Ca2+-sensitive dye (red traces). (E) Kinetics of simultaneously acquired FM4-64 (pink) and Fluo-4 (pale blue) confocal fluorescence following 20-Hz stimulation. The smoothed kinetics were superimposed in each case (red and blue traces). The Ca2+ transient started as a fast transient (1) immediately after the onset of stimulation (black arrow below the traces). The fast Ca2+ transient was followed first by a small Ca2+ transient (2) and afterwards by a large Ca2+ transient (3) that developed during exocytosis. The horizontal arrowhead shows that the large Ca2+ transient started after the onset of the FM4-64 increase that indicated the large-scale exocytosis. The large Ca2+ transient had its peak a few seconds before the end of exocytosis, seen as the plateau of the FM4-64 fluorescence kinetics. The gray trace is the Fluo-4 fluorescence in response to a 1-Hz train.
To explore how Ca2+ contributes to this large-scale somatic exocytosis, the kinetics of exocytosis and intracellular Ca2+ were measured simultaneously by imaging the fluorescence of FM4-64 and Fluo-4 dyes. A major concern of these measurements is that high affinity Ca2+ sensitive dyes may affect the intracellular free Ca2+ concentration and therefore exocytosis. However, as shown in Figure 1D, the kinetics of exocytosis in neurons injected with Fluo-4 was similar to that obtained from neurons imaged in its absence. The methods section contains an account of the precautions taken for the use of Ca2+ sensitive dyes to measure Ca2+ dynamics and exocytosis simultaneously. Moreover, as will be seen below, there was also good correlation between the kinetics of exocytosis and intracellular Ca2+ in pharmacological experiments.
Simultaneous confocal imaging of FM4-64 and Fluo-4 fluorescence from membrane areas that exhibited exocytosis in response to a 20-Hz train showed a complex relationship between exocytosis and Ca2+ (Figure 1E). A 20-Hz train produced a sequence of three Ca2+ transients, each of which could be unmistakably identified by its kinetics, its characteristic localization and its effect on exocytosis. The first Ca2+ transient was a fast spike coupled to the stimulation train (thus we will refer to it as fast Ca2+ transient; 1 in Figure 1E). This fast Ca2+ transient invaded rapidly the whole somatic cytoplasm (see Movie 1). The second Ca2+ transient was small and purely submembrane (we will refer to it as small Ca2+ transient). This small Ca2+ transient appeared between the peak of the large Ca2+ transient and the large-scale exocytosis (2 in Figure 1E). The third Ca2+ transient was large in amplitude and duration (therefore, we will refer to it as large Ca2+ transient). The large transient was also restricted to the submembrane shell (3 in Figure 1E), grew during the dynamic range of exocytosis and started to decay when exocytosis was near end. The small and the large Ca2+ transients were absent upon 1-Hz stimulation (Figure 1E, gray trace).
Frequency-Dependence of the Fast Ca2+ Transient
Although the fast Ca2+ transient ended before the onset of the large-scale exocytosis, the evidence presented before suggested that it coupled electrical stimulation with exocytosis. To understand this paradox we compared its characteristics with to those of the Ca2+ transient in response to a 1-Hz train, which does not evoke exocytosis (Figure 2). The fast Ca2+ transient upon 20-Hz stimulation started to develop right after the first impulse and peaked 600 ms later (Figures 2B,D, Movie 1), that is ~100 ms after the last impulse (note that these values are approximations due to our 100-ms imaging interval). The peak amplitude of the fast Ca2+ transient recorded by Fluo-4 in the submembrane shell was 804 ± 52% of the baseline fluorescence value and its decay was exponential (R2 > 0.90) with a time constant of 2.0 ± 0.2 s (n = 6 cells; Figure 2D). This kinetics was identical when recorded with Fluo-5F or Fluo-4, thus indicating that Fluo-4 did not saturate in these experimental conditions (Figure 2D). However, a major difference was that the fluorescence levels detected by Fluo-5F always returned to baseline levels without unveiling the small Ca2+ transient detected by Fluo-4 during the decay of the fast Ca2+ transient (Figure 2D, arrowhead). The fast Ca2+ transient arrived rapidly at the soma central region (25 μm away from the plasma membrane) in every neuron tested, where it also peaked by 600 ms (Figures 2B,D). However, at the center its peak amplitude was 54% of that in the submembrane shell. From then fluorescence returned exponentially to baseline levels (Figure 2D).
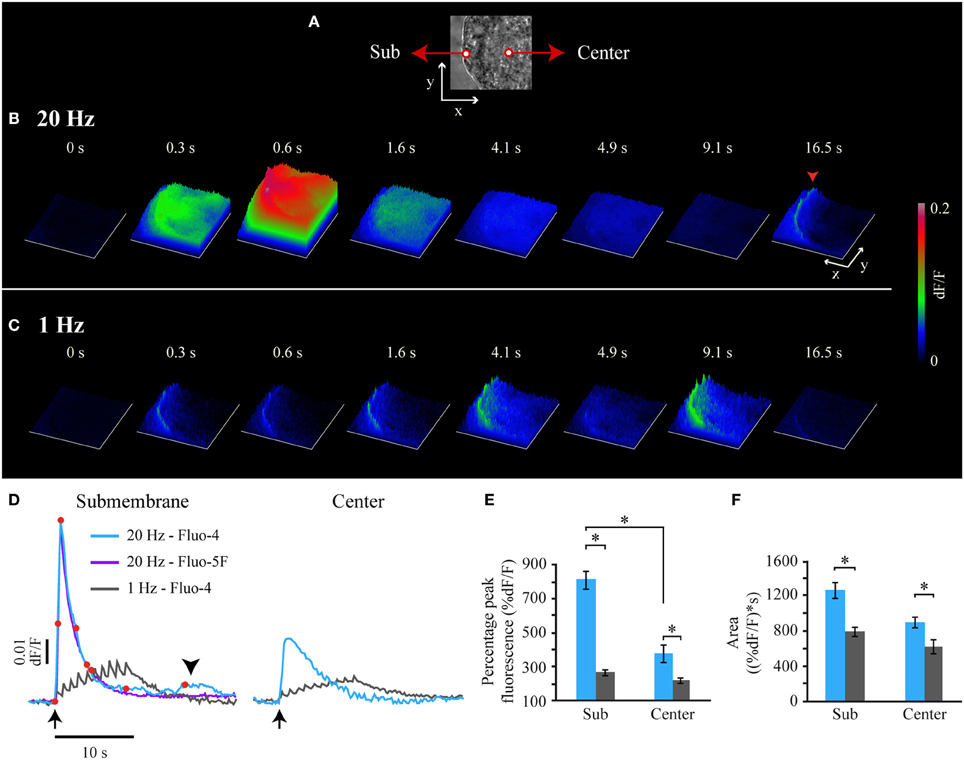
Figure 2. Frequency-dependence of the fast Ca2+ transient. (A) Bright field image of the soma from which the fluorescence surface plots in (B,C) were made. The x and y axis = 20 μm. (B) Sequence of Fluo-4 fluorescence surface plots obtained after 20-Hz stimulation at t = 0 s. The time is the same for (B,C) and corresponds to the time indicated by the red dots over the fast Ca2+transient upon 20 Hz stimulation shown in (D). The z axis is the fluorescence intensity in arbitrary units, according to the calibration on the right. At 0.6 s the fast Ca2+ transient had reached the soma center. A submembrane small Ca2+ transient appeared 16.5 s after the stimulation train (red arrowhead). See also the supplemental Movie 1. (C) Sequence of Fluo-4 fluorescence surface plots upon 1-Hz stimulation. This Ca2+ increases failed to invade the soma center. See also the supplemental Movie 2. (D) Superimposition of Fluo-4 and Fluo-5F fluorescence transients upon 20-Hz stimulation (blue and purple respectively). The arrow pointing up indicates the onset of stimulation. The fluorescence kinetics with both dyes were identical, indicating that Fluo-4 was not saturated. Note also that the small Ca2+ transients (arrowhead) were not detected by the low affinity Fluo-5F. A transient in response to 1-Hz (gray) stimulation in the submembrane (left) and central (right) regions was composed by 10 subsequent spikes, each synchronized to an action potential of the train. The transients produced by either stimulation frequency arrived attenuated at the soma center. (E) Normalized peak amplitude of the Ca2+ transients in response to 20-Hz (blue) and 1-Hz (gray) trains in the submembrane (Sub) and center areas of the soma (Center). The asterisks indicate significant differences (p < 0.05). (F) Integral values of the Ca2+ signals at either frequency in the submembrane and center areas. The larger integral of the transient upon 20-Hz stimulation indicates a supra-linear intracellular Ca2+ increase.
The Ca2+ transient produced by a 1-Hz train was different (Figures 2C,D; see Movie 2). In the submembrane shell of the soma this transient was a succession of 10 small Ca2+ spikes, with each coupled to an impulse of the train. The peaks of the individual spikes had a ~100 ms rise time (n = 6), again with the resolution limited by our 100 ms/image sampling rate. The temporal summation of the subsequent Ca2+ spikes produced that the maximal Fluo-4 fluorescence value (263 ± 15% of the baseline value) was reached after the last impulse of the train. The maximum fluorescence amplitude was only 33% of that of the fast Ca2+ transient upon 20-Hz stimulation. After the last spike of the 1 Hz train, fluorescence decayed exponentially with a time constant of 1.7 ± 0.3 s. This decay time was similar (p = 0.32) to that of the fast Ca2+ transient upon 20-Hz stimulation. At the soma center the maximal amplitude of the transient evoked by 1-Hz stimulation was 72% of that in the periphery.
That the amplitude of the Ca2+ transient evoked by 20-Hz stimulation was 67% larger than that obtained at 1-Hz (Figure 2E) suggested that it is the peak amplitude of the Ca2+ transient (which indicates the maximum Ca2+ concentration reached) what triggers exocytosis. Moreover, the amplitude of the transient evoked by 20-Hz stimulation was 38.5% larger than the sum of the peak amplitudes of the 10 Ca2+ spikes evoked by a 1-Hz train. Since transmembrane Ca2+ entry upon subsequent voltage steps does not facilitate in the soma of these neurons (Stewart et al., 1989), the supra-linear amplitude increase of the transient evoked at 20-Hz suggests that extracellular Ca2+ entry evokes intracellular Ca2+ release. Note that the transients produced by either stimulation frequency had the same decay time, thus indicating that the Ca2+ buffering in response to both stimulation frequencies was similar and operated within its dynamic range. In these conditions, the integral values of the transients over time provide a measure of the amount of the free Ca2+ during the transients regardless on the Ca2+ origin and kinetics. As seen in Figure 2F, the integral value of the transients evoked by 20-Hz stimulation was 27% larger than that evoked by 1-Hz stimulation. That the amplitude differences were much larger than the integral differences supports that it is the maximum Ca2+ concentration reached and not the amount of free Ca2+ what activates exocytosis. This data also supports the idea that Ca2+ entry upon 20 Hz stimulation evokes Ca2+-induced Ca2+ release.
Components of the Fast Ca2+ Transient and Their Contribution to Exocytosis
The pharmacological dissection of the components of the fast Ca2+ transient allowed us to understand its generation and spread, and provided us with tools to analyze how it evokes exocytosis. The fast Ca2+ transient had three components. The main component was a voltage-dependent L current, which was reduced by 75.1 ± 7.3% by the L-type Ca2+ channel blocker nimodipine (10 μM; Figures 3A,C). The same concentration of nimodipine produced a 75% reduction in the amount of somatic exocytosis, measured as the number of FM1-43 spots/soma in a different cell group (Trueta et al., 2003, see methods; n = 10; Figure 3D). This indicated that Ca2+ entry through L channels was the predominant source to trigger exocytosis. The 25% residual of the fast Ca2+ transient was insensitive to nimodipine at doses up to 80 μM, although was completely abolished when cadmium (200 μM) substituted Ca2+ in the external solution (not shown) to block transmembrane Ca2+ entry (Fernandez-De-Miguel et al., 1992). This experiment unveiled a second and yet unidentified transmembrane Ca2+ source. However, this remnant Ca2+ transient was unable to evoke exocytosis, since the 25% of fluorescent spots/soma counted in these conditions was in the range of the values counted after 1-Hz stimulation (20 ± 5%; n = 6), or after 20-Hz stimulation when Ca2+ had been replaced by magnesium in the external solution to prevent transmembrane Ca2+ entry (34 ± 8 %; n = 7; Figure 3D). Moreover, a 21% of spots/soma was produced in the absence of stimulation (n = 6).
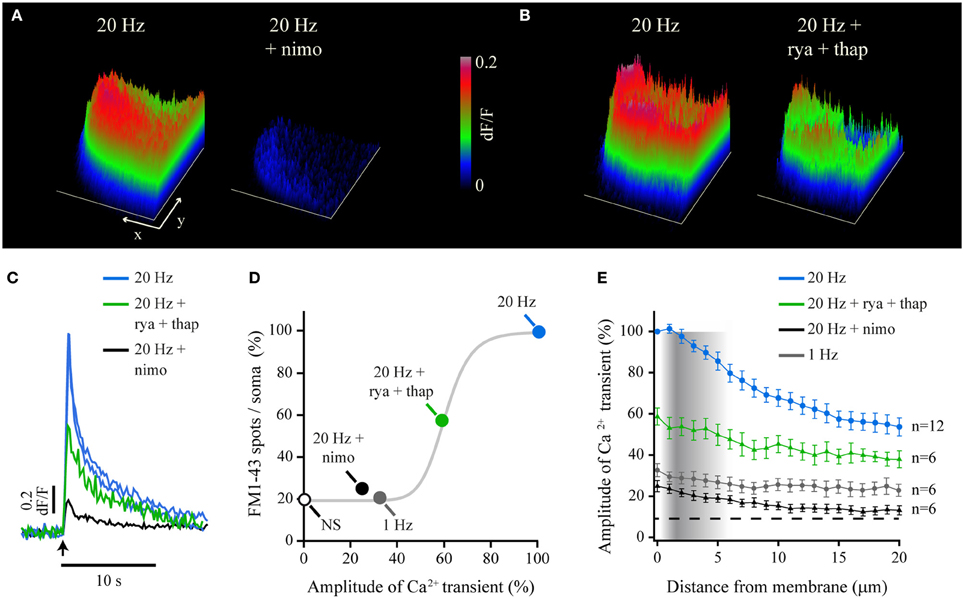
Figure 3. Transmembrane and intracellular Ca2+ produce the fast Ca2+ transient and exocytosis. (A) Surface plots of the peak Fluo-4 fluorescence upon 20-Hz stimulation before (left) and after (right) blockade of L-type Ca2+ channels with nimodipine (nimo). The x and y scale bars = 10 μm. The z-axis indicates the relative (dF/F) fluorescence levels as calibrated on the right bar (also applies for B). (B) Surface plots before (left) and after (right) blockade of Ca2+-induced Ca2+ release with a combination of ryanodine (rya) and thapsigargin (thap). (C) Superposition of the kinetics of representative Ca2+ transients recorded from the submembrane shell under the experimental conditions shown above. The blue traces are responses to control 20-Hz trains in the same neurons before addition of nimodipine (black trace) or the combination of ryanodine and thapsigargin (rya+thap respectively, green trace). The arrow indicates the onset of stimulation. (D) Percentage of exocytosis measured as the number of fluorescent FM1-43 spots/soma (Trueta et al., 2003, 2004), plotted as a function of the amplitude of the Ca2+ transient recorded under different experimental conditions and normalized to the amplitude of the transient produced by 20-Hz stimulation. The white dot indicates the number of spots/soma formed by non-stimulated neurons. The gray curve is a Hill sigmoidal function fitted to the data that empirically reproduces their trend. (E) Decay of the fast Ca2+ transient as it spreads toward the soma center. The density of the vertical gray bar is proportional to the density of vesicle clusters at rest, as measured from electron micrographs (data adapted from De-Miguel et al., 2012).
As predicted before, the third Ca2+ source contributing to the fast transient was Ca2+-induced Ca2+ release. Incubation of six neurons with 100 μM ryanodine and 1.6 μM thapsigargin reduced the amplitude of the fast Ca2+ transient by 41 ± 5.1% (Figures 3B,C). Ca2+-induced Ca2+ release also contributed to exocytosis since pre-incubation of 11 neurons with 100 μm ryanodine (Figure 3D) in our previous experiments (Trueta et al., 2004) reduced the number of FM1-43 spots/soma by 42%. Figure 3D shows the percentage of fluorescent FM1-43 spots/soma plotted vs. the percentage peak amplitude of the fast Ca2+ transient obtained in each experimental condition. The 100% values were those obtained upon 20-Hz stimulation (see Methods). The gray sigmoidal function in Figure 3D shows the trend of the data for illustration purposes. This function was fitted to the data owing to its similarities to the plot describing how the amount of exocytosis depends on the stimulation frequency (Trueta and De-Miguel, in preparation). These data confirm on one hand that the amount of exocytosis is determined by the amplitude of the fast Ca2+ transient. On the other hand data show that different Ca2+ sources cooperate to determine the number of vesicle clusters arriving at the plasma membrane.
A further explanation to how the fast Ca2+ transient determines the amount of vesicle clusters undergoing exocytosis came from how far the fast Ca2+ transient penetrates the cytoplasm. This is shown by plotting the average amplitude of the fast Ca2+ transients in different experimental conditions over the radial intracellular distance from the plasma membrane (Figure 3E). The plot is superimposed to the intracellular density of vesicle clusters at rest, as estimated from electron micrographs (De-Miguel et al., 2012). It may be seen that the amplitude of the fast Ca2+ transient decayed within the distance range in which the vesicle clusters accumulate at rest. Therefore, peripheral clusters receive a higher Ca2+ concentration than internal clusters. Since vesicle clusters establish tight bounds with mitochondria (De-Miguel et al., 2012), an attractive possibility is that the amount of vesicle clusters transported toward the plasma membrane depends on amplitude of the fast Ca2+ transient through the activation of mitochondrial ATP synthesis. By sensing a larger Ca2+ concentration the more peripheral clusters would receive more ATP for their transport.
The Small and the Large Submembrane Ca2+ Transients Sustain Exocytosis
Since the large-scale exocytosis starts after the end of the fast Ca2+ transient, we investigated the possibility that exocytosis is sustained by the small and the large Ca2+ transients. As mentioned before and shown in Figure 4A, both Ca2+ transients were purely submembrane in the seven neurons studied (see also Movie 1). Figure 4B shows the kinetics of simultaneously acquired Fluo-4 and FM4-64 fluorescence. The two sigmoidal increases in the FM4-64 fluorescence correlate with the development of two Ca2+ transients. However, they were not produced by a transmembrane Ca2+ flow, since our voltage clamp records during exocytosis lacked any transmembrane currents (Figure 4C).
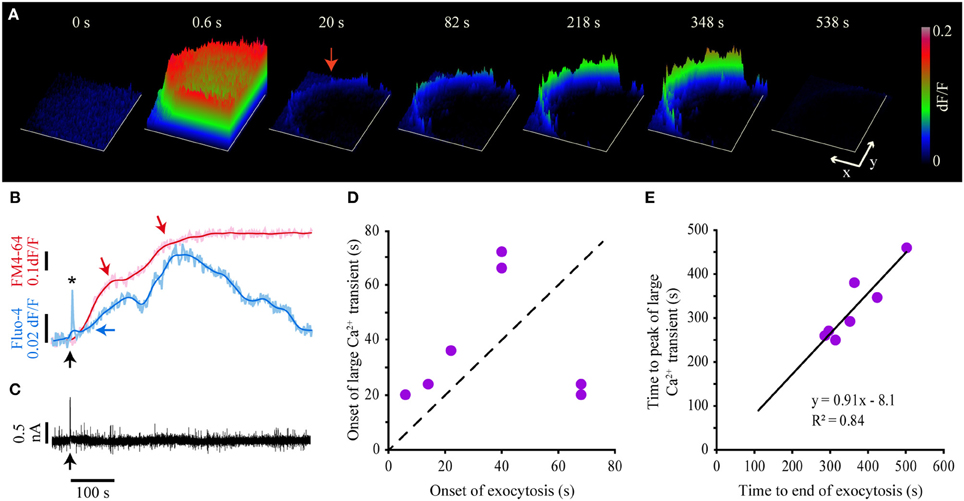
Figure 4. Kinetics of the large Ca2+ transient and exocytosis. (A) Sequence of surface plots of the Fluo-4 fluorescence in response to a 20-Hz train. The onset of the train was at t = 0. The frame at 0.6 s shows the peak of the fast Ca2+ transient; the frame at 20 s shows the small Ca2+ transient, and the subsequent frames show the development of the large Ca2+ transient. Note that the fluorescence increases were limited to the submembrane region of the soma. The x and y scale bars = 10 μm. The z-axis indicates the relative (dF/F) fluorescence levels as calibrated on the right bar. (B) Kinetics of simultaneously acquired FM4-64 (pink) and Fluo-4 (pale blue) confocal fluorescence following 20-Hz stimulation. The black arrow indicates the onset of the 20-Hz train. The kinetics of exocytosis had two sigmoidal components, each pointed by a red arrow. The smoothed kinetics (red and blue) are superimposed to each trace. The amplitude of the fast Ca2+ transient (asterisk) is truncated due to the 0.5-Hz imaging acquisition frequency. The Fluo-4 large transient started to rise after the onset of the FM4-64 increase (horizontal blue arrow) and developed two peaks, each of which matched with each plateau of the FM4-64 fluorescence kinetics. (C) The transmembrane current during the large Ca2+ transient remained constant after 20-Hz stimulation, thus eliminating the possibility that the large Ca2+ transient was produced by transmembrane Ca2+ entry. The arrow indicates the onset of the 20-Hz train. (D) The large Ca2+ transient appeared after the onset of the large-scale exocytosis, as seen by the points above the dashed identity bar. This relationship was inverted in two neurons with long exocytosis latencies (~70 s). (E) The peak of the large Ca2+ transient was reached 8 s before the end of exocytosis, as shown by the negative y-intercept of the linear relationship in the plot. The parameters of the fit are shown in the plot.
The small Ca2+ transient could be detected 6.6–24.0 s after the onset of the train (Figure 2D, arrowhead). By contrast, the large Ca2+ transient (Figures 4A,B) was only detected 14–35 s after the onset of the large-scale exocytosis (determined as the threshold for the FM4-64 fluorescence increase) in five out of seven neurons; that is 21–72 s after the onset of the stimulation train (Figure 4D). In two other neurons in which the onset of exocytosis had a longer latency (>68 s), the large Ca2+ transient anticipated exocytosis. However, in every neuron tested the large Ca2+ transient grew during the dynamic range of exocytosis to reach peak fluorescence levels 638–992% above the baseline. The decay of the transient started 8 s before the end of exocytosis, when its rate had started to decline (Figures 4B,E). This value was calculated from the y-intercept of the line that fitted the time to peak of the large Ca2+ transient vs. the duration of exocytosis (Figure 4E). The small and the large submembrane Ca2+ transients were smaller and had a slower time course in submembrane segments that failed to develop FM4-64 fluorescent spots, thus suggesting that the intracellular Ca2+ had diffused from active exocytosis sites. These observations suggested that both submembrane Ca2+ transients received an input from exocytosis.
5-HT Release and Phospholipase C Activation Produced the Submembrane Ca2+ Transients and Exocytosis
To explore if the small and the large submembrane Ca2+ transients were produced by 5-HT released upon exocytosis, neurons were stimulated with a 20-Hz train in the presence of methysergide (140 μM), an unspecific blocker of metabotropic 5-HT inverterbrate receptors. Methysergide abolished both submembrane Ca2+ transients without affecting the fast Ca2+ transient in the six neurons stimulated at 20 Hz (Figure 5A). In six other stimulated neurons methysergide abolished exocytosis (Figure 5B). These results indicated that 5-HT exocytosis activates autoreceptors, which then produce the submembrane Ca2+ transients that evoke more exocytosis. Consistently, iontophoretic applications of 5-HT to the soma surface produced a Fluo-4 fluorescence increase in the submembrane area adjacent to the iontophoretic pipette (Supplementary Figure 2). By contrast, a bath perfusion with 1 μM 5-HT, a concentration that in our hands produces several physiological effects without evoking action potentials in Retzius neurons (Sarkar et al., 2014), failed to evoke any exocytosis (n=6 neurons). These results suggest that the 5-HT-evoked submembrane Ca2+ transients sustain the large-scale somatic exocytosis, but the fast Ca2+ transient is required as a trigger.
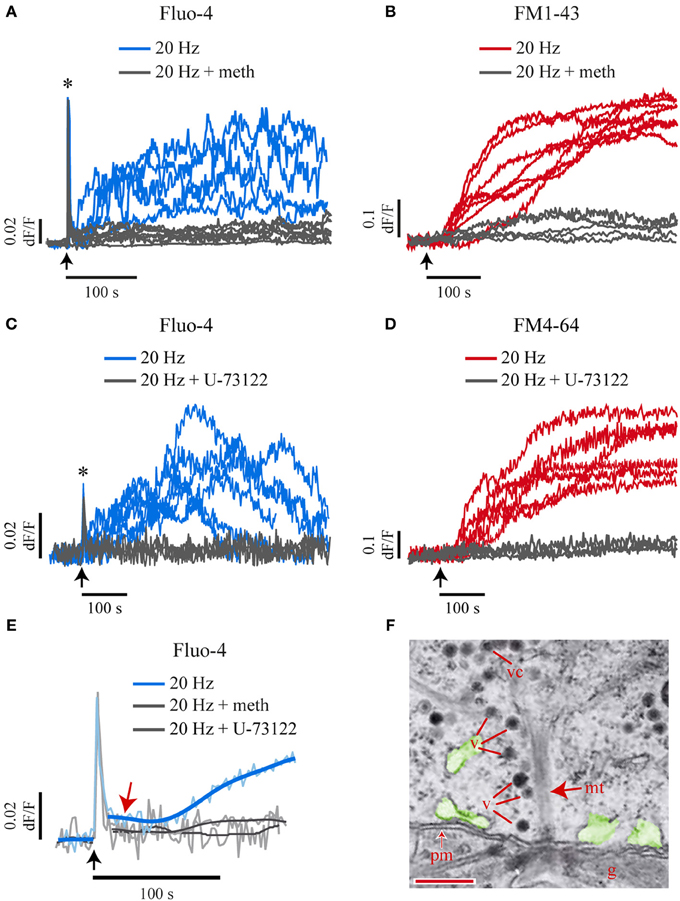
Figure 5. Extracellular 5-HT and PLC activation produce the small and the large Ca2+ transients and exocytosis. (A) Kinetics of Fluo-4 fluorescence in response to a 20-Hz train in the absence (blue traces) or presence (gray traces) of methysergide (140 μM) to block the activation of 5-HT receptors. This treatment abolished the large Ca2+ transient (n = 6) without affecting the fast Ca2+ transient (see asterisk). The arrows indicate the onset of stimulation. (B) Methysergide abolished the FM1-43 fluorescence increases in the six neurons tested (gray traces). The kinetics shown in red were obtained from other neurons in the absence of methysergide. (C,D) Blockade of PLC with U-73122 (10 μm) abolished the submembrane Fluo-4 (C) and FM4-64 (D) fluorescence increases in response to 20-Hz stimulation (gray traces) without affecting the fast Ca2+ transient (which appears truncated due to the 0.5-Hz imaging sampling rate; asterisk). Exocytosis and Ca2+ increases were measured simultaneously under confocal conditions. (E) Blockade of 5-HT receptors or PLC (gray traces) also abolished the small Ca2+ transient (blue trace, red arrow). The pale blue traces are an average of the Ca2+ kinetics obtained from seven neurons. Smoothed traces are superimposed in darker blue. (F) Electronmicrograph showing dense core vesicles (v) aligned to the microtubule bundles (mt) arriving at the plasma membrane (pm) of a soma that was fixed after 1-Hz stimulation. Exocytosis from these vesicles may release the 5-HT that produces the small Ca2+ transient. The endoplasmic reticulum, possible intracellular Ca2+ source is pseudocolored in green. The glia is marked as “g.” Scale bar = 200 nm.
We next investigated the mechanism by which the released 5-HT activates the small and the large submembrane Ca2+ transients. Although other experiments made in these neurons have shown brief transmembrane currents in response to 5-HT pulses (Lessmann and Dietzel, 1991; Beck et al., 2002), the lack of transmembrane currents in our records during the large scale 5-HT exocytosis (Figure 4C) suggested that both submembrane Ca2+ transients were produced by intracellular Ca2+ release. Extrasynaptic 5-HT2 receptors in Retzius neurons are coupled to phospholipase C (PLC) (Drapeau et al., 1989; Sanchez-Armass et al., 1991), which produces inositol 1,4,5-triphosphate (IP3) and intracellular Ca2+ release (Pozzan et al., 1994; Pandey et al., 1995; Barnes and Sharp, 1999). This pathway was then explored as the possible origin of the submembrane Ca2+ transients by blocking the activation of PLC with U-73122 (10 μM; Jin et al., 1994). In simultaneous confocal imaging of FM4-64 and Fluo-4 fluorescence (n = 7 neurons) this manipulation abolished both submembrane Ca2+ transients and exocytosis upon 20-Hz stimulation. However, the fast Ca2+ transient remained intact (Figures 5C–E).
These results provided two lines of information. On one hand, they confirmed that 5-HT binding to autoreceptors activates PLC and intracellular Ca2+ release. On the other hand, they gave evidence that the small Ca2+ transient is also evoked by the release of small amounts of 5-HT which in our experimental conditions were undetectable as FM dye fluorescence increases. This hypothesis was supported by the presence of vesicles aligned to microtubules that linked vesicle clusters with the plasma membrane. These observations came from 16 electron micrographs obtained from five neurons fixed at rest or after 1-Hz stimulation (Figure 5F, see also Supplementary Figure 1). Therefore, we suppose that an early exocytosis from these vesicles in response to the fast calcium transient produces the small Ca2+ transient while the vesicle clusters arrive at the plasma membrane.
Somatic Exocytosis is Sustained by a Ca2+- and 5-HT-Dependent Positive Feedback Loop
A formal documentation that somatic 5-HT exocytosis is maintained by a positive feedback loop came from plotting the rate of exocytosis (the differential of the FM4-64 fluorescence over time Figures 6A′–C′) vs. the intracellular Ca2+ concentration (the Fluo-4 fluorescence over time). The cyclic shape of the plots shown in Figure 6 is characteristic of a bistable system in a dynamic state, sustained by a positive feedback loop (Gardner et al., 2000; Becskei, 2001; Qu and Vondriska, 2009). A 20 Hz train switches the system from a resting “off-state” (green traces in Figures 6A″,B″) to a dynamic exocytosis “on-state” (purple traces in Figure 6A″) by triggering transmembrane Ca2+ entry and exocytosis. The feedback loop operates during the on-state, when the released 5-HT produces the submembrane Ca2+ transients and these transients evoke more exocytosis. The intracellular Ca2+ concentration declines when exocytosis fades out, and the feedback loop ends upon exocytosis from the last vesicles in the cluster (letters “c” and “c'” Figure 6). The system goes back to the off-state (letters “d” in Figure 6) when the Ca2+ concentration returns to its basal level (gray interval between “c” and “d” in Figures 6A″,B″).
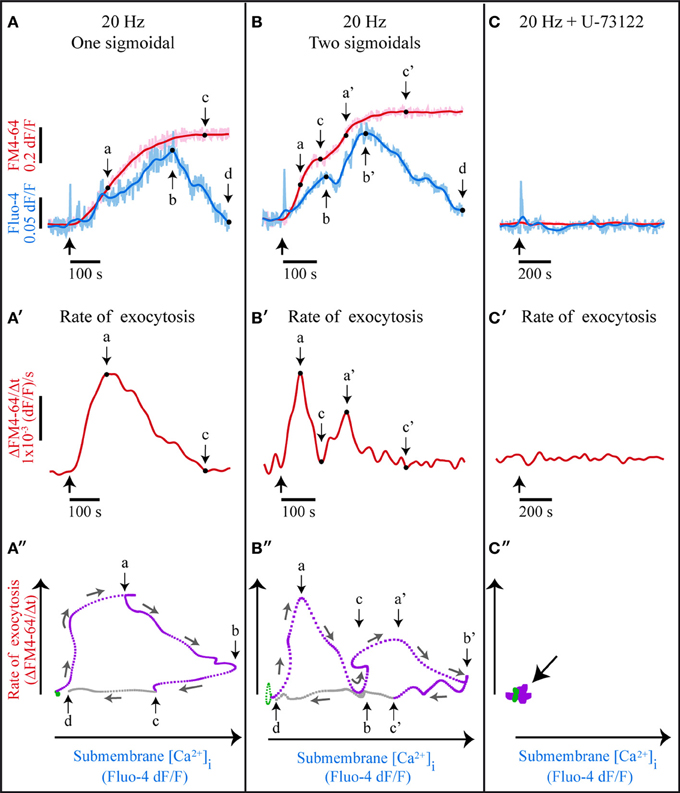
Figure 6. A bistable system with a positive feedback loop sustains somatic exocytosis. (A) Kinetics of simultaneously acquired Fluo-4 (pale blue) and FM4-64 (pink) confocal fluorescence in response to 20-Hz stimulation. The smoothed kinetics are superimposed (dark blue and red traces, respectively). The thick black arrow indicates the stimulation onset; “a” indicates the maximal rate of exocytosis, as estimated from the differential of the kinetics shown in (A′); “b” is the peak of the large Ca2+ transient; “c” is the end of exocytosis, when the differential value of the FM4-64 dye fluorescence is zero (see A′); “d” indicates the end of the large Ca2+ transient. (B) Exocytosis and Ca2+ kinetics displaying two sigmoidal increases upon subsequent exocytosis from two vesicle clusters. The large Ca2+ transient also displays two peaks. “a'–c'” are as in (A), although applied to the second sigmoidal kinetics. (C) In the presence of U-73122 only the fast Fluo-4 transient persisted. (A′–C′) Rates of exocytosis obtained from the differential of FM4-64 fluorescence kinetics of the data above. (B′) The rate of exocytosis displays two peaks, each indicating exocytosis from one vesicle cluster. In (C′) the rate of exocytosis was zero. (A″–C″) Rate of exocytosis plotted vs. the peak Ca2+ concentration. (A″) At rest the cells are in an off-state (green) and upon electrical stimulation they transit to a dynamic on-state (purple). The small arrows indicate the time course of the sequence. The feedback loop is active as long as 5-HT is released (from the origin of the purple line to point “c”). When Ca2+ returns to its basal levels (point “d”) the system returns to the off-state. (B″) The rate of exocytosis as a function of the Ca2+ concentration also displays two subsequent cycles. (C″) blockade of PLC stops the transition from the off to the on-state.
Those FM4-64 fluorescent spots that displayed a second sigmoidal kinetics also described a second submembrane Ca2+ peak (Figure 6B) and a second dynamic cycle in the plots (Figure 6B″). The new cycle expressed a new activation of the feedback loop, thus being consistent with the evidence on the fusion of vesicles arriving in a second cluster (De-Miguel et al., 2012). Note in Figure 6B″ that the second cycle started in the absence of new electrical stimulation, when the submembrane Ca2+ concentration was still high and the system remained in the on-state. As expected, when the 5-HT receptors or PLC were blocked (Figures 6C–C″) the system could not transit from the off- to the on-state.
Discussion
We have shown that a brief stimulation with 10 impulses at 20 Hz produces a fast Ca2+ transient that triggers exocytosis and determines its magnitude. The delayed large-scale exocytosis is then maintained through a positive feedback loop in which the released 5-HT activates 5-HT2 autoreceptors coupled to PLC. This produces a submembrane Ca2+ elevation that triggers more exocytosis. The feedback loop ends upon fusion of the last vesicles in the clusters that arrived at the plasma membrane in response to stimulation. The detailed steps of somatic 5-HT exocytosis shown in this study and complemented with data from our previous work (Trueta et al., 2003, 2004; De-Miguel et al., 2012; Trueta et al., 2012) are summarized in Figure 7.
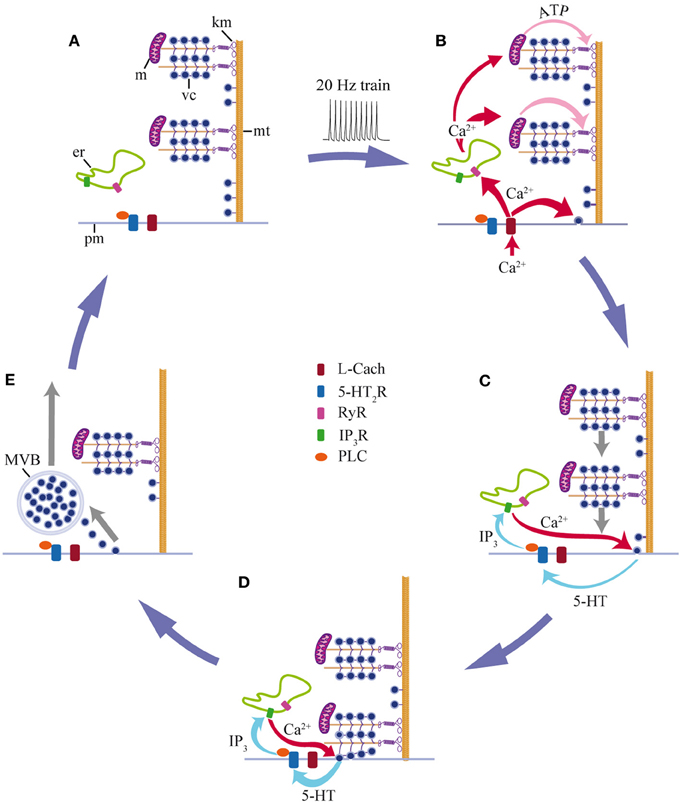
Figure 7. Schematic representation of the mechanism for somatic 5-HT exocytosis by Retzius neurons. (A) At rest, vesicle clusters (vc) and mitochondria (m) are distant from the plasma membrane. Both are attached to microtubules (mt) that arrive at the plasma membrane (pm). Endoplasmic reticulum (er) rests between the plasma membrane and the vesicle clusters. (B) A train of impulses evokes transmembrane Ca2+ entry through L-type channels (L Cach). Ca2+ triggers exocytosis from vesicles that are close to the plasma membrane and in parallel, Ca2+ entry activates ryanodine receptors (RyR) and Ca2+-induced Ca2+ release, presumably from endoplasmic reticulum. The fast Ca2+ transient reaches the mitochondria (m), which responds by producing ATP. Kinesin motors (km) become activated. (C) Vesicle clusters are transported toward the plasma membrane. The peripheral vesicle clusters and mitochondria receive more Ca2+ and ATP than the central clusters. Therefore, they are transported more efficiently toward the plasma membrane. As vesicles arrive at the plasma membrane and fuse, the released 5-HT activates 5HT2 receptors (5HT2R) and triggers an intracellular cascade. PLC activation induces IP3 production; IP3 acts on its receptors (IP3R) and activates intracellular Ca2+ release from the submembrane endoplasmic reticulum (ER). This Ca2+ evokes more exocytosis, thus closing the local feedback loop. (D) Arrival of the vesicle clusters at the plasma membrane gives place to the large-scale exocytosis. (E) Exocytosis and the feedback loop end when the last vesicles in the cluster fuse. Endocytosis produces multivesicular bodies (MVB) that are transported back to perinuclear regions of the soma (adapted from Trueta et al., 2012). The Ca2+ levels return to rest and the system goes back to its off-state (A). Data from this study are complemented with data from De-Miguel et al., (2012); Trueta et al., (2012).
Multiplicity of Ca2+ Effects on Somatic Exocytosis
Summation of Ca2+ entering across the plasma membrane may explain how the stimulation frequency determines the amount of intracellular Ca2+ and exocytosis. The slow inactivation of L-type channels supports a continuous Ca2+ entry throughout the stimulation train (Nowycky et al., 1985; Fox et al., 1987; Tsien et al., 1988). Since the amplitude of the L-type Ca2+ currents in Retzius neurons remains similar along subsequent impulses (Ross et al., 1987; Stewart et al., 1989), a temporal summation of the Ca2+ entering the soma upon the successive 20-Hz impulses may produce a rapid and large increase in the Ca2+ concentration as the stimulation frequency is increased. This summation along with the wide sensitivity to Ca2+ of the ryanodine receptors, which increase their opening probability sigmoidally at [Ca2+] between 0.1 and 100 μm (Bezprozvanny et al., 1991), explains why increasing the stimulation frequency activates Ca2+-induced Ca2+ release. A similar combination of transmembrane Ca2+ entry and Ca2+-induced Ca2+ release produces dendrosomatic exocytosis in hypothalamic neurons releasing oxytocin (Ludwig et al., 2002; Tobin et al., 2011, 2012) and in substantia nigra neurons releasing dopamine (Patel et al., 2009), thus suggesting that a similar mechanism operates in those neurons.
Somatic exocytosis in Retzius neurons depends on a microtubule-based vesicle transport (De-Miguel et al., 2012). Indirect evidence suggests a that a similar phenomenon occurs in other neuron types (Jaffe et al., 1998; Puopolo et al., 2001; Huang et al., 2007; Zhang et al., 2007; Hirasawa et al., 2009; Sarkar et al., 2012). This transport is mediated by molecular motors and therefore somatic exocytosis depends indirectly on ATP synthesis (Bi et al., 1997; Visscher et al., 1999). Ca2+-induced Ca2+ release may then determine the amount of vesicle clusters transported and fused by increasing the intracellular Ca2+ concentration to levels that activate mitochondrial ATP synthesis (Hansford, 1994; Balaban, 2002; Gunter et al., 2004; Satrústegui et al., 2007). In chromaffin cells depolarization and Ca2+ entry also produce the active transport of dense core vesicles before their fusion (Oheim and Stühmer, 2000; Becherer et al., 2003). Also in chromaffin cells dense core vesicles are important sources for Ca2+-induced Ca2+ release (Mitchell et al., 2001; Moreno et al., 2005; Yoo, 2010). However, our results do not support a similar vesicular Ca2+ release in Retzius neurons, since the amplitude of the fast Ca2+ transient in the regions heavily populated with vesicle clusters continues to decay monotonically on its way toward the soma center. As a consequence of the Ca2+ concentration decay as the transient spreads, the peripheral assemblies of mitochondria and vesicle clusters receive more Ca2+ than their equivalents resting more internally. Therefore, the molecular motors associated to these external vesicle clusters would receive more newly-synthesized ATP and therefore, they would be more efficiently transported towards the plasma membrane than those clusters resting internally. In this way the number of vesicle clusters transported and fused may be proportional to the amplitude of the fast Ca2+ transient.
The Beginning and End of Somatic Exocytosis
Somatic exocytosis starts when the fast Ca2+ transient triggers exocytosis from small numbers of vesicles resting near the plasma membrane. This exocytosis triggers the feedback loop. A delayed arrival of vesicle clusters at the “activated” release regions produces the large-scale exocytosis by increasing the magnitude of the feedback loop. Therefore, the small and the large Ca2+ transients are expressions of the same phenomenon, namely the 5-HT-and Ca2+-dependent feedback loop that sustains exocytosis. The strict submembrane localization of these Ca2+ transients allows a continuous exocytosis without triggering any further vesicle transport from internal regions. The localization of these transients correlates with the presence of large bags of endoplasmic reticulum near the plasma membrane in electron micrographs. The function of such highly regulated and localized Ca2+ increase prevents a depletion of the somatic 5-HT pool by preventing further activation of vesicle transport from internal somatic regions. However, we have shown that in some cases, a second round of exocytosis occurred in the absence of additional electrical stimulation, provided that the large submembrane Ca2+ transient had not ended. This suggests that a single 20 Hz train also induces the transport of more distal clusters by the same microtubule rails. In these vesicle clusters approach but do not always reach the plasma membrane, they would constitute the future releasable pool in response to a new train of impulses.
It is interesting that each vesicle cluster functions as an “exocytosis unit” with all its vesicles releasing their content once exocytosis it is triggered, since it allows the all-or-none release of large amounts of 5-HT over long periods. Moreover, exocytosis from the last vesicles in the cluster confers an end to the large-scale exocytosis and to the large Ca2+ transient. A similar phenomenon may occur in the soma of raphe and substancia nigra neurons, in which depolarization induces exocytosis from structures with diameters similar to those of the vesicle clusters of Retzius neurons and also with a similar time course (Sarkar et al., 2012, 2014).
Integration of a Feedback System to Regulate Somatic Exocytosis
Positive feedback loops constitute dynamic bistable systems which allow a brief stimulus (such as the 20-Hz trains used here) to produce a robust response that may persist over long periods in the absence of any further stimulation (Qu and Vondriska, 2009). At the cellular level positive feedback loops contribute to the regulation of intracellular messenger cascades (Gardner et al., 2000; Xiong and Ferrell, 2003; Qu and Vondriska, 2009), the release of hormones (Sabatier et al., 2003; Wintermantel et al., 2006) and cell-to-cell communication in the retina (Jackman et al., 2011). The mechanism presented here is strikingly sophisticated, since it involves multiple steps, the contribution of different intracellular organelles, three Ca2+ sources and events occurring inside and outside the soma. This may be a mechanism of general significance in biology, since in neuroepithelial body cells of rodents; hypoxia produces a 5-HT- and Ca2+-dependent increase in 5-HT release (Fu et al., 2002). Moreover, in dendrites of hypothalamic neurons the activation of dendritic oxytocin autoreceptors elevates the intracellular Ca2+ concentration and triggers exocytosis from dense core vesicles (Lambert et al., 1994; Neumann et al., 1996; Ludwig and Leng, 2006).
Physiological Importance of Somatic Exocytosis for Serotonergic Systems
The 5-HT modulation of circuits and behaviors along phylogeny requires large amounts of transmitter molecules acting at different levels of the nervous system (Saller and Stricker, 1976; Willard, 1981; Lent, 1985; Raleigh et al., 1991; Gillette et al., 1993; Barnes and Jacklet, 1997; Hull et al., 1999; Kravitz, 2000; Prosser, 2003; Alekseyenko et al., 2010; Tomioka et al., 2012). Somatic exocytosis seems particularly well fitted for this function. In the leech, electrical stimulation of Retzius neurons with high-frequency trains of impulses increases the levels of extracellular 5-HT in the ganglion and in the blood (Willard, 1981). This stimulation also produces a non-synaptic 5-HT activation of the swimming circuit (Nusbaum and Kristan, 1986), thus suggesting that it occurs in response to somatic and maybe axonal 5-HT release. In mammals, serotonergic neurons innervate most of the central nervous system (Jacobs and Azmitia, 1992) and 5-HT is released through somatic and dendritic exocytosis (De Kock et al., 2006; Kaushalya et al., 2008; Colgan et al., 2009, 2012; Sarkar et al., 2012). This release in addition to the small numbers of presynaptic terminals formed by serotonergic neurons (Mosko et al., 1977; Héry and Ternaux, 1981; Chazal and Ralston, 1987; Marlier et al., 1991; Ridet et al., 1993; Moukhles et al., 1997) suggests that somatic and in general extrasynaptic exocytosis is a major player of 5-HT communication (Agnati et al., 1986; De-Miguel and Fuxe, 2012; Fuxe et al., 2012; Trueta and De-Miguel, 2012). It was already mentioned that the soma of raphe neurons releases 5-HT for long periods from structures that may be similar to the clusters shown here (Kaushalya et al., 2008; Sarkar et al., 2012). In addition, the dendrites and axons of these neurons contain clear and dense core vesicles in arrangements suitable to produce extrasynaptic exocytosis (Kapadia et al., 1985; Liposits et al., 1985; Chazal and Ralston, 1987; Ridet et al., 1993; Van Bockstaele and Pickel, 1993; Bunin and Wightman, 1999; Descarries and Mechawar, 2000). Moreover, in these neurons the activation of L-type channels evokes dendritic exocytosis (Colgan et al., 2012). These evidences suggest that the mechanism shown here may also operate at smaller volume- and time-scales in dendrites and axons of mammalian serotonergic neurons. Such idea is consistent with the 5 s latency of 5-HT extracellular increases upon dendro-somatic stimulation in rat brain slices (Bunin and Wightman, 1998).
It is interesting to note that 5-HT autoreceptors are typically inhibitory and belong to the 5-HT1type (for review see Barnes and Sharp, 1999). However, the autoreceptors involved in the positive feedback system shown here are of the 5-HT2-type, according to their pharmacological profile and intracellular metabolic cascade (Drapeau et al., 1989; Sanchez-Armass et al., 1991; Barnes and Sharp, 1999). The incorporation of this type of receptor may be an adaptation of somatic exocytosis, since presynaptic terminals formed by Retzius neurons contain the characteristic 5-HT1 type receptors that inhibit electrical activity and transmitter release (Cercós et al., 2009), similar to their function in mammals (Chaput et al., 1986; Trulson and Frederickson, 1987; O'Connor and Kruk, 1991; Fornal et al., 1994).
Two additional aspects are worth discussing. One is that the decay time course of the large submembrane Ca2+ transient may be due, at least in part, to the removal of 5-HT from the extracellular space. The other is that 5-HT release in the intact nervous system occurs onto the extracellular space which is tightly surrounded by a giant glial cell (Coggeshall and Fawcett, 1964; Kuffler and Nicholls, 1966; see also Supplementary Figure 1). Since this glial cell has 5-HT an uptake system (Bruns et al., 1993), it may contribute to the 5-HT removal from the extracellular space. Therefore, these transporters may modulate the duration of exocytosis. On the other hand, the virtual isolation of the soma of the Retzius neuron by the glial sheets suggests that the 5-HT uptake participates in the distribution of 5-HT to other sites of the nervous system.
General Significance
Somatic exocytosis is a widespread mechanism for paracrine communication in the nervous system (De-Miguel and Fuxe, 2012; Fuxe et al., 2012; Trueta and De-Miguel, 2012), and evidence suggests that transmitters released in this way modulate the activity of neurons, glia and blood vessels (Fuxe et al., 1988; Descarries and Mechawar, 2000; Jansson et al., 2001; Del Arco et al., 2003; Fuxe et al., 2010; Thyssen et al., 2010; De-Miguel and Fuxe, 2012). The similar duration of somatic exocytosis in several neuron types (De-Miguel and Fuxe, 2012; Trueta and De-Miguel, 2012) suggest that somatic exocytosis it is ruled by a similar mechanism. Therefore, the findings presented here may be of general interest to explain the cellular basis of paracrine communication in the nervous system.
Author Contributions
The author(s) have made the following declarations about their contributions: Carolina Leon-Pinzon and Francisco F. De-Miguel conceived and designed the experiments. Carolina Leon-Pinzon, Montserrat G. Cercós, Paula Noguez and FFM performed the experiments. Carolina Leon-Pinzon, Montserrat G. Cercós, Citlali Trueta and Francisco F. De-Miguel analyzed the data. Francisco F. De-Miguel and Citlali Trueta contributed reagents/materials/analysis tools. Francisco F. De-Miguel and Carolina Leon-Pinzon wrote the paper.
Conflict of Interest Statement
The authors declare that the research was conducted in the absence of any commercial or financial relationships that could be construed as a potential conflict of interest.
Acknowledgments
We wish to express our gratitude to Mr. Bruno Mendez for his invaluable technical help in different stages of these investigations and to Sara Flores González for excellent assistance in the animal care. We also wish to acknowledge the electron microscopy and computer units of IFC-UNAM, in particular Dr. Fernando García Hernández, Rodolfo Paredes and Francisco Pérez, for their outstanding technical support. Ricardo Cruz Garduño gave invaluable graphic assistance to Figure 7. Professor David Weisblat made important comments to the manuscript. This work was founded by a DGAPA-UNAM grant IN200914 and a CONACYT GRANT 130031 to Francisco F. De-Miguel. Carolina Leon-Pinzon was supported by a CONACyT doctoral fellowship 230099, a CONACyT fellowship from grant 130031 and a by a DGAPA-UNAM fellowship from grant IN211511 and IN200914 to Francisco F. De-Miguel. Montserrat G. Cercós was supported by CONACyT doctoral fellowship 220728 and Paula Noguez was supported by CONACyT doctoral fellowship 193987. This paper is part of the Ph.D. thesis of Carolina Leon-Pinzon who is ascribed to the Doctorado en Ciencias Biomédicas of Universidad Nacional Autónoma de México (UNAM). The funders had no role in study design, data collection and analysis, decision to publish, or preparation of the manuscript.
Supplementary Material
The Supplementary Material for this article can be found online at: http://www.frontiersin.org/journal/10.3389/fncel.2014.00169/abstract
References
Agnati, L. F., Fuxe, K., Zoli, M., Ozini, I., Toffano, G., and Ferraguti, F. (1986). A correlation analysis of the regional distribution of central enkephalin and beta-endorphin immunoreactive terminals and of opiate receptors in adult and old male rats. Evidence for the existence of two main types of communication in the central nervous system: the volume transmission and the wiring transmission. Acta Physiol. Scand. 128, 201–207. doi: 10.1111/j.1748-1716.1986.tb07967.x
Alekseyenko, O. V., Lee, C., and Kravitz, E. A. (2010). Targeted manipulation of serotonergic neurotransmission affects the escalation of aggression in adult male Drosophila melanogaster. PLoS ONE 5:e10806. doi: 10.1371/journal.pone.0010806
Augustine, G. J., and Neher, E. (1992). Calcium requirements for secretion in bovine chromaffin cells. J. Physiol. 450, 247–271.
Balaban, R. S. (2002). Cardiac energy metabolism homeostasis: role of cytosolic calcium. J. Mol. Cell. Cardiol. 34, 1259–1271. doi: 10.1016/S0022-2828(02)92082-1
Barnes, N. M., and Sharp, T. (1999). A review of central 5-HT receptors and their function. Neuropharmacology 38, 1083–1152. doi: 10.1016/S0028-3908(99)00010-6
Barnes, S., and Jacklet, J. W. (1997). Ionic currents of isolated retinal pacemaker neurons: projected daily phase differences and selective enhancement by a phase-shifting neurotransmitter. J. Neurophysiol. 77, 3075–3084.
Becherer, U., Moser, T., Stühmer, W., and Oheim, M. (2003). Calcium regulates exocytosis at the level of single vesicles. Nat. Neurosci. 6, 846–853. doi: 10.1038/nn1087
Beck, A., Lohr, C., Berthold, H., and Deitmer, J. W. (2002). Calcium influx into dendrites of the leech Retzius neuron evoked by 5-hydroxytryptamine. Cell Calcium 31, 137–149. doi: 10.1054/ceca.2001.0268
Becskei, A. (2001). Positive feedback in eukaryotic gene networks: cell differentiation by graded to binary response conversion. EMBO J. 20, 2528–2535. doi: 10.1093/emboj/20.10.2528
Betz, W. J., and Bewick, G. S. (1992). Optical analysis of synaptic vesicle recycling at the frog neuromuscular junction. Science 255, 200–203. doi: 10.1126/science.1553547
Bezprozvanny, I., Watras, J., and Ehrlich, B. E. (1991). Bell-shaped calcium-response curves of Ins(1,4,5)P3- and calcium-gated channels from endoplasmic reticulum of cerebellum. Nature 351, 751–754. doi: 10.1038/351751a0
Bi, G. Q., Morris, R. L., Liao, G., Alderton, J. M., Scholey, J. M., and Steinhardt, R. A. (1997). Kinesin- and myosin-driven steps of vesicle recruitment for Ca2+-regulated exocytosis. J. Cell Biol. 138, 999–1008. doi: 10.1083/jcb.138.5.999
Bruns, D., Engert, F., and Lux, H. D. (1993). A fast activating presynaptic reuptake current during serotonergic transmission in identified neurons of Hirudo. Neuron 10, 559–572. doi: 10.1016/0896-6273(93)90159-O
Bruns, D., Riedel, D., Klingauf, J., and Jahn, R. (2000). Quantal release of serotonin. Neuron 28, 205–220. doi: 10.1016/S0896-6273(00)00097-0
Bunin, M. A., and Wightman, R. M. (1998). Quantitative evaluation of 5-hydroxytryptamine (serotonin) neuronal release and uptake: an investigation of extrasynaptic transmission. J. Neurosci. 18, 4854–4860.
Bunin, M. A., and Wightman, R. M. (1999). Paracrine neurotransmission in the CNS: involvement of 5-HT. Trends Neurosci. 22, 377–382. doi: 10.1016/S0166-2236(99)01410-1
Cercós, M. G., De-Miguel, F. F., and Trueta, C. (2009). Real-time measurements of synaptic autoinhibition produced by serotonin release in cultured leech neurons. J. Neurophysiol. 102, 1075–1085. doi: 10.1152/jn.00107.2009
Chaput, Y., Blier, P., and de Montigny, C. (1986). In vivo electrophysiological evidence for the regulatory role of autoreceptors on serotonergic terminals. J. Neurosci. 6, 2796–2801.
Chazal, G., and Ralston, H. J. 3rd. (1987). Serotonin-containing structures in the nucleus raphe dorsalis of the cat: an ultrastructural analysis of dendrites, presynaptic dendrites, and axon terminals. J. Comp. Neurol. 259, 317–329. doi: 10.1002/cne.902590302
Chen, G., Gutman, D. A., Zerby, S. E., and Ewing, A. G. (1996). Electrochemical monitoring of bursting exocytotic events from the giant dopamine neuron of Planorbis corneus. Brain Res. 733, 119–124. doi: 10.1016/S0006-8993(96)00754-8
Chow, R. H., Klingauf, J., Heinemann, C., Zucker, R. S., and Neher, E. (1996). Mechanisms determining the time course of secretion in neuroendocrine cells. Neuron 16, 369–376. doi: 10.1016/S0896-6273(00)80054-9
Coggeshall, R. E. (1972). Autoradiographic and chemical localization of 5-hydroxytryptamine in identified neurons in the leech. Anat. Rec. 172, 489–498. doi: 10.1002/ar.1091720303
Coggeshall, R. E., and Fawcett, D. W. (1964). The fine structure of the central nervous system of the leech, Hirudo Medicinalis. J. Neurophysiol. 27, 229–289.
Colgan, L. A., Cavolo, S. L., Commons, K. G., and Levitan, E. S. (2012). Action potential-independent and pharmacologically unique vesicular serotonin release from dendrites. J. Neurosci. 32, 15737–15746. doi: 10.1523/JNEUROSCI.0020-12.2012
Colgan, L. A., Putzier, I., and Levitan, E. S. (2009). Activity-dependent vesicular monoamine transporter-mediated depletion of the nucleus supports somatic release by serotonin neurons. J. Neurosci. 29, 15878–15887. doi: 10.1523/JNEUROSCI.4210-09.2009
De Kock, C. P. J., Cornelisse, L. N., Burnashev, N., Lodder, J. C., Timmerman, A. J., Couey, J. J., et al. (2006). NMDA receptors trigger neurosecretion of 5-HT within dorsal raphe nucleus of the rat in the absence of action potential firing. J. Physiol. 577, 891–905. doi: 10.1113/jphysiol.2006.115311
Del Arco, A., Segovia, G., Fuxe, K., and Mora, F. (2003). Changes in dialysate concentrations of glutamate and GABA in the brain: an index of volume transmission mediated actions? J. Neurochem. 85, 23–33. doi: 10.1046/j.1471-4159.2003.01692.x
De-Miguel, F. F., and Fuxe, K. (2012). Extrasynaptic neurotransmission as a way of modulating neuronal functions. Front. Physiol. 3:16. doi: 10.3389/fphys.2012.00016
De-Miguel, F. F., Santamaría-Holek, I., Noguez, P., Bustos, C., Hernández-Lemus, E., and Rubí, J. M. (2012). Biophysics of active vesicle transport, an intermediate step that couples excitation and exocytosis of serotonin in the neuronal soma. PLoS ONE 7:e45454. doi: 10.1371/journal.pone.0045454
De-Miguel, F. F., and Trueta, C. (2005). Synaptic and extrasynaptic secretion of serotonin. Cell. Mol. Neurobiol. 25, 297–312. doi: 10.1007/s10571-005-3061-z
Descarries, L., and Mechawar, N. (2000). Ultrastructural evidence for diffuse transmission by monoamine and acetylcholine neurons of the central nervous system. Prog. Brain Res. 125, 27–47. doi: 10.1016/S0079-6123(00)25005-X
Dietzel, I. D., Drapeau, P., and Nicholls, J. G. (1986). Voltage dependence of 5-hydroxytryptamine release at a synapse between identified leech neurones in culture. J. Physiol. 372, 191–205.
Drapeau, P., Melinyshyn, E., and Sanchez-Armass, S. (1989). Contact-mediated loss of the nonsynaptic response to transmitter during reinnervation of an identified leech neuron in culture. J. Neurosci. 9, 2502–2508.
Fernandez-De-Miguel, F., Cooper, R. L., and Adams, W. B. (1992). Synaptogenesis and calcium current distribution in cultured leech neurons. Proc. R. Soc. B Biol. Sci. 247, 215–221. doi: 10.1098/rspb.1992.0032
Fornal, C. A., Litto, W. J., Metzler, C. W., Marrosu, F., Tada, K., and Jacobs, B. L. (1994). Single-unit responses of serotonergic dorsal raphe neurons to 5-HT1A agonist and antagonist drug administration in behaving cats. J. Pharmacol. Exp. Ther. 270, 1345–1358.
Fox, A. P., Nowycky, M. C., and Tsien, R. W. (1987). Single-channel recordings of three types of calcium channels in chick sensory neurones. J. Physiol. 394, 173–200.
Fu, X. W., Nurse, C. A., Wong, V., and Cutz, E. (2002). Hypoxia-induced secretion of serotonin from intact pulmonary neuroepithelial bodies in neonatal rabbit. J. Physiol. 539, 503–510. doi: 10.1113/jphysiol.2001.013071
Fuxe, K., Borroto-Escuela, D. O., Romero-Fernandez, W., Diaz-Cabiale, Z., Rivera, A., Ferraro, L., et al. (2012). Extrasynaptic neurotransmission in the modulation of brain function. Focus on the striatal neuronal-glial networks. Front. Physiol. 3:136. doi: 10.3389/fphys.2012.00136
Fuxe, K., Cintra, A., Agnati, L. F., Härfstrand, A., and Goldstein, M. (1988). Studies on the relationship of tyrosine hydroxylase, dopamine and cyclic amp-regulated phosphoprotein-32 immunoreactive neuronal structures and d1 receptor antagonist binding sites in various brain regions of the male rat-mismatches indicate a role of d1 receptors in volume transmission. Neurochem. Int. 13, 179–197. doi: 10.1016/0197-0186(88)90054-X
Fuxe, K., Dahlström, A. B., Jonsson, G., Marcellino, D., Guescini, M., Dam, M., et al. (2010). The discovery of central monoamine neurons gave volume transmission to the wired brain. Prog. Neurobiol. 90, 82–100. doi: 10.1016/j.pneurobio.2009.10.012
Gardner, T. S., Cantor, C. R., and Collins, J. J. (2000). Construction of a genetic toggle switch in Escherichia coli. Nature 403, 339–342. doi: 10.1038/35002131
Gee, K. R., Brown, K. A., Chen, W. N., Bishop-Stewart, J., Gray, D., and Johnson, I. (2000). Chemical and physiological characterization of fluo-4 Ca(2+)-indicator dyes. Cell Calcium 27, 97–106. doi: 10.1054/ceca.1999.0095
Gillette, M. U., DeMarco, S. J., Ding, J. M., Gallman, E. A., Faiman, L. E., Liu, C., et al. (1993). The organization of the suprachiasmatic circadian pacemaker of the rat and its regulation by neurotransmitters and modulators. J. Biol. Rhythms 8(Suppl.), S53–S58.
Gunter, T. E., Yule, D. I., Gunter, K. K., Eliseev, R. A., and Salter, J. D. (2004). Calcium and mitochondria. FEBS Lett. 567, 96–102. doi: 10.1016/j.febslet.2004.03.071
Hansford, R. G. (1994). Physiological role of mitochondrial Ca2+ transport. J. Bioenerg. Biomembr. 26, 495–508. doi: 10.1007/BF00762734
Héry, F., and Ternaux, J. P. (1981). Regulation of release processes in central serotoninergic neurons. J. Physiol. 77, 287–301.
Hirasawa, H., Puopolo, M., and Raviola, E. (2009). Extrasynaptic release of GABA by retinal dopaminergic neurons. J. Neurophysiol. 102, 146–158. doi: 10.1152/jn.00130.2009
Huang, H.-P., Wang, S.-R., Yao, W., Zhang, C., Zhou, Y., Chen, X.-W., et al. (2007). Long latency of evoked quantal transmitter release from somata of locus coeruleus neurons in rat pontine slices. Proc. Natl. Acad. Sci. U.S.A. 104, 1401–1406. doi: 10.1073/pnas.0608897104
Hull, E. M., Lorrain, D. S., Du, J., Matuszewich, L., Lumley, L. A., Putnam, S. K., et al. (1999). Hormone-neurotransmitter interactions in the control of sexual behavior. Behav. Brain Res. 105, 105–116. doi: 10.1016/S0166-4328(99)00086-8
Jackman, S. L., Babai, N., Chambers, J. J., Thoreson, W. B., and Kramer, R. H. (2011). A positive feedback synapse from retinal horizontal cells to cone photoreceptors. PLoS Biol. 9:e1001057. doi: 10.1371/journal.pbio.1001057
Jacobs, B. L., and Azmitia, E. C. (1992). Structure and function of the brain serotonin system. Physiol. Rev. 72, 165–229.
Jaffe, E. H., Marty, A., Schulte, A., and Chow, R. H. (1998). Extrasynaptic vesicular transmitter release from the somata of substantia nigra neurons in rat midbrain slices. J. Neurosci. 18, 3548–3553.
Jansson, A., Tinner, B., Bancila, M., Vergé, D., Steinbusch, H. W., Agnati, L. F., et al. (2001). Relationships of 5-hydroxytryptamine immunoreactive terminal-like varicosities to 5-hydroxytryptamine-2A receptor-immunoreactive neuronal processes in the rat forebrain. J. Chem. Neuroanat. 22, 185–203. doi: 10.1016/S0891-0618(01)00133-8
Jin, W., Lo, T. M., Loh, H. H., and Thayer, S. A. (1994). U73122 inhibits phospholipase C-dependent calcium mobilization in neuronal cells. Brain Res. 642, 237–243. doi: 10.1016/0006-8993(94)90927-X
Kapadia, S. E., de Lanerolle, N. C., and LaMotte, C. C. (1985). Immunocytochemical and electron microscopic study of serotonin neuronal organization in the dorsal raphe nucleus of the monkey. Neuroscience 15, 729–746. doi: 10.1016/0306-4522(85)90075-2
Kaushalya, S. K., Desai, R., Arumugam, S., Ghosh, H., Balaji, J., and Maiti, S. (2008). Three-photon microscopy shows that somatic release can be a quantitatively significant component of serotonergic neurotransmission in the mammalian brain. J. Neurosci. Res. 86, 3469–3480. doi: 10.1002/jnr.21794
Klingauf, J., and Neher, E. (1997). Modeling buffered Ca2+ diffusion near the membrane. Biophys. J. 72, 674–690. doi: 10.1016/S0006-3495(97)78704-6
Kravitz, E. A. (2000). Serotonin and aggression: insights gained from a lobster model system and speculations on the role of amine neurons in a complex behavior. J. Comp. Physiol. A 186, 221–238. doi: 10.1007/s003590050423
Kuffler, D. P., Nicholls, J., and Drapeau, P. (1987). Transmitter localization and vesicle turnover at a serotoninergic synapse between identified leech neurons in culture. J. Comp. Neurol. 256, 516–526. doi: 10.1002/cne.902560404
Kuffler, S. W., and Nicholls, J. G. (1966). The physiology of neuroglial cells. Erg. Physiol. Biol. Chem. Exp. Pharmakol. 57, 1–90. doi: 10.1007/BF02259903
Lambert, R. C., Dayanithi, G., Moos, F. C., and Richard, P. (1994). A rise in the intracellular Ca2+ concentration of isolated rat supraoptic cells in response to oxytocin. J. Physiol. 478(Pt 2), 275–287.
Lent, C. M. (1985). Serotonergic modulation of the feeding behavior of the medicinal leech. Brain Res. Bull. 14, 643–655. doi: 10.1016/0361-9230(85)90114-5
Lessmann, V., and Dietzel, I. D. (1991). Development of serotonin-induced ion currents in identified embryonic Retzius cells from the medicinal leech (Hirudo medicinalis). J. Neurosci. 11, 800–809.
Liposits, Z., Görcs, T., and Trombitás, K. (1985). Ultrastructural analysis of central serotoninergic neurons immunolabeled by silver-gold-intensified diaminobenzidine chromogen. Completion of immunocytochemistry with X-ray microanalysis. J. Histochem. Cytochem. 33, 604–610. doi: 10.1177/33.6.3889144
Ludwig, M., and Leng, G. (2006). Dendritic peptide release and peptide-dependent behaviours. Nat. Rev. Neurosci. 7, 126–136. doi: 10.1038/nrn1845
Ludwig, M., Sabatier, N., Bull, P. M., Landgraf, R., Dayanithi, G., and Leng, G. (2002). Intracellular calcium stores regulate activity-dependent neuropeptide release from dendrites. Nature 418, 85–89. doi: 10.1038/nature00822
Marlier, L., Sandillon, F., Poulat, P., Rajaofetra, N., Geffard, M., and Privat, A. (1991). Serotonergic innervation of the dorsal horn of rat spinal cord: light and electron microscopic immunocytochemical study. J. Neurocytol. 20, 310–322. doi: 10.1007/BF01235548
Mitchell, K. J., Pinton, P., Varadi, A., Tacchetti, C., Ainscow, E. K., Pozzan, T., et al. (2001). Dense core secretory vesicles revealed as a dynamic Ca(2+) store in neuroendocrine cells with a vesicle-associated membrane protein aequorin chimaera. J. Cell Biol. 155, 41–51. doi: 10.1083/jcb.200103145
Moreno, A., Lobatón, C. D., Santodomingo, J., Vay, L., Hernández-SanMiguel, E., Rizzuto, R., et al. (2005). Calcium dynamics in catecholamine-containing secretory vesicles. Cell Calcium 37, 555–564. doi: 10.1016/j.ceca.2005.02.002
Mosko, S. S., Haubrich, D., and Jacobs, B. L. (1977). Serotonergic afferents to the dorsal raphe nucleus: evdience from HRP and synaptosomal uptake studies. Brain Res. 119, 269–290. doi: 10.1016/0006-8993(77)90311-0
Moukhles, H., Bosler, O., Bolam, J., Vallée, A., Umbriaco, D., Geffard, M., et al. (1997). Quantitative and morphometric data indicate precise cellular interactions between serotonin terminals and postsynaptic targets in rat substantia nigra. Neuroscience 76, 1159–1171. doi: 10.1016/S0306-4522(96)00452-6
Neher, E., and Augustine, G. J. (1992). Calcium gradients and buffers in bovine chromaffin cells. J. Physiol. 450, 273–301.
Neumann, I., Douglas, A. J., Pittman, Q. J., Russell, J. A., and Landgraf, R. (1996). Oxytocin released within the supraoptic nucleus of the rat brain by positive feedback action is involved in parturition-related events. J. Neuroendocrinol. 8, 227–233. doi: 10.1046/j.1365-2826.1996.04557.x
Nicholls, J. G., and Kuffler, D. P. (1990). Quantal release of serotonin from presynaptic nerve terminals. Neurochem. Int. 17, 157–163. doi: 10.1016/0197-0186(90)90138-J
Nowycky, M. C., Fox, A. P., and Tsien, R. W. (1985). Three types of neuronal calcium channel with different calcium agonist sensitivity. Nature 316, 440–443. doi: 10.1038/316440a0
Nusbaum, M. P., and Kristan, W. B. Jr. (1986). Swim initiation in the leech by serotonin-containing interneurones, cells 21 and 61. J. Exp. Biol. 122, 277–302.
O'Connor, J. J., and Kruk, Z. L. (1991). Frequency dependence of 5-HT autoreceptor function in rat dorsal raphe and suprachiasmatic nuclei studied using fast cyclic voltammetry. Brain Res. 568, 123–130. doi: 10.1016/0006-8993(91)91387-G
Oheim, M., and Stühmer, W. (2000). Tracking chromaffin granules on their way through the actin cortex. Eur. Biophys. J. 29, 67–89. doi: 10.1007/s002490050253
Pandey, S. C., Davis, J. M., and Pandey, G. N. (1995). Phosphoinositide system-linked serotonin receptor subtypes and their pharmacological properties and clinical correlates. J. Psychiatry Neurosci. 20, 215–225.
Patel, J. C., Witkovsky, P., Avshalumov, M. V., and Rice, M. E. (2009). Mobilization of calcium from intracellular stores facilitates somatodendritic dopamine release. J. Neurosci. 29, 6568–6579. doi: 10.1523/JNEUROSCI.0181-09.2009
Pozzan, T., Rizzuto, R., Volpe, P., and Meldolesi, J. (1994). Molecular and cellular physiology of intracellular calcium stores. Physiol. Rev. 74, 595–636.
Prosser, R. A. (2003). Serotonin phase-shifts the mouse suprachiasmatic circadian clock in vitro. Brain Res. 966, 110–115. doi: 10.1016/S0006-8993(02)04206-3
Puopolo, M., Hochstetler, S. E., Gustincich, S., Wightman, R. M., and Raviola, E. (2001). Extrasynaptic release of dopamine in a retinal neuron: activity dependence and transmitter modulation. Neuron 30, 211–225. doi: 10.1016/S0896-6273(01)00274-4
Qu, Z., and Vondriska, T. M. (2009). The effects of cascade length, kinetics and feedback loops on biological signal transduction dynamics in a simplified cascade model. Phys. Biol. 6:016007. doi: 10.1088/1478-3975/6/1/016007
Raleigh, M. J., McGuire, M. T., Brammer, G. L., Pollack, D. B., and Yuwiler, A. (1991). Serotonergic mechanisms promote dominance acquisition in adult male vervet monkeys. Brain Res. 559, 181–190. doi: 10.1016/0006-8993(91)90001-C
Ridet, J. L., Rajaofetra, N., Teilhac, J. R., Geffard, M., and Privat, A. (1993). Evidence for nonsynaptic serotonergic and noradrenergic innervation of the rat dorsal horn and possible involvement of neuron-glia interactions. Neuroscience 52, 143–157. doi: 10.1016/0306-4522(93)90189-M
Ross, W. N., Arechiga, H., and Nicholls, J. G. (1987). Optical recording of calcium and voltage transients following impulses in cell bodies and processes of identified leech neurons in culture. J. Neurosci. 7, 3877–3887.
Sabatier, N., Caquineau, C., Douglas, A. J., and Leng, G. (2003). Oxytocin released from magnocellular dendrites: a potential modulator of alpha-melanocyte-stimulating hormone behavioral actions? Ann. N. Y. Acad. Sci. 994, 218–224. doi: 10.1111/j.1749-6632.2003.tb03183.x
Sabatini, B. L., and Regehr, W. G. (1998). Optical measurement of presynaptic calcium currents. Biophys. J. 74, 1549–1563. doi: 10.1016/S0006-3495(98)77867-1
Sala, F., and Hernández-Cruz, A. (1990). Calcium diffusion modeling in a spherical neuron. Relevance of buffering properties. Biophys. J. 57, 313–324. doi: 10.1016/S0006-3495(90)82533-9
Saller, C. F., and Stricker, E. M. (1976). Hyperphagia and increased growth in rats after intraventricular injection of 5,7-dihydroxytryptamine. Science 192, 385–387. doi: 10.1126/science.1257774
Sanchez-Armass, S., Merz, D. C., and Drapeau, P. (1991). Distinct receptors, second messengers and conductances underlying the dual responses to serotonin in an identified leech neurone. J. Exp. Biol. 155, 531–547.
Sarkar, B., Banerjee, A., Das, A. K., Nag, S., Kaushalya, S. K., Tripathy, U., et al. (2014). Label-free dopamine imaging in live rat brain slices. ACS Chem. Neurosci. 5, 329–334. doi: 10.1021/cn5000138
Sarkar, B., Das, A. K., Arumugam, S., Kaushalya, S. K., Bandyopadhyay, A., Balaji, J., et al. (2012). The dynamics of somatic exocytosis in monoaminergic neurons. Front. Physiol. 3:414. doi: 10.3389/fphys.2012.00414
Satrústegui, J., Pardo, B., and Del Arco, A. (2007). Mitochondrial transporters as novel targets for intracellular calcium signaling. Physiol. Rev. 87, 29–67. doi: 10.1152/physrev.00005.2006
Siddall, M. E., Trontelj, P., Utevsky, S. Y., Nkamany, M., and Macdonald, K. S. (2007). Diverse molecular data demonstrate that commercially available medicinal leeches are not Hirudo medicinalis. Proc. R. Soc. B Biol. Sci. 274, 1481–1487. doi: 10.1098/rspb.2007.0248
Soldo, B. L., Giovannucci, D. R., Stuenkel, E. L., and Moises, H. C. (2004). Ca(2+) and frequency dependence of exocytosis in isolated somata of magnocellular supraoptic neurones of the rat hypothalamus. J. Physiol. 555, 699–711. doi: 10.1113/jphysiol.2003.051136
Stewart, R. R., Adams, W. B., and Nicholls, J. G. (1989). Presynaptic calcium currents and facilitation of serotonin release at synapses between cultured leech neurones. J. Exp. Biol. 144, 1–12.
Sun, Y. A., and Poo, M. M. (1987). Evoked release of acetylcholine from the growing embryonic neuron. Proc. Natl. Acad. Sci. U.S.A. 84, 2540–2544. doi: 10.1073/pnas.84.8.2540
Thyssen, A., Hirnet, D., Wolburg, H., Schmalzing, G., Deitmer, J. W., and Lohr, C. (2010). Ectopic vesicular neurotransmitter release along sensory axons mediates neurovascular coupling via glial calcium signaling. Proc. Natl. Acad. Sci. U.S.A. 107, 15258–15263. doi: 10.1073/pnas.1003501107
Tobin, V., Leng, G., and Ludwig, M. (2012). The involvement of actin, calcium channels and exocytosis proteins in somato-dendritic oxytocin and vasopressin release. Front. Physiol. 3:261. doi: 10.3389/fphys.2012.00261
Tobin, V. A., Douglas, A. J., Leng, G., and Ludwig, M. (2011). The involvement of voltage-operated calcium channels in somato-dendritic oxytocin release. PLoS ONE 6:e25366. doi: 10.1371/journal.pone.0025366
Tomioka, K., Uryu, O., Kamae, Y., Umezaki, Y., and Yoshii, T. (2012). Peripheral circadian rhythms and their regulatory mechanism in insects and some other arthropods: a review. J. Comp. Physiol. B, Biochem. Syst. Environ. Physiol. 182, 729–740. doi: 10.1007/s00360-012-0651-1
Trueta, C., and De-Miguel, F. F. (2012). Extrasynaptic exocytosis and its mechanisms: a source of molecules mediating volume transmission in the nervous system. Front. Physiol. 3:319. doi: 10.3389/fphys.2012.00319
Trueta, C., Kuffler, D. P., and De-Miguel, F. F. (2012). Cycling of dense core vesicles involved in somatic exocytosis of serotonin by leech neurons. Front. Physiol. 3:175. doi: 10.3389/fphys.2012.00175
Trueta, C., Méndez, B., and De-Miguel, F. F. (2003). Somatic exocytosis of serotonin mediated by L-type calcium channels in cultured leech neurones. J. Physiol. 547, 405–416. doi: 10.1113/jphysiol.2002.030684
Trueta, C., Sánchez-Armass, S., Morales, M. A., and De-Miguel, F. F. (2004). Calcium-induced calcium release contributes to somatic secretion of serotonin in leech Retzius neurons. J. Neurobiol. 61, 309–316. doi: 10.1002/neu.20055
Trulson, M. E., and Frederickson, C. J. (1987). A comparison of the electrophysiological and pharmacological properties of serotonin-containing neurons in the nucleus raphe dorsalis, raphe medianus and raphe pallidus recorded from mouse brain slices in vitro: role of autoreceptors. Brain Res. Bull. 18, 179–190. doi: 10.1016/0361-9230(87)90189-4
Tsien, R. W., Lipscombe, D., Madison, D. V., Bley, K. R., and Fox, A. P. (1988). Multiple types of neuronal calcium channels and their selective modulation. Trends Neurosci. 11, 431–438. doi: 10.1016/0166-2236(88)90194-4
Van Bockstaele, E. J., and Pickel, V. M. (1993). Ultrastructure of serotonin-immunoreactive terminals in the core and shell of the rat nucleus accumbens: cellular substrates for interactions with catecholamine afferents. J. Comp. Neurol. 334, 603–617. doi: 10.1002/cne.903340408
Visscher, K., Schnitzer, M. J., and Block, S. M. (1999). Single kinesin molecules studied with a molecular force clamp. Nature 400, 184–189. doi: 10.1038/22146
Willard, A. L. (1981). Effects of serotonin on the generation of the motor program for swimming by the medicinal leech. J. Neurosci. 1, 936–944.
Wintermantel, T. M., Campbell, R. E., Porteous, R., Bock, D., Gröne, H.-J., Todman, M. G., et al. (2006). Definition of estrogen receptor pathway critical for estrogen positive feedback to gonadotropin-releasing hormone neurons and fertility. Neuron 52, 271–280. doi: 10.1016/j.neuron.2006.07.023
Xiong, W., and Ferrell, J. E. (2003). A positive-feedback-based bistable “memory module” that governs a cell fate decision. Nature 426, 460–465. doi: 10.1038/nature02089
Yoo, S. H. (2010). Secretory granules in inositol 1,4,5-trisphosphate-dependent Ca2+ signaling in the cytoplasm of neuroendocrine cells. FASEB J. 24, 653–664. doi: 10.1096/fj.09-132456
Keywords: exocytosis, extrasynaptic, somatic exocytosis, extrasynaptic release, serotonin, 5-HT, calcium, positive feedback
Citation: Leon-Pinzon C, Cercós MG, Noguez P, Trueta C and De-Miguel FF (2014) Exocytosis of serotonin from the neuronal soma is sustained by a serotonin and calcium-dependent feedback loop. Front. Cell. Neurosci. 8:169. doi: 10.3389/fncel.2014.00169
Received: 21 March 2014; Accepted: 02 June 2014;
Published online: 27 June 2014.
Edited by:
Dieter Wicher, Max Planck Institute for Chemical Ecology, GermanyCopyright © 2014 Leon-Pinzon, Cercós, Noguez, Trueta and De-Miguel. This is an open-access article distributed under the terms of the Creative Commons Attribution License (CC BY). The use, distribution or reproduction in other forums is permitted, provided the original author(s) or licensor are credited and that the original publication in this journal is cited, in accordance with accepted academic practice. No use, distribution or reproduction is permitted which does not comply with these terms.
*Correspondence: Francisco F. De-Miguel, Instituto de Fisiología Celular-Neurociencias, Universidad Nacional Autónoma de México, Circuito Exterior, Ciudad Universitaria, Apartado Postal 14-740. C.P. 04510, México D.F., México e-mail:ZmZlcm5hbmRAaWZjLnVuYW0ubXg=