 Karlijn J. Doorn1,2
 John J. P. Brevé2Benjamin Drukarch2Hendrikus W. Boddeke3Inge Huitinga4Paul J. Lucassen1
 Anne-Marie van Dam2*
- 1Department Structural and Functional Plasticity of the Nervous System, Center for Neuroscience, Swammerdam Institute for Life Sciences, University of Amsterdam, Amsterdam, Netherlands
- 2Neuroscience Campus Amsterdam, Department Anatomy and Neurosciences, VU University Medical Center, Amsterdam, Netherlands
- 3Section Medical Physiology, Department of Neuroscience, University Medical Centre Groningen, Groningen, Netherlands
- 4Neuroimmunology Group, Netherlands Institute for Neuroscience, Institute of the Royal Netherlands Academy of Arts and Sciences, Amsterdam, Netherlands
Microglia are important cells in the brain that can acquire different morphological and functional phenotypes dependent on the local situation they encounter. Knowledge on the region-specific gene signature of microglia may hold valuable clues for microglial functioning in health and disease, e.g., Parkinson’s disease (PD) in which microglial phenotypes differ between affected brain regions. Therefore, we here investigated whether regional differences exist in gene expression profiles of microglia that are isolated from healthy rat brain regions relevant for PD. We used an optimized isolation protocol based on a rapid isolation of microglia from discrete rat gray matter regions using density gradients and fluorescent-activated cell sorting. Application of the present protocol followed by gene expression analysis enabled us to identify subtle differences in region-specific microglial expression profiles and show that the genetic profile of microglia already differs between different brain regions when studied under control conditions. As such, these novel findings imply that brain region-specific microglial gene expression profiles exist that may contribute to the region-specific differences in microglia responsivity during disease conditions, such as seen in, e.g., PD.
Introduction
Microglia are the primary, innate immune cells of the central nervous system (CNS) responsible for safeguarding and maintenance of brain homeostasis. By constantly surveying their microenvironment, microglia can quickly respond to a disturbed homeostasis caused, by e.g., pathogens or injury. Under such conditions, microglia undergo typical morphological and functional alterations and become engaged in processes like phagocytosis, cytokine production, antigen presentation and/or cell proliferation (Nimmerjahn et al., 2005; Hanisch and Kettenmann, 2007; Kettenmann et al., 2011; Doorn et al., 2014a).
Although prior studies have suggested that microglial activation is largely detrimental in the context of homeostatic brain disturbances, it is now well accepted that microglia can also benefit CNS function and provide neuroprotection, shape neuronal circuits and promote axonal regeneration (Ekdahl et al., 2003; Walter and Neumann, 2009; Welser et al., 2010; Czeh et al., 2011; Wake et al., 2013). In addition, while knowledge on general microglial morphology and function is well established, only recently has it become clear that microglial activity may be region-specific. Hence, previous views on microglia as a rather uniform cell population present throughout the brain, have now been replaced by the concept that these cells can acquire specific phenotypes depending on their region-specific environment (Lucin and Wyss-Coray, 2009; Ransohoff and Perry, 2009; Olah et al., 2011).
Besides regional differences in microglial density, which are positively correlated with, e.g., differential sensitivity to LPS-induced neurotoxicity (Kim et al., 2000), microglia display a region-dependent diversity in their surface markers expression (Lawson et al., 1990; Mittelbronn et al., 2001; De Haas et al., 2008; Buschmann et al., 2012). In addition, injection of interferon gamma (IFN-γ) into the brain caused a significant upregulation of major histocompatibility complex II (MHC II) molecules by microglia in the brainstem but not in the HC (Peng et al., 1998; Olah et al., 2011). Although such overt region-specific microglial responsiveness could be a mere consequence of differences in the local microenvironment, microglia isolated from different brain regions also present a distinct inflammatory profile at basal conditions as well as following endotoxin stimulation in vitro. This suggest that at least some of these traits are inherent to the microglia cells themselves, e.g., M1 or M2 type microglia (Ren et al., 1999; Xie et al., 2003).
Microglial diversity has also raised interest in their role in various neurodegenerative diseases, including PD (McGeer et al., 1988; Perry et al., 2010; Halliday and Stevens, 2011; Doorn et al., 2012; Hirsch et al., 2012). Recent data have shown that α-synuclein pathology spreads throughout the brain and affects several brain regions in PD patients (Braak et al., 2004), including the SN, OB, brainstem, limbic system and neocortex, in a disease-stage dependent manner (Braak and Braak, 2000; Amino et al., 2005; Orimo et al., 2007; Dickson et al., 2009; Jellinger, 2011). Microglia have been proposed to contribute to this differential, and evolving pattern of neuropathology that may underlie at least some of the motor and non-motor symptoms in PD (Doorn et al., 2014b). Besides the identification of activated microglia in the SN, i.e., a classical neuropathological PD site, microglial activation also occurs in non-dopaminergic regions like the OB and HC, notably regions where no or little neuronal loss occurs in PD (Imamura et al., 2003; McGeer and McGeer, 2008; Doorn et al., 2013, 2014b). In addition, we recently observed expression of microglial Toll-like receptor-2 (TLR2), that is involved in α-synuclein-mediated microglial activation, to be different between the HC and SN of PD patients (Kim et al., 2013; Doorn et al., 2014b), consistent with the concept of region-specific microglial phenotypes in human tissue.
The presence and profile of microglial surface markers not only differ between different brain regions in healthy control mice, also a differential responsiveness to various stimuli has been documented (Peng et al., 1998; Vroon et al., 2007; De Haas et al., 2008; Olah et al., 2011; Watson et al., 2012). Prior to studying region-specific differences in microglial expression profiles in a disease model, we here study whether gene expression profiles of rat microglia are already region-specific under baseline conditions. This is of importance as this expression profile might predict microglial responsivity, and hence differential pathological outcomes under challenging conditions. To this end, we used an optimized protocol to isolate microglia under baseline conditions from small amounts of tissue based on density gradients and fluorescent-activated cell sorting (FACS), which subsequently allowed the analysis of (inflammatory) gene expression profiles in pure microglia derived from brain regions of relevance for PD, e.g., the SN or other regions relevant for PD.
Materials and Methods
Animals
All experimental procedures were performed and carried out with approval of the animal ethical committee of the VU University Medical Center. In each independent set of experiments (n = 3), two adult male Wistar rats (250 g, Harlan) were sacrificed and the brain was rapidly removed and kept in GKN/BSA buffer (see below) on ice.
Acute Microglia Isolation
Percoll Solutions
Percoll (GE healthcare Biosciences, Uppsala, Sweden) was diluted 1:10 in sterile 10x PBS to yield 100% isotonic Percoll. This isotonic Percoll was diluted in GKN/BSA buffer (GKN 0.8 g/l NaCl, 0.4 g/l KCl, 3.6 g/l Na2HPO4.12H20, 0.8 g/l NaH2PO4, 2 g/l D-(+)-glucose, 0.3% BSA; pH 7.4, 4°C) to yield 75% and 50% isotonic Percoll solutions.
Tissue Processing
All procedures were carried out on ice. After removal of the meninges, OB, amygdala (AM), HC, striatum (STR) and SN were rapidly dissected, and placed separately in a plastic Petri dish containing 2 ml of ice-cold GKN/BSA buffer (see Figure 1 for information on anatomical location of dissected regions). Identical regions from 2 rats were pooled per experiment to increase microglial yield. Tissue was minced with a razor blade and transferred to a 70 μm pore size strainer (BD Biosciences, Erembodegem, Belgium) on top of a 50 ml conical tube (Greiner Bio-One). Tissue was then gently dissociated and mashed through the strainer to reach a single cell suspension. An additional 30 ml GKN/BSA was added to the tube containing the cell suspension, and then the tubes were centrifuged for 10 min at 300x g at 4°C (Hettich, Tuttlingen, Germany).
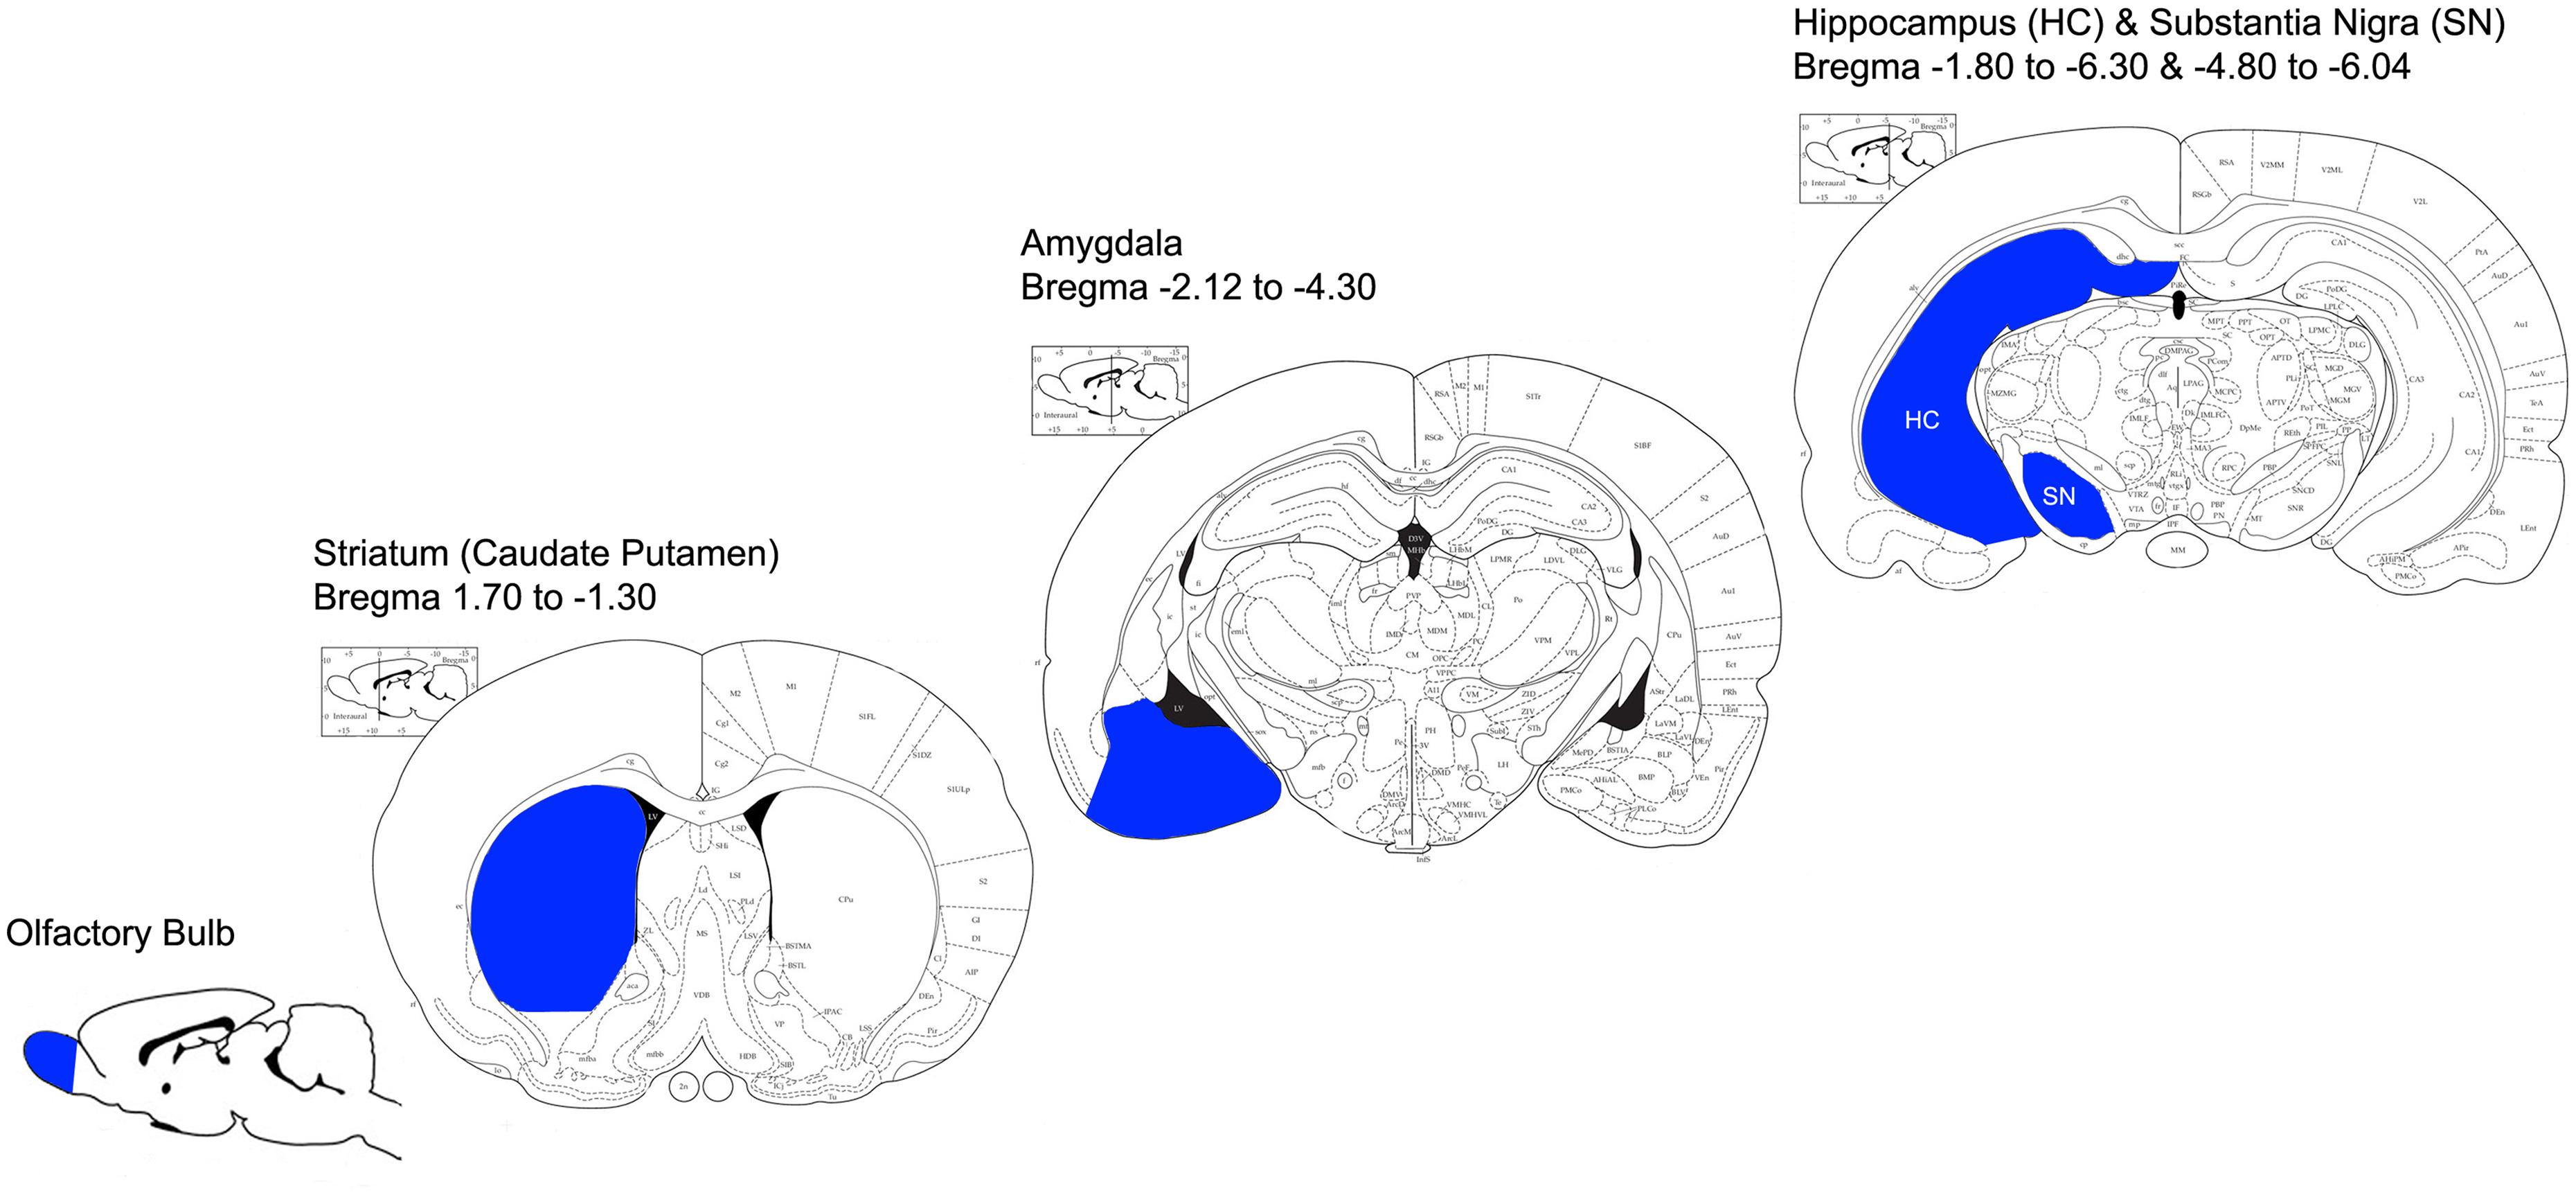
FIGURE 1. Anatomical representation of dissected brain regions (adapted from the Rat Brain Atlas; https://gaidi.ca/rat-brain-atlas/). Brain regions that were dissected for microglia isolation are indicated in blue; OB, STR, AM, HC and SN. Bregma coordinates indicate the anterior-posterior range of each region that was dissected.
Density Gradient Centrifugation
The supernatant was discarded and the remaining cell pellet was resuspended in 1 ml 50% Percoll and transferred to a new 15 ml polystyrene tube after which an additional 7 ml 50% Percoll was added. Then 4 ml of 75% Percoll was gently layered underneath the 50% Percoll layer and subsequently 3 ml GKN/BSA buffer was layered on top of the 50% Percoll layer using a Pasteur pipette. The density gradient was centrifuged at 1300x g (Hettich, Tuttlingen, Germany) for 30 min at 4°C.
Microglia Collection
Two distinct layers were apparent after centrifugation. The top layer between the GKN/BSA and 50% Percoll gradient consisted mainly of thick, viscous myelin. The lower layer at the interphase between the 50 and 75% Percoll phases appeared quite faint and contains highly enriched microglia. First, the top layer was carefully removed and then, using a new Pasteur pipette, the microglia containing interphase was aspirated and transferred to a 15 ml polystyrene tube. Cells were washed twice with 14 ml of GKN/BSA buffer and after adding another 14 ml of GKN/BSA buffer, the cells were centrifuged for 7 min at 300x g at 4°C and the buffer was discarded.
Fluorescence-Activated Cell Sorting (FACS)
Staining of Microglial Cells
Immediately after Percoll gradient separation and washing steps, cells were stained with the following antibodies: Pacific blue-labeled mouse anti CD11b (Serotec, MCA275PB; final dilution 1:30) or Alexa647-labeled mouse anti CD45 (Serotec, MCA 43A647; final dilution 1:30), including isotype controls (IgG2a, IgG1) to control for background staining. Briefly, cells per region were incubated for 30 min at 4°C in antibody diluted in PBS and shielded from light. In addition, cells were incubated for 10 min with Sytox green nucleic acid stain (Molecular Probes, S7020; final dilution 1:500,000) to distinguish living from dead cells, shortly before flow cytometry. Subsequently, cells were rinsed twice in PBS, pelleted at 1200 rpm for 5 min at 4°C and resuspended in 300 μl PBS before they were filtered over a 70 μm size strainer to obtain a single cell suspension ready for FACS analysis and sorting.
FACS Analysis and Sort of Microglia
Cell size, granularity, and fluorescence intensity were analyzed per brain region (n = 3) with a MoFlo fluorescent activated cell sorter (Beckman Coulter, Mijdrecht, Netherlands). Approximately 2x10⁴ events were counted and subsequently analyzed using Summit software version 4.3 (DAKO) to determine gates before cells were sorted. Microglia were defined as the percentage of all living, Sytox green negative, cells that showed CD11bpos/CD45low expression (Sedgwick et al., 1991). Subsequently, for each brain region, the FACS sorted microglial cells were transferred into RNAse-free tubes and centrifuged for 5 min at 300x g (Hettich, Tuttlingen, Germany) at 4°C. The supernatant was aspirated, and cells were lysed with 500 μl Trizol reagent (Invitrogen, Carlsbad, CA, USA) for 5 min at RT. Lysates were stored at -80°C for subsequent RNA isolation, cDNA synthesis and qPCR analysis.
RNA Isolation, cDNA Synthesis and Quantitative Real-Time PCR
Total RNA (n = 3/brain region) was isolated from sorted microglia per brain region using Trizol Reagent (Invitrogen, Carlsbad, CA, USA) according to the manufacturer’s instructions. Total RNA was further purified using the RNeasy MinElute Cleanup kit (Qiagen). RNA was reverse-transcribed into cDNA using the High-Capacity cDNA Reverse Transcription kit (Life Technologies), using 0.5 μg oligo-dT primers and according to the manufacturer’s instructions. For subsequent quantitative real-time PCR (qPCR), the Power SYBR Green Master Mix (Life Technologies) was used. Primers were purchased from Eurogentec (Maastricht, Netherlands) and qPCR was performed in MicroAmp Optical 96-well Reaction Plates (Applied Biosystems) on a StepOnePlus Real-Time PCR system (Applied Biosystems). The reaction mixture (20 μl) was composed of 1 × Power SYBR Green buffer (Applied Biosystems), 3.75 pmol of each primer (see Table 1 for primer details), and 12.5 ng cDNA. The thermal cycling conditions were an initial 10 min at 95°C followed by 40 cycles of 15 s at 95° C and 1 min at 60°C. The specificity of the reaction was checked by means of melt curve analysis. The relative expression level of the target genes was determined by the LinRegPCR software (version 2014.3; website: http://www.hfrc.nl) using the following calculation N0 = Nq/ECq (N0 = target quantity, Nq = fluorescence treshold value, E = mean PCR efficiency per amplicon, Cq = treshold cycle (Ruijter et al., 2009), after which the value was normalized relative to glyceraldehyde-3-phosphate-dehydrogenase (GAPDH). We chose GAPDH as reference gene based on previous studies (Roy et al., 2006; Melief et al., 2012). Furthermore, no in vivo or ex vivo treatments have been performed with the cells that may change the expression of reference genes.
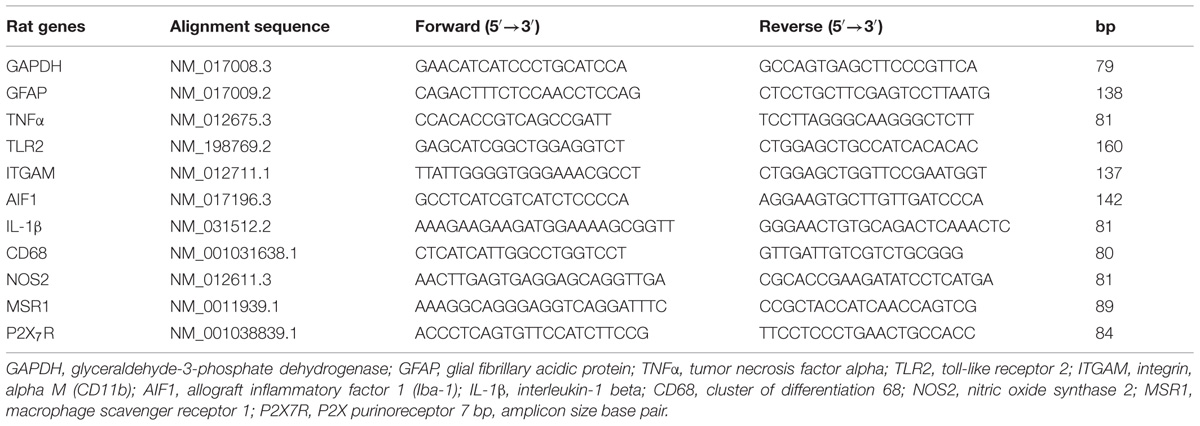
TABLE 1. Primer sequences used for q-PCR analysis.
Statistical Analysis
Statistical analyses were performed using the SPPS package version 20.0 (Statistical Product and Service Solutions, Chicago, IL, USA). The mean and SD of efficiency corrected and GAPDH normalized mRNA expression in microglia were calculated for each brain region. Since data was normally distributed, as determined by the Shapiro-Wilk test, within statistical analysis was performed using a paired sample T-test. Bonferroni corrections for multiple testing led to a p-value of 0.005 (alpha/number of tests: 0.05/10). However, since this may be too stringent for our analysis leading to type 2 errors (false negative), we indicated the results in our graphs as significant with p-value set at 0.05.
Results
FACS Sorted Microglia from Various Rat Brain Regions
For the isolation of microglia, we optimized earlier developed protocols with respect to microglia survival and purity (Frank et al., 2006; De Haas et al., 2008; Melief et al., 2012). Upon flow cytometry, microglia were identified based on cell size, granularity (Figure 2A, R1) and viability by Sytox green nucleic acid staining (Figure 2B, R2). As it has been shown that in gray matter brain regions of untreated rodents, hardly any monocytes/macrophages can be observed (Lawson et al., 1990), we identified a large homogeneous CD11bhigh/CD45pos cell population which we considered being only microglia, revealing a population of 90–95% of all viable cells (mean ± SD, Figure 2C; Table 2). A small amount (mean of 7%) of CD11blow/CD45poscells (Figure 2C), especially observed in the OB, were identified as lymphocytes (Lacombe et al., 1997; Stirling and Yong, 2008). After sorting of the microglial cells, their amount ranged from 1.1 × 10⁴ microglial cells in the SN to 1.2 × 10⁵ microglial cells in the OB (Table 2). The CD11bhigh/CD45pos expressing cells were then sorted to obtain a pure microglia population for further analysis (Figure 2C).
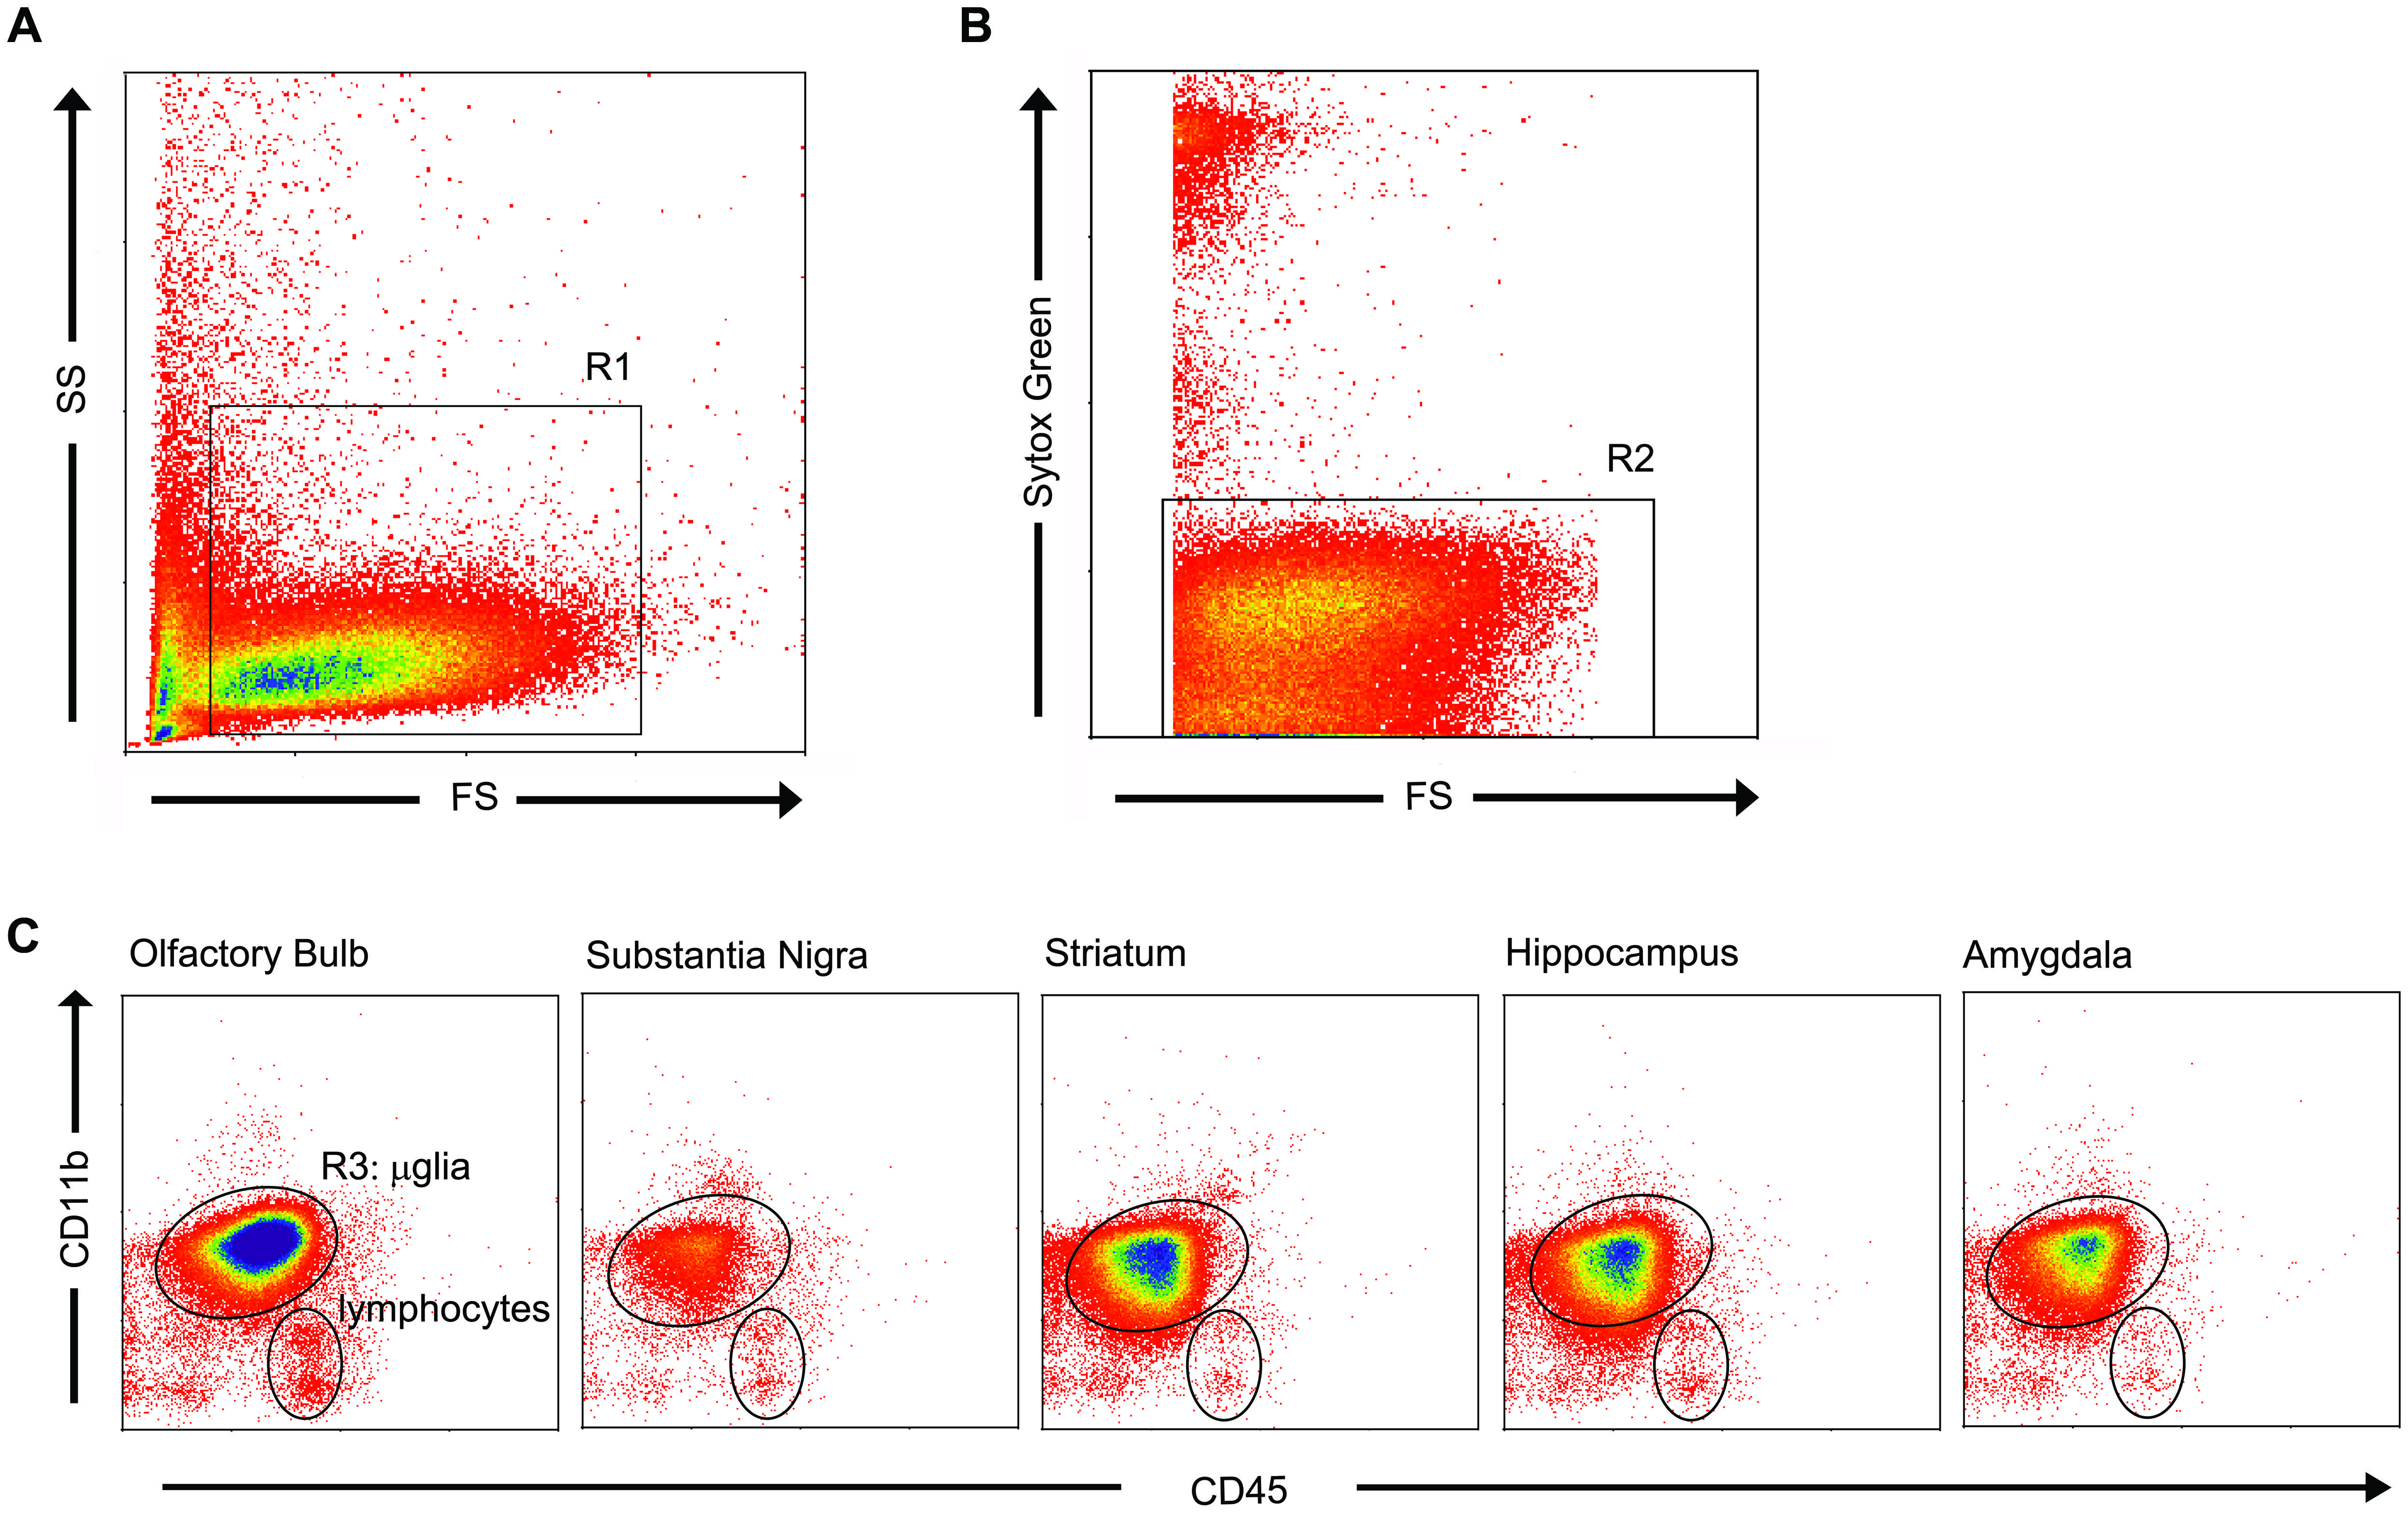
FIGURE 2. Flow cytometric analysis based on cell size, granularity and viability identified microglia with CD11bhigh/CD45pos expression. (A) Microglia appeared homogeneous in cell size and granularity (R1). (B) Sytox green staining, a DNA-binding dye that is actively taken up by dying cells, distinguished the living cells (R2) from dead cells and debris. (C) Combined selection based on cell size, granularity, and viability (R1 and R2) resulted in a microglial purity of 92.4 ± 0.87% (mean ± SD), as identified by their characteristic CD11bhigh/CD45pos expression. A small fraction of lymphocytes was present to within the viable cells. To obtain a 100% pure microglial population, microglia (R3) were sorted.
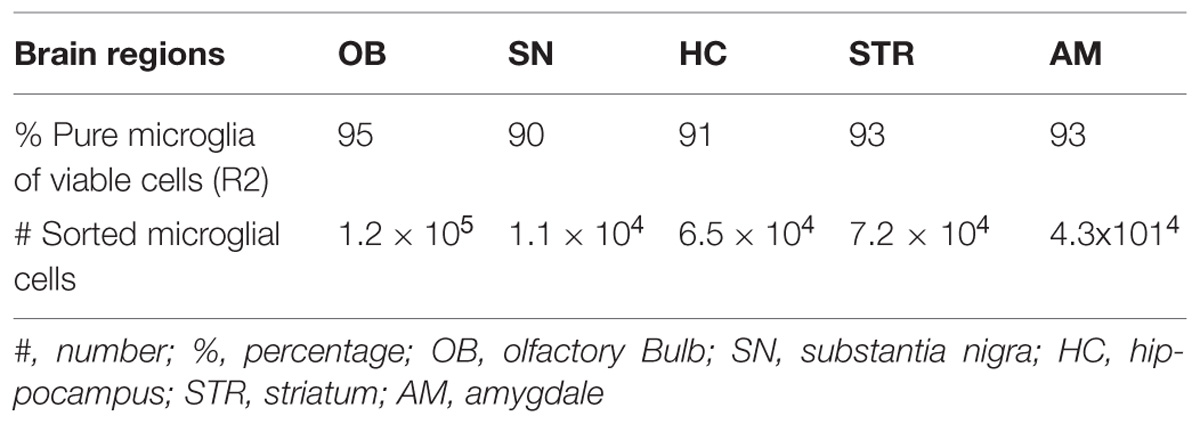
TABLE 2. Quantification of isolated microglia per brain region.
Brain Region-Specific Gene Expression
To determine brain region-specific microglial expression, microglia were sorted from the OB, SN, Str, HC, and AM, and gene expression within these samples was analyzed by means of qPCR. The genes chosen for analysis have been described to be expressed in microglia in vivo or in vitro, both under control and/or inflammatory conditions. We determined clear mRNA expression of CD11b (itgam; general microglia) and AIF-1 (iba1; general microglia), CD68 (microglial activation), TNF (pro-inflammatory cytokine), TLR2 (pathogen recognition), P2X purinoreceptor 7 (P2X7R; receptor for ATP), C-C chemokines receptor 2 (CCR2; monocyte chemotaxis) and Interleukin-1β (IL-1β; pro-inflammatory cytokine; Figure 3). Macrophage scavenger receptor (MSR-1), involved in alternative microglial activation and phagocytosis, brain-derived neurotrophic factor (BDNF) and inducible nitric oxide synthase (NOS-2) expression levels were below the detection limit (data not shown). Moreover, hardly any GFAP expression was observed, indicating the absence of astrocyte contamination in the sorted microglia (Figure 3C). Normalized mRNA expression of the general microglial markers AIF-1 and CD11b showed no significant differences between the different brain regions studied (Figures 3A,B). There was a trend toward higher CD11b mRNA expression level in the OB compared to Str, and in the SN compared to the HC (Figure 3B; p = 0.059; p = 0.062, respectively). The mRNA level of the microglial activation marker CD68 was significantly higher in the OB compared to the Str, HC, and AM (Figure 3D; *p = 0.030, *p = 0.049, *p = 0.020, respectively), and in the Str compared to the AM (Figure 3D; #p = 0.014). Furthermore, trends were present toward higher CD68 mRNA levels in Str compared to HC (Figure 3D; p = 0.075) and in HC relative to AM (Figure 3D; p = 0.091).
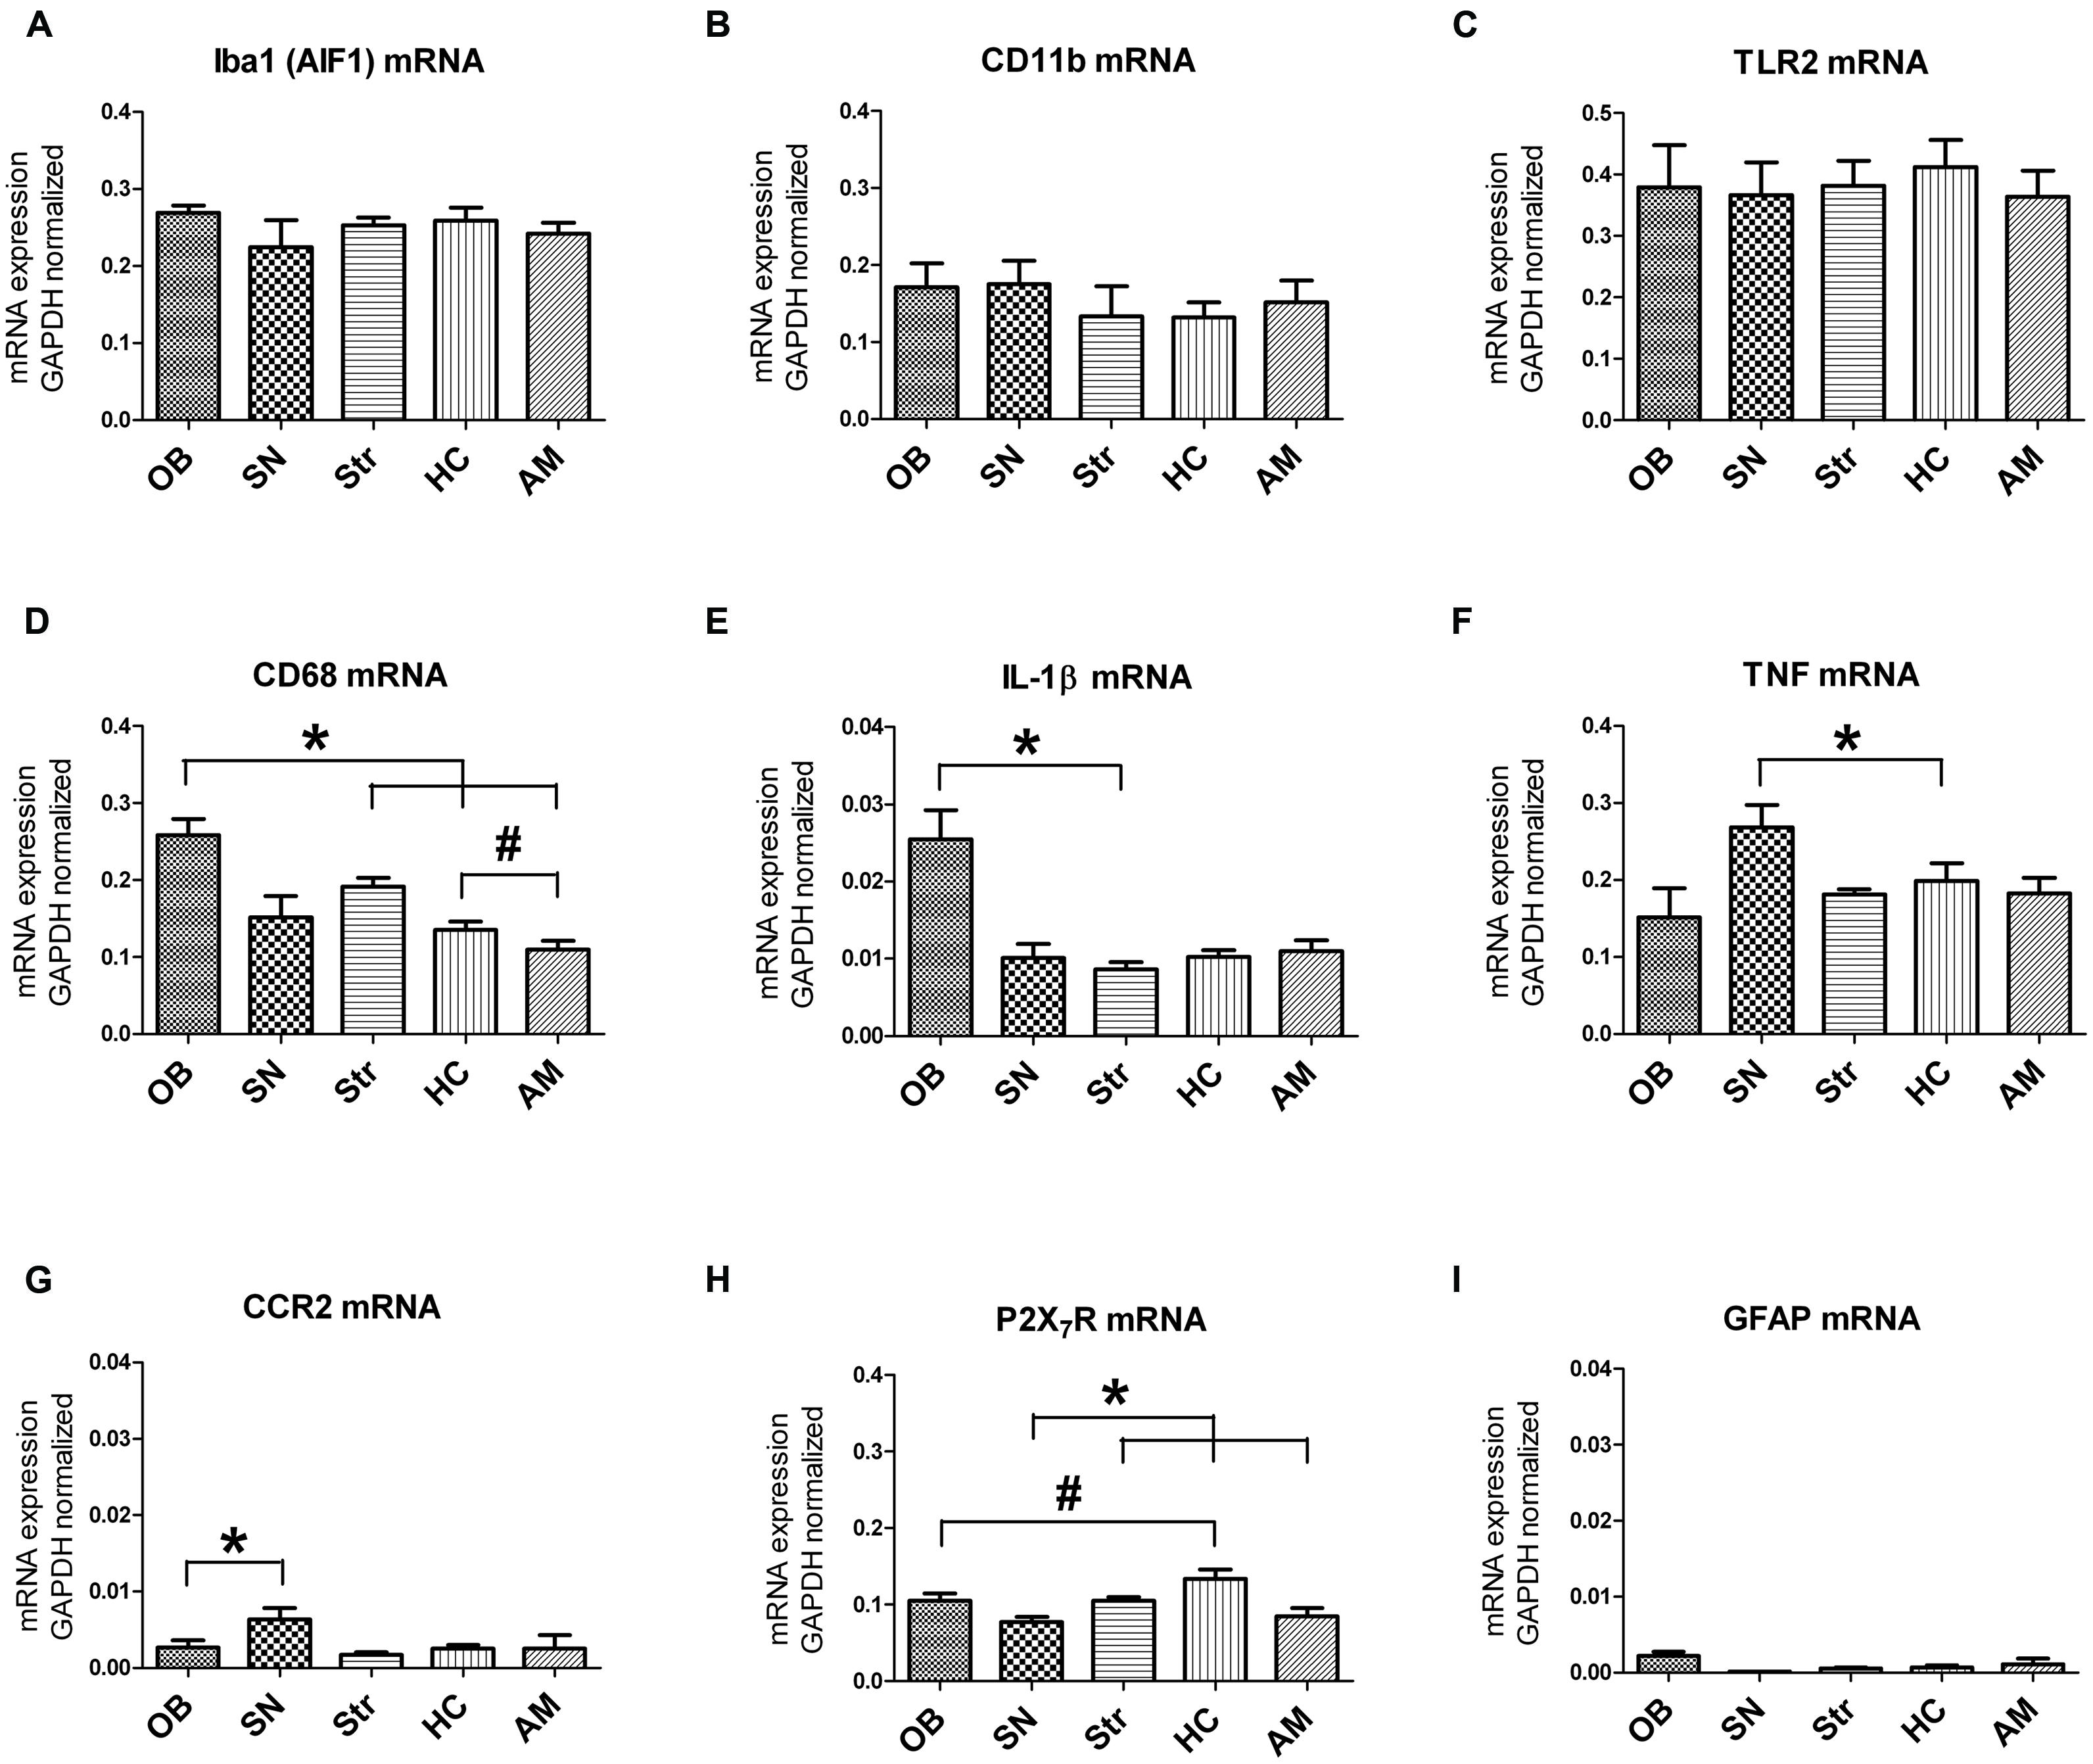
FIGURE 3. Region-specific expression levels of established microglial markers. No significant differences were found in AIF1 (A), CD11b (B) and TLR2 (C) mRNA levels between the different brain regions. For CD68 (D) and IL-1β (E), a significantly higher expression was present in the OB compared to other brain regions (CD68: OB vs. Str, HC, AM *p < 0.05; IL-1β: OB vs. Str *p < 0.05), and a significantly higher expression of CD68 (d) in Str compared to AM was found (#p < 0.02). Significantly higher TNF mRNA level (F) was measured in the SN relative to the HC (*p < 0.05), a significantly higher CCR2 mRNA level (G) in SN compared to OB (*p < 0.05), significantly lower P2X7R mRNA level (H) in SN compared to Str, HC, and AM (*p < 0.05), and significantly more P2X7R expression (H) in the HC compared to OB (#p < 0.05). (I) No GFAP expression was observed, indicating that the sorted microglia were not contaminated by astrocytes.
Interleukin-1β mRNA expression was significantly elevated in the OB compared to Str (Figure 3E; *p = 0.034) and a trend was observed toward more expression in the OB compared to all other regions (Figure 3E; SN p = 0.074; HC p = 0.056; AM p = 0.063), while TNFα mRNA level was significantly higher in the SN compared to HC (Figure 3F; *p = 0.047) in addition to a trend toward more expression in the SN compared to OB and AM (Figure 3F; p = 0.078; p = 0.068, respectively). TLR2, involved in pathogen recognition, was not different between the different brain regions and showed a similar expression pattern as AIF-1 mRNA (Figure 3G). This in contrast to CCR2, a receptor for CCL2 involved in microglial recruitment and proliferation (Prins et al., 2014), that was significantly elevated in the SN compared to the OB (Figure 3H; *p = 0.027). P2X7R, a purinoreceptor for ATP, was expressed at significantly lower amounts in the SN compared to HC, Str and AM (Figure 3I; *p = 0.015; *p = 0.008; *p = 0.040, respectively) but significantly higher in the HC relative to the OB (Figure 3I; #p = 0.26). Notably, all values indicated here are based on paired-sample t-test with a significance set at 0.05, they did not survive Bonferroni corrections for multiple testing (p ≤ 0.005), and therefore should be interpreted with care.
Discussion
By optimizing protocols to isolate pure microglia from several gray matter regions implicated in PD, we could determine brain-region specific microglial gene expression profiles. We demonstrate that already under control conditions, gray matter-derived microglial cells express markers that are essential not only for regulating brain homeostasis, but also do so in a region-specific manner.
For the present study, region-specific microglial gene expression was determined in Wistar rats, because this rat strain will be used for subsequent PD-related studies. However, we cannot exclude that the results obtained thus far in Wistar rats may differ when other rat strains, e.g., inbred strains, will be used.
Our current isolation protocol differs from other studies that isolated microglia from adult brain using enzyme digestion in order to obtain cell suspensions (Melief et al., 2013; Orre et al., 2014). Since we avoided enzymatic digestion, this prevented alterations in the expression of surface antigens that are important for cell identification (Ford et al., 1996). Moreover, in the present study we directly analyzed freshly isolated microglia, which is more representative for the in vivo status of these cells at the time of isolation (Frank et al., 2006; Melief et al., 2012; Olah et al., 2012). Also the isolation procedure itself may influence the cell status, which is why all brain regions were dissected, and the cells isolated and processed immediately and all at the same time. The whole procedure was further performed on ice to avoid microglial activation as much as possible and biological triplicates were used to determine variability. Thus, when microglia isolated from one brain region show a different gene expression profile from microglia isolated from another region, such results should then reflect region-specific properties of the cells.
Fluorescent-activated cell sorting analysis revealed that indeed around 93% of all isolated cells were microglia, characterized by CD11bhigh/Cd45pos expression relative to lymphocytes CD11blow/Cd45pos expression, after gating on size and granularity and viability. The remaining cells consisted of lymphocytes. Hence, after sorting for CD11bhigh/CD45pos expressing cells, a pure population of microglia was obtained. The number of microglial cells obtained from the various gray matter brain regions differed substantially with the lowest yield from the SN, and the highest from the OB. This difference can be attributed to the size of the areas excised from which cells were isolated (Figure 1) but was controlled for during qPCR analysis. In line with previous studies, enrichment and purity of brain microglia was confirmed at the mRNA level by studying the expression of established general microglial markers CD11b and Iba1 in all brain regions (Ito et al., 1998; Frank et al., 2006; Torres-Platas et al., 2014). Based on hardly detectable GFAP mRNA levels, astrocyte contamination of the FACS sorted cells was excluded. We further characterized regional specificity of microglia in the healthy brain by studying the expression of genes that have previously been reported in microglia, under control and/or inflammatory conditions (Vroon et al., 2007; Lucin and Wyss-Coray, 2009; Borrajo et al., 2014; Doorn et al., 2014b; Prins et al., 2014).
Under healthy conditions, microglia display a ramified phenotype that is generally characterized by a low expression of molecules like CD68 and MHCII, and by a low phagocytic activity (Aloisi, 2001; Perry et al., 2007; Hart et al., 2012). CD68 is a glycoprotein which binds to low density lipoprotein and is used as a marker for both activated, amoeboid microglia, as well as primed microglia (Holness and Simmons, 1993; Wong et al., 2005; Eggen et al., 2013). Its expression has furthermore been related to aging (Perry et al., 1993; Conde and Streit, 2006). Our results show that more CD68 expression is present in the OB compared to other brain regions, which suggests that an activated or primed state of microglia exists in the OB, as we also confirmed with IL-1β measures. It has been shown before in naïve mice that expression of activational markers, including MHCII, is relatively high in parenchymal microglia (Zhang et al., 2002) Together, this could be representative for the clear antigen-presenting function that microglial cells can have, and with the notion that microglia in the OB are already in a primed state under normal conditions. This suggests that OB-derived microglia may be more prone to priming than microglia derived from other gray matter brain regions, which in turn may lead to differential outcomes between different brain regions when confronted with pathological conditions, e.g., α-synuclein aggregation.
Similar to CD68, also the pro-inflammatory cytokine IL-1β was expressed at higher level in the OB relative to other regions. IL-1β is rapidly upregulated in response to various inflammatory triggers and exerts a wide range of biological and physiological effects on the immune, endocrine and nervous system (Rothwell, 1991; van Dam et al., 1992; Wang et al., 2008). Our results are in line with previous data demonstrating that IL-1β protein is abundantly present in the OB of rats (Lim and Brunjes, 1999). Of interest to note is that we have demonstrated, using knock-out mice that IL-1β contributes to microgliosis, i.e., elevated CD68 expression, in the OB, but not in the SN (Vroon et al., 2007). Our present data thus support the notion that expression of CD68 and IL-1β expression are related. The enhanced expression observed in the OB relative to other regions could be due to the important role of the OB in odor discrimination in rodents. In particular the close connections to the outside world may be of ultimate importance for the microglial cells to be in an easily alerted state to monitor and respond to possible changes in homeostasis.
In contrast to IL-1β and CD68, mRNA levels of TNFα were found to be increased in the SN and to be markedly low in the OB, relative to other brain regions. TNFα has been considered a possible key inflammatory regulator that can induce cytokine production and (Sriram et al., 2002; Kraft et al., 2009). In the CNS, microglia are the primary source of TNFα (Hanisch, 2002) and TNFα release by microglia has been implicated in neurotoxicity (Mogi et al., 1994; Taylor et al., 2005; Borrajo et al., 2014). Interestingly, a region-specific, but dual role for TNFα itself has been suggested, e.g., in the brain of MPTP treated mice. In this model, it was proposed that TNFα promotes neurodegeneration in the Str but has a protective role in the HC (Sriram et al., 2006). Here, whereas we did not find differences in baseline TNFα expression between HC and Str, high expression levels were present in the SN. This increase in TNFα expression in the SN under normal conditions may underlie the increased neuronal vulnerability seen in the SN following additional challenges, such as during the development of α-synuclein pathology (Watson et al., 2012). A protein typically known to be involved in oxidative cell stress responses is NOS-2. Since we could not detect NOS-2 in microglia derived from various brain regions, this supports the notion that the naïve rats we used did not experience cell stress, and that experimental handling conditions of our samples did not induce oxidative stress in the cell seither.
To further characterize microglial cell differences between different brain regions, we investigated their expression levels of several receptors. TLR2, a receptor for pathogen recognition, was recently implicated in the activation of microglia by α-synuclein in vitro (Beraud et al., 2011; Kim et al., 2013) and is thought to stimulate secretion of pro-inflammatory cytokines. Moreover, in tissue of PD patients, differences in TLR2 expression were found in microglia by us between the HC and SN of PD patients (Doorn et al., 2014b). Also overexpression of α-synuclein in rodents was reported to increase TLR2 mRNA specifically in the SN but not in other regions (Watson et al., 2012). However, in our current study using naïve rats, no differences were present in microglial TLR2 mRNA levels between the regions studied. This supports the idea that TLR2 is distributed in an evenly manner throughout the brain under normal conditions, and is mainly upregulated by microglia when they encounter specific pathogens, like α-synuclein, and as such, does not represent a marker for primed microglia.
Clear differences were found in CCR2 mRNA expression levels that were higher in the SN than in other gray matter regions. CCR2 is implicated in leukocyte migration and has recently been shown to be expressed by gray matter microglial cells and to be involved in cell proliferation (Hinojosa et al., 2011; Prins et al., 2014). In agreement, CCR2 deficiency markedly impaired microglial recruitment, accelerated β-amyloid accumulation and disease progression in a mouse model for Alzheimer’s disease (AD; El Khoury et al., 2007). Hence, the higher expression of CCR2 mRNA already at basal conditions in the SN could similarly be beneficial for microglial recruitment when homeostasis becomes disturbed. In contrast to AD, microglial recruitment in the SN is often associated with an aversive environment that could promote DA-ergic vulnerability to cell death in PD (Kim et al., 2000). The related high expression of TNFα in the SN (present study) thus supports an enhanced sensitivity of the SN to neurotoxicity.
As member of the purinergic receptor family, P2X7Rs are a class of ligand-gated ion channels activated by ATP that contributes to neuro- and glio-transmission. P2X7Rs are expressed by both neurons and glia in various brain regions and have been implicated in a wide variety of behaviors, including learning and memory (Chu et al., 2010; Burnstock et al., 2011) These receptors have also been described to be involved in responses to trauma, neurodegeneration, neuropsychiatric disorders and neuropathic pain (McLarnon et al., 2006; Burnstock et al., 2011; Carmo et al., 2014). Especially, the fast purinergic synaptic transmission that is in part mediated through these receptors, has been clearly identified (Pankratov et al., 2009) in a number of brain areas, including the HC (Mori et al., 2001; Pankratov et al., 2002). The higher P2X7R mRNA in the HC compared to other regions as observed in the present study could contribute to its role in regulating synaptic plasticity and memory formation in the HC (Wieraszko, 1996; Campos et al., 2014); this is likely an indirect effect via microglial cells (Chu et al., 2010). Alternatively, P2X7R on microglial cells are implicated in ATP-mediated microglial activation and cytokine release, of importance for brain disorders (Ni et al., 2013; Shieh et al., 2014). In addition, ATP-P2X7R signaling is involved in glial cell proliferation (Zou et al., 2012) which is apparent in the HC of presymptomatic PD patients (Doorn et al., 2014a). Thus, P2X7R in the HC has strategic implications for monitoring deviations in ATP levels resulting in cell proliferation and plasticity changes that likely contribute to adaptive behavior seen under disease conditions like PD.
Based on transcriptional profiling, proteomics and functional assays, microglia are typically classified into ‘classically’ activated microglia (M1 type) or ‘alternatively’ activated microglia (M2 type; Mantovani et al., 2004; Mosser and Edwards, 2008; Gordon and Martinez, 2010). M1 microglia are polarized by IFN-γ and then produce pro-inflammatory cytokines (e.g., IL-12, IL-1β, TNFα) and oxidative metabolites that can cause cytotoxicity. In contrast, IL-4, IL-10, and IL-13 polarize M2 microglia, which then downregulate pro-inflammatory cytokines, increase their expression of anti-inflammatory molecules and facilitate wound healing and repair, also within the damaged CNS (Mantovani et al., 2002; Kigerl et al., 2009; Gordon and Martinez, 2010; David and Kroner, 2011; Doorn et al., 2012). MSR1 and BDNF are proteins expressed by alternative activation of microglia and are related to growth factors, anti-inflammatory cytokine production and neuroprotection (Mantovani et al., 2002; Lucin and Wyss-Coray, 2009). The fact that these sets of genes were undetectable in our current study, whereas genes related to the classical activation state of microglia, e.g., CD68, IL-1β and TNFα were present, suggests that the brain region-specific differences in microglia gene expression profile under healthy conditions are more related to the classical activation pathway in these cells. This implies that genes expressed by alternatively activated microglia would become more important when homeostasis is derailed, but would remain undetectable under naïve conditions.
Conclusion
The present data demonstrate that a unique basal gene expression signature of microglia exists that differs between different gray matter brain regions of Wistar rats. Within the local brain microenvironment, glial cells play critical roles in the homeostatic mechanisms that support neuronal survival. Since the basal profile of microglia is more tuned toward a pro-inflammatory profile and in a region-dependent way, such region-specific gene expression profiles of microglia likely predict different outcomes under challenging and disease conditions. As such, region-specific differences in neuronal susceptibility in conditions like PD, could at least in part, be attributable to basal differences in levels of inflammation-related receptors and other factors that are endogenously, and differentially, produced by microglial cells.
Author Contributions
AvD and PL designed research; KD and JB performed research; IH and HB contributed analytic tools and protocols; KD, JB, BD, and AvD analyzed data; and KD, BD, AvD, and PL wrote the paper.
Acknowledgments
Tom O’Toole (Department Of Molecular Cell Biology and Immunology, VUmc) is thanked for his assistance with FACS sorting. We thank the International Parkinson Foundation for support (to PL, IH, and AvD).
Abbreviations
α-synuclein, alpha-synuclein; Aβ, amyloid-beta; AON, anterior olfactory nucleus; CA, cornus ammonis; GFAP, glial fibrillary acidic protein; HC, hippocampus; HPtau, hyperphosphorylated tau; Iba1, ionized calcium binding adaptor molecule 1; IL, interleukin; iLBD, incidental Lewy body disease; IR, immunoreactivity; LBs, Lewy bodies; LNs, Lewy neurites; MPTP, 1-methyl-4-phenyl-1,2,3,6-tetrahydropyridine; NFT, neurofibrillary tangles; OB, olfactory bulb; PD, Parkinson’s disease; SN, substantia nigra; TLR, toll like receptor; TNFα, tumor necrosis factor-alpha.
References
Aloisi, F. (2001). Immune function of microglia. Glia 36, 165–179. doi: 10.1002/glia.1106
PubMed Abstract | Full Text | CrossRef Full Text | Google Scholar
Amino, T., Orimo, S., Itoh, Y., Takahashi, A., Uchihara, T., and Mizusawa, H. (2005). Profound cardiac sympathetic denervation occurs in Parkinson disease. Brain Pathol. 15, 29–34. doi: 10.1111/j.1750-3639.2005.tb00097.x
PubMed Abstract | Full Text | CrossRef Full Text | Google Scholar
Beraud, D., Twomey, M., Bloom, B., Mittereder, A., Ton, V., Neitzke, K.,et al. (2011). α-Synuclein alters toll-like receptor expression. Front. Neurosci. 5:80. doi: 10.3389/fnins.2011.00080
Borrajo, A., Rodriguez-Perez, A. I., Diaz-Ruiz, C., Guerra, M. J., and Labandeira-Garcia, J. L. (2014). Microglial TNFα mediates enhancement of dopaminergic degeneration by brain angiotensin. Glia 62, 145–157. doi: 10.1002/glia.22595
PubMed Abstract | Full Text | CrossRef Full Text | Google Scholar
Braak, H., and Braak, E. (2000). Pathoanatomy of Parkinson’s disease. J. Neurol. 247, 3–10. doi: 10.1007/PL00007758
PubMed Abstract | Full Text | CrossRef Full Text | Google Scholar
Braak, H., Ghebremedhin, E., Rüb, U., Bratzke, H., and Del Tredici, K. (2004). Stages in the development of Parkinson’s disease-related pathology. Cell Tissue Res. 318, 121–134. doi: 10.1007/s00441-004-0956-9
PubMed Abstract | Full Text | CrossRef Full Text | Google Scholar
Burnstock, G., Krügel, U., Abbracchio, M. P., and Illes, P. (2011). Purinergic signalling: from normal behaviour to pathological brain function. Prog. Neurobiol. 95, 229–274. doi: 10.1016/j.pneurobio.2011.08.006
PubMed Abstract | Full Text | CrossRef Full Text | Google Scholar
Buschmann, J. P., Berger, K., Awad, H., Clarner, T., Beyer, C., and Kipp, M. (2012). Inflammatory response and chemokine expression in the white matter corpus callosum and gray matter cortex region during cuprizone-induced demyelination. J. Mol. Neurosci. 48, 66–76. doi: 10.1007/s12031-012-9773-x
PubMed Abstract | Full Text | CrossRef Full Text | Google Scholar
Campos, R. C., Parfitt, G. M., Polese, C. E., Coutinho-Silva, R., Morrone, F. B., and Barros, D. M. (2014). Pharmacological blockage and P2X7 deletion hinder aversive memories: reversion in an enriched environment. Neuroscience 280, 220–230. doi: 10.1016/j.neuroscience.2014.09.017
PubMed Abstract | Full Text | CrossRef Full Text | Google Scholar
Carmo, M. R., Menezes, A. P., Nunes, A. C., Pliássova, A., Rolo, A. P., Palmeira, C. M.,et al. (2014). The P2X7 receptor antagonist Brilliant Blue G attenuates contralateral rotations in a rat model of Parkinsonism through a combined control of synaptotoxicity, neurotoxicity and gliosis. Neuropharmacology 81, 142–152. doi: 10.1016/j.neuropharm.2014.01.045
PubMed Abstract | Full Text | CrossRef Full Text | Google Scholar
Chu, Y. X., Zhang, Y., Zhang, Y. Q., and Zhao, Z. Q. (2010). Involvement of microglial P2X7 receptors and downstream signaling pathways in long-term potentiation of spinal nociceptive responses. Brain. Behav. Immun. 24, 1176–1189. doi: 10.1016/j.bbi.2010.06.001
PubMed Abstract | Full Text | CrossRef Full Text | Google Scholar
Conde, J. R., and Streit, W. J. (2006). Microglia in the aging brain. J. Neuropathol. Exp. Neurol. 65, 199–203. doi: 10.1097/01.jnen.0000202887.22082.63
PubMed Abstract | Full Text | CrossRef Full Text | Google Scholar
Czeh, M., Gressens, P., and Kaindl, A. M. (2011). The Yin and Yang of Microglia. Dev. Neurosci. 33, 199–209. doi: 10.1159/000328989
PubMed Abstract | Full Text | CrossRef Full Text | Google Scholar
David, S., and Kroner, A. (2011). Repertoire of microglial and macrophage responses after spinal cord injury. Nat. Rev. Neurosci. 12, 388–399. doi: 10.1038/nrn3053
PubMed Abstract | Full Text | CrossRef Full Text | Google Scholar
De Haas, A. H., Boddeke, H. W., and Biber, K. (2008). Region specific expression of immunoregulatory proteins on microglia in the healthy CNS. Glia 56, 888–894. doi: 10.1002/glia.20663
PubMed Abstract | Full Text | CrossRef Full Text | Google Scholar
Dickson, D. W., Fujishiro, H., Orr, C., DelleDonne, A., Josephs, K. A., Frigerio, R.,et al. (2009). Neuropathology of non-motor features of Parkinson disease. Parkinsonism Relat. Disord. 15, S1–S5. doi: 10.1016/S1353-8020(09)70769-2
Doorn, K. J., Drukarch, B., van Dam, A. M., and Lucassen, P. J. (2014a). Hippocampal proliferation is increased in presymptomatic Parkinson’s disease and due to microglia. Neural. Plas. 2014, 13. doi: 10.1155/2014/959154
PubMed Abstract | Full Text | CrossRef Full Text | Google Scholar
Doorn, K. J., Moors, T., Drukarch, B., van de Berg, W. D. J., Lucassen, P. J., and van Dam, A. M. (2014b). Microglial phenotypes and Toll-like receptor 2 in the substantia nigra and hippocampus of incidental Lewy body disease cases and Parkinson’s disease patients. Acta Neuropathol. Commun. 90, 1–17. doi: 10.1186/s40478-014-0090-1
PubMed Abstract | Full Text | CrossRef Full Text | Google Scholar
Doorn, K. J., Goudriaan, A., Blits-Huizinga, C., Bol, J. G., Rozemuller, A. J., Hoogland, P. V.,et al. (2013). Increased amoeboid microglial density in the olfactory bulb of Parkinson’s and Alzheimer’s patients. Brain Pathol. 24, 152–165. doi: 10.1111/bpa.12088
PubMed Abstract | Full Text | CrossRef Full Text | Google Scholar
Doorn, K. J., Lucassen, P. J., Boddeke, H. W., Prins, M., Berendse, H. W., Drukarch, B.et al. (2012). Emerging roles of microglial activation and non-motor symptoms in Parkinson’s disease. Prog. Neurobiol. 98, 222–238. doi: 10.1016/j.pneurobio.2012.06.005
PubMed Abstract | Full Text | CrossRef Full Text | Google Scholar
Eggen, B. J. L., Raj, D., Hanisch, U. K., and Boddeke, H. W. (2013). Microglial phenotype and adaptation. J. Neuroimmune Pharmacol. 8, 807–823. doi: 10.1007/s11481-013-9490-4
PubMed Abstract | Full Text | CrossRef Full Text | Google Scholar
Ekdahl, C. T., Claasen, J. H., Bonde, S., Kokaia, Z., and Lindvall, O. (2003). Inflammation is detrimental for neurogenesis in adult brain. Proc. Natl. Acad. Sci. U.S.A. 100, 13632–13637. doi: 10.1073/pnas.2234031100
PubMed Abstract | Full Text | CrossRef Full Text | Google Scholar
El Khoury, J., Toft, M., Hickman, S. E., Means, T. K., Terada, K., Geula, C.,et al. (2007). Ccr2 deficiency impairs microglial accumulation and accelerates progression of Alzheimer-like disease. Nat. Med. 13, 432–438. doi: 10.1038/nm1555
PubMed Abstract | Full Text | CrossRef Full Text | Google Scholar
Ford, A. L., Foulcher, E., Goodsall, A. L., and Sedgwick, J. D. (1996). Tissue digestion with dispase substantially reduces lymphocyte and macrophage cell-surface antigen expression. J. Immunol. Methods. 194, 71–75. doi: 10.1016/0022-1759(96)00067-1
PubMed Abstract | Full Text | CrossRef Full Text | Google Scholar
Frank, M. G., Wieseler-Frank, J. L., Watkins, L. R., and Maier, S. F. (2006). Rapid isolation of highly enriched and quiescent microglia from adult rat hippocampus: immunophenotypic and functional characteristics. J. Neurosci. Methods 151, 121–130. doi: 10.1016/j.jneumeth.2005.06.026
PubMed Abstract | Full Text | CrossRef Full Text | Google Scholar
Gordon, S., and Martinez, F. O. (2010). Alternative activation of macrophages: mechanism and functions. Immunity 32, 593–604. doi: 10.1016/j.immuni.2010.05.007
PubMed Abstract | Full Text | CrossRef Full Text | Google Scholar
Halliday, G. M., and Stevens, C. H. (2011). Glia: initiators and progressors of pathology in Parkinson’s disease. Mov. Disord. 26, 6–17. doi: 10.1002/mds.23455
PubMed Abstract | Full Text | CrossRef Full Text | Google Scholar
Hanisch, U. K. (2002). Microglia as a source and target of cytokines. Glia 40, 140–155. doi: 10.1002/glia.10161
PubMed Abstract | Full Text | CrossRef Full Text | Google Scholar
Hanisch, U. K., and Kettenmann, H. (2007). Microglia: active sensor and versatile effector cells in the normal and pathologic brain. Nat. Neurosci. 10, 1387–1394. doi: 10.1038/nn1997
PubMed Abstract | Full Text | CrossRef Full Text | Google Scholar
Hart, A. D., Wyttenbach, A., Perry, V. H., and Teeling, J. L. (2012). Age related changes in microglial phenotype vary between CNS regions: grey versus white matter differences. Brain. Behav. Immun. 26, 754–765. doi: 10.1016/j.bbi.2011.11.006
PubMed Abstract | Full Text | CrossRef Full Text | Google Scholar
Hinojosa, A. E., Garcia-Bueno, B., Leza, J. C., and Madrigal, J. L. (2011). CCL2/MCP-1 modulation of microglial activation and proliferation. J. Neuroinflammation 8, 77–77. doi: 10.1186/1742-2094-8-77
PubMed Abstract | Full Text | CrossRef Full Text | Google Scholar
Hirsch, E. C., Vyas, S., and Hunot, S. (2012). Neuroinflammation in Parkinson’s disease. Parkinsonism Relat. Disord. 18, 210–212. doi: 10.1016/S1353-8020(11)70065-7
Holness, C. L., and Simmons, D. L. (1993). Molecular cloning of CD68, a human macrophage marker related to lysosomal glycoproteins. Blood 81, 1607–1613.
Imamura, K., Hishikawa, N., Sawada, M., Nagatsu, T., Yoshida, M., and Hashizume, Y. (2003). Distribution of major histocompatibility complex class II-positive microglia and cytokine profile of Parkinson’s disease brains. Acta Neuropathol. 106, 518–526. doi: 10.1007/s00401-003-0766-2
PubMed Abstract | Full Text | CrossRef Full Text | Google Scholar
Ito, D., Imai, Y., Ohsawa, K., Nakajima, K., Fukuuchi, Y., and Kohsaka, S. (1998). Microglia-specific localisation of a novel calcium binding protein, Iba1. Mol. Brain Res. 57, 1–9. doi: 10.1016/S0169-328X(98)00040-0
PubMed Abstract | Full Text | CrossRef Full Text | Google Scholar
Jellinger, K. A. (2011). Synuclein deposition and non-motor symptoms in Parkinson disease. J. Neurol. Sci. 310, 107–111. doi: 10.1016/j.jns.2011.04.012
PubMed Abstract | Full Text | CrossRef Full Text | Google Scholar
Kettenmann, H., Hanisch, U. K., Noda, M., and Verkhratsky, A. (2011). Physiology of microglia. Physiol. Rev. 91, 461–553. doi: 10.1152/physrev.00011.2010
PubMed Abstract | Full Text | CrossRef Full Text | Google Scholar
Kigerl, K. A., Gensel, J. C., Ankeny, D. P., Alexander, J. K., Donnelly, D. J., and Popovich, P. G. (2009). Identification of two distinct macrophage subsets with divergent effects causing either neurotoxicity or regeneration in the injured mouse spinal cord. J. Neurosci. 29, 13435–13444. doi: 10.1523/JNEUROSCI.3257-09.2009
PubMed Abstract | Full Text | CrossRef Full Text | Google Scholar
Kim, C., Ho, D. H., Suk, J. E., You, S., Michael, S., Kang, J.,et al. (2013). Neuron-released oligomeric α-synuclein is an endogenous agonist of TLR2 for paracrine activation of microglia. Nat. Commun. 4, 1562. doi: 10.1038/ncomms2534
PubMed Abstract | Full Text | CrossRef Full Text | Google Scholar
Kim, W. G., Mohney, R. P., Wilson, B., Jeohn, G. H., Liu, B., and Hong, J. S. (2000). Regional difference in susceptibility to lipopolysaccharide-induced neurotoxicity in the rat brain: role of microglia. J. Neurosci. 20, 6309–6316.
Kraft, A. D., McPherson, C. A., and Harry, G. J. (2009). Heterogeneity of microglia and TNF signaling as determinants for neuronal death or survival. Neurotoxicology. 30, 785–793. doi: 10.1016/j.neuro.2009.07.001
PubMed Abstract | Full Text | CrossRef Full Text | Google Scholar
Lacombe, F., Durrieu, F., Briais, A., Dumain, P., Belloc, F., Bascans, E.,et al. (1997). Flow cytometry CD45 gating for immunophenotyping of acute myeloid leukemia. Leukemia 11, 1878–1886. doi: 10.1038/sj.leu.2400847
Lawson, L. J., Perry, V. H., Dri, P., and Gordon, S. (1990). Heterogeneity in the distribution and morphology of microglia in the normal adult mouse brain. Neuroscience 39, 151–170. doi: 10.1016/0306-4522(90)90229-W
Lim, J. H., and Brunjes, P. C. (1999). Activity-dependent regulation of interleukin-1β immunoreactivity in the developing rat olfactory bulb. Neuroscience 93, 371–374. doi: 10.1016/S0306-4522(99)00093-7
Lucin, K. M., and Wyss-Coray, T. (2009). Immune activation in brain aging and neurodegeneration: too much or too little? Neuron 64, 110–122. doi: 10.1016/j.neuron.2009.08.039
PubMed Abstract | Full Text | CrossRef Full Text | Google Scholar
Mantovani, A., Sica, A., Sozzani, S., Allavena, P., Vecchi, A., and Locati, M. (2004). The chemokine system in diverse forms of macrophage activation and polarization. Trends Immunol. 25, 677–686. doi: 10.1016/j.it.2004.09.015
PubMed Abstract | Full Text | CrossRef Full Text | Google Scholar
Mantovani, A., Sozzani, S., Locati, M., Allavena, P., and Sica, A. (2002). Macrophage polarization: tumor-associated macrophages as a paradigm for polarized M2 mononuclear phagocytes. Trends Immunol. 23, 549–555. doi: 10.1016/S1471-4906(02)02302-5
PubMed Abstract | Full Text | CrossRef Full Text | Google Scholar
McGeer, P. L., Itagaki, S., Boyes, B. E., and McGeer, E. G. (1988). Reactive microglia are positive for HLA DR in the substantia nigra of Parkinson’s and Alzheimer’s disease brains. Neurology 38, 1285–1286. doi: 10.1212/WNL.38.8.1285
PubMed Abstract | Full Text | CrossRef Full Text | Google Scholar
McGeer, P. L., and McGeer, E. G. (2008). Glial reactions in Parkinson’s disease. Mov. Disord. 23, 474–483. doi: 10.1002/mds.21751
PubMed Abstract | Full Text | CrossRef Full Text | Google Scholar
McLarnon, J. G., Ryu, J. K., Walker, D. G., and Choi, H. B. (2006). Upregulated expression of purinergic P2X7 receptor in Alzheimer disease and amyloid-[beta] peptide-treated microglia and in peptide-injected rat hippocampus. J. Neuropathol. Exp. Neurol. 65, 1090–1097. doi: 10.1097/01.jnen.0000240470.97295.d3
PubMed Abstract | Full Text | CrossRef Full Text | Google Scholar
Melief, J., Koning, N., Schuurman, K. G., Van De Garde, M. D., Smolders, J., Hoek, R. M.,et al. (2012). Phenotyping primary human microglia: tight regulation of LPS responsiveness. Glia 60, 1506–1517. doi: 10.1002/glia.22370
PubMed Abstract | Full Text | CrossRef Full Text | Google Scholar
Melief, J., Schuurman, K. G., Garde, M. D., Smolders, J., Eijk, M., Hamann, J.,et al. (2013). Microglia in normal appearing white matter of multiple sclerosis are alerted but immunosuppressed. Glia 61, 1848–1861. doi: 10.1002/glia.22562
PubMed Abstract | Full Text | CrossRef Full Text | Google Scholar
Mittelbronn, M., Dietz, K., Schluesener, H. J., and Meyermann, R. (2001). Local distribution of microglia in the normal adult human central nervous system differs by up to one order of magnitude. Acta Neuropathol. 101, 249–255.
Mogi, M., Harada, M., Riederer, P., Narabayashi, H., Fujita, K., and Nagatsu, T. (1994). Tumor necrosis factor-[alpha](TNF-[alpha]) increases both in the brain and in the cerebrospinal fluid from parkinsonian patients. Neurosci. Lett. 165, 208–210. doi: 10.1016/0304-3940(94)90746-3
PubMed Abstract | Full Text | CrossRef Full Text | Google Scholar
Mori, M., Heuss, C., Gähwiler, B. H., and Gerber, U. (2001). Fast synaptic transmission mediated by P2X receptors in CA3 pyramidal cells of rat hippocampal slice cultures. J. Physiol. 535, 115–123. doi: 10.1111/j.1469-7793.2001.t01-1-00115.x
PubMed Abstract | Full Text | CrossRef Full Text | Google Scholar
Mosser, D. M., and Edwards, J. P. (2008). Exploring the full spectrum of macrophage activation. Nat. Rev. Immunol. 8, 958–969. doi: 10.1038/nri2448
PubMed Abstract | Full Text | CrossRef Full Text | Google Scholar
Ni, J., Wang, P., Zhang, J., Chen, W., and Gu, L. (2013). Silencing of the P2X(7) receptor enhances amyloid-β phagocytosis by microglia. Biochem. Biophys. Res. Commun. 434, 363–369. doi: 10.1016/j.bbrc.2013.03.079
PubMed Abstract | Full Text | CrossRef Full Text | Google Scholar
Nimmerjahn, A., Kirchhoff, F., and Helmchen, F. (2005). Resting microglial cells are highly dynamic surveillants of brain parenchyma in vivo. Science 308, 1314–1318. doi: 10.1126/science.1110647
PubMed Abstract | Full Text | CrossRef Full Text | Google Scholar
Olah, M., Biber, K., Vinet, J., and Boddeke, H. W. G. M. (2011). Microglia phenotype diversity. CNS Neurol. Disord. Drug Targets 10, 108–118. doi: 10.2174/187152711794488575
Olah, M., Raj, D., Brouwer, N., De Haas, A. H., Eggen, B. J. L., Den Dunnen, W. F. A.,et al. (2012). An optimized protocol for the acute isolation of human microglia from autopsy brain samples. Glia 60, 96–111. doi: 10.1002/glia.21251
PubMed Abstract | Full Text | CrossRef Full Text | Google Scholar
Orimo, S., Takahashi, A., Uchihara, T., Mori, F., Kakita, A., Wakabayashi, K.,et al. (2007). Degeneration of cardiac sympathetic nerve begins in the early disease process of Parkinson’s disease. Brain Pathol. 17, 24–30. doi: 10.1111/j.1750-3639.2006.00032.x
PubMed Abstract | Full Text | CrossRef Full Text | Google Scholar
Orre, M., Kamphuis, W., Osborn, L. M., Melief, J., Kooijman, L., Huitinga, I.,et al. (2014). Acute isolation and transcriptome characterization of cortical astrocytes and microglia from young and aged mice. Neurobiol. Aging 35, 1–14. doi: 10.1016/j.neurobiolaging.2013.07.008
PubMed Abstract | Full Text | CrossRef Full Text | Google Scholar
Pankratov, Y. V., Lalo, U. V., and Krishtal, O. A. (2002). Role for P2X receptors in long-term potentiation. J. Neurosci. 22, 8363–8369.
Pankratov, Y., Lalo, U., Krishtal, O. A., and Verkhratsky, A. (2009). P2X receptors and synaptic plasticity. Neuroscience 158, 137–148. doi: 10.1016/j.neuroscience.2008.03.076
PubMed Abstract | Full Text | CrossRef Full Text | Google Scholar
Peng, Z. C., Kristensson, K., and Bentivoglio, M. (1998). Distribution and temporal regulation of the immune response in the rat brain to intracerebroventricular injection of interferon-y. Exp. Neurol. 154, 403–417. doi: 10.1006/exnr.1998.6943
PubMed Abstract | Full Text | CrossRef Full Text | Google Scholar
Perry, V. H., Cunningham, C., and Holmes, C. (2007). Systemic infections and inflammation affect chronic neurodegeneration. Nat. Rev. Immunol. 7, 161–167. doi: 10.1038/nri2015
PubMed Abstract | Full Text | CrossRef Full Text | Google Scholar
Perry, V. H., Matyszak, M. K., and Fearn, S. (1993). Altered antigen expression of microglia in the aged rodent CNS. Glia 7, 60–67. doi: 10.1002/glia.440070111
PubMed Abstract | Full Text | CrossRef Full Text | Google Scholar
Perry, V. H., Nicoll, J. A. R., and Holmes, C. (2010). Microglia in neurodegenerative disease. Nat. Rev. Neurol. 6, 193–201. doi: 10.1038/nrneurol.2010.17
PubMed Abstract | Full Text | CrossRef Full Text | Google Scholar
Prins, M., Dutta, R., Baselmans, B., Brevé, J. J. P., Bol, J. G. J. M., Deckard, S. A.,et al. (2014). Discrepancy in CCL2 and CCR2 expression in white versus grey matter hippocampal lesions of Multiple Sclerosis patients. Acta neuropathol. Commun. 2, 98. doi: 10.1186/s40478-014-0098-6 [Epub ahead of print].
Ransohoff, R. M., and Perry, V. H. (2009). Microglial physiology: unique stimuli, specialized responses. Annu. Rev. Immunol. 27, 119–145. doi: 10.1146/annurev.immunol.021908.132528
PubMed Abstract | Full Text | CrossRef Full Text | Google Scholar
Ren, L. Q., Lubrich, B., Biber, K., and Gebicke-Haerter, P. J. (1999). Differential expression of inflammatory mediators in rat microglia cultured from different brain regions. Mol. Brain Res. 65, 198–205. doi: 10.1016/S0169-328X(99)00016-9
PubMed Abstract | Full Text | CrossRef Full Text | Google Scholar
Rothwell, N. J. (1991). Functions and mechanisms of interleukin 1 in the brain. Trends Pharmacol. Sci. 12, 430–436. doi: 10.1016/0165-6147(91)90623-Z
Roy, A., Fung, Y. K., Liu, X., and Pahan, K. (2006). Up-regulation of microglial CD11b expression by nitric oxide. J. Biol. Chem. 281, 14971–14980. doi: 10.1074/jbc.M600236200
PubMed Abstract | Full Text | CrossRef Full Text | Google Scholar
Ruijter, J. M., Ramakers, C., Hoogaars, W. M. H., Karlen, Y., Bakker, O., and Van den Hoff, M. J. B. (2009). Amplification efficiency: linking baseline and bias in the analysis of quantitative PCR data. Nucleic Acids Res. 37, e45–e45. doi: 10.1093/nar/gkp045
PubMed Abstract | Full Text | CrossRef Full Text | Google Scholar
Sedgwick, J. D., Schwender, S., Imrich, H., Dörries, R., Butcher, G. W., and ter Meulen, V. (1991). Isolation and direct characterization of resident microglial cells from the normal and inflamed central nervous system. Proc. Natl. Acad. Sci. U.S.A. 88, 7438–7442. doi: 10.1073/pnas.88.16.7438
PubMed Abstract | Full Text | CrossRef Full Text | Google Scholar
Shieh, C.-H., Heinrich, A., Serchov, T., Calker, D., and Biber, K. (2014). P2X7 dependent, but differentially regulated release of IL 6, CCL2, and TNF α in cultured mouse microglia. Glia 62, 592–607. doi: 10.1002/glia.22628
PubMed Abstract | Full Text | CrossRef Full Text | Google Scholar
Sriram, K., Matheson, J. M., Benkovic, S. A., Miller, D. B., Luster, M. I., and O’Callaghan, J. P. (2002). Mice deficient in TNF receptors are protected against dopaminergic neurotoxicity: implications for Parkinson’s disease. FASEB J. 16, 1474–1476.
Sriram, K., Matheson, J. M., Benkovic, S. A., Miller, D. B., Luster, M. I., and O’Callaghan, J. P. (2006). Deficiency of TNF receptors suppresses microglial activation and alters the susceptibility of brain regions to MPTP-induced neurotoxicity: role of TNF-α. FASEB J. 20, 670–682. doi: 10.1096/fj.05-5106com
PubMed Abstract | Full Text | CrossRef Full Text | Google Scholar
Stirling, D. P., and Yong, V. W. (2008). Dynamics of the inflammatory response after murine spinal cord injury revealed by flow cytometry. J. Neurosci. Res. 86, 1944–1958. doi: 10.1002/jnr.21659
PubMed Abstract | Full Text | CrossRef Full Text | Google Scholar
Taylor, D. L., Jones, F., Kubota, E. S., and Pocock, J. M. (2005). Stimulation of microglial metabotropic glutamate receptor mGlu2 triggers tumor necrosis factor α induced neurotoxicity in concert with microglial-derived Fas ligand. J. Neurosci. 25, 2952–2964. doi: 10.1523/JNEUROSCI.4456-04.2005
PubMed Abstract | Full Text | CrossRef Full Text | Google Scholar
Torres-Platas, S. G., Comeau, S., Rachalski, A., Dal Bo, G., Cruceanu, C., Turecki, G.,et al. (2014). Morphometric characterization of microglial phenotypes in human cerebral cortex. J. Neuroinflamm. 11, 12. doi: 10.1186/1742-2094-11-12
PubMed Abstract | Full Text | CrossRef Full Text | Google Scholar
van Dam, A. M., Brouns, M., Louisse, S., and Berkenbosch, F. (1992). Appearance of interleukin-1 in macrophages and in ramified microglia in the brain of endotoxin-treated rats: a pathway for the induction of non-specific symptoms of sickness? Brain Res. 588, 291–296. doi: 10.1016/0006-8993(92)91588-6
PubMed Abstract | Full Text | CrossRef Full Text | Google Scholar
Vroon, A., Drukarch, B., Bol, J. G. J. M., Cras, P., Brevé, J. J. P., and Allan, S. M.,et al. (2007). Neuroinflammation in Parkinson’s patients and MPTP-treated mice is not restricted to the nigrostriatal system: microgliosis and differential expression of interleukin-1 receptors in the olfactory bulb. Exp. Gerontol. 42, 762–771. doi: 10.1016/j.exger.2007.04.010
PubMed Abstract | Full Text | CrossRef Full Text | Google Scholar
Wake, H., Moorhouse, A. J., Miyamoto, A., and Nabekura, J. (2013). Microglia: actively surveying and shaping neuronal circuit structure and function. Trends Neurosci. 36, 209–217. doi: 10.1016/j.tins.2012.11.007
PubMed Abstract | Full Text | CrossRef Full Text | Google Scholar
Walter, L., and Neumann, H. (2009). Role of microglia in neuronal degeneration and regeneration. Semin. Immunopathol. 31, 513–525. doi: 10.1007/s00281-009-0180-5
PubMed Abstract | Full Text | CrossRef Full Text | Google Scholar
Wang, P., Rothwell, N. J., Pinteaux, E., and Brough, D. (2008). Neuronal injury induces the release of pro-interleukin-1beta from activated microglia in vitro. Brain Res. 1236, 1–7. doi: 10.1016/j.brainres.2008.08.001
PubMed Abstract | Full Text | CrossRef Full Text | Google Scholar
Watson, M. B., Richter, F., Lee, S. K., Gabby, L., Wu, J., Masliah, E.,et al. (2012). Regionally-specific microglial activation in young mice over-expressing human wildtype alpha-synuclein. Exp. Neurol. 237, 318–334. doi: 10.1016/j.expneurol.2012.06.025
PubMed Abstract | Full Text | CrossRef Full Text | Google Scholar
Welser, J. V., Li, L., and Milner, R. (2010). Microglial activation state exerts a biphasic influence on brain endothelial cell proliferation by regulating the balance of TNF and TGF- 1. J. Neuroinflamm. 7, 89–96. doi: 10.1186/1742-2094-7-89
PubMed Abstract | Full Text | CrossRef Full Text | Google Scholar
Wieraszko, A. (1996). Extracellular ATP as a neurotransmitter: its role in synaptic plasticity in the hippocampus. Acta Neurobiol. Exp. (Warsz) 56, 637–648.
Wong, A. M., Patel, N. V., Patel, N. K., Wei, M., Morgan, T. E., de Beer, M. C.,et al. (2005). Macrosialin increases during normal brain aging are attenuated by caloric restriction. Neurosci. Lett. 390, 76–80. doi: 10.1016/j.neulet.2005.07.058
PubMed Abstract | Full Text | CrossRef Full Text | Google Scholar
Xie, Z., Morgan, T. E., Rozovsky, I., and Finch, C. E. (2003). Aging and glial responses to lipopolysaccharide in vitro: greater induction of IL-1 and IL-6, but smaller induction of neurotoxicity. Exp. Neurol. 182, 135–141. doi: 10.1016/S0014-4886(03)00057-8
PubMed Abstract | Full Text | CrossRef Full Text | Google Scholar
Zhang, G. X., Li, J., Ventura, E., and Rostami, A. (2002). Parenchymal microglia of naïve adult C57BL/6J mice express high levels of B7. 1, B7. 2, and MHC class II. Exp. Mol. Pathol. 73, 35–45. doi: 10.1006/exmp.2002.2441
Zou, J., Vetreno, R. P., and Crews, F. T. (2012). ATP P2X7 receptor signaling controls basal and TNF-α stimulated glial cell proliferation. Glia 60, 661–673. doi: 10.1002/glia.22302
PubMed Abstract | Full Text | CrossRef Full Text | Google Scholar
Keywords: Parkinson’s disease, substantia nigra, hippocampus, olfactory bulb, microglia, FACS
Citation: Doorn KJ, Brevé JJP, Drukarch B, Boddeke HW, Huitinga I, Lucassen PJ and van Dam A-M (2015) Brain region-specific gene expression profiles in freshly isolated rat microglia. Front. Cell. Neurosci. 9:84. doi: 10.3389/fncel.2015.00084
Received: 19 December 2014; Accepted: 23 February 2015;
Published online: 12 March 2015.
Edited by:
Shawn Hayley, Carleton University, CanadaReviewed by:
Andrew MacLean, Tulane University School of Medicine, USARobert Weissert, University of Regensburg, Germany
Copyright © 2015 Doorn, Brevé, Drukarch, Boddeke, Huitinga, Lucassen and van Dam. This is an open-access article distributed under the terms of the Creative Commons Attribution License (CC BY). The use, distribution or reproduction in other forums is permitted, provided the original author(s) or licensor are credited and that the original publication in this journal is cited, in accordance with accepted academic practice. No use, distribution or reproduction is permitted which does not comply with these terms.
*Correspondence: Anne-Marie van Dam, Neuroscience Campus Amsterdam, Department Anatomy and Neurosciences, VU University Medical Center, Van der Boechorststraat 7, 1081 BT Amsterdam, NetherlandsYW13LnZhbmRhbUB2dW1jLm5s