 Daniel Althof
 David Baehrens1
 Masahiko Watanabe
 Noboru Suzuki
 Bernd Fakler
 Ákos Kulik
- 1Institute of Physiology, University of Freiburg, Freiburg, Germany
- 2Department of Anatomy, Graduate School of Medicine, Hokkaido University, Sapporo, Japan
- 3Department of Animal Genomics, Functional Genomics Institute, Mie University, Mie, Japan
- 4Centre for Biological Signalling Studies, University of Freiburg, Freiburg, Germany
Tuning of the time course and strength of inhibitory and excitatory neurotransmitter release is fundamental for the precise operation of cortical network activity and is controlled by Ca2+ influx into presynaptic terminals through the high voltage-activated P/Q-type Ca2+ (Cav2.1) channels. Proper channel-mediated Ca2+-signaling critically depends on the topographical arrangement of the channels in the presynaptic membrane. Here, we used high-resolution SDS-digested freeze-fracture replica immunoelectron microscopy together with automatized computational analysis of Cav2.1 immunogold labeling to determine the precise subcellular organization of Cav2.1 channels in both inhibitory and excitatory terminals. Immunoparticles labeling the pore-forming α1 subunit of Cav2.1 channels were enriched over the active zone of the boutons with the number of channels (3–62) correlated with the area of the synaptic membrane. Detailed analysis showed that Cav2.1 channels are non-uniformly distributed over the presynaptic membrane specialization where they are arranged in clusters of an average five channels per cluster covering a mean area with a diameter of about 70 nm. Importantly, clustered arrangement and cluster properties did not show any significant difference between GABAergic and glutamatergic terminals. Our data demonstrate a common nano-architecture of Cav2.1 channels in inhibitory and excitatory boutons in stratum radiatum of the hippocampal CA1 area suggesting that the cluster arrangement is crucial for the precise release of transmitters from the axonal boutons.
Introduction
A balance between inhibitory and excitatory synaptic transmission is essential for the normal functioning of cortical neuronal circuits. The net effect of synaptic inhibition and excitation is determined by the firing properties of inhibitory GABAergic and excitatory glutamatergic cells as well as by the release dynamics of GABA- and glutamate-filled vesicles. The transmitter release is primarily triggered by Ca2+ influx through voltage-gated Ca2+ (Cav) channels (Clapham, 2007) that are activated by action potentials and/or sub-threshold depolarizing signals (Schneggenburger and Neher, 2005; Nadkarni et al., 2010). Consequently, number, density and spatial relationship of Cav channels relative to the active zone of the presynaptic boutons, the actual locus of vesicle fusion, are assumed to be crucial factors in fine-tuning the temporal precision of transmitter release (Eggermann et al., 2012; Scimemi and Diamond, 2012; Sheng et al., 2012). At fast mammalian central synapses the subfamily two Cav channels, Cav2.1 (P/Q-type) and Cav2.2 (N-type), are essential for coupling the presynaptic action potential to transmitter release (Wu and Saggau, 1994; Stevens, 2004; Cao and Tsien, 2010; Ariel et al., 2013) thus controlling the efficacy of transmission (Poncer et al., 1997; Catterall and Few, 2008; Lipscombe et al., 2013).
In the CA1 area of the hippocampus, pyramidal cells are under the control of inhibitory GABAergic and excitatory glutamatergic cells. GABAergic inputs originating mainly from local interneurons, controlling the firing rate of pyramidal cells and modulate their spike timing as well as synchronize their activity (Klausberger, 2009). In contrast, glutamatergic inputs arriving predominantly from pyramidal cells in CA3 and entorhinal cortex carry predictions based on memory recall and sensory information, respectively (Lisman, 1999; Otmakhova and Lisman, 2004). Thus, inhibitory and excitatory projections, targeting different subcellular domains of the CA1 principal cells, exert distinct effects on concerted and synchronous activities of hippocampal neurons and overall on rhythmic brain activities by released GABA and glutamate. The amount and kinetics of neurotransmitter release related to the intracellular Ca2+ concentration ([Ca2+]i) needs to be tightly regulated in terminals by Ca2+ entry through Cav channels, as even small changes in presynaptic Ca2+ influx lead to large changes in vesicle release and neurotransmission (Frank, 2014). This raises the question of whether hippocampal inhibitory and excitatory synapses are similar or fundamentally different regarding the subcellular organization of the Cav channels. The Ca2+-dependent synchronous release of neurotransmitters require the concerted compliance of various functionally interacting proteins forming the Cav2 channel-associated networks, termed nano-environment (Müller et al., 2010), in presynaptic compartments. The spatial arrangements of these specific proteins may determine the two-dimensional distribution pattern of Cav2 channels in membrane segments of axonal boutons thereby placing the channel at a position optimal for triggering the release machinery. Although, recent functional studies achieved substantial progress in localizing Cav2 channels in cortical inhibitory (Bucurenciu et al., 2008; Kisfali et al., 2013) and excitatory (Kulik et al., 2004; Holderith et al., 2012; Parajuli et al., 2012; Indriati et al., 2013; Baur et al., 2015) synapses as well as at the calyx of Held (Nakamura et al., 2015), qualitative and quantitative comparison of Cav2.1 channel topographical arrangement in small presynaptic boutons in the CA1 area of the hippocampus remained unresolved.
Here, we combined the high-resolution sodium dodecyl sulfate-digested freeze-fracture replica labeling (SDS-FRL) immunoelectron microscopy with automatized computational cluster analysis of immunoreactivity to determine the number and the spatial distribution profile of Cav2.1 channels in terminals of both GABAergic and glutamatergic cells in the stratum radiatum of the hippocampal CA1 region.
Materials and Methods
Sodium Dodecyl Sulfate-Digested Freeze-Fracture Replica Immunolabeling (SDS-FRL) and Electron Microscopy
Immunolabeling
For the current study 6-week-old male Wistar rats (n = 6), one adult male Cav2.1 knock-out (ko) mouse, and one adult male wild type (wt) mouse were used. The perfusion of the animals and preparation of tissues and replicas for SDS-FRL were performed as described previously (Kulik et al., 2006; Masugi-Tokita and Shigemoto, 2007). Care and handling of the animals prior to and during the experimental procedures followed European Union regulations and was approved by the Animal Care and Use Committees of the authors’ institutions. Animals were anesthetized with sodium pentobarbital (50 mg/kg, i.p.), and the hearts were surgically exposed for perfusion fixation. First, the vascular system was flushed by 25 mM phosphate-buffered saline (PBS) followed by transcardial perfusion with a fixative containing 2% paraformaldehyde (Merck, Germany) and 15% saturated picric acid made up in 0.1 M phosphate buffer (PB). Sagittal sections from the CA1 area were cut on a microslicer at a thickness of 110 μm. The slices were cryoprotected in a solution containing 30% glycerol made up in 0.1 M PB and then frozen by a high-pressure freezing machine (HPM 100, Leica, Austria). Frozen samples were inserted into a double replica table and then fractured into two pieces at -130°C. Fractured faces were replicated by deposition of carbon (5 nm thickness), platinum (2 nm), and carbon (18 nm) in a freeze-fracture replica machine (BAF 060, BAL-TEC, Lichtenstein). They were digested in a solution containing 2.5% SDS and 20% sucrose made up in 15 mM Tris buffer (TB), pH 8.3, at 80°C for 18 h. Replicas were washed in 50 mM Tris-buffered saline (TBS) containing 0.05% BSA (Roth, Germany) and 0.1% Tween20 (Tw20, Roth) and then incubated in a blocking solution (5% BSA) and then in mixtures of primary antibodies: (i) Cav2.1 [Guinea pig (Gp), 5 μg/ml] and RIM1/2 [Rabbit (Rb), 1 μg/ml; Synaptic System, Göttingen, Germany], (ii) vesicular GABA transporter (VGAT, Gp, 4.5 μg/ml) and Cav2.1 (Rb, 1 μg/ml; Synaptic System, Göttingen), (iii) vesicular glutamate transporter-1 (VGLUT-1, Rb, 6 μg/ml) and Cav2.1 (Gp, 5 μg/ml), (iv) VGAT (Gp, 4.5 μg/ml) and VGLUT-1 (Rb, 6 μg/ml) in 50 mM TBS containing 1% BSA and 0.1% Tw20 overnight (O/N) at room temperature. Replicas were reacted with a mixture of gold-coupled (10 and 15 nm or 5 and 10 nm) goat anti-guinea pig and goat anti-rabbit IgGs secondary antibodies (1:30; BioCell Research Laboratories, Cardiff, UK) made up in 50 mM TBS containing 5% BSA O/N at 15°C.
Electron Microscopy
The labeled replicas were examined using a transmission electron microscope (Philips CM100).
Control Experiments
The specificity of immunolabeling for Cav2.1 was controlled by staining of sections obtained from wt and ko mice. In wt animals [VGAT-Cav2.1 (n = 76 terminals; VGLUT-1-Cav2.1 (n = 40)] the pattern of immunostaining was identical to that of rat, whereas in ko mouse [VGAT-Cav2.1 (n = 68); VGLUT-1-Cav2.1 (n = 53)] no immunolabeling for the channel subunit was detected further confirming the specificity of the antibodies.
Quantification of Immunogold Distribution
The distribution of immunogold labeling for Cav2.1 was evaluated using an in-house developed automatized computational procedure. As an input, the underlying algorithm used x- and y-coordinates (in pixels) of the particles that were extracted from electron micrographs with the ImageJ software package (Schneider et al., 2012). The plasma membrane area covered with immunoparticles was calculated using the convex hull, the smallest area containing all particles as well as every line segment between all pairs of particles that was determined with the QuickHull algorithm (Barber et al., 1996). The cluster-assignment was obtained from the single-link method (Sibson, 1973). Accordingly, particles are assigned to the same cluster if their distances fall below a given threshold length that was set to 21 nm around the center of a gold particle. This distance is equivalent to the combined length of the radius of the 10 nm gold particle and the lengths of primary and secondary antibodies (2 × 8 nm = length of two IgGs, Figure 4A) (Amiry-Moghaddam and Ottersen, 2013).
To validate the clustering of Cav2.1 immunoparticles our computational procedure was applied to random samples that were generated as follows: for each putative active zone, an equal number of control particles was randomly placed within a frame defined by the coordinates of the outer most particles (Figure 4D). When the size of the putative active zone was large enough while maintaining an equal number of particles they were placed not closer than 10 nm, which corresponds to the diameter of a gold particle and avoids overlap of two neighboring particles. The final random control for any active zone was the average of ten individually generated random distributions.
Control Experiments
To assure that clustering of Cav2.1 channels is not due to an artifact by the secondary antibody we investigated the subcellular distribution of VGAT and VGLUT-1 as well as the GluRδ2 receptor by using the same 10 nm gold-coupled secondary antibodies. These proteins showed a distribution pattern different from Cav2.1 and did not form clusters. The automatized computational cluster analysis of immunoreactivity for GluRδ2 showed no significant difference compared to a random uniform sampling regarding both cohesion (p = 0.069) and separation (p = 0.86).
Statistical Analysis
Immunoreactivity for Cav2.1 was quantitatively analyzed in putative active zones of GABAergic, putative glutamatergic and glutamatergic boutons (n = 54 for VGAT+, n = 67 for VGAT-, n = 90 for VGLUT-1+) obtained from two animals. Absolute numbers of Cav2.1 immunoparticles per active zone were compared using the Mann–Whitney test. Correlation of the number of Cav2.1 and the respective convex hull area was determined by the Spearman coefficient of correlation (rs). Clusters of immunogold particles in VGAT+ and VGAT- boutons as well as in VGAT+ and VGLUT-1+ boutons as regards cohesion and separation were compared using the cumulative probability distributions and by performing the two-sample Kolmogorov–Smirnov test. The number of clusters per active zone, particles per clusters, and diameter of clusters in VGAT+ and VGAT- boutons as well as in VGAT+ and VGLUT-1+ boutons were statistically compared using the two-sample Kolmogorov–Smirnov test. Statistical significance was assessed by a p-value threshold of 0.05.
Results
Cav2.1 Protein is Localized to the Active Zones of Axon Terminals
All antibodies used target intracellular epitopes and, therefore, result in labeling of the protoplasmic face (P-face) of the replicas. First, we determined the distribution of the Cav2.1 channels at presynaptic sites. Immunogold labeling for the channel’s pore-forming α1 subunit was observed in the active zone of axon terminals that were recognized by their high density of intramembrane particles (IMPs) on the P-face of the invaginated plasma membrane and were identified by immunolabeling for the presynaptic marker proteins RIM1/2 (Figures 1A,B). Quantitative analysis further revealed a high degree of co-localization of Cav2.1 and RIM1/2 in the majority (81%) of the investigated terminals (n = 303; Figure 1C), indicating that Cav2.1 channels are mainly confined to the active zone of boutons in the stratum radiatum of CA1.
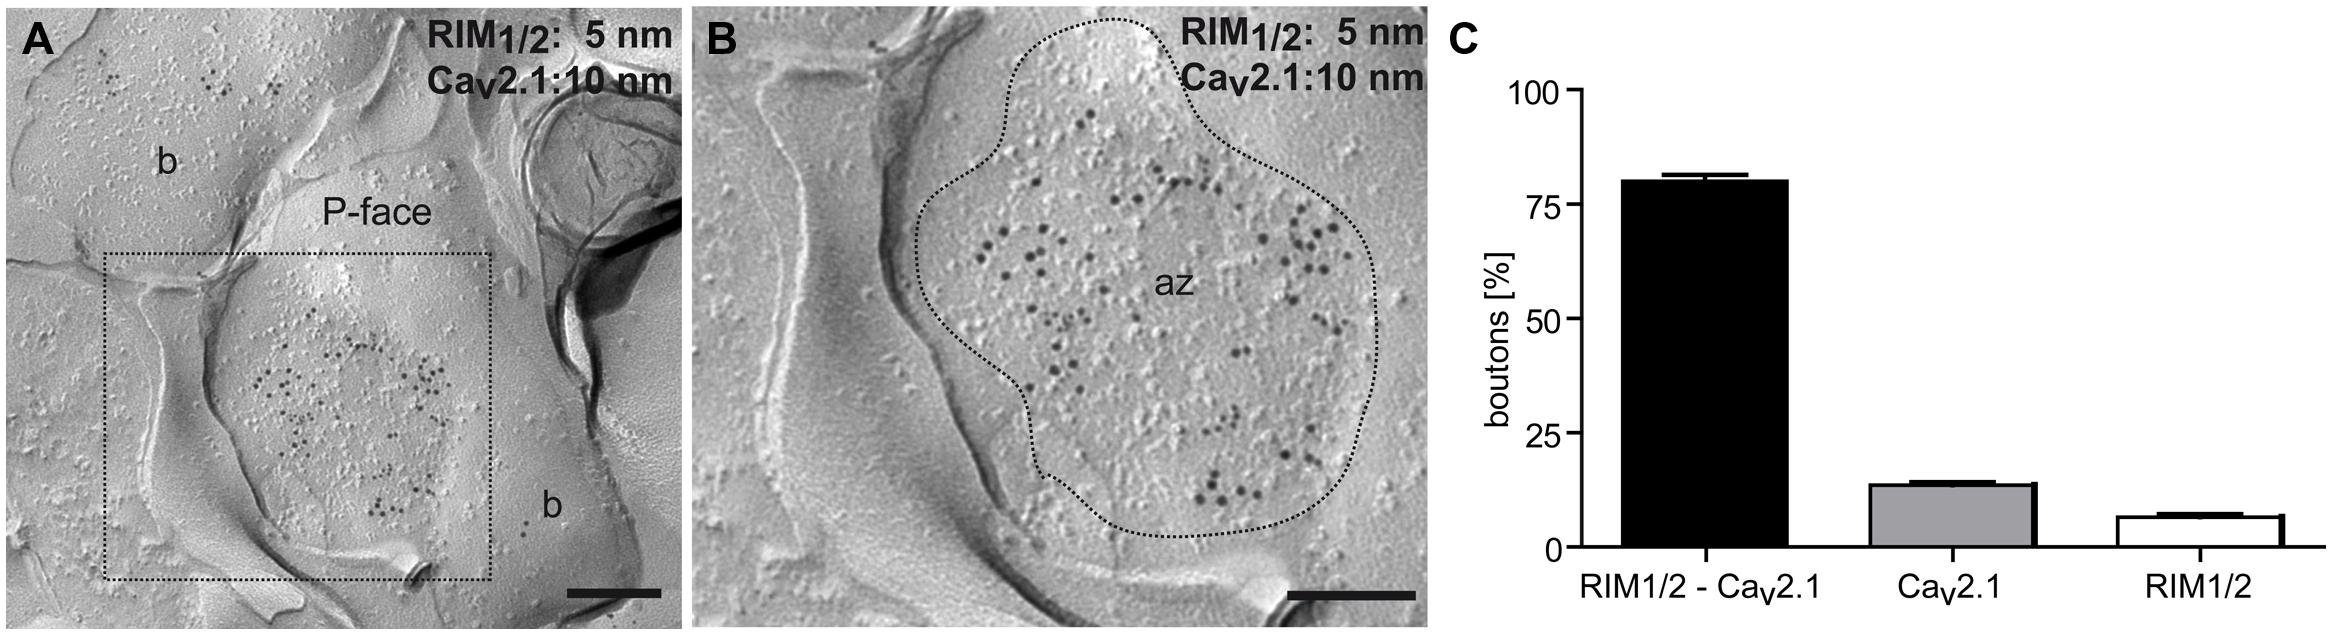
FIGURE 1. Cav2.1 localized to the active zone of axon terminals of hippocampal cells. (A,B) Colocalization of Cav2.1 (10 nm gold particles) and the presynaptic marker proteins RIM1/2 (5 nm gold particles) in the active zone (az) of a bouton (b; inset, B) as assessed by the SDS-FRL method. The presynaptic active zone is indicated by the high density of intramembrane particles (IMPs) on the concave shape of the protoplasmic face (P-face) of the membrane (delineated by broken line). (C) Bar graph summarizing labeling and co-labeling of Cav2.1 and RIM1/2 in 303 axon terminals. Note co-labeling in the majority of terminals (81%). Scale bars, 0.2 μm.
Inhibitory and Excitatory Boutons Show Similar Arrangement of Cav2.1
Next we compared the distribution of immunoparticles labeling Cav2.1 in axon terminals of inhibitory GABAergic and excitatory glutamatergic neurons. For this purpose, three series of double immunolabeling experiments were performed: (i) labeling for vesicular GABA transporter (VGAT) and vesicular glutamate transporter-1 (VGLUT-1), (ii) labeling for VGAT and Cav2.1, and (iii) labeling for VGLUT-1 and Cav2.1. Immunoreactivity for VGAT and VGLUT-1 appeared in two non-overlapping subpopulations of boutons (Figure 2A): 15% of the terminals (n = 328) showed immunoreactivity for VGAT, while 85% of them were labeled for VGLUT-1 (Figure 2B). To directly compare the localization of Cav2.1 in GABAergic and glutamatergic terminals we then analyzed replicas double labeled for VGAT and the channel subunit. Inhibitory terminals were recognized from immunoreactivity for VGAT (VGAT+; Figures 2C,D), whereas VGAT- putative excitatory boutons were adjacent to postsynaptic dendritic spines that were characterized by a high density of IMPs on the exoplasmic face (E-face) of the membrane (Figures 2E,F) that represent AMPA-type glutamate receptors in the postsynaptic membrane of asymmetrical synapses (Holderith et al., 2012). Immunoparticles for Cav2.1 were highly concentrated in the synaptic membrane and were distributed non-homogeneously over small (Figures 2C,E) and large (Figures 2D,F) active zones of the terminals of both populations of neurons. Similar to VGAT- terminals, excitatory boutons, visualized by immunoreactivity for VGLUT-1 (VGLUT-1+), showed a non-homogeneous pattern for Cav2.1 distribution: gold particles labeling the channel protein were confined to the presynaptic membrane specialization where they formed discrete groups throughout the active zones (Figures 2G,H).
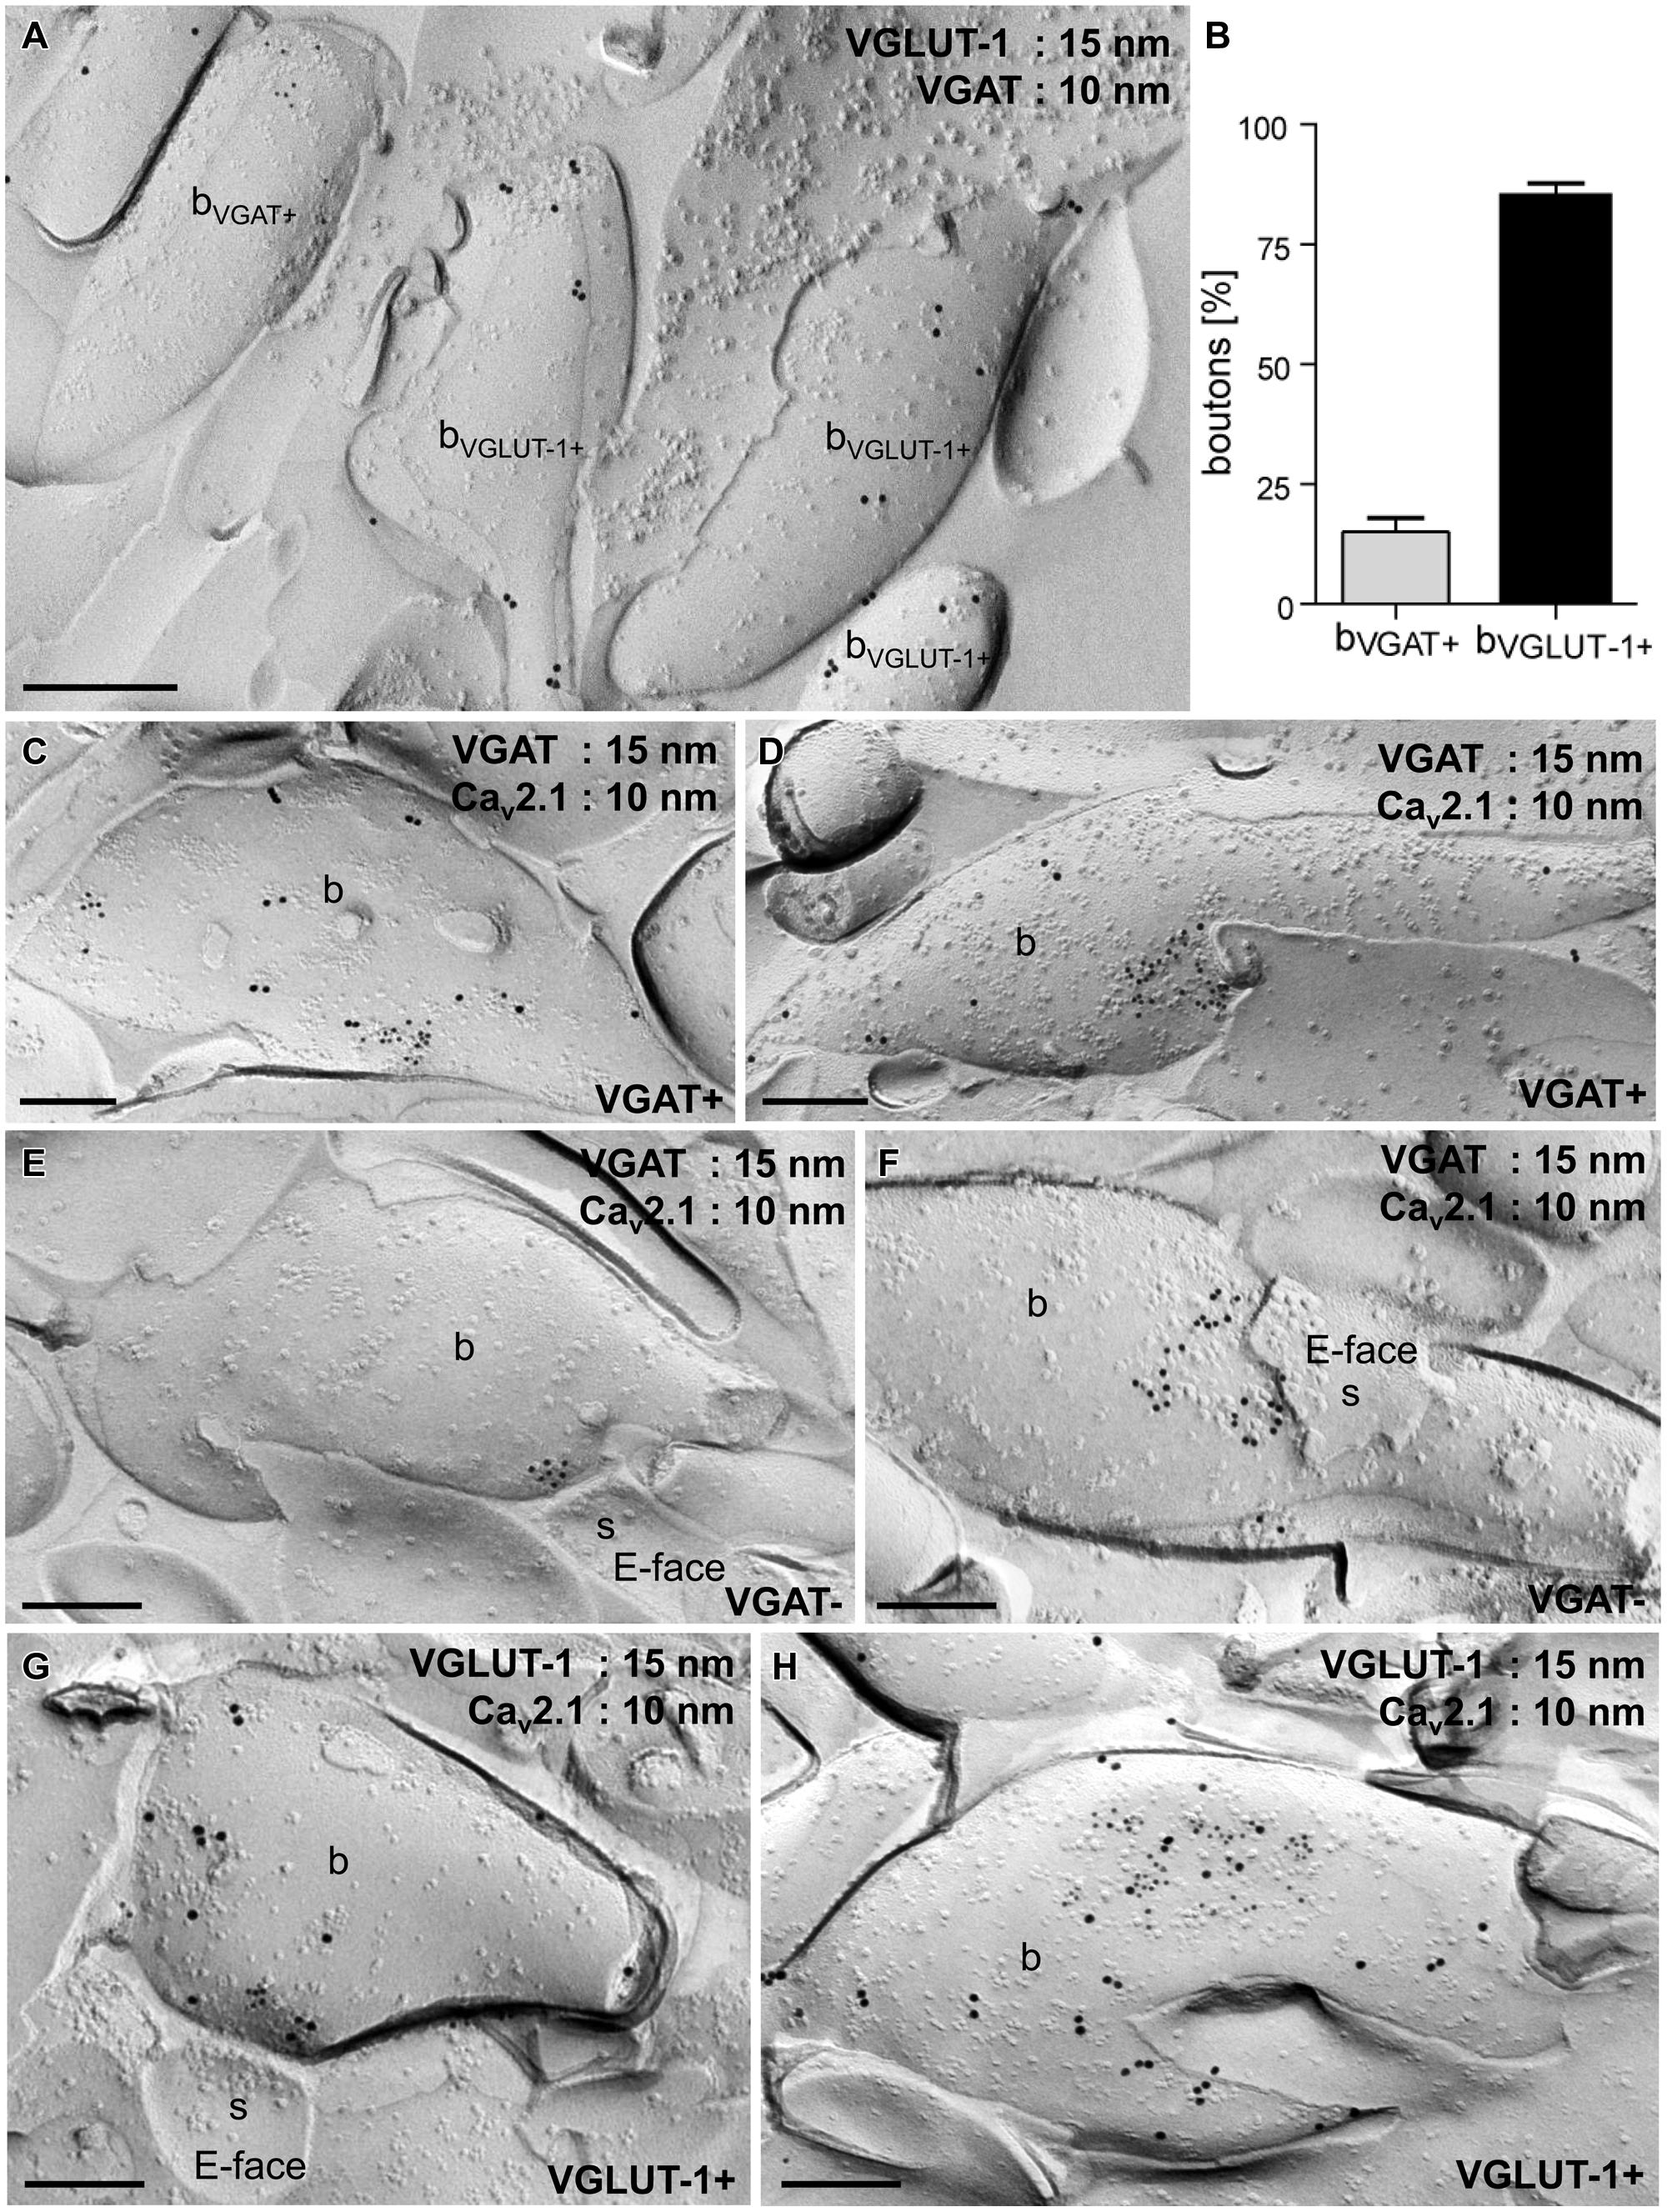
FIGURE 2. Cav2.1 channels are organized in discrete groups in the presynaptic active zone of boutons in inhibitory GABAergic and excitatory glutamatergic cells in the stratum radiatum of the hippocampal CA1 area. (A) Electron micrograph of a replica double-labeled for vesicular GABA transporter (VGAT; 10 nm gold particles) and VGLUT-1 (15 nm) showing no overlap between the two subpopulations. (B) Quantification of gold particles further demonstrated that 15% of the examined axon terminals (n = 328) were VGAT+ (bVGAT+) and 85% were immunoreactive for VGLUT-1 (bVGLUT-1+). (C–H) Replica images showing aggregation of immunogold particles labeling Cav2.1 (10 nm) in small (C,E,G) and large (D,F,H) active zones of VGAT+ (15 nm; C,D), VGAT- (E,F) and VGLUT-1+ (15 nm; G,H) boutons (b). Note that VGAT- and VGLUT-1+ terminals make asmmetrical synapses with dendritic spines (s in E,F,G) that can be recognized by the high density of IMPs on the E-face of the plasma membrane. Scale bars, 0.2 μm.
These results indicate that Cav2.1 channels display similar distribution patterns with clustered appearance in the synaptic membrane of axon terminals of both GABAergic and glutamatergic neurons in the stratum radiatum of CA1.
Next we determined the absolute number of Cav2.1 immunogold particles in the presynaptic active zones and correlated them with the convex hull area of either type of bouton. These analyses showed that the number of Cav2.1 immunogold particles was highly variable ranging from 3 to 62 per active zone in all the three subpopulations of axon terminals [median (mdn) = 14 and (interquartile range (iqr) = 10–23] determined in 54 active zones of VGAT+, mdn = 18 (iqr = 11–26) in 67 active zones of VGAT- and mdn = 13 (iqr = 9–23) in 90 active zones of VGLUT-1+ neurons from two animals, Figure 3A. These quantifications revealed no significant difference between VGAT+ and VGAT- groups of neurons (p = 0.22, Mann–Whitney test), neither between VGAT- and VGLUT-1+ terminals (p = 0.11; Figure 3A). In addition, plotting the number of immunoparticles labeling Cav2.1 against the convex hull area indicated a strong correlation between the number of Cav channels and the synaptic area in both inhibitory and excitatory boutons [Figures 3B–D; Spearman correlation coefficient (rS) 0.83, 0.92, and 0.86 for VGAT+, VGAT- and VGLUT-1+ terminals, respectively].
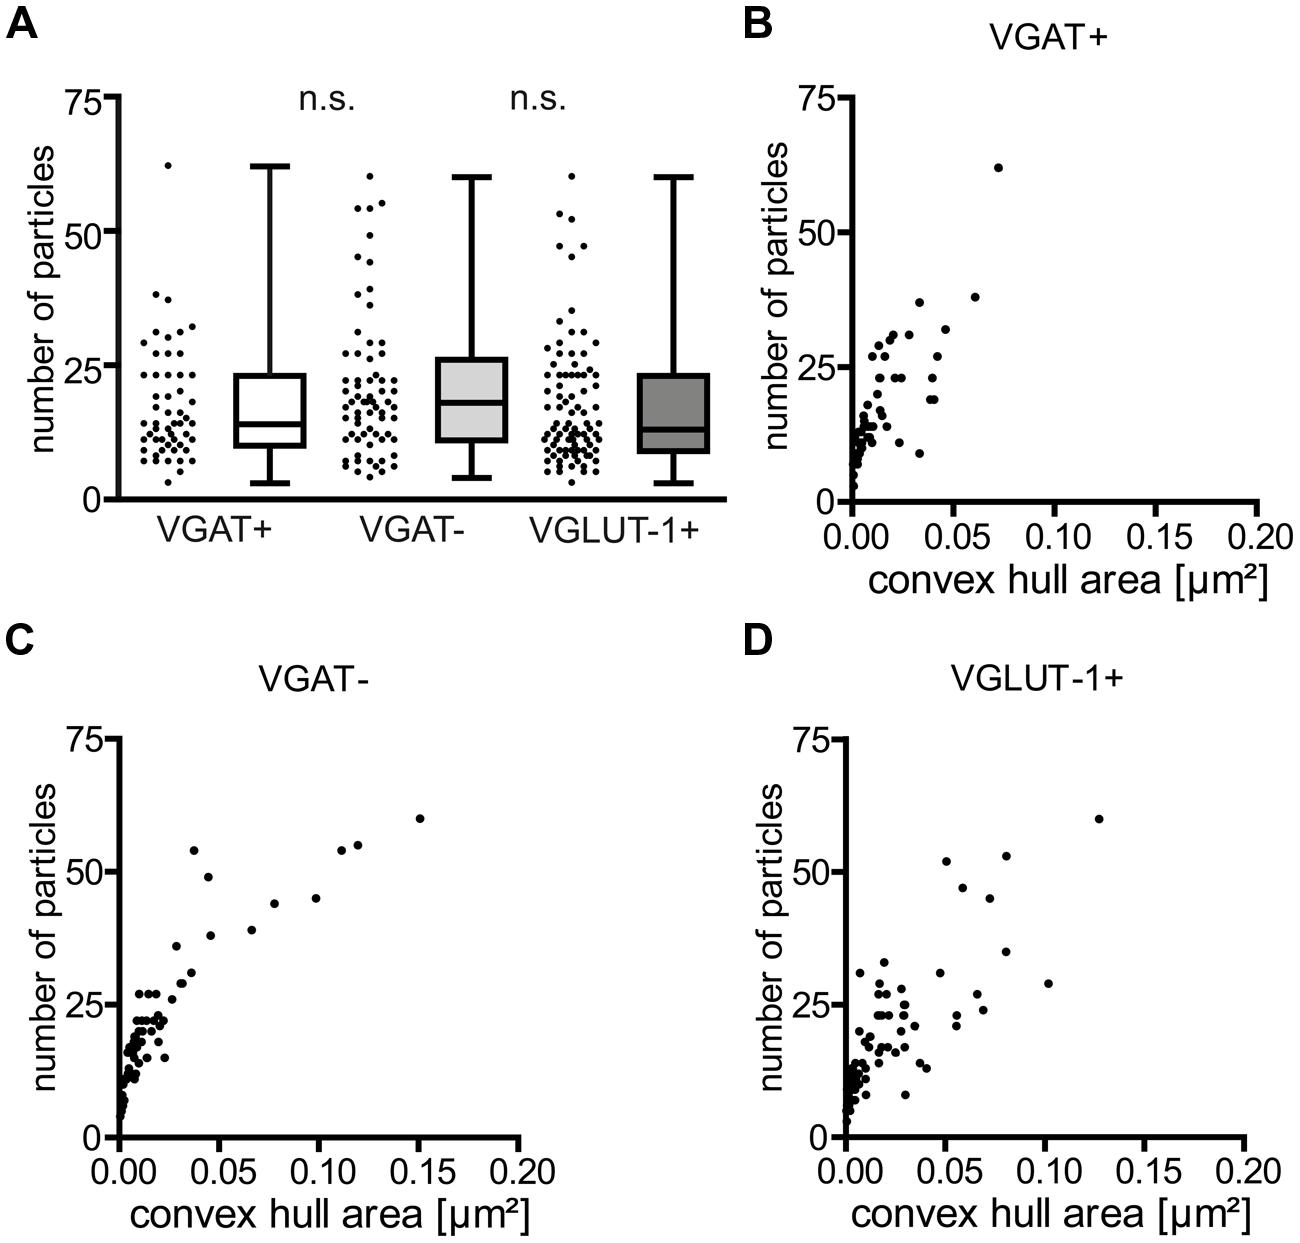
FIGURE 3. The number of immunoparticles for Cav2.1 channels is highly variable and proportional to the active zone area of the boutons. (A) Summary plot (scatter plot: single values, box-, and whisker plots: median, interquartile range (iqr) as well as minimum and maximum) of Cav2.1 particles in the indicated terminals. Note the lack of differences between the distinct types of boutons (p = 0.22 and p = 0.11), Mann–Whitney test between VGAT+ and VGAT- and between VGAT- and VGLUT-1+ terminals. (B–D) The number of immunogold particles labeling Cav2.1 strongly correlated with the convex hull area of both GABAergic and glutamatergic boutons [Spearman correlation coefficient (rs) = 0.83 for VGAT+; rs = 0.92 for VGAT-; rs = 0.86 for VGLUT-1+].
Together, these analyses showed that the number of Cav2.1 channels, despite clear synapse-to-synapse variation, is proportional to the area of active zones suggesting that their overall density in axon terminals of GABAergic and glutamatergic neurons in the stratum radiatum of CA1 is rather constant.
Cav2.1 Proteins are Organized in Clusters within the Active Zone of Boutons
For unbiased and quantitative assessment of the distribution of Cav2.1 channels in the active zone, we set up a computational procedure performing automatized distribution analysis based on distances between neighboring immunoparticles (see Materials and Methods). Moreover, the underlying algorithm uses agglomerative clustering of particles when their distances fall below a threshold value that is given by the combined length of the primary and secondary antibodies as well as the radius of the gold particles (21 nm; Figures 4A,B). Accordingly, particles located within distances of ≤42 nm from each other are assigned to a common cluster (Figure 4C).
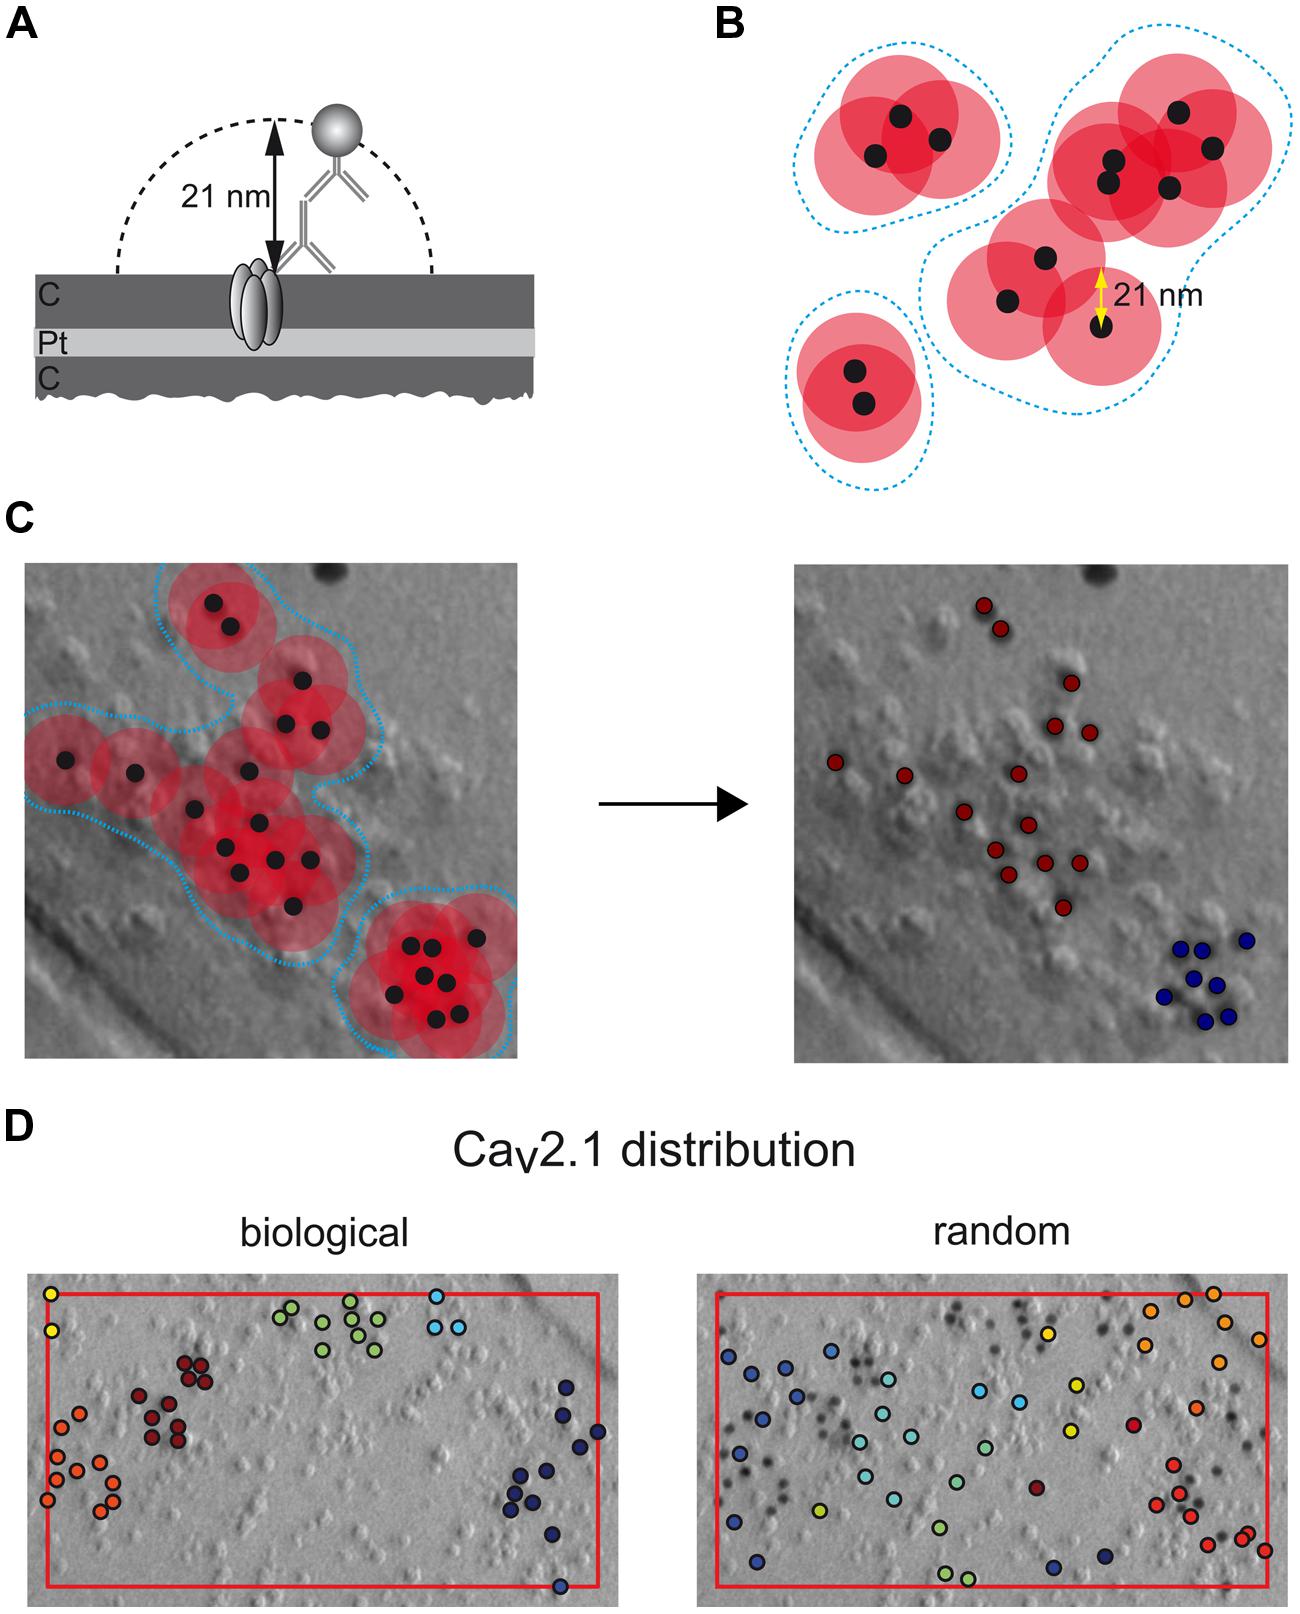
FIGURE 4. Rational and operation of the automatized computational procedure used for quantitative assessment of immunoparticle distribution. (A) Spatial constraints arising from the Cav2.1 (embedded into the carbon (C) and platinum (Pt) layers of the replica) labeling by primary and secondary antibodies (8 nm each) and the gold particle (10 nm). (B) Agglomerative clustering of immunoparticles (black dots) using a maximal inter-particle distance of 42 nm (overlapping circles in red); blue broken lines frame individual clusters of immunoparticles derived by this distance constraint (overlapping vs non-overlapping circles). (C,D) Operation of the computational procedure: all immunoparticles (black dots) detected in an electron micrograph are evaluated for inter-particle distances based on their 2D-coordinates and grouped into clusters as shown in (B). (C) Application to a set of Cav2.1 particles (left image) resulting in the assignment of two distinct clusters (right image). (D) Comparison of a clustered distribution (‘biological’) determined by the algorithm for a set of Cav2.1 particles in an axon terminal (area given by box framed in red) and a random sample (‘random’) generated by randomly distributing the same number of particles on an area identical to that determined in the terminal.
Using this computer-assisted analysis, we first probed the significance of clustered organization of Cav2.1 channels illustrated above (Figures 1 and 2) over random distribution. For this purpose, we determined the distributions of (i) distances between nearest neighboring particles (‘cohesion,’ Figures 5A,C,E) and of (ii) shortest distances between two clusters (‘separation,’ Figures 5B,D,F), in active zones of VGAT+, VGAT-, and VGLUT-1+ terminals (biological distribution, Figure 4D, left panel) and in ‘random controls’ (Figure 4D, right panel). For the latter, the same number of particles was positioned randomly within the same area as determined for the respective active zones (red framed box, Figure 4D, and see also Materials and Methods).
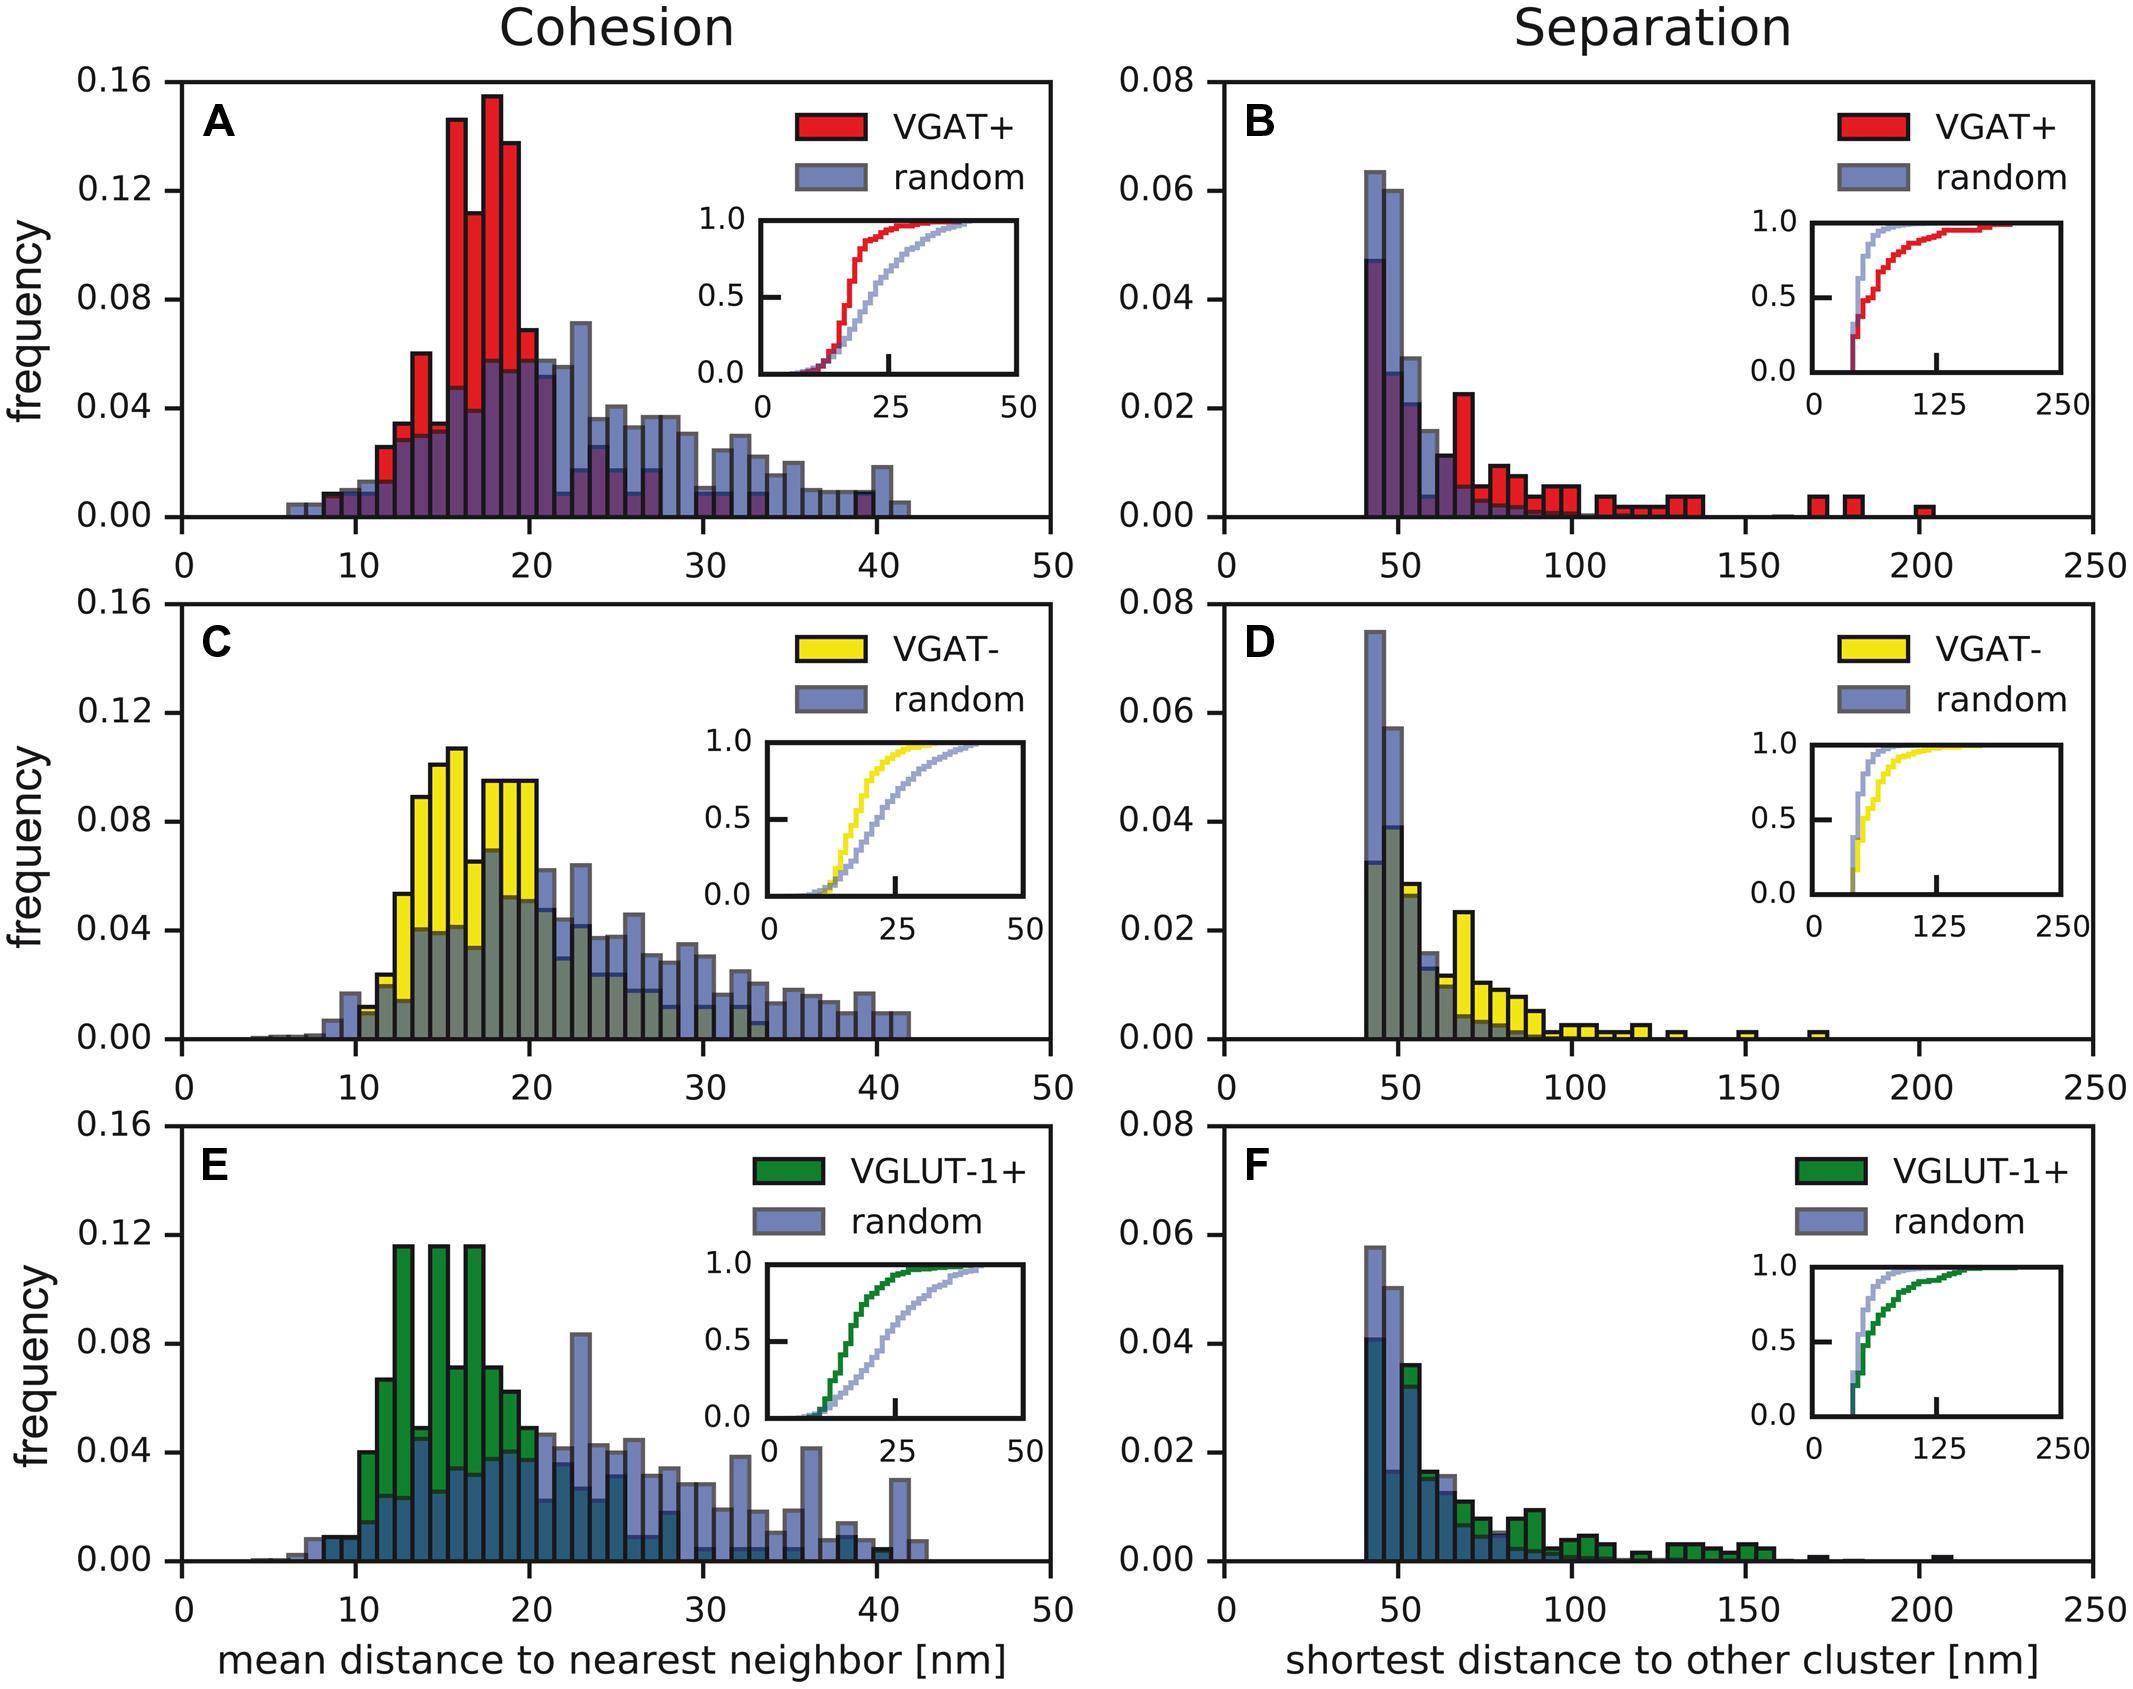
FIGURE 5. Distinct distribution of Cav2.1 channels in active zones of presynaptic boutons and in random controls. (A–F) Distances between nearest Cav2.1 particles (‘cohesion,’ A,C,E) and shortest distances between distinct clusters (‘separation,’ B,D,F) determined in active zones of VGAT+ (A,B; red), VGAT- (C,D; yellow), VGLUT-1+ terminals (E,F; green) and in random control samples (blue). Insets: cumulative frequency distributions indicating significant differences between biological data (VGAT+, red; VGAT-, yellow; VGLUT-1+, green) and random controls (blue; two-sample Kolmogorov–Smirnov test; p < 0.05, exact p-values given in Table 1).
As illustrated in Figure 5 and summarized in Table 1, the cohesion determined in the various types of boutons was almost identical (values for the median of 18 and 16 nm for VGAT+, VGAT-, and VGLUT-1+ terminals, respectively), but in either case was significantly stronger than the cohesion obtained in random control samples (respective medians of 25, 23, and 23 nm, respectively; p < 0.05 two-sample Kolmogorov–Smirnov test, Figures 5A,C,E; Table 1). Conversely, the separation between clusters was significantly larger in all actual terminals than in random controls (values for the median of 61 and 48 nm (VGAT+), 56 and 48 nm (VGAT-), 58 and 50 nm (VGLUT-1+); p < 0.05 two-sample Kolmogorov–Smirnov test, Figures 5B,D,F; Table 1). These results were independent of the distance constraints, as biological distributions were still significantly different from the respective random controls upon variation of the maximal inter-particle distance between 35 and 55 nm (Table 2).
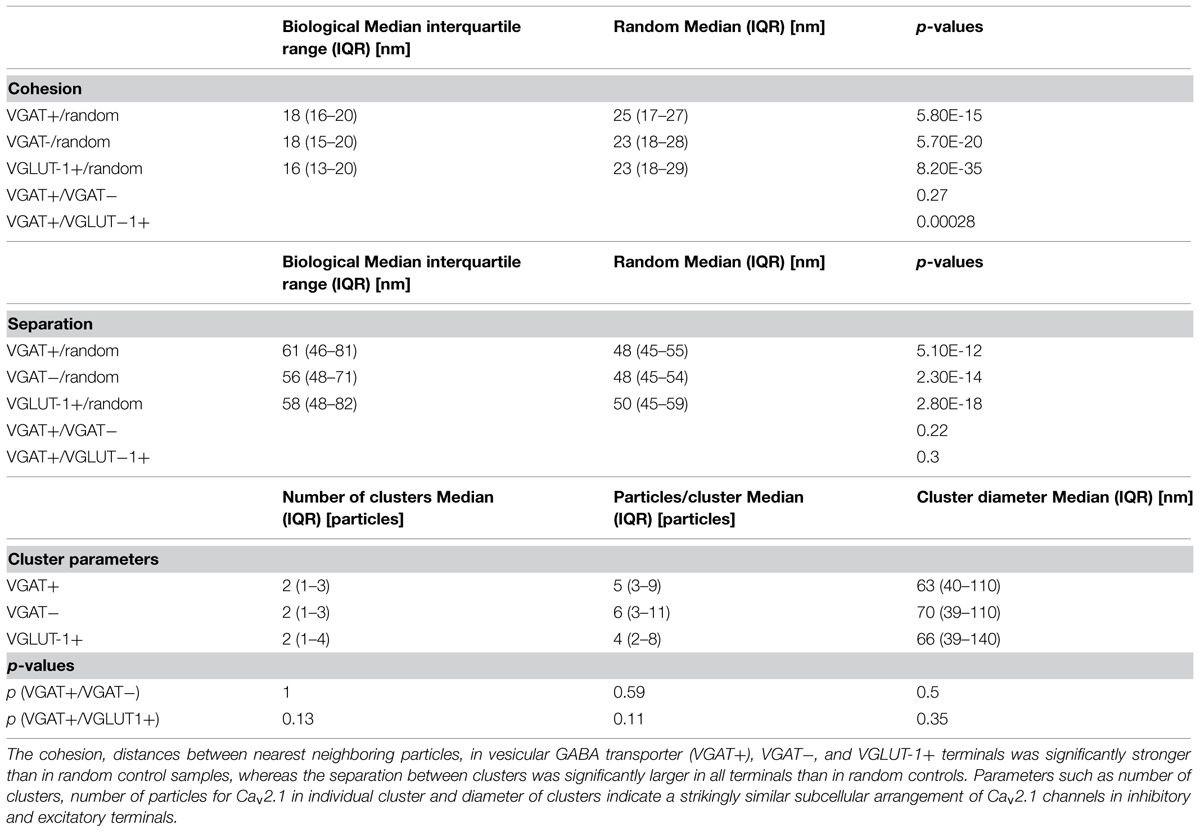
TABLE 1. Analysis of Cav2.1 immunogold distribution in inhibitory and excitatory boutons.
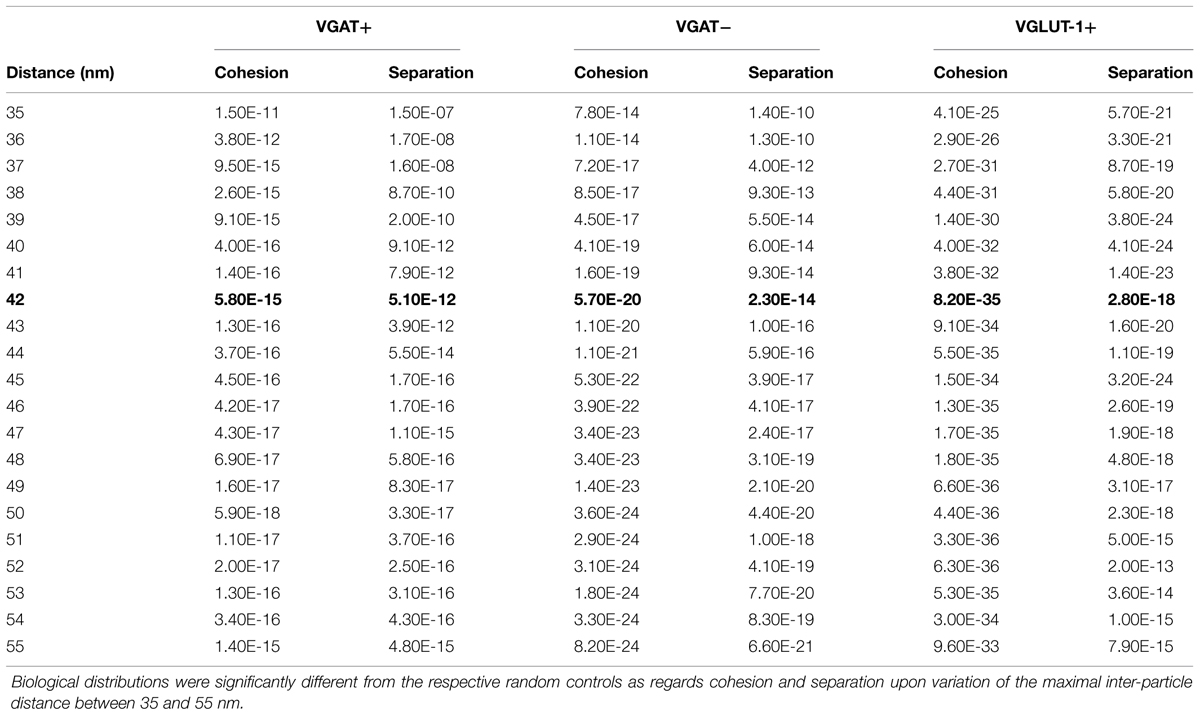
TABLE 2. Parameter scan of inter-particle distances.
Together, these computational analyses indicated that Cav2.1 channels are in fact organized in clusters over the active zones of both inhibitory and excitatory axon terminals.
The Nano-Architecture of Cav2.1 Channels is Shared between the Active Zones of Inhibitory and Excitatory Boutons
Direct comparison of cohesion and separation of the Cav2.1 clustering did not reveal statistically significant differences between inhibitory and excitatory terminals (Figures 6A–D), strongly suggesting a more general architecture that is shared among presynaptic compartments of different types of neurons. The slight difference observed for the cohesion between VGAT+ and VGLUT-1+ terminals is most likely due to the distinct primary antibodies that target different epitopes on the channel protein and may distinctly impact the spatial arrangements of the gold grains and, therefore, the distances between nearest neighboring particles.
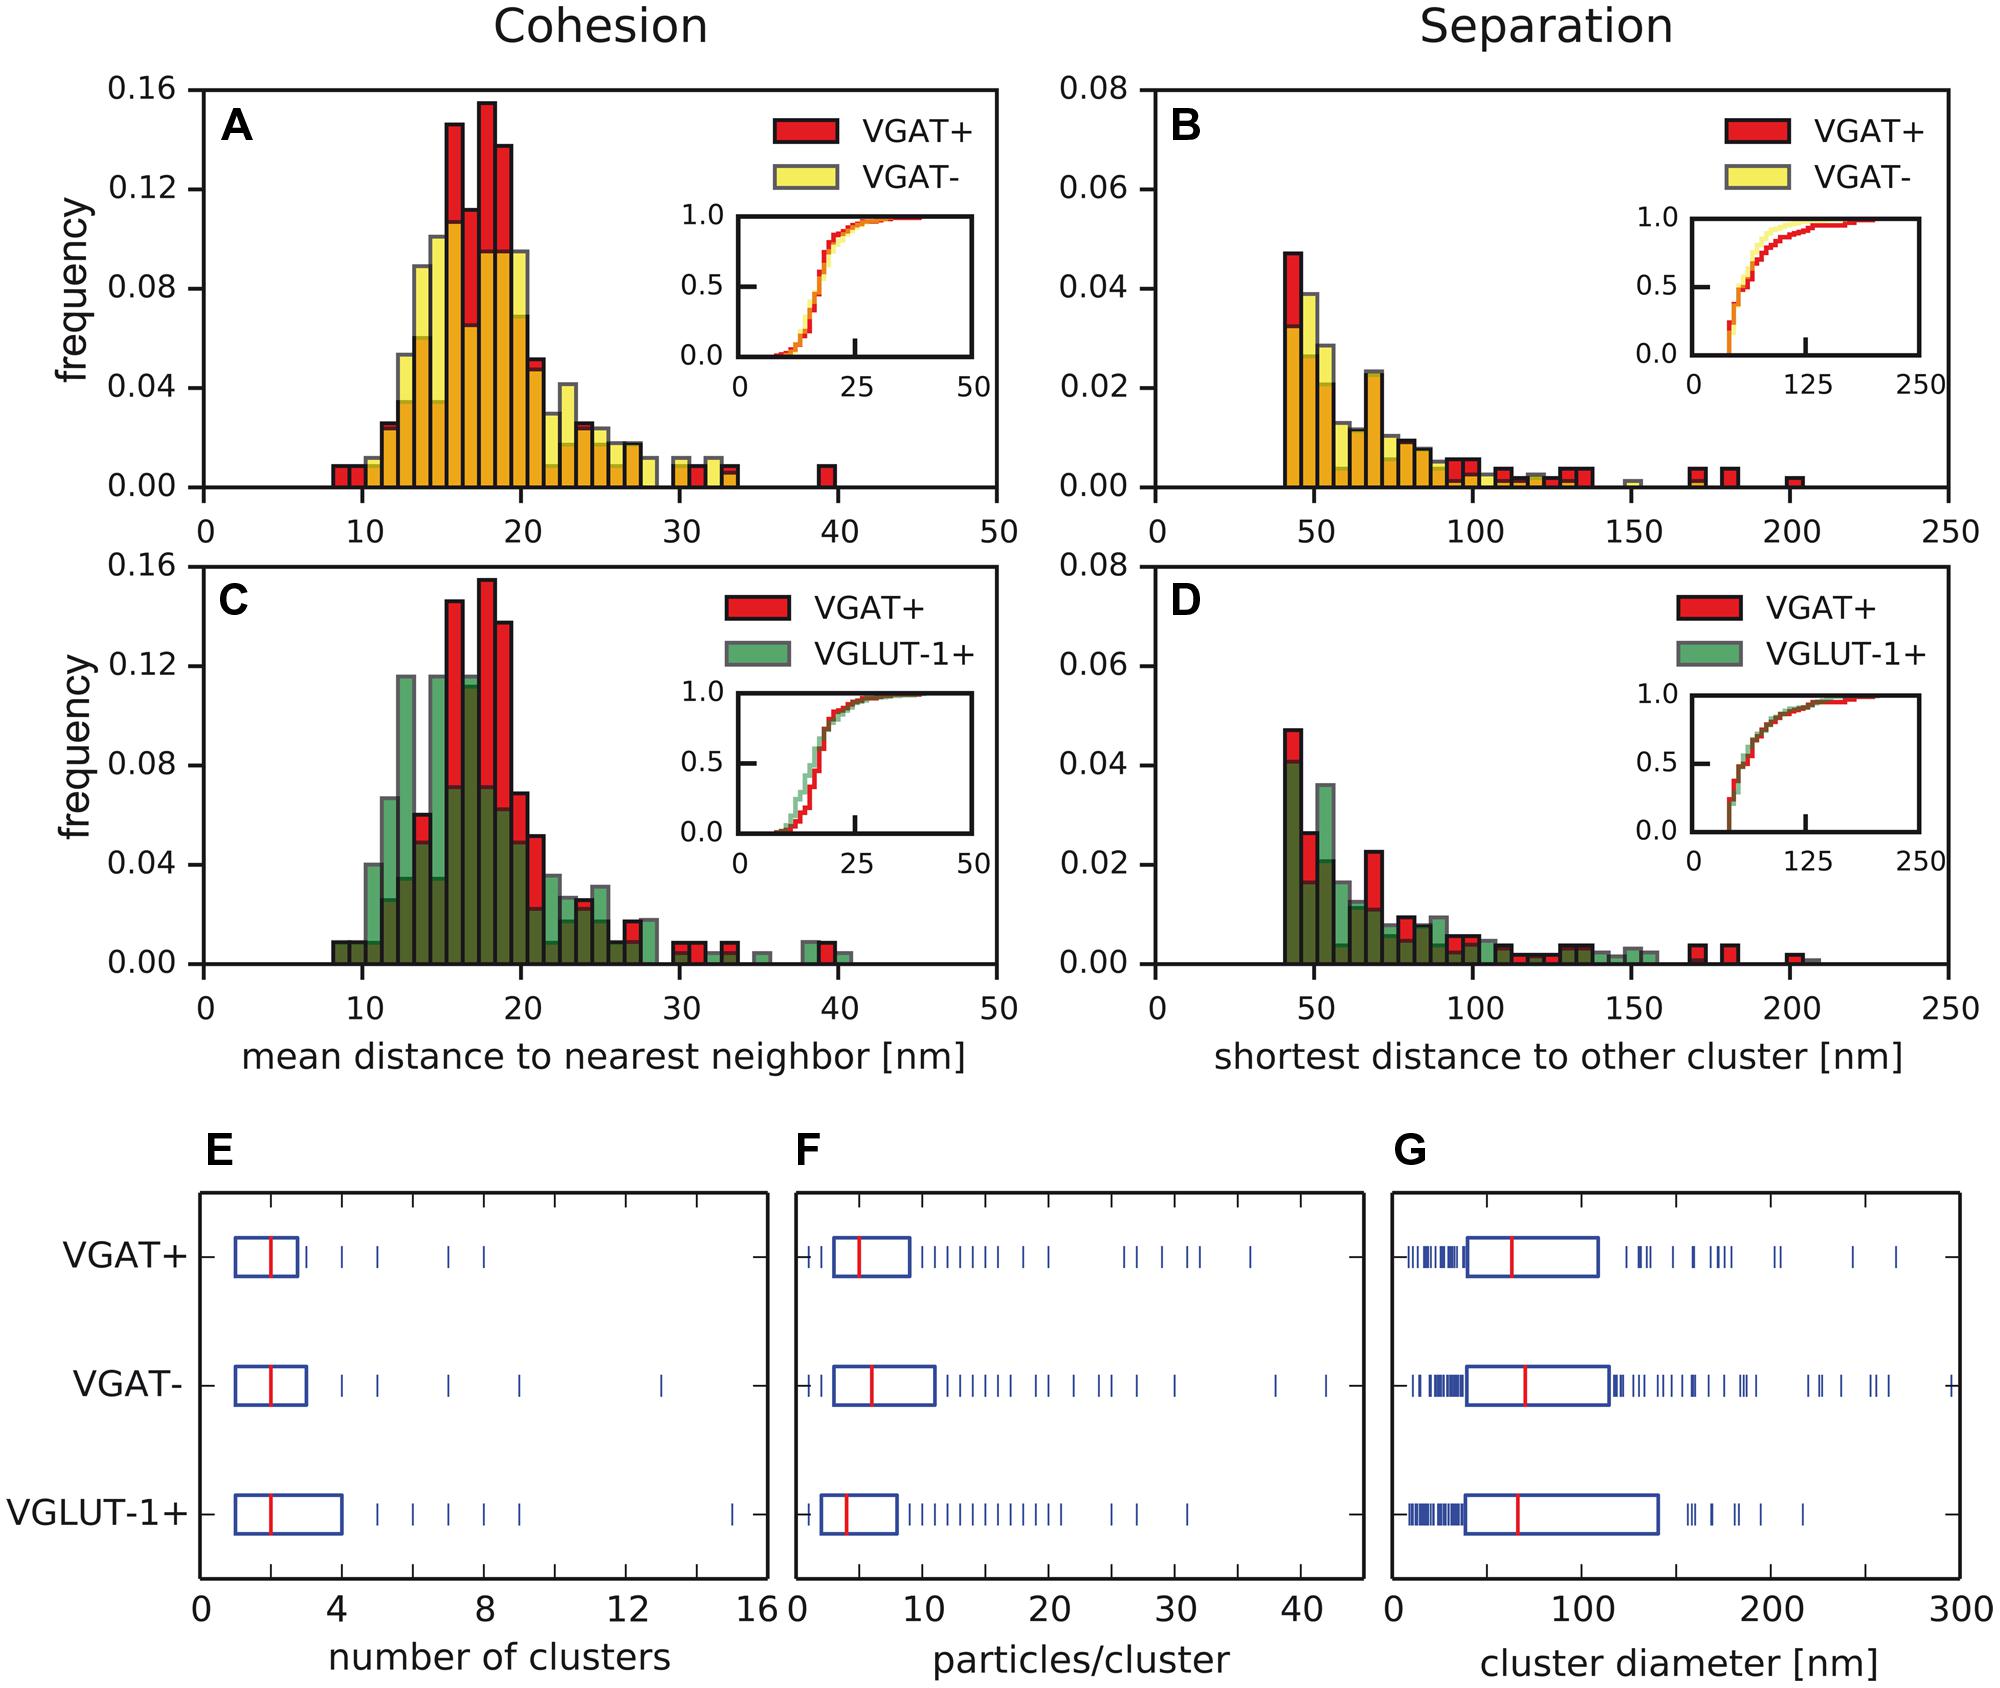
FIGURE 6. Properties of Cav2.1 clusters are similar in inhibitory and excitatory axon terminals. (A–D) Cohesion and separation of Cav2.1 clusters as determined in VGAT+ (red), VGAT- (yellow), and VGLUT-1+ (green) terminals. No significant differences were detected in (A,B,D), (p < 0.05, two-sample Kolmogorov–Smirnov test), while cohesion in (C) was significantly different. (E–G) Number of clusters per terminal (E), number of Cav2.1 particles per cluster (F), and cluster diameter (G) are determined in the boutons. Boxes indicate median (red) and iqr of the data (blue bars). No significant differences were detected between the data sets from distinct types of boutons (two-sample Kolmogorov–Smirnov test, exact p-values given in Table 1).
In subsequent analyses, the computational procedure was, therefore, used for a more detailed investigation of the parameters characterizing the architecture of the Cav2.1 clusters in inhibitory and excitatory boutons. At this end, we determined (i) the number of clusters in presynaptic terminals, (ii) the number of immunogold particles for Cav2.1 forming an individual cluster as well as, (iii) the diameter of the area covered by a cluster as accessible to our SDS-FRL configuration. The number of clusters varied roughly between 1 and 10 and averaged to two clusters per terminal in both inhibitory and excitatory boutons (Figure 6E; Table 1). Similarly, the number of Cav2.1 immunogold particles integrated in the same cluster varies over a wide range (3–40) averaging to a value of 5 in all the three types of presynaptic terminals (Figure 6F; Table 1). Finally, the diameter of the individual clusters ranged from 10 to 250 nm and exhibit mean values of 63, 70, and 66 nm in VGAT+, VGAT-, and VGLUT-1+ terminals, respectively (Figure 6G; Table 1).
Together, these quantitative data unequivocally indicate a strikingly similar subcellular arrangement of presynaptic Cav2.1 channels in inhibitory and excitatory axon terminals in the stratum radiatum of hippocampal CA1 region.
Discussion
In the present study we investigated and compared the ultrastructural organization of Cav2.1 channels in axon terminals of inhibitory (VGAT+) and excitatory (VGAT- and VGLUT-1+) neurons in the stratum radiatum of the CA1 hippocampal area using high-resolution SDS-FRL electron microscopy. Furthermore, we used an automatized computational analysis to compare the precise spatial arrangement of Cav2.1 channels in the two subpopulations of axon terminals and suggest a common nano-architecture of the P/Q-type Ca2+ channel.
Immunoelectron microscopy unequivocally revealed enrichment of Cav2.1 channels in the active zone of boutons as well as a close spatial relationship of the channel subunit to the presynaptic proteins RIM1/2, established components of the Cav2 channel networks and major regulators of the coupling between Ca2+ channels and Ca2+ sensors of exocytosis (Müller et al., 2010; Han et al., 2011; Kaeser et al., 2011; Gundelfinger and Fejtova, 2012; Südhof, 2013). Quantitative morphological as well as detailed computational analysis further demonstrated a high degree of structural similarity between inhibitory and excitatory terminals with respect to clustering and average number of Cav2.1 channels in the presynaptic membrane. These findings are consistent with the clustered distribution and estimates of the number of Cav2.1 channels in the active zone of calyx of Held (Nakamura et al., 2015), cerebellar parallel fibers (Indriati et al., 2013; Schmidt et al., 2013; Baur et al., 2015), and hippocampal CA3 principal cells synapsing on either other CA3 (Holderith et al., 2012) or CA1 pyramidal (Ermolyuk et al., 2013) neurons. Interestingly, the size of the clusters and the number of Cav2.1 proteins per cluster (4–6) correlate well with estimates derived from electrophysiological studies (Bucurenciu et al., 2010) and biochemical/proteomic analysis (Müller et al., 2010) that found a small number of Cav channels located within a distance of less than 100 nm from the release machinery at central synapses. Therefore, our data provide qualitative and quantitative proof of principle that GABAergic and glutamatergic synapses in the stratum radiatum of the CA1 area share a common nano-architecture of Cav2.1 channels making extensive use of tight coupling between the Cav2.1 channels and Ca2+ sensors for fast transmitter release.
In that respect, the Cav2.1 clusters reflect the molecular basis for local Ca2+ signaling in ‘Ca2+ nano-domains’ (Neher, 1998; Fakler and Adelman, 2008). The tight coupling of Cav2.1 channels and Ca2+ sensors of exocytosis ensures high reliability in vesicle release (Scimemi and Diamond, 2012), reduced synaptic delay and duration of the release period as well as increased ratio of synchronous and ‘entopic’ (active zone) release resulting in similar high temporal precision of both GABAergic and glutamatergic transmission (Bucurenciu et al., 2008, 2010; Eggermann et al., 2012; Nadkarni et al., 2012).
In summary, our results demonstrate a large morphological homogeneity in the two non-overlapping populations of synapses (Figure 2A) suggesting that the processes and mechanisms underlying the formation of the Cav2.1 nano-architecture and the evoked release of neurotransmitters are similar between inhibitory and excitatory central synapses (Xu et al., 2009; Eggermann et al., 2012). Regarding that the protein nano-environment of Cav2 channels is highly complex (Berkefeld et al., 2006; Müller et al., 2010) consisting of quite a variety of auxiliary proteins and regulators (Arikkath and Campbell, 2003; Dolphin, 2012) that together form the channel-associated networks regulating the local Ca2+ signaling (Evans and Zamponi, 2006; Han et al., 2011; Hoppa et al., 2012; Davydova et al., 2014), it is conceivable that the assembly and operation of Cav2.1 channel clusters can be dynamically regulated. In this respect, further extensive quantitative research is required to identify and localize additional components of the Cav2.1 channel-associated networks and to unravel the synapse- and/or state-specific properties of the nano-environments of P/Q-type Ca2+ channels as well as their concerted (Wheeler et al., 1994; Spafford and Zamponi, 2003; Williams et al., 2012) implication in the homeostatic control of cortical synapses function.
Author Contributions
DA, BF, and AK designed the project; DA and DB performed computational cluster analysis; DA and AK performed SDS-FRL immunoelectron microscopy; MW provided reagents; NS provided knock-out tissues; DA, DB, BF, and AK analyzed data; DA, BF, and AK wrote the paper.
Conflict of Interest Statement
The authors declare that the research was conducted in the absence of any commercial or financial relationships that could be construed as a potential conflict of interest.
Acknowledgments
We thank N. Wernet for technical support; A. Haupt for help with figures; Drs. Y. Fukazawa and H. Schmidt for reading the manuscript. This work was funded by BIOSS-2 A6 (AK) and grants of the Deutsche Forschungsgemeinschaft (SFB 746, TP16, Fa 332/9-1 to BF).
References
Amiry-Moghaddam, M., and Ottersen, O. P. (2013). Immunogold cytochemistry in neuroscience. Nat. Neurosci. 16, 798–804. doi: 10.1038/nn.3418
Ariel, P., Hoppa, M. B., and Ryan, T. A. (2013). Intrinsic variability in Pv, RRP size, Ca2+ channel repertoire, and presynaptic potentiation in individual synaptic boutons. Front. Syn. Neurosci. 4:9. doi: 10.3389/fnsyn.2012.00009
Arikkath, J., and Campbell, K. P. (2003). Auxiliary subunits: essential components of the voltage-gated calcium channel complex. Curr. Opin. Neurobiol. 13, 298–307. doi: 10.1016/S0959-4388(03)00066-7
Barber, C. B., Dobkin, D. P., and Huhdanpaa, H. (1996). The quickhull algorithm for convex hulls. ACM Trans. Math. Softw. 22, 469–483. doi: 10.1145/235815.235821
Baur, D., Bornschein, G., Althof, D., Watanabe, M., Kulik, A., Eilers, J., et al. (2015). Developmental tightening of cerebellar cortical synaptic influx-release coupling. J. Neurosci. 35, 1858–1871. doi: 10.1523/JNEUROSCI.2900-14.2015
Berkefeld, H., Sailer, C. A., Bildl, W., Rohde, V., Thumfart, J.-O., Eble, S., et al. (2006). BKCa-Cav channel complexes mediate rapid and localized Ca2+-activated K+ signaling. Science 314, 615–620. doi: 10.1126/science.1132915
Bucurenciu, I., Bischofberger, J., and Jonas, P. (2010). A small number of open Ca2+ channels trigger transmitter release at a central GABAergic synapse. Nat. Neurosci. 13, 19–21. doi: 10.1038/nn.2461
Bucurenciu, I., Kulik, A., Schwaller, B., Frotscher, M., and Jonas, P. (2008). Nanodomain coupling between Ca2+ channels and Ca2+ sensors promotes fast and efficient transmitter release at a cortical GABAergic synapse. Neuron 57, 536–545. doi: 10.1016/j.neuron.2007.12.026
Cao, Y.-Q., and Tsien, R. W. (2010). Different relationship of N- and P/Q-type Ca2+ channels to channel-interacting slots in controlling neurotransmission at cultured hippocampal synapses. J. Neurosci. 30, 4536–4546. doi: 10.1523/JNEUROSCI.5161-09.2010
Catterall, W. A., and Few, A. P. (2008). Calcium channel regulation and presynaptic plasticity. Neuron 59, 882–898. doi: 10.1016/j.neuron.2008.09.005
Davydova, D., Marini, C., King, C., Klueva, J., Bischof, F., Romorini, S., et al. (2014). Bassoon specifically controls presynaptic P/Q-type Ca2+ channels via RIM-binding protein. Neuron 82, 181–194. doi: 10.1016/j.neuron.2014.02.012
Dolphin, A. C. (2012). Ca2+ channel auxiliary a2d and b subunits: trafficking and one step beyond. Nat. Rev. Neurosci. 13, 542–555. doi: 10.1038/nrn3311
Eggermann, E., Bucurenciu, I., Goswami, S. P., and Jonas, P. (2012). Nanodomain coupling betwen Ca2+ channels and sensors of exocytosis at fast mammalian synapses. Nat. Rev. Neurosci. 13, 7–21. doi: 10.1038/nrn3125
Ermolyuk, Y. S., Alder, F. G., Surges, R., Pavlov, I. Y., Timofeeva, Y., Kullmann, D. M., et al. (2013). Differential triggering of spontaneous glutamate release by P/Q-, N- and R- type Ca2+ channels. Nat. Neurosci. 16, 1754–1763. doi: 10.1038/nn.3563
Evans, R. M., and Zamponi, G. W. (2006). Presynaptic Ca2+ channels – integration centers for neuronal signaling pathways. Trends Neurosci. 29, 617–624. doi: 10.1016/j.tins.2006.08.006
Fakler, B., and Adelman, J. P. (2008). Control of KCa channels by Ca2+ nano/microdomains. Neuron 59, 873–881. doi: 10.1016/j.neuron.2008.09.001
Frank, C. A. (2014). How voltage-gated calcium channels gate forms of homeostatic synaptic plasticity. Front. Cell. Neurosci. 8:40. doi: 10.3389/fncel.2014.00040
Gundelfinger, E. D., and Fejtova, A. (2012). Molecular organization and plasticity of the cytomatrix at the active zone. Curr. Opin. Neurobiol. 22, 423–430. doi: 10.1016/j.conb.2011.10.005
Han, Y., Kaeser, P. S., Südhof, T. C., and Schneggenburger, R. (2011). RIM determines Ca2+ channel density and vesicle docking at the presynaptic active zone. Neuron 69, 304–316. doi: 10.1016/j.neuron.2010.12.014
Holderith, N., Lorincz, A., Katona, G., Rozsa, B., Kulik, A., Watanabe, M., et al. (2012). Release probability of hippocampal glutamatergic terminals scales with the size of the active zone. Nat. Neurosci. 15, 988–997. doi: 10.1038/nn.3137
Hoppa, M. B., Lana, B., Margas, W., Dolphin, A. C., and Ryan, T. A. (2012). Alpha2delta expression sets presynaptic calcium channel abundance and release probability. Nature 486, 122–125. doi: 10.1038/nature11033
Indriati, D. W., Kamasawa, N., Matsui, K., Meredith, A. L., Watanabe, M., and Shigemoto, R. (2013). Quantitative localization of Cav2.1 (P/Q-type) voltage-dependent calcium channels in Purkinje cells: somatodendritic gradient and distinct somatic coclustering with Ca2+-activated potassium channels. J. Neurosci. 33, 3668–3678. doi: 10.1523/JNEUROSCI.2921-12.2013
Kaeser, P. S., Deng, L., Wang, Y., Dulubova, I., Liu, X., Rizo, J., et al. (2011). RIM proteins tether Ca2+ channels to presynaptic active zones via direct PDZ- domain interaction. Cell 144, 282–295. doi: 10.1016/j.cell.2010.12.029
Kisfali, M., Lorincz, T., and Vizi, S. (2013). Comparision of Ca2+ transients and [Ca2+]i in the dendrites and boutons of non-fast-spiking GABAergic hippocampal interneurons using two-photon laser microscopy and high- and low-affinity dyes. J. Physiol. 591, 5541–5553. doi: 10.1113/jphysiol.2013.258863
Klausberger, T. (2009). GABAergic interneurons targeting dendrites of pyramidal cells in the CA1 area of the hippocampus. Eur. J. Neurosci. 30, 947–957. doi: 10.1111/j.1460-9568.2009.06913.x
Kulik, A., Nakadate, K., Hagiwara, A., Fukazawa, Y., Lujan, R., Saito, H., et al. (2004). Immunocytochemical localization of the α1A subunit of the P/Q-type calcium channel in the rat cerebellum. Eur. J. Neurosci. 19, 2169–2178. doi: 10.1111/j.0953-816X.2004.03319.x
Kulik, A., Vida, I., Fukazawa, Y., Guetg, N., Kasugai, Y., Marker, C. L., et al. (2006). Compartment-dependent colocalization of Kir3.2-containing K+ channels and GABAB receptors in hippocampal pyramidal cells. J. Neurosci. 26, 4289–4297. doi: 10.1523/JNEUROSCI.4178-05.2006
Lipscombe, D., Allen, S. E., and Toro, C. P. (2013). Control of neuronal voltage-gated calcium ion channels from RNA to protein. Trends Neurosci. 36, 598–609. doi: 10.1016/j.tins.2013.06.008
Lisman, J. E. (1999). Relating hippocampal circuitry to function: recall of memory sequences by reciprocal dentate-CA3 interactions. Neuron 22, 233–242. doi: 10.1016/S0896-6273(00)81085-5
Masugi-Tokita, M., and Shigemoto, R. (2007). High-resolution quantitative visualization of glutamate and GABA receptors at central synapses. Curr. Opin. Neurobiol. 17, 387–393. doi: 10.1016/j.conb.2007.04.012
Müller, C. S., Haupt, A., Bildl, W., Schindler, J., Knaus, H.-G., Meissner, M., et al. (2010). Quantitative proteomics of the Cav2 channel nano-environments in the mammalian brain. Proc. Natl. Acad. Sci. U.S.A. 107, 14950–14957. doi: 10.1073/pnas.1005940107
Nadkarni, S., Bartol, T. M., Sejnowski, T. J., and Levine, H. (2010). Modelling vesicular release at hippocampal synapses. PLoS Comput. Biol. 6:e1000983. doi: 10.1371/journal.pcbi.1000983
Nadkarni, S., Bartol, T. M., Stevens, C. F., Sejnowski, T. J., and Levine, H. (2012). Short-term plasticity constrains spatial organization of a hippocampal presynaptic terminal. Proc. Natl. Acad. Sci. U.S.A. 109, 14657–14662. doi: 10.1073/pnas.1211971109
Nakamura, Y., Harada, H., Kamasawa, N., Matsui, K., Rothman, J. S., Shigemoto, R., et al. (2015). Nanoscale distribution of presynaptic Ca2+ channels and its impact on vesicular release during development. Neuron 85, 1–14. doi: 10.1016/j.neuron.2014.11.019
Neher, E. (1998). Vesicle pools and Ca2+ microdomains: new tools for understanding their roles in neurotransmitter release. Neuron 20, 389–399. doi: 10.1016/S0896-6273(00)80983-6
Otmakhova, N. A., and Lisman, J. E. (2004). Contribution of Ih and GABAB to synaptically induced afterhyperpolarizations in CA1: a brake on the NMDA response. J. Neurophysiol. 92, 2027–2039. doi: 10.1152/jn.00427.2004
Parajuli, L. K., Nakajima, C., Kulik, A., Matsui, K., Schneider, T., Shigemoto, R., et al. (2012). Quantitative regional and ultrastructural localization of the Cav2.3 subunit of R-type calcium channels in mouse brain. J. Neurosci. 32, 13555–13566. doi: 10.1523/JNEUROSCI.1142-12.2012
Poncer, J.-C., McKinney, R. E., Gähwiler, B. H., and Thompson, S. M. (1997). Either N- or P- type calcium channels mediate GABA release at distinct hippocampal inhibitory synapses. Neuron 18, 463–472. doi: 10.1016/S0896-6273(00)81246-5
Schmidt, H., Brachtendorf, S., Arendt, O., Hallermann, S., Ishiyama, S., Bornschein, G., et al. (2013). Nanodomain coupling at an excitatory cortical synapse. Curr. Biol. 23, 244–249. doi: 10.1016/j.cub.2012.12.007
Schneggenburger, R., and Neher, E. (2005). Presynaptic calcium and control of vesicle fusion. Curr. Opin. Neurobiol. 15, 266–274. doi: 10.1016/j.conb.2005.05.006
Schneider, C. A., Rasband, W. S., and Eliceiri, K. W. (2012). NIH Image to ImageJ: 25 years of image analysis. Nat. Meth. 9, 671–675. doi: 10.1038/nmeth.2089
Scimemi, A., and Diamond, J. S. (2012). The number and organization of Ca2+ channels in the active zone shapes neurotransmitter release from Schaffer collateral synapses. J. Neurosci. 32, 18157–18176. doi: 10.1523/JNEUROSCI.3827-12.2012
Sheng, J., He, L., Zheng, H., Xue, L., Luo, F., Shin, W., et al. (2012). Calcium-channel number critically influences synaptic strength and plasticity at the active zone. Nat. Neurosci. 15, 998–1006. doi: 10.1038/nn.3129
Sibson, R. (1973). SLINK: An optimally efficient algorithm for the single-link cluster method. Comput. J. 16, 30–34. doi: 10.1093/comjnl/16.1.30
Spafford, J. D., and Zamponi, G. W. (2003). Functional interactions between presynaptic calcium channels and the neurotransmitter release machinery. Curr. Opin. Neurobiol. 13, 308–314. doi: 10.1016/S0959-4388(03)00061-8
Stevens, C. F. (2004). Presynaptic function. Curr. Opin. Neurobiol. 14, 341–345. doi: 10.1016/j.conb.2004.04.004
Südhof, T. C. (2013). Neurotransmitter release: the last millisecond in the life of a synaptic vesicle. Neuron 80, 675–690. doi: 10.1016/j.neuron.2013.10.022
Wheeler, D. B., Randall, A., and Tsien, R. W. (1994). Roles of N-type and Q-type Ca2+ channels in supporting hippocampal synaptic transmission. Science 264, 107–111. doi: 10.1126/science.7832825
Williams, C., Chen, W., Lee,C-H., Yaeger, D., Vyleta, N. P., and Smith, S. M. (2012). Coactivation of multiple tightly coupled Ca2+ channels triggers spontaneous release of GABA. Nat. Neurosci. 15, 1195–1197. doi: 10.1038/nn.3162
Wu, L-G., and Saggau, P. (1994). Pharmacological identification of two types of presynaptic voltage-dependent calcium channels at CA3-CA1 synapses of the hippocampus. J. Neurosci. 14, 5613–5622.
Keywords: Ca2+ channels, quantitative immunoelectron microscopy, cluster analysis, rat, hippocampus
Citation: Althof D, Baehrens D, Watanabe M, Suzuki N, Fakler B and Kulik Á (2015) Inhibitory and excitatory axon terminals share a common nano-architecture of their Cav2.1 (P/Q-type) Ca2+ channels. Front. Cell. Neurosci. 9:315. doi: 10.3389/fncel.2015.00315
Received: 15 May 2015; Accepted: 28 July 2015;
Published: 11 August 2015.
Edited by:
Christian D. Wilms, University College London, UKReviewed by:
Khursheed Wani, University of Michigan, USACheng-Chang Lien, National Yang-Ming University, Taiwan
Copyright © 2015 Althof, Baehrens, Watanabe, Suzuki, Fakler and Kulik. This is an open-access article distributed under the terms of the Creative Commons Attribution License (CC BY). The use, distribution or reproduction in other forums is permitted, provided the original author(s) or licensor are credited and that the original publication in this journal is cited, in accordance with accepted academic practice. No use, distribution or reproduction is permitted which does not comply with these terms.
*Correspondence: Ákos Kulik, Institute of Physiology, University of Freiburg, Hermann Herder Straße 7, D-79104 Freiburg, Germany,YWtvcy5rdWxpa0BwaHlzaW9sb2dpZS51bmktZnJlaWJ1cmcuZGU=