 Sheng Yi
 Xin Tang†
 Jun Yu
 Xiaosong Gu
- Key Laboratory of Neuroregeneration of Jiangsu and Ministry of Education, Co-Innovation Center of Neuroregeneration, Nantong University, Nantong, China
Wallerian degeneration occurs immediately following injury to mammal peripheral nerves. To better understand the molecular events occurring during Wallerian degeneration, a rat model of sciatic nerve transection was used to assess differentially expressed genes at 0.5, 1, 6, 12, 24 h, 4 days, 1, 2, 3, and 4 weeks post nerve injury (PNI). Hierarchical clustering, Euclidean distance matrix, and principal component analysis (PCA) collectively suggested three distinct phases within the post-injury period of 4 weeks. Gene ontology (GO) analysis suggested that phase I (0–6 h PNI), phase II (6–24 h PNI), and phase III (4 days to 4 weeks) were associated with acute response to injury, preformation of Wallerian degeneration, and complete execution of Wallerian degeneration, respectively. Critical signaling pathways and transcriptional factor networks responsible for the regulation of Wallerian degeneration were further identified and integrated using Kyoto Enrichment of Genes and Genomes (KEGG) pathway analysis and Ingenuity Pathway Analysis (IPA), respectively. Our results may help to elucidate some molecular mechanisms of gene regulation associated with Wallerian degeneration that occurs after traumatic injury to peripheral nerve axons in mammals.
Introduction
Nerve injury is a common clinical occurrence with a steadily increasing incidence worldwide, and may cause life-long disability and impair quality of life (Gu et al., 2011; Lee et al., 2014). Following nerve injury, axons in the distal nerve stump are separated from neuronal cell bodies, and undergo Wallerian degeneration (Coleman, 2005). In the peripheral nervous system, Wallerian degeneration is typically detectable within 1–3 days after injury. Morphological analysis of the distal stumps of injured peripheral nerves showed that axon starts to disintegrate within hours after injury; proliferating Schwann cells and macrophages then engulf and clear the axon and myelin debris about three days later (Geuna et al., 2009).
However, in mammal central nerves, Wallerian degeneration initiates much slower (Vargas and Barres, 2007). Additionally, Wallerian degeneration rarely occurs in many invertebrates and lower vertebrates (Bittner et al., 2000, 2016). The different occurrences of Wallerian degeneration in different nervous systems make the role of Wallerian degeneration obscure, and thus many attempts have been made to investigate molecular basis underlying Wallerian degeneration.
A genetic study on the slow Wallerian degeneration (Wlds) mouse suggests that over-expression of nicotinamide mononucleotide adenylyltransferase fusion protein slows down Wallerian degeneration (Conforti et al., 2000; Mack et al., 2001). Another study reports that midkine knockout mice exhibit delayed axon degeneration and nerve regeneration following peripheral nerve injury (Sakakima et al., 2009). It has also been shown that activated potassium channel or inhibited sodium channel retards Wallerian degeneration of injured Drosophila axons (Mishra et al., 2013). And sterile alpha and TIR motif containing 1 (SARM1), a Toll-like receptor, has been demonstrated as an essential factor for triggering axon degeneration (Gerdts et al., 2013; Loreto et al., 2015). Despite these interesting findings, much is still unknown about the molecular mechanisms involved in Wallerian degeneration. A systems-level analysis may help to obtain a global understanding of Wallerian degeneration from the perspective of gene regulation.
Microarray analysis has been widely adopted to characterize many differentially expressed genes in normal versus experimental conditions. In our previous studies, we performed microarray to identify differentially expressed genes in the distal nerve stump following sciatic nerve injury (Yao et al., 2012, 2013). By using the R software platform and the limma package, we were able to re-annotate and re-analyze these previous obtained microarray data. In an earlier study, we used Ingenuity Pathway Analysis (IPA) software program to analysis dynamic molecular changes in the injured distal nerve stump and gained some insights into Wallerian degeneration (Yu et al., 2016). In the current study, we made the joint use of Euclidean distance calculation, hierarchical clustering, principal component analysis (PCA), Gene ontology (GO) analysis, Kyoto Enrichment of Genes and Genomes (KEGG) pathway analysis, and IPA to further access genetic changes occurring during Wallerian degeneration.
Materials and Methods
Animal Surgery
Adult male Sprague-Dawley (SD) rats were obtained from the Experimental Animal Center of Nantong University. All animal procedures were performed in accordance with Institutional Animal Care guideline of Nantong University and ethically approved by the Administration Committee of Experimental Animals, Jiangsu Province, China. Animals were anesthetized by injection of mixed narcotics (85 mg/kg trichloroacetaldehyde monohydrate, 42 mg/kg magnesium sulfate, and 17 mg/kg sodium pentobarbital), and underwent surgical transection of sciatic nerves as previously described (Yu et al., 2012). Briefly, the rat sciatic nerve was lifted through an incision on the lateral aspect of the mid-thigh of the left hind limb, and a 10-mm nerve segment was excised. Rats were then randomly divided into ten groups according to different time points post nerve injury (PNI). Rats were sacrificed by decapitation at 0.5, 1, 6, 12, and 24 h, 4 days, and 1, 2, 3, and 4 weeks PNI and the distal nerve stumps were collected, respectively. Rats in control group were sham-operated and immediately (designated as 0 h PNI) sacrificed by decapitation.
Microarray Analysis
Total RNA was extracted using Trizol (Life technologies, Carlsbed, CA) according to the manufacturer's instructions. Contaminating DNA was removed using RNeasy spin columns (Qiagen, Valencia, CA). The quality of isolated RNA samples was evaluated with an Agilent Bioanalyzer 2100 (Agilent technologies, Santa Clara, CA) and the purified RNA was quantified using a NanoDrop ND-1000 spectrophotometer (Infinigen Biotechnology Inc., City of Industry, CA). An Affymetrix GeneChip Hybridization Oven 640 and Gene Array Scanner 3000 were used to perform microarray analysis. The R software (v.2.13.0) platform was applied to analyze the microarray data, and the limma (linear regression model) package was used to statistically analyze differentially expressed genes (Ritchie et al., 2015; Xu and Sun, 2015). The expression levels of mRNAs at each time point were compared with control. Genes having a fold change > 2 or < −2 and an adjusted p < 0.05 were considered as differentially expressed.
Bioinformatic Analysis
Bioinformatic analysis tools, including Euclidean distance calculation, hierarchical clustering, PCA, GO, KEGG, and IPA, were applied to investigate differentially expressed genes PNI. Briefly, Euclidean distance calculation was performed using the HeatMapImage GenePattern module, and hierarchical clustering was computed with the Euclidean distance measure using the Hierarchical Clustering module from GenePattern. PCA was performed using “Population PCA” tool from Harvard Medical School. Database for Annotation, Visualization, and Integrated Discovery (DAVID) bioinformatic resources were used to systematically screen differentially expressed genes and to enrich significant GO categories and KEGG pathways (Huang da et al., 2009a,b). IPA was performed to identify and connect differentially expressed transcription factors.
Quantitative Real Time PCR (qPCR)
A total amount of 0.5 μg RNA samples were used as templates and reverse transcribed to cDNA using the Prime-Script reagent Kit (TaKaRa, Dalian, China). PCR was performed using SYBR Green Premix Ex Taq (TaKaRa) with specific primer pairs on an Applied Biosystems Stepone real-time PCR System. The sequences of primer pairs were as follows: FOSL1 (forward) 5′-GACCTCTGACCTATCCCCAGT-3′ and (reverse) 5′-GTCGTAGCTCTGCTCTGTGT-3′; SS18L1 (forward) 5′-TGCAGAGCCCATGAGTCAAC-3′ and (reverse) 5′-TCATCCTCCAACTTGTCGGTC-3′; and GAPDH (forward) 5′-CCTTCATTGACCTCAACTACATG-3′ and (reverse) 5′-CTTCTCCATGGTGGTGAAGAC-3′. The thermal cycler program was as follows: 5 min at 95°C; 40 cycles of 30 s at 95°C, 45 s at anneal temperature, and 30 s at 72°C; and 5 min at 72°C. Relative quantification of mRNA was conducted using the comparative 2−ΔΔCt method with GAPDH as the reference gene.
Statistical Analysis
All data are expressed as means ± SEM, and analyzed by using GraphPad Prism 6.0 (GraphPad Software, Inc.). Differences between groups were tested using Student's t-test or one-way ANOVA.
Results
Differentially Expressed Genes in the Distal Nerve Stump Following Sciatic Nerve Transection
Previous obtained microarray data (Yao et al., 2012, 2013) were re-annotated and re-analyzed to identify the expression patterns of more than 30,000 genes. The expression levels of these genes at different time points PNI were compared with control (the expression level at 0 h PNI) and differentially expressed genes were determined according to fold change (> 2 or < −2) and adjusted p < 0.05 (Table S1). Only a few genes were differentially expressed at 0.5 and 1 h PNI. More genes were differentially expressed at the ensuing time points PNI with a maximum number of differentially expressed genes being about 300 at 4 weeks PNI (Figure 1A). The most up-regulated gene was elevated for more than 13-folds (log2 ratio > 3.7) while the most down-regulated gene was reduced to ~1/30 (log2 ratio < −4.9). Top 10 up-regulated or down-regulated genes at each time point were listed in Table 1.
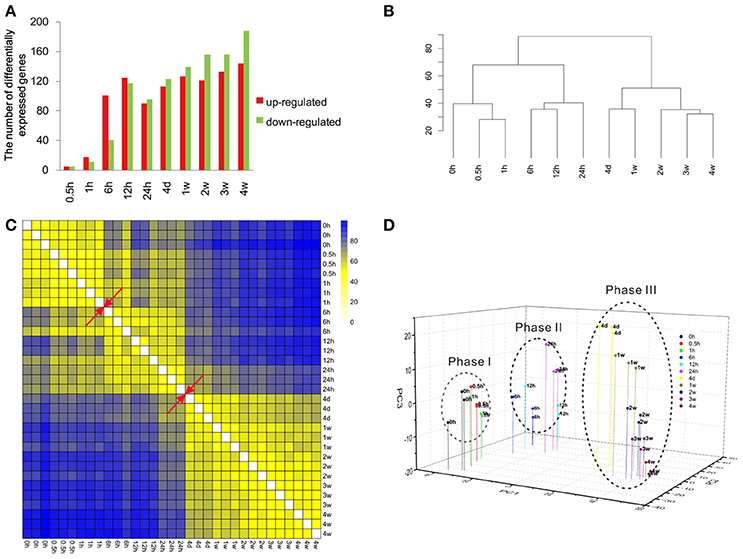
Figure 1. Overview of the transcriptional pattern at the distal stumps following sciatic nerve transection. (A) The bar graph showing the number of up-regulated (red) genes and down-regulated (green) genes at each time point following nerve transection as compared to control. (B) Euclidean distance heatmap, (C) hierarchical clustering, and (D) principal component analysis of differentially expressed genes at different time points following nerve transection.
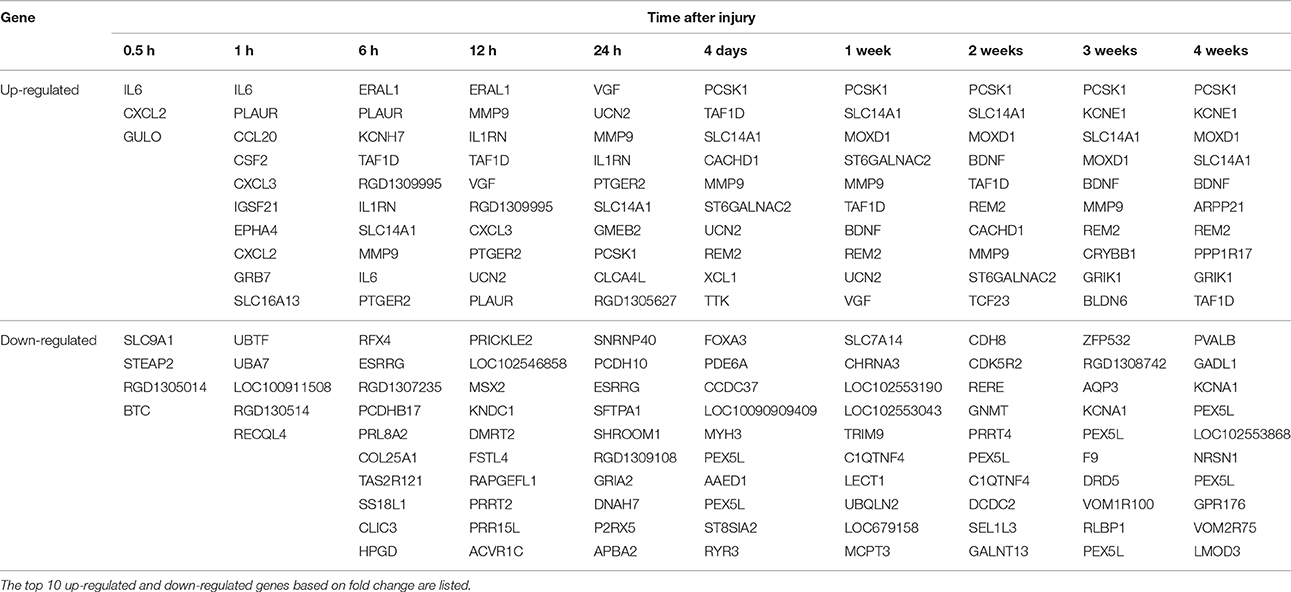
Table 1. Top differentially expressed genes.
Three Transcriptional Phases of Wallerian Degeneration
Cluster analysis was performed to compare the similarity in gene expression profiles among different time points PNI. Data from hierarchical clustering suggested that the gene expression profiles could be separated into two major groups: one at 0–24 h PNI and another at 24 h to 4 weeks PNI (Figure 1B). In the first major group, 0, 0.5, and 1 h PNI were similar and 6, 12, and 24 h PNI were similar. In the second major group, 4 days and 1 week PNI were similar and 2, 3, and 4 weeks were similar (Figure 1B). Euclidean distance matrix showed three different phases following nerve injury; namely 0, 0.5, and 1 h PNI for phase I; 6, 12, and 24 h PNI for phase II; 4 days, 1, 2, 3, and 4 weeks for phase III (Figure 1C). PCA analysis suggested that the 4 weeks PNI could be clustered into three different phases (Figure 1D). More detailed analysis indicated that within phase III, 4 days and 1 week PNI seemed to be closer, while 2, 3, and 4 weeks PNI seemed to be closer. This result was consistent with that from hierarchical clustering (Figures 1B,D). Since intra-phase differences were not as obvious as inter-phase differences, the time period of 0 h to 4 weeks PNI was arbitrarily divided into three phases for the sake of studying Wallerian degeneration.
Critical Cellular Components, Molecular Functions, and Biological Processes Involved in Wallerian Degeneration
DAVID database was used to annotate GO terms related to differentially expressed genes. The GO analysis helped to identify highly enriched categories of cellular components, molecular functions, and biological processes.
The enriched categories of cellular components at different time points PNI were identified with the p-value threshold set at 0.05 (Figure 2A). In brief, the categories of membrane fraction, insoluble fraction, and cell fraction were enriched at 1 h PNI, and the categories of extracellular region (part), extracellular space, and plasma membrane (part) were enriched starting from 6 h to 4 weeks PNI. To better analyze critical cellular components involved in nerve regeneration, the expression levels related to categories of cell soma, axon (part), dendrite, neuron projection, cytoskeleton, and synapse (part) were examined. The expression levels related to cell soma, axon (part), dendrite, and neuron projection were exponentially increased between 24 h and 4 days PNI and kept at a relatively high level at the ensuing time points PNI, while the expression changes related to synapse (part) seemed to lag several time points behind those related to other cellular components, showing a curved shape with alternate peaks and troughs (Figure 2B).
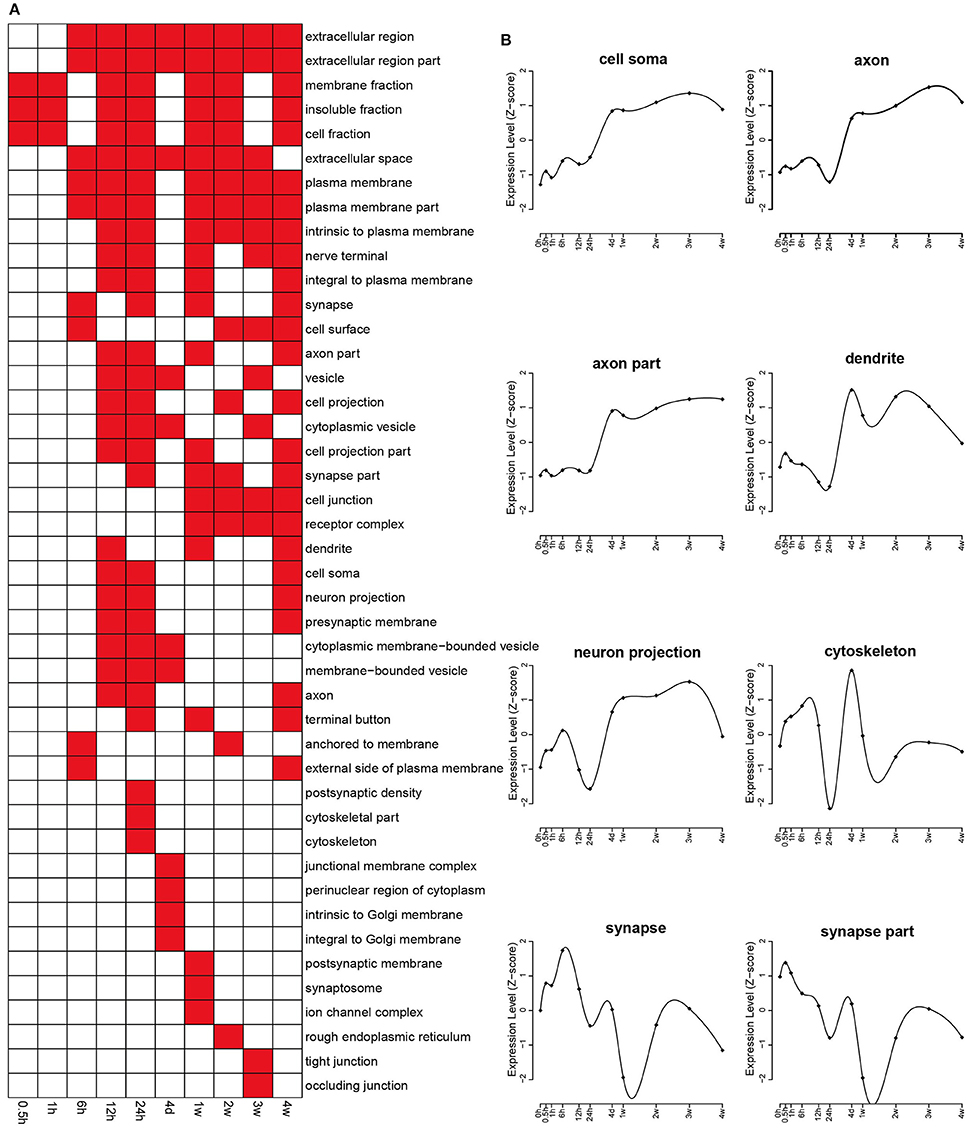
Figure 2. Enriched GO cellular component of differentially expressed genes. (A) GO cellular components with a p < 0.05 were labeled in red while cellular components with a p > 0.05 were labeled in white. (B) The expression profiles of differentially expressed genes involved in major cellular components related with the nervous system.
Molecular functions related to differentially expressed genes were also identified by GO analysis according to p < 0.05, and the results were shown in Figure 3A. The expression changes related to some categories that are important for nerve regeneration, including cytokine activity, growth factor activity, chemokines activity, chemokines receptor binding, hormone activity, and hormone binding, were analyzed. These key categories were significantly enriched following nerve injury, reaching a peak at about 12 h PNI (Figure 3B). Similar to the expression changes related to cellular component categories of synapse (part), the expression changes of differentially expressed genes involved in two categories of neurotransmitter receptor activity and neurotransmitter binding also showed a curved shape (Figure 3B).
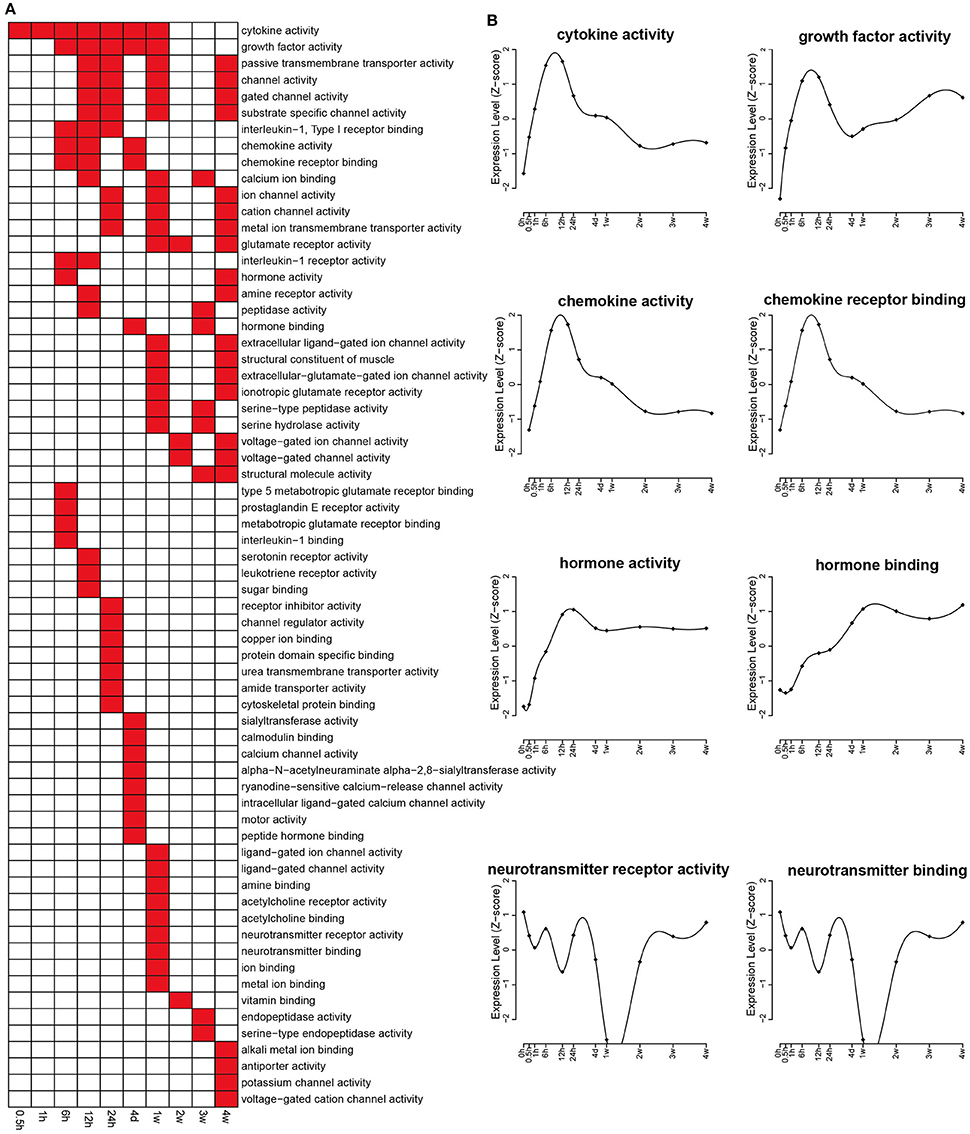
Figure 3. Enriched GO molecular functions of differentially expressed genes. (A) GO molecular functions with a p < 0.05 were labeled in red while molecular functions with a p > 0.05 were labeled in white. (B) The expression profiles of differentially expressed genes involved in several critical molecular functions related with nerve repair and regeneration.
Biological processes related to differentially expressed genes were also annotated by GO analysis. A relatively larger number of significant biological processes with a p < 0.05 were involved, and therefore only top enriched biological processes with a p < 0.001 were displayed in Figure 4A. In an early stage (0.5 and 1 h PNI), few biological process categories were enriched. Starting from 6 h PNI, many biological process categories, such as response to wounding, defense response, inflammatory response, immune response, regulation of apoptosis, and regulation of cell death, were enriched (Figures 4A,B). These enriched categories might contribute to the onset of Wallerian degeneration. In the later stage, especially at 4 weeks PNI, several biological process categories, such as homeostatic process, chemical homeostasis, cellular homeostasis, cellular ion homeostasis, and ion homeostasis, were significantly enriched, suggesting that Wallerian degeneration was close to the end and a homeostatic state was reached (Figure 4A).
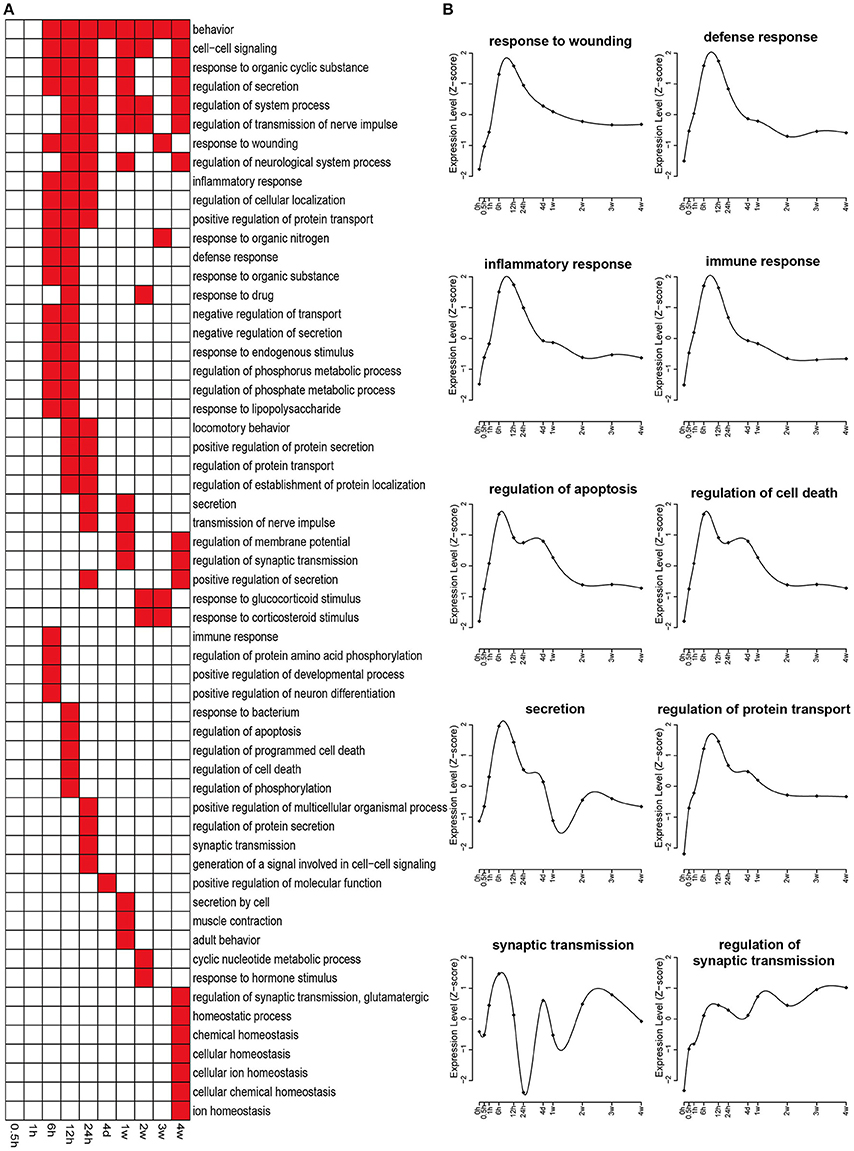
Figure 4. Enriched GO biological processes of differentially expressed genes. (A) GO biological processes with a p < 0.001 were labeled in red while biological processes with a p > 0.001 were labeled in white. (B) The expression profiles of differentially expressed genes involved in several critical biological processes during nerve repair and regeneration.
Critical Signaling Pathways Involved in Wallerian Degeneration
GO analysis provided an overall insight into the cellular and molecular regulation of Wallerian degeneration. KEGG analysis was further performed to identify critical signaling pathways in the distal nerve stump at each time point (Figure 5). Two signaling pathways, cytokine-cytokine receptor interaction and neuroactive ligand-receptor interaction, were significantly involved in phases I and II of Wallerian degeneration, respectively. Cytokine-cytokine receptor interaction was activated as early as 1 h PNI and kept activated until 12 h PNI, while neuroactive ligand-receptor interaction was activated from 6 h to 4 weeks PNI. Besides these two pathways, calcium signaling pathway, insulin signaling pathway, Jak-STAT signaling pathway, and MAPK signaling pathway were also significantly involved in the process of Wallerian degeneration.
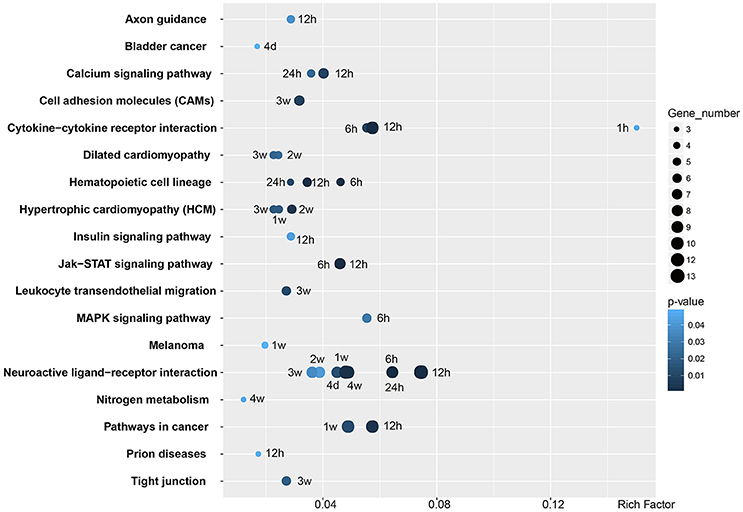
Figure 5. Enriched KEGG pathways of differentially expressed genes. KEGG pathways with a p < 0.05 are listed. The X-axis showed Rich Factor, the ratio of differentially expressed gene numbers to all gene numbers annotated in the KEGG pathway. The number of differentially expressed gene annotated in the specific KEGG pathway was expressed as the size of the circle. The p-value of KEGG pathway was corrected to Q-value ranging from 0 to 1.
Regulatory Networks of Differentially Expressed Transcription Factors during Wallerian Degeneration
Differentially expressed transcription factors were specifically screened out as they might play central roles in the regulation of Wallerian degeneration and robustly affect diverse biological processes. IPA database was further used to construct the regulatory networks of differentially expressed transcription factors (Figure 6A). Consistent with previous results that few changes were observed in an early stage of Wallerian degeneration (Figure 1A), there were no differentially expressed transcription factors at 0.5 and 1 h PNI. Starting from phase II, the expression levels of several transcription factors were significantly changed. At 6 h PNI, FOSL1, BCL11A, SMAD3 were up-regulated, while SS18L1 and CASKIN1 were down-regulated. Moreover, these three transcription factors initiated the cascade sequence of transcriptional factors to accompany and modulate Wallerian degeneration. The temporal expression profiles of FOSL1 and SS18L1 were further validated by qPCR. Results from qPCR analysis were in agreement with the data from microarray analysis (Figure 6B).
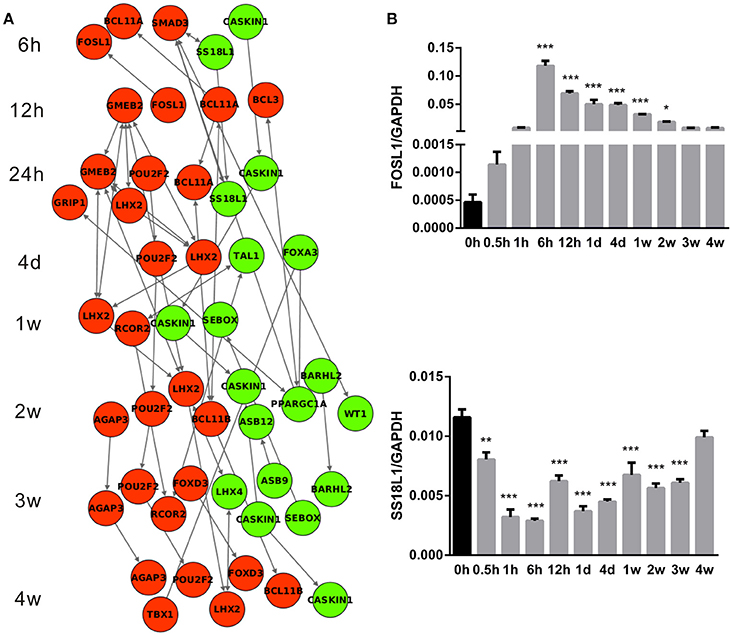
Figure 6. Cascade network of differentially expressed transcription factors. (A) The interaction network of up-regulated (red) transcription factors and down-regulated (green) transcription factors at each time point following nerve transection. (B) qPCR determination for mRNA expressions of FOSL1 and SS18L1. The relative level was normalized to GAPDH. The data, obtained from 3 independent experiments, are expressed as means ± SEM. *p < 0.05, **p < 0.01, and ***p < 0.001.
Discussion
Wallerian degeneration consists of a series of complicated cellular and molecular events and plays important roles in responses to nerve injury and perhaps to regeneration. Since its description by Waller in 1850 (Waller, 1850), many morphological studies have described events in Wallerian degeneration. In the current study, we systematically examined differentially expressed genes in the distal sciatic nerve stump at different time points following transection, aiming to have a better understanding of Wallerian degeneration from the genetic aspect.
Hierarchical clustering, Euclidean distance calculation, and PCA analysis results showed that the period of 0 h to 4 weeks PNI could be divided to three distinct phases by similarity of gene expression profiles among different time points. GO annotation was used to correlate the differentially expressed genes with cellular components, molecular functions, and biological processes. Enriched categories of cellular components, molecular functions, and biological processes at different time points were further studied in terms of three transcriptional phases.
In phase I, only a few genes were differentially expressed, and not many GO categories were altered correspondingly. GO analysis also indicated that the most remarkable change in this phase might be cellular fraction enrichment. Accordingly, observations from photomicrograph suggested that neurofilament and myelin disintegrate into fragments at 1 h post injury (Sta et al., 2014). In phase II, relatively more numerous genes were differentially expressed, and more numerous GO categories were involved. Stimulus response-associated biological processes, such as response to wounding, defense response, inflammatory response, immune response, regulation of apoptosis, and regulation of cell death, were significantly activated. Increased inflammatory and immune response identified by bioinformatic analysis were consistent with morphological observations that phagocyte accumulated and infiltrated in the injured nerves (Sta et al., 2014). Activity/binding of cytokine, growth factor, chemokines, and hormone were significantly activated in this phase. In phase III, many biological processes were first activated, and then gradually declined to a homeostatic state. Taken together, the results showed that the time period PNI might be divided into three different phases, which corresponded to the formation and characteristics of Wallerian degeneration. In short, acute response to nerve injury, pre-formation of Wallerian degeneration, and comprehensive execution of Wallerian degeneration occurred in phase I (0–1 h PNI), phase II (6–24 h PNI), and phase III (within 4 days to 4 weeks PNI), respectively (Figure 7).
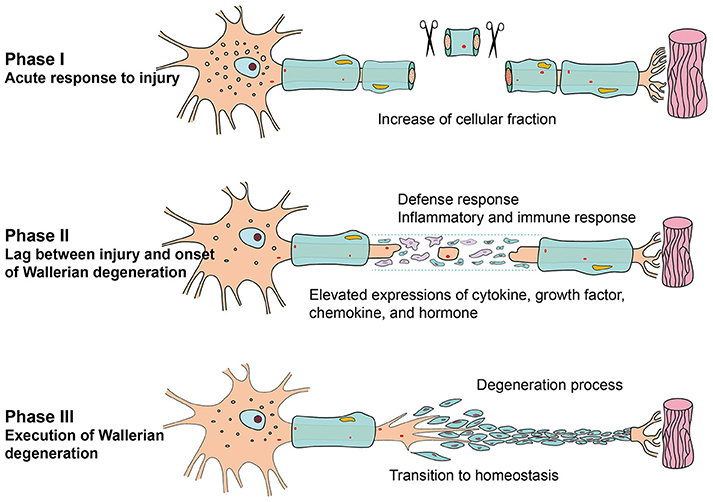
Figure 7. Schematic diagram of the transcriptional changes during Wallerian degeneration.
Enriched signaling pathways during Wallerian degeneration were also examined by KEGG analysis. Consistent with our previous studies (Li et al., 2013, 2014; Yao et al., 2013), cytokine-cytokine receptor interaction was activated in an early stage of Wallerian degeneration. Neuroactive-ligand receptor interaction was also significantly activated. Elevated activity of neuroactive-ligand receptor interaction signaling pathway has been linked with Parkinson's disease, a neurodegenerative disease (Hamza et al., 2011; Kong et al., 2015). Our current finding that neuroactive-ligand receptor interaction signaling pathway was activated during Wallerian degeneration might provide some preliminary evidence for the similarity between Wallerian degeneration and neurodegenerative disease. Besides these two most enriched signaling pathways, some other enriched pathways were also identified; for example, calcium signaling pathway. Calcium has long been implicated in Wallerian degeneration (Schlaepfer, 1974). Wlds mouse exhibits an increased mitochondrial flux and an enhanced mitochondrial calcium buffering compared with normal mouse, suggesting the important roles of calcium in Wallerian degeneration (Coleman, 2005; Avery et al., 2012; Freeman, 2014). The current study, from the genetic level, demonstrated the involvement of calcium signaling in Wallerian degeneration, especially at 12 and 24 h PNI.
Transcription factors are DNA-binding proteins able to control the transcription rate of target genes (Karin, 1990; Latchman, 1997). Differentially expressed transcription factors mediate various physiological and pathological conditions through affecting the expression levels of target genes. They are usually incorporated in activation of multiple intracellular signaling cascades, interlinking to create the complex cascade networks (Patodia and Raivich, 2012). Based on their significance, differentially expressed transcription factors and their cascade networks were investigated in the current study. Further studies will be performed to determine the biological effects of these transcription factors on Wallerian degeneration.
Conclusions
In the current study, we generated an integrated global view of gene expression patterns at the distal nerve stump following peripheral nerve injury. Bioinformatic analysis further enabled us to divide the phases and gain a comprehensive view of molecular changes during Wallerian degeneration.
Author Contributions
Conceptualization: SY, XT, FD, XG; methodology: SY, XT, JY; software: SY, XT, JY; validation: SY, XT, JY; formal analysis: SY, XT, JY; investigation: SY, XT, FD XG; resources: SY, XT, FD, XG; data curation: SY, XT, XG; writing (original draft preparation): SY, XT, JL; writing (review and editing): SY, XT, JL; visualization: SY, XT; supervision: FD, XG; project administration: FD, XG; and funding acquisition: SY, XT, FD, XG.
Funding
This study was supported by National Natural Science Foundation of China (81370043), the Natural Science Foundation of Jiangsu Province, China (Grant No. BK20150409); Natural Science Foundation of Jiangsu Higher Education Institutions of China (Grant No. 15KJB180013); Natural Science Foundation of Nantong (Grant No. MS12015043); and a Project Funded by the Priority Academic Program Development of Jiangsu Higher Education Institutions (PAPD).
Conflict of Interest Statement
The authors declare that the research was conducted in the absence of any commercial or financial relationships that could be construed as a potential conflict of interest.
Supplementary Material
The Supplementary Material for this article can be found online at: http://journal.frontiersin.org/article/10.3389/fncel.2017.00022/full#supplementary-material
Table S1. Gene expression profiles at the distal stumps at each time point following sciatic nerve transection. Gene expression values at each time point were listed and their expressions at 0.5, 1, 6, 12, 24 h, 4 days, 1, 2, 3, and 4 weeks post nerve injury were compared with 0 h control. Genes with the absolute value of fold change > 2 (the absolute value of log2FC > 1) and an adjusted p-value < 0.05 were considered as differentially expressed.
References
Avery, M. A., Rooney, T. M., Pandya, J. D., Wishart, T. M., Gillingwater, T. H., Geddes, J. W., et al. (2012). WldS prevents axon degeneration through increased mitochondrial flux and enhanced mitochondrial Ca2+ buffering. Curr. Biol. 22, 596–600. doi: 10.1016/j.cub.2012.02.043
Bittner, G. D., Schallert, T., and Peduzzi, J. D. (2000). Degeneration, trophic interactions, and repair of severed axons: a reconsideration of some common assumptions. Neuroscientist 6, 88–109.
Bittner, G. D., Sengelaub, D. R., Trevino, R. C., Peduzzi, J. D., Mikesh, M., Ghergherehchi, C. L., et al. (2016). The curious ability of polyethylene glycol fusion technologies to restore lost behaviors after nerve severance. J. Neurosci. Res. 94, 207–230. doi: 10.1002/jnr.23685
Coleman, M. (2005). Axon degeneration mechanisms: commonality amid diversity. Nat. Rev. Neurosci. 6, 889–898. doi: 10.1038/nrn1788
Conforti, L., Tarlton, A., Mack, T. G., Mi, W., Buckmaster, E. A., Wagner, D., et al. (2000). A Ufd2/D4Cole1e chimeric protein and overexpression of Rbp7 in the slow Wallerian degeneration (Wlds) mouse. Proc. Natl. Acad. Sci. U.S.A. 97, 11377–11382. doi: 10.1073/pnas.97.21.11377
Freeman, M. R. (2014). Signaling mechanisms regulating Wallerian degeneration. Curr. Opin. Neurobiol. 27, 224–231. doi: 10.1016/j.conb.2014.05.001
Gerdts, J., Summers, D. W., Sasaki, Y., DiAntonio, A., and Milbrandt, J. (2013). Sarm1-mediated axon degeneration requires both SAM and TIR interactions. J. Neurosci. 33, 13569–13580. doi: 10.1523/JNEUROSCI.1197-13.2013
Geuna, S., Raimondo, S., Ronchi, G., Di Scipio, F., Tos, P., Czaja, K., et al. (2009). Chapter 3: histology of the peripheral nerve and changes occurring during nerve regeneration. Int. Rev. Neurobiol. 87, 27–46. doi: 10.1016/S0074-7742(09)87003-7
Gu, X., Ding, F., Yang, Y., and Liu, J. (2011). Construction of tissue engineered nerve grafts and their application in peripheral nerve regeneration. Prog. Neurobiol. 93, 204–230. doi: 10.1016/j.pneurobio.2010.11.002
Hamza, T. H., Chen, H., Hill-Burns, E. M., Rhodes, S. L., Montimurro, J., Kay, D. M., et al. (2011). Genome-wide gene-environment study identifies glutamate receptor gene GRIN2A as a Parkinson's disease modifier gene via interaction with coffee. PLoS Genet. 7:e1002237. doi: 10.1371/journal.pgen.1002237
Huang da, W., Sherman, B. T., and Lempicki, R. A. (2009a). Bioinformatics enrichment tools: paths toward the comprehensive functional analysis of large gene lists. Nucleic Acids Res. 37, 1–13. doi: 10.1093/nar/gkn923
Huang da, W., Sherman, B. T., and Lempicki, R. A. (2009b). Systematic and integrative analysis of large gene lists using DAVID bioinformatics resources. Nat. Protoc. 4, 44–57. doi: 10.1038/nprot.2008.211
Karin, M. (1990). Too many transcription factors: positive and negative interactions. New Biol. 2, 126–131.
Kong, Y., Liang, X., Liu, L., Zhang, D., Wan, C., Gan, Z., et al. (2015). High throughput sequencing identifies microRNAs mediating alpha-synuclein toxicity by targeting neuroactive-ligand receptor interaction pathway in early stage of Drosophila Parkinson's Disease Model. PLoS ONE 10:e0137432. doi: 10.1371/journal.pone.0137432
Latchman, D. S. (1997). Transcription factors: an overview. Int. J. Biochem. Cell Biol. 29, 1305–1312. doi: 10.1016/S1357-2725(97)00085-X
Lee, B. B., Cripps, R. A., Fitzharris, M., and Wing, P. C. (2014). The global map for traumatic spinal cord injury epidemiology: update 2011, global incidence rate. Spinal Cord 52, 110–116. doi: 10.1038/sc.2012.158
Li, M., Guo, W., Zhang, P., Li, H., Gu, X., and Yao, D. (2013). Signal flow and pathways in response to early Wallerian degeneration after rat sciatic nerve injury. Neurosci. Lett. 536, 56–63. doi: 10.1016/j.neulet.2013.01.008
Li, M., Zhang, P., Guo, W., Li, H., Gu, X., and Yao, D. (2014). Protein expression profiling during wallerian degeneration after rat sciatic nerve injury. Muscle Nerve 50, 73–78. doi: 10.1002/mus.24082
Loreto, A., Di Stefano, M., Gering, M., and Conforti, L. (2015). Wallerian degeneration is executed by an NMN-SARM1-dependent late Ca(2+) influx but only modestly influenced by Mitochondria. Cell Rep. 13, 2539–2552. doi: 10.1016/j.celrep.2015.11.032
Mack, T. G., Reiner, M., Beirowski, B., Mi, W., Emanuelli, M., Wagner, D., et al. (2001). Wallerian degeneration of injured axons and synapses is delayed by a Ube4b/Nmnat chimeric gene. Nat. Neurosci. 4, 1199–1206. doi: 10.1038/nn770
Mishra, B., Carson, R., Hume, R. I., and Collins, C. A. (2013). Sodium and potassium currents influence Wallerian degeneration of injured Drosophila axons. J. Neurosci. 33, 18728–18739. doi: 10.1523/JNEUROSCI.1007-13.2013
Patodia, S., and Raivich, G. (2012). Role of transcription factors in peripheral nerve regeneration. Front. Mol. Neurosci. 5:8. doi: 10.3389/fnmol.2012.00008
Ritchie, M. E., Phipson, B., Wu, D., Hu, Y., Law, C. W., Shi, W., et al. (2015). limma powers differential expression analyses for RNA-sequencing and microarray studies. Nucleic Acids Res. 43:e47. doi: 10.1093/nar/gkv007
Sakakima, H., Yoshida, Y., Yamazaki, Y., Matsuda, F., Ikutomo, M., Ijiri, K., et al. (2009). Disruption of the midkine gene (Mdk) delays degeneration and regeneration in injured peripheral nerve. J. Neurosci. Res. 87, 2908–2915. doi: 10.1002/jnr.22127
Schlaepfer, W. W. (1974). Calcium-induced degeneration of axoplasm in isolated segments of rat peripheral nerve. Brain Res. 69, 203–215. doi: 10.1016/0006-8993(74)90002-X
Sta, M., Cappaert, N. L., Ramekers, D., Baas, F., and Wadman, W. J. (2014). The functional and morphological characteristics of sciatic nerve degeneration and regeneration after crush injury in rats. J. Neurosci. Methods 222, 189–198. doi: 10.1016/j.jneumeth.2013.11.012
Vargas, M. E., and Barres, B. A. (2007). Why is Wallerian degeneration in the CNS so slow? Annu. Rev. Neurosci. 30, 153–179. doi: 10.1146/annurev.neuro.30.051606.094354
Waller, A. (1850). Experiments on the section of the glossopharyngeal and hypoglossal nerves of the frog, and observations of the alterations produced thereby in the structure of their primitive fibres. Philos. Transact. R. Soc. Lond. 140, 423–429.
Xu, A., and Sun, S. (2015). Genomic profiling screens small molecules of metastatic prostate carcinoma. Oncol. Lett. 10, 1402–1408. doi: 10.3892/ol.2015.3472
Yao, D., Li, M., Shen, D., Ding, F., Lu, S., Zhao, Q., et al. (2012). Gene expression profiling of the rat sciatic nerve in early Wallerian degeneration after injury. Neural Regen. Res. 7, 1285–1292. doi: 10.3969/j.issn.1673-5374.2012.17.001
Yao, D., Li, M., Shen, D., Ding, F., Lu, S., Zhao, Q., et al. (2013). Expression changes and bioinformatic analysis of Wallerian degeneration after sciatic nerve injury in rat. Neurosci. Bull. 29, 321–332. doi: 10.1007/s12264-013-1340-0
Yu, B., Zhou, S., Wang, Y., Qian, T., Ding, G., Ding, F., et al. (2012). miR-221 and miR-222 promote Schwann cell proliferation and migration by targeting LASS2 after sciatic nerve injury. J. Cell Sci. 125, 2675–2683. doi: 10.1242/jcs.098996
Keywords: Wallerian degeneration, peripheral nerve injury, microarray, gene expression, bioinformatic analysis
Citation: Yi S, Tang X, Yu J, Liu J, Ding F and Gu X (2017) Microarray and qPCR Analyses of Wallerian Degeneration in Rat Sciatic Nerves. Front. Cell. Neurosci. 11:22. doi: 10.3389/fncel.2017.00022
Received: 16 December 2016; Accepted: 23 January 2017;
Published: 10 February 2017.
Edited by:
Hansen Wang, University of Toronto, CanadaReviewed by:
Ruben Lopez-Vales, Autonomous University of Barcelona, SpainGeorge Davis Bittner, University of Texas at Austin, USA
Copyright © 2017 Yi, Tang, Yu, Liu, Ding and Gu. This is an open-access article distributed under the terms of the Creative Commons Attribution License (CC BY). The use, distribution or reproduction in other forums is permitted, provided the original author(s) or licensor are credited and that the original publication in this journal is cited, in accordance with accepted academic practice. No use, distribution or reproduction is permitted which does not comply with these terms.
*Correspondence: Fei Ding, ZGluZ2ZlaUBudHUuZWR1LmNu
Xiaosong Gu, bmVydmVndUBudHUuZWR1LmNu
†These authors have contributed equally to this work.