 Justin J. Grassmeyer
 Wallace B. Thoreson
- 1Department of Pharmacology and Experimental Neuroscience, University of Nebraska Medical Center, Omaha, NE, United States
- 2Truhlsen Eye Institute and Department of Ophthalmology and Visual Sciences, University of Nebraska Medical Center, Omaha, NE, United States
Cone photoreceptors depolarize in darkness to release glutamate-laden synaptic vesicles. Essential to release is the synaptic ribbon, a structure that helps organize active zones by clustering vesicles near proteins that mediate exocytosis, including voltage-gated Ca2+ channels. Cone terminals have many ribbon-style active zones at which second-order neurons receive input. We asked whether there are functionally significant differences in local Ca2+ influx among ribbons in individual cones. We combined confocal Ca2+ imaging to measure Ca2+ influx at individual ribbons and patch clamp recordings to record whole-cell ICa in salamander cones. We found that the voltage for half-maximal activation (V50) of whole cell ICa in cones averaged −38.1 mV ± 3.05 mV (standard deviation [SD]), close to the cone membrane potential in darkness of ca. −40 mV. Ca2+ signals at individual ribbons varied in amplitude from one another and showed greater variability in V50 values than whole-cell ICa, suggesting that Ca2+ signals can differ significantly among ribbons within cones. After accounting for potential sources of technical variability in measurements of Ca2+ signals and for contributions from cone-to-cone differences in ICa, we found that the variability in V50 values for ribbon Ca2+ signals within individual cones showed a SD of 2.5 mV. Simulating local differences in Ca2+ channel activity at two ribbons by shifting the V50 value of ICa by ±2.5 mV (1 SD) about the mean suggests that when the membrane depolarizes to −40 mV, two ribbons could experience differences in Ca2+ influx of >45%. Further evidence that local Ca2+ changes at ribbons can be regulated independently was obtained in experiments showing that activation of inhibitory feedback from horizontal cells (HCs) to cones in paired recordings changed both amplitude and V50 of Ca2+ signals at individual ribbons. By varying the strength of synaptic output, differences in voltage dependence and amplitude of Ca2+ signals at individual ribbons shape the information transmitted from cones to downstream neurons in vision.
Introduction
Photoreceptors release glutamate-laden vesicles at rates continuously regulated by graded, light-driven changes in membrane voltage (Vm). To sustain this continuous and abundant output, the number of vesicles in a photoreceptor terminal exceeds that of a conventional hippocampal synapse by more than two orders of magnitude and photoreceptors possess specialized presynaptic structures called ribbons that organize and coordinate vesicular release (Sterling and Matthews, 2005; Schmitz, 2009). Cones can have up to 50 ribbon-style active zones that are typically separated from one another by 500 nm or more within the synaptic terminal (DeVries et al., 2006), while mammalian rods generally possess only a single ribbon (Carter-Dawson and LaVail, 1979; Sterling and Matthews, 2005). Synaptic vesicles are tethered to a ribbon by thin filaments but can move freely along the ribbon surface (Graydon et al., 2014). Beneath each ribbon sits a cluster of L-type Ca2+ channels and other presynaptic proteins that control the exocytosis of synaptic vesicles (Mercer and Thoreson, 2011; Lv et al., 2016; Maxeiner et al., 2016). Ribbon-localized Ca2+ channels mediate nearly all of the photoreceptor Ca2+ current (ICa; Mansergh et al., 2005; Xu and Slaughter, 2005; Mercer and Thoreson, 2011). The opening of Ca2+ channels generates large increases in Ca2+ just beneath the ribbon, with the subsequent Ca2+ spread determined by both the magnitude of influx and intracellular buffering conditions (Choi et al., 2008; Van Hook and Thoreson, 2015). Vesicular release from cones, like many other CNS synapses (Brandt et al., 2005; Goutman and Glowatzki, 2007; Jarsky et al., 2010; Eggermann et al., 2011), is regulated by Ca2+ levels attained only within highly localized nanodomains adjacent to open Ca2+ channels (Bartoletti et al., 2011). Nanodomain control of release and the fact that ribbon-associated Ca2+ signals can remain spatially restricted from one another suggest that differences in Ca2+ dynamics among individual photoreceptor ribbons could diversify signals transmitted to postsynaptic neurons.
Ribbon-bearing cochlear inner hair cells exhibit significant differences in the amplitude and voltage dependence of ribbon-localized Ca2+ signals that are thought to contribute to diversity in firing rate, sound threshold, and dynamic range among second-order spiral ganglion neurons (Frank et al., 2009; Ohn et al., 2016). Significant differences in Ca2+ influx arising from local differences in the function or subunit composition of Ca2+ channels at different hippocampal synapses have also been observed (Éltes et al., 2017). Voltage dependence might also vary at different synapses as a consequence of local differences in the ionic environment and neuromodulatory influence. Changes of only a few millivolts in the midpoint activation voltage (V50) for ICa, such as those caused by inhibitory feedback from horizontal cells (HCs; Verweij et al., 1996), can produce functionally significant changes in synaptic output from cones. In this study, we asked whether ribbons within individual cones show functionally significant differences in the voltage dependence of ribbon-associated Ca2+ channels, allowing them to operate independently from one another. Alternatively, all ribbons within an individual cone may exhibit the same voltage dependence and function more like a single distributed ribbon.
To assess the functional independence of Ca2+ responses at individual ribbon synapses in cones, we combined whole-cell patch clamp recordings of ICa with confocal imaging of individual ribbons in a vertical slice preparation of salamander retina. After accounting for cone-to-cone differences and potential technical sources of variability, we found significant intrinsic differences in the amplitude and voltage dependence of Ca2+ influx among ribbons within individual cones. In the absence of negative feedback from HCs, the intrinsic variability in V50 values among ribbons (standard deviation [SD] = 2.5 mV) is sufficient to produce differences in Ca2+ influx at individual ribbons of 45% or more at a cone’s resting membrane potential in darkness. We assessed the sensitivity of confocal Ca2+ measurements by manipulating extracellular pH to produce 3 mV shifts in voltage dependence. By directly manipulating HC membrane potential in paired whole-cell recordings with cones, we confirmed the ability of ribbons operate independently by showing that inhibitory feedback from an individual HC was capable of altering Ca2+ responses at some ribbons but not others in a cone terminal (Thoreson and Mangel, 2012). In contrast to the traditional view that the membrane potential in cones in darkness sits near the foot of the ICa activation curve (Barnes and Kelly, 2002), we found that the average V50 for whole-cell ICa and ribbon Ca2+ signals was near the dark resting membrane potential. This arrangement is optimal for signaling small changes in voltage produced by small changes in illumination (Sterling and Laughlin, 2015). Ribbon-to-ribbon differences in voltage dependence and amplitude of Ca2+ responses can produce ribbon-to-ribbon differences in synaptic gain and thus expand the transformations available to an individual cone for encoding light-evoked voltage responses into changes in synaptic release. This may improve the ability of a cone to signal luminance changes over a wide range of intensities.
Materials and Methods
Animal Care and Use
All experiments were performed using ex vivo vertical slices of retina from aquatic tiger salamanders (Ambystoma tigrinum; Charles Sullivan Co., Nashville, TN, USA) of both sexes (18–25 cm in length). We used cones from salamander retina for these studies because the ribbons in these cells are sufficiently far apart to be distinguished by optical imaging and because the synaptic terminal sits at the base of the cell body where it can be effectively voltage-clamped. All animal care and handling protocols were approved by the University of Nebraska Medical Center Institutional Animal Care and Use Committee. Euthanasia was conducted in accordance with AVMA Guidelines for the Euthanasia of Animals. Salamanders were kept on a 12-h dark/light cycle at 4–8°C.
Slice Preparation
One to two hours after onset of the dark cycle, salamanders were euthanized by decapitation and rapidly pithed. The eyes were enucleated, the retina isolated, and vertical retinal slices (125 μm thickness) were prepared as described in detail elsewhere (Van Hook and Thoreson, 2013).
Patch Clamp Electrophysiology
Throughout the experiments, the slice chamber was superfused at ~1 ml/min with chilled amphibian saline solution bubbled with 100% O2 (HEPES solution, standard conditions) or 95% O2/5% CO2 ( solution, when noted in text). The HEPES-buffered saline contained (in mM): 116 NaCl, 2.5 KCl, 1.8 CaCl2, 0.5 MgCl2, 5 glucose and 10 HEPES. The pH of this solution was adjusted to 7.8 (or 7.6 when noted in text) with NaOH. The bicarbonate-buffered solution contained (in mM): 101 NaCl, 2.5 KCl, 2.0 CaCl2, 0.5 MgCl2, 11 glucose and 22 NaHCO3. For both solutions, the osmolality was measured with a vapor pressure osmometer (Wescor) and if necessary adjusted to ~245 mOsm. Patch pipettes were pulled with a PP-830 or PC-10 vertical pipette puller (Narishige) from borosilicate glass pipettes (1.2 mm OD, 0.9 mm ID, with internal filament; World Precision Instruments) and had resistances of 9–15 MΩ. For some experiments, pipette shafts were coated with dental wax to reduce stray capacitance. The intracellular pipette solution contained (in mM): 50 CsGluconate, 40 CsGlutamate, 10 TEACl, 3.5 NaCl, 1 CaCl2, 1 MgCl2, 9.4 MgATP and 0.5 GTP-Na, 5 EGTA. After salts were dissolved, the pH was adjusted to 7.2 with CsOH (osmolality = 235–240 mOsm). All chemical reagents were from Sigma-Aldrich unless indicated otherwise.
Experiments were performed on an upright fixed-stage microscope (Nikon E600FN) under a water-immersion objective (60×, 1.0 NA). Cells were identified morphologically and recording electrodes were positioned with Huxley-Wall micromanipulators (Sutter Instruments). After obtaining a gigaohm seal, the patch was ruptured with gentle suction. Photoreceptor and HC recordings were conducted in voltage clamp and were performed using Alembic VE-2 (Alembic Instruments) and Axopatch 200B (Axon Instruments/Molecular Devices) amplifiers, respectively. Cone membrane currents from the Alembic were low-pass filtered at 3 kHz and HC currents from the Axopatch were filtered at 2 kHz. Some membrane currents were low-pass filtered at 200 Hz to facilitate data presentation. Signals were digitized with a Digidata 1322A (Axon Instruments, Molecular Devices) and acquired with pClamp 10 software (Molecular Devices). Series resistance was maximally compensated in every cone before recording using the Alembic amplifier, which allows stable compensation (Sherman et al., 1999).
Whole-cell ICa was measured using a ramp voltage protocol (−99 to +51 mV, 0.5 mV/ms) applied from a steady holding potential of −79 mV. Voltage-dependent and Ca2+-activated K+ currents in cones were blocked by TEA in the pipette solution and hyperpolarizing-activated cation currents (Ih) were inhibited by Cs+ (Barnes and Hille, 1989). Ca2+-activated chloride currents were reduced by use of 5 mM EGTA but also activate slowly during the ramp protocol and are therefore only evident after the voltage ramp has moved above +20 mV (unpublished observations). For determination of V50 values, passive membrane resistance was subtracted from ramp currents using P/8 subtraction. Comparison of currents obtained in the presence of and absence of Cd2+ (0.1 mM) yielded the same current/voltage profiles for photoreceptor ICa (Stella and Thoreson, 2000). Consistent with earlier results (Stella and Thoreson, 2000), we also found that when we compared ICa evoked during the sequence of voltage steps used for Ca2+ measurements (described below) to ICa measured using the ramp voltage protocol (n = 6 cones), we observed the same voltage dependence with both measurements.
Most of the Ca2+ imaging experiments described in this study used 175 ms depolarizing steps applied from a steady holding potential of −79 mV (−39 to −19 mV, 5 mV increments) with 2 s between each step. We compared results obtained when the steps were applied in both forward and reverse order (forward: −39 to −19 mV, reverse: −19 to −39 mV). In trials where steps were applied in the forward order, ribbon Ca2+ signals yielded V50 values that were 2.06 ± 1.38 mV more positive than whole cell ICa measured in the same cones (n = 10 ribbons, n = 7 cones). In trials where steps were applied in the reverse order, ribbon Ca2+ signals yielded V50 values that were 2.17 ± 0.97 mV more negative than whole cell ICa (n = 10 ribbons, n = 7 cones). Values from the two different measurement sequences thus straddled the values for ICa. Photoreceptor ICa in salamander rods shows slow and weak Ca2+-dependent inactivation (τ = 1.7 s; Corey et al., 1984; Rabl and Thoreson, 2002). To reduce the potential impact of Ca2+-dependent inactivation, we performed step series in the forward order. As addressed in the results, the more-positive V50 values obtained when steps are applied in the forward direction results at least in part from using the low affinity Ca2+ dye that does not readily detect small Ca2+ changes at weak voltages. For some of the later experiments on HC to cone feedback, we also used a staircase protocol in which we did not return to baseline (−79 mV) between test voltages to speed data acquisition during paired recordings. Voltage dependence measured with the two protocols did not differ noticeably.
Whole cell membrane resistance and capacitance in cones averaged 192 ± 88.9 MΩ and 80 ± 16.4 pF, respectively (mean ± SD, n = 47 cones). We excluded recordings if the current needed to voltage clamp a cone at −79 mV exceeded 250 pA or if the series resistance prior to compensation exceeded 60 MΩ. When multiple recordings within a cell were compared or averaged (e.g., when comparing ramp ICa with step-evoked Ca2+ signals), only trials with holding currents within 50 pA of one another were compared. When multiple stimulus trials were conducted within a cell, we waited at least 1 min between trials. We corrected membrane voltage values for a measured liquid junction potential by subtracting 9 mV.
Confocal Ca2+ Imaging
Confocal imaging was performed with Nikon Elements software using a laser confocal scanhead (Perkin Elmer Ultraview LCI) equipped with a cooled CCD camera (Orca ER) mounted on the Nikon E600FN. Excitation at 488 or 568 nm was delivered from an argon/krypton laser and emission was collected at 525 or 600 nm, respectively, by a cooled CCD camera (Hamamatsu OrcaER). Filters were controlled using a Sutter Lambda 10–2 filter wheel and controller. The objective was controlled using a E662 z-axis controller (Physik Instrumente). Cell-impermeant Ca2+ indicators Oregon Green 488 BAPTA-5N (OGB-5N, Kd = 20 μM, Thermo Fisher) or Oregon Green 488 BAPTA-6F (OGB-6F, Kd = 3 μM, Thermo Fisher) were added to the patch pipette solution at 400 μM. Images (57 ms/frame) were acquired during the voltage step protocol described above and analyzed using Nikon Elements 4.5 and Microsoft Excel software. Fluorescence values were measured as the mean pixel intensity within the region of interest (ROI). Baseline Ca2+ signal fluorescence was calculated by averaging signals during the first 1.3 s of the imaging trial when the photoreceptor was voltage clamped steadily at −79 mV. Fluorescence changes (∆F) evoked by depolarizing voltage steps were compared to baseline fluorescence (F) and the resultant ∆F/F ratios were normalized to the largest fluorescence change in each trial before using nonlinear regression to determine V50 values (see Figure 1). Reduction in ∆F/F amplitude induced by activation of HC negative feedback during paired recordings was quantified by comparing the maximum Ca2+ ∆F/F change in the absence of feedback to ∆F/F elicited by the same stimulus in the presence of feedback. Ribbons were defined as being subject to negative feedback if ∆F/F was reduced during HC depolarization in at least four out of five depolarizing steps (−39 to −19 mV) in two consecutive trials.
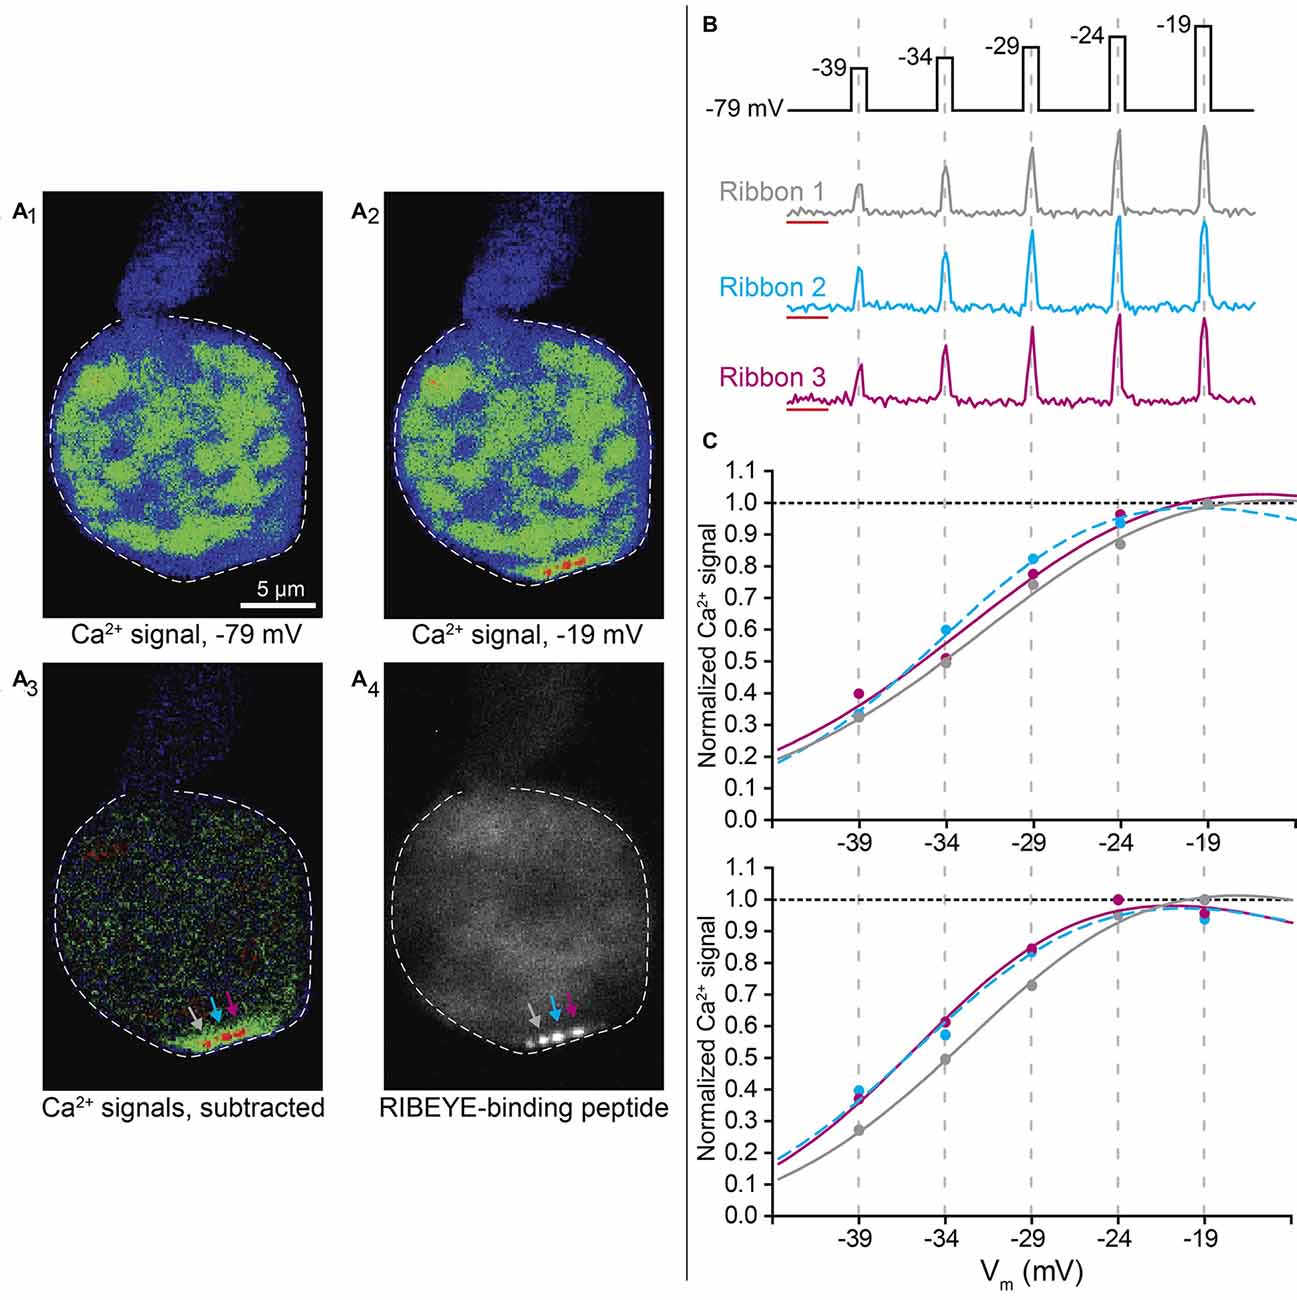
Figure 1. Depolarizing steps result in areas of localized Ca2+ influx at cone ribbons. (A) Example of a cone loaded with the low-affinity Ca2+ indicator OGB-5N and TAMRA-conjugated RIBEYE-binding peptide. A series of depolarizing steps was delivered to the cell to stimulate Ca2+ influx (from −79 mV to test potentials ranging from −39 mV to −19 mV in 5 mV increments, 175 ms apiece). Panel (A1) shows the pseudocolor fluorescence image (single 57 ms frame) of OGB-5N fluorescence in a cone prior to stimulation. Panel (A2) shows an image from the same cone during a depolarizing step to −19 mV. Panel (A3) shows the difference image obtained by subtracting the control image in (A1) from the test image in (A2), revealing three distinct sites of Ca2+ influx in the terminal (arrows). In this cone, TAMRA-conjugated RIBEYE-binding peptide was also delivered by patch pipette, and the labeled ribbons observed at the same confocal plane are shown in panel (A4). (B) The cone voltage stimulation protocol and Ca2+ responses of the three ribbons shown in Panel (A). Traces show the fractional change in fluorescence over baseline (∆F/F). The region used to measure baseline fluorescence during the first 1.3 s is shown by the red lines. The graphs show ∆F/F measured in the three ribbons simultaneously during a single trial of the voltage stimulus protocol. (C) Data from two separate trials in this same cone showing peak ∆F/F values for each depolarizing stimulus plotted against test step potential after normalizing to the ribbon’s maximum ∆F/F within the trial. The voltage dependence was determined by fitting these data with a Boltzmann function adjusted for Ca2+ driving force (lines). Best fit V50 and slope factor values for trial 1: ribbon 1, −28.94 mV (95% confidence interval: −32.25 to −17.56 mV), 7.145; ribbon 2, −32.61 mV (−5.03 to −30.20), 5.616; ribbon 3, −29.91 mV (−42.25 to −17.562), 7.214. Best fit values for trial 2: ribbon 1, −30.46 mV (−33.75 to −27.17 mV), 6.240; ribbon 2, −33.61 mV (−40.36 to −26.86), 6.028; ribbon 3 −33.93 mV (−37.07 to −30.79), 5.621.
We measured the optical resolution of our system using fluorescent microbeads. The full width half maxima (FWHM; 2.355 × SD) of Gaussian functions fit to the fluorescence profiles in the x-y plane averaged 318 and 455 nm for 525 and 600 nm emission, respectively. To measure resolution in the z-axis, we acquired a z-stack and measured the fluorescence profile as a function of depth. The FWHM in the z-axis averaged 1.45 and 1.46 μm for 525 and 600 nm emission, respectively.
Data Analysis
Activation profile data from Clampfit, Nikon Elements, and Microsoft Excel was imported to GraphPad Prism to perform nonlinear regression, for statistical analyses, and to generate figures. To calculate V50 values and construct ICa activation curves (G/Gmax), Ca2+ responses were fit with Boltzmann functions adjusted for Ca2+ driving force according to the equation
where Vrev = +41 mV and k is the slope factor of the voltage-dependent activation process. Vrev was the only constrained parameter. Distribution normality was assessed by D’Agostino-Pearson Test. Data is reported as mean ± SD unless indicated otherwise.
Results
Small Differences in the Activation of Ribbon Ca2+ Influx can be Detected
To visualize Ca2+ influx at individual ribbon sites, we used spinning disk confocal microscopy while simultaneously controlling the membrane voltage of individual cones by voltage clamp. We introduced a low-affinity Ca2+ indicator, Oregon Green BAPTA-5N (OGB-5N, Kd = 20 μM), into photoreceptors through the patch pipette and then evoked Ca2+ entry by delivering a series of depolarizing voltage steps. Ca2+ signals elicited in this way were typically constrained to hotspots near ribbons and only well-localized Ca2+ hotspots were analyzed (Zenisek et al., 2003; Choi et al., 2008; Frank et al., 2009; Mercer and Thoreson, 2011; Ohn et al., 2016). Figure 1A shows an example from one cone in which three Ca2+ hotspots were imaged simultaneously in the same confocal plane. Figure 1A1 shows an image obtained prior to depolarizing stimulation while panel A2 shows an image obtained during a depolarizing step to −19 mV. Subtracting the image in panel A1 from that in A2 yielded the difference image shown in A3, in which three Ca2+ hotspots are clearly visible (arrows). In this cell, we also labeled ribbons by introducing a RIBEYE-binding peptide conjugated to tetramethylrhodamine (TAMRA) through the patch pipette (Zenisek et al., 2004). After recording a series of depolarization-induced Ca2+ signals, we obtained a z-stack image to visualize ribbons in the same cone. The three Ca2+ hotspots shown in Figure 1A3 correspond to three distinct fluorescently-labeled ribbons at the plane used for Ca2+ imaging (Figure 1A4). A fourth ribbon that was less strongly labeled was also visible in the same plane but did not produce a discrete Ca2+ hotspot.
Figure 1B illustrates the stimulation protocol used in this and most other experiments by showing ribbon-localized Ca2+ responses evoked with a series of depolarizing test steps for the three ribbons in Figure 1A. At each of these ribbons, Ca2+-dependent fluorescence rose quickly during each depolarizing step and then returned quickly to baseline after the step. The peak fluorescence change (∆F/F) elicited at each stimulation step was normalized to the maximum ∆F/F signal within each trial. The change in ∆F/F as a function of voltage was then fit with a Boltzmann function modified for Ca2+ driving force. Each ribbon site was analyzed independently. Figure 1C shows results from two consecutive stimulation trials in the same cone. In both trials, ribbons 1 and 2 showed a similar difference in voltage dependence from one another, with their half maximal voltage of activation (V50) values differing by 3.67 and 3.15 mV in trials 1 and 2, respectively. In trial 1, the V50 value for ribbon 1 fell outside the 95% confidence interval for ribbon 2. The voltage dependence of ribbon 3 differed more between the two trials, with the difference in V50 between ribbons 1 and 3 increasing from 0.32 mV to 2.70 mV between trials 1 and 2. In trial 2, the V50 value for ribbon 1 fell outside the 95% confidence interval for ribbon 3 and vice versa. Observations from eight other cones also showed reproducible differences in V50 values between ribbons in the same cone suggesting that the voltage dependence of ribbon Ca2+ responses may genuinely differ from one another. In the experiments described below, we quantified these V50 differences after assessing various factors that might confound measurement accuracy.
Evaluating Accuracy of Measuring Ribbon-Localized Ca2+ Responses
To measure Ca2+ changes at individual ribbons, we drew regions of interest (ROIs) around each ribbon-associated hotspot, tightly delineating regions with clear and distinct Ca2+ increases. In experiments where we also included a fluorescent RIBEYE-binding peptide in the patch pipette to label ribbons (e.g., Figure 1A4), ROIs for Ca2+ hotspots were defined by outlining the region of peptide fluorescence in the same confocal plane.
The size of an ROI can influence Ca2+ signal amplitude. To examine the impact of ROI area, we used RIBEYE-binding peptide fluorescence to define the ribbon boundary and then compared the amplitude of depolarization-evoked Ca2+ changes (∆F/F) as we varied ROI size around the ribbon (Figure 2A). As illustrated in Figure 2B, ∆F/F of Ca2+ responses decreased as ROI area was expanded to incorporate weakly responsive regions beyond the ribbon margins (blue border in Figure 2A). Using a very small ROI (4 × 4 pixels, ~0.4 × 0.4 μm, green border in Figure 2A) centered within the Ca2+ hotspot did not increase the amplitude of ∆F/F values beyond those measured with an ROI that delineated the entire ribbon (e.g., magenta border in Figure 2A). Use of such small ROIs placed in sub-regions did, however, increase measurement noise, so we integrated Ca2+ signals within the entire ribbon area to measure ribbon Ca2+ responses.
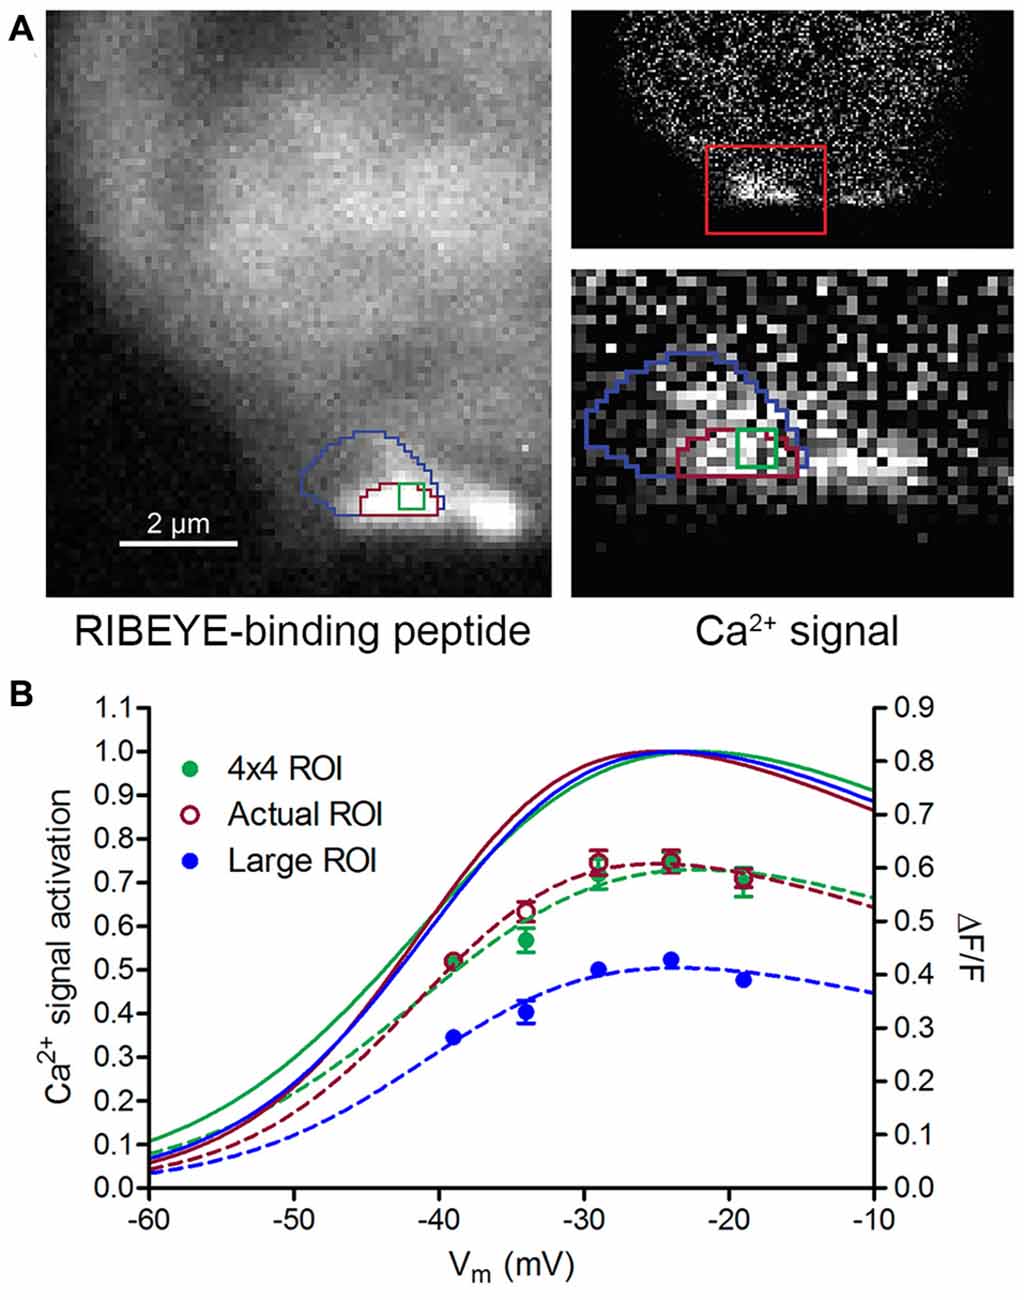
Figure 2. Impact of region of interest (ROI) size on Ca2+ signal measurements. (A) Three measurement ROIs superimposed on images of fluorescent RIBEYE-binding peptide (left) and the Ca2+ signal difference image (right) obtained by subtracting baseline OGB-5N fluorescence at −79 mV from a Ca2+ response at −19 mV. Higher magnification image (width = 5 μm) at the bottom right of panel (A) shows a close-up view of the ribbon-associated Ca2+ hotspot. The ROI with the magenta outline was drawn to correspond to the ribbon boundary as defined by RIBEYE-binding peptide fluorescence. The green ROI represents a 4 × 4 pixel (~0.4 × 0.4 μm) region at the center of ribbon and the large blue ROI encompasses areas surrounding the ribbon. (B) Ca2+ signal ∆F/F and voltage dependence of the three different-sized ROIs in Panel (A). ∆F/F amplitude changes are plotted on the right axis. Boltzmann functions adjusted for driving force fit to ∆F/F values normalized to peak changes are plotted on the left axis. Although ∆F/F amplitudes were reduced considerably by use of the large ROI, the V50 values for the three different-sized ROIs were within 1.1 mV of one another (4 × 4, Actual, and Large ROI V50 values = −38.7, −39.8 and −39.0 mV, respectively). “Actual ROI” measurements were for the magenta ROI shown in panel (A).
While changes in ROI size clearly affected ∆F/F amplitude, the normalized Ca2+ responses in Figure 2B show that the voltage dependence of Ca2+ signals was nearly identical for the three different-sized ROIs shown in Figure 2A. This is because voltage-dependent changes in Ca2+ fluorescence are strongly dominated by the signal at the center of the hotspot and so including additional weakly responsive regions had little impact. Similar comparisons performed in three other cones also showed that increasing ROI size diminished ∆F/F amplitude but did not appreciably alter V50 values for Ca2+ signals. Therefore, while differences in ROI size contributed to ∆F/F amplitude variability in our measurements, they did not appear to significantly alter V50 values.
We also examined the impact of confocal plane on measurements of ribbon Ca2+ signals. In experiments where we introduced fluorescent RIBEYE peptide through the patch pipette, we began Ca2+ measurements in the minutes before sufficient RIBEYE peptide had reached the synaptic terminal to produce strong ribbon labeling. Therefore, we typically selected the Ca2+ measurement plane by iterative positioning of the objective’s z-axis and application of depolarizing steps to locate discrete Ca2+ hotspots. To assess the accuracy of identifying ribbon-localized Ca2+ hotspots in this way, we compared the plane selected for Ca2+ measurements to the plane of the associated ribbon determined from a confocal z-stack of fluorescent RIBEYE peptide labeling (28 ribbons in 11 cones). Ca2+ measurements and z-stack images of RIBEYE fluorescence were typically acquired a few minutes apart from one another and small movements of the recording pipette or tissue during that time may have introduced additional displacements between the two measurements. Nonetheless, Ca2+ measurement planes and the brightest RIBEYE fluorescence planes differed by only 0.38 ± 0.60 μm (Figure 3A). When we examined the z-axis position of single fluorescent beads, we found that the beads imaged with 488 excitation/525 nm emission appeared to be 0.070 ± 0.066 μm (p = 0.009, paired t-test; n = 10 beads) above the same beads imaged with 568 nm excitation/600 nm emission. Taking these optical differences into account reduces the difference between measured planes to 0.31 ± 0.60 μm. This is less than the axial resolution of the 60×, 1.0 NA objective measured at 525 nm emission (1.45 μm). This shows good agreement between planes chosen for Ca2+ signal measurements and ribbon planes identified by RIBEYE peptide labeling.
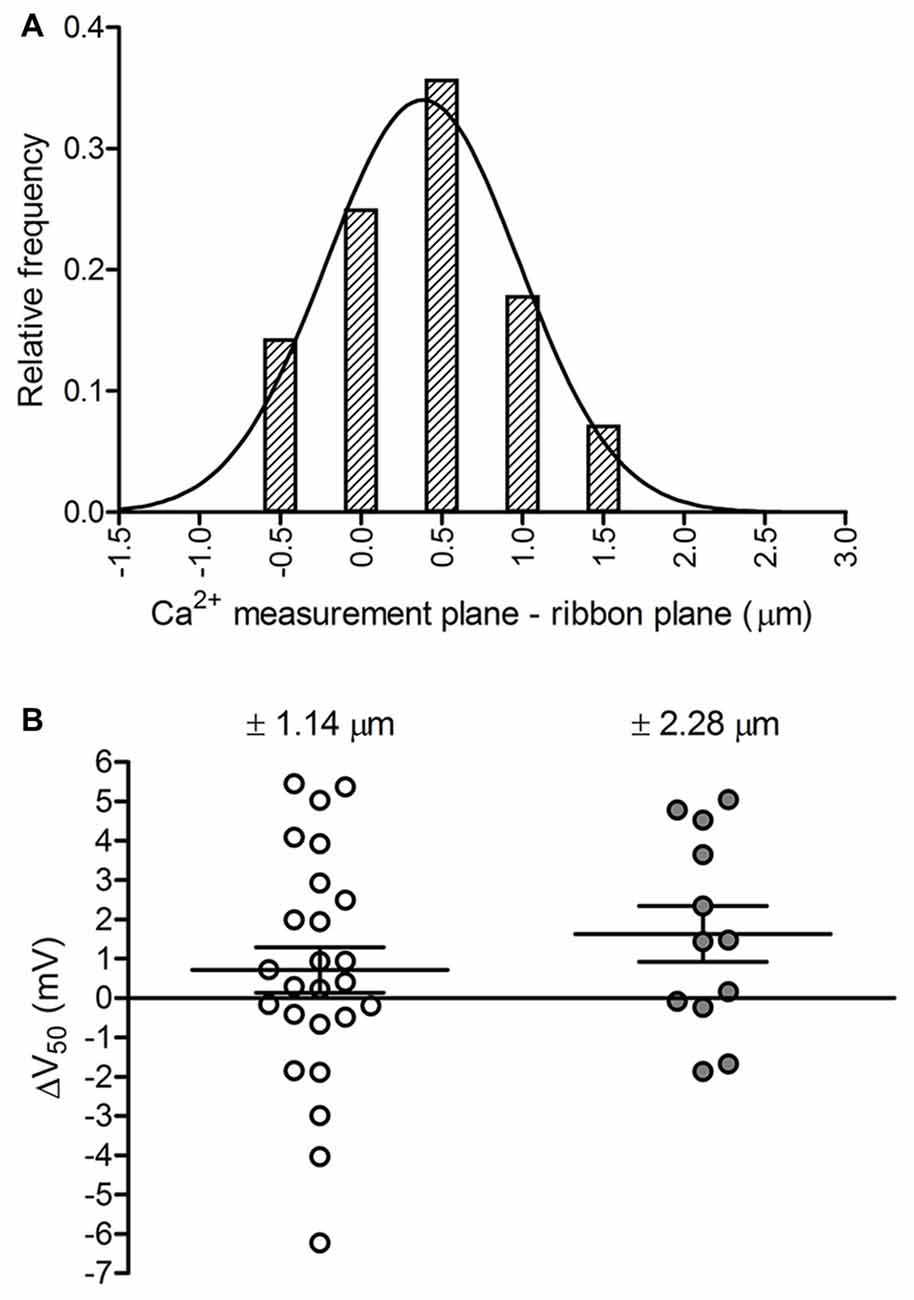
Figure 3. Assessing potential effects of focal plane placement on Ca2+ measurements. (A) Frequency distribution of the distance between the focal plane at which a ribbon’s Ca2+ signal was measured and the plane at which the peak fluorescence of TAMRA-conjugated RIBEYE-binding peptide was observed in a confocal z-stack acquired at the end of the recording (Gaussian mean = 0.38 μm, SD = 0.60 μm; fit R2 = 0.96; n = 28 ribbons in 11 cones). (B) Effect of focal plane position on V50 values. Moving the focal plane of Ca2+ measurement away from the ribbon plane ±1.14 μm shifted V50 values positively by +0.7 ± 2.9 mV (p = 0.23, paired t-test; n = 25 ribbons in 12 cones). Moving the plane ±2.28 μm shifted V50 values by +1.6 ± 2.5 mV (p = 0.04, paired t-test; n = 12 ribbons in 9 cones). Data are displayed as mean ± SEM.
These results show that Ca2+ signals were measured at or very near the actual ribbon plane, but we also considered how imperfect positioning of the focal plane of measurement might impact a ribbon’s calculated V50 value. To do so, we measured Ca2+ responses of a ribbon at one plane and then moved the objective up or down to make a second measurement. Fluorescent peptide was not included in these experiments and so we defined the ribbon plane post hoc as the plane showing the strongest Ca2+ response (largest ∆F/F). As illustrated in Figure 3B, movements of ±1.1 μm away from the plane of the ribbon caused a statistically insignificant V50 shift that averaged +0.7 ± 2.9 mV (p = 0.23) for 25 ribbons in 12 cones. A ±2.3 μm change in focal plane caused a larger, statistically significant positive shift in V50 of +1.6 ± 2.5 mV (p = 0.04). The ability of ±2.3 μm changes in focal plane to produce significant positive shifts in V50 values is likely a consequence of Ca2+ buffering and dye properties, such that greater Ca2+ influx is required to attain levels that can be accurately detected with the low-affinity Ca2+ dye.
Although large errors in focal plane placement can produce significant V50 shifts, these results suggest that iterative z-axis positioning between Ca2+ imaging trials to select the best focal plane resulted in ~95% of Ca2+ measurements being performed in a range spanning 1.2 μm about the ribbon plane. Trial-to-trial differences between V50 values of Ca2+ measurements made at different (±1.1 μm) focal planes did not differ significantly from trial-to-trial differences between V50 values obtained at the same focal plane (p = 0.44, t-test; n = 25 and 20 ribbons, respectively). This further indicates that focal plane selection had little or no impact on measurement variability. Taken together, these results show that Ca2+ signals were measured at focal planes that lay within the axial resolution limit to the true ribbon planes and that small differences among ribbon measurement focal planes did not introduce significant additional variability to V50 values.
Because both focal plane and ROI size can influence the amplitude of ∆F/F measurements in ribbons, we focused most of our analysis on ribbon-to-ribbon differences in voltage dependence. However, there were also genuine differences in Ca2+ influx magnitude among ribbons. For example, while peak ∆F/F values averaged 0.76 ± 0.77, one ribbon showed a peak ∆F/F value of 3.95, more than 4 SD above the average. This large Ca2+ increase was not due to use of a particularly small ROI nor can it be explained by focal plane positioning.
In experiments where we labeled ribbons with a fluorescent RIBEYE-binding peptide, we measured the length of the ribbon in the x-y plane by determining the distance between two points along the ribbon’s longest axis where fluorescence intensity had declined by 50% (full width at half maximum, FWHM). Measurements of ribbon length scale roughly with total ribbon size since the base of the ribbon is longer and varies more than the other two ribbon dimensions. Cone ribbons are 35–60 nm thick and extend <350 nm into the cytoplasm, but the length of a ribbon along its base can be well over 1 μm (Pierantoni and McCann, 1984; Pang et al., 2008). Fluorescently-labeled ribbons measured along their longest axis averaged 1.89 ± 0.87 μm (n = 26). The optical point spread function showed a FWHM of 0.45 μm. Therefore, after consideration of optical blurring, fluorescent measurements of ribbon length are consistent with ultrastructural measurements in light-adapted turtle cones, in which ribbon length averaged 1.2 ± 0.6 μm (Pierantoni and McCann, 1984). This supports the idea that individual Ca2+ hot spots generally arose from activity at individual ribbons.
The length of a ribbon along its base determines the number of vesicles that can be tethered at the plasma membrane and thus determines the size of the readily releasable pool of vesicles (Pang et al., 2008; Bartoletti et al., 2010). We predicted that the number of Ca2+ channels clustered beneath the base of each ribbon would also be correlated with the length of the ribbon. We therefore compared the length of each ribbon to the FWHM of the associated Ca2+ signal. As predicted, we found a strong linear correlation between ribbon size and the spatial extent of the associated Ca2+ signal (Figure 4A, R2 = 0.75).
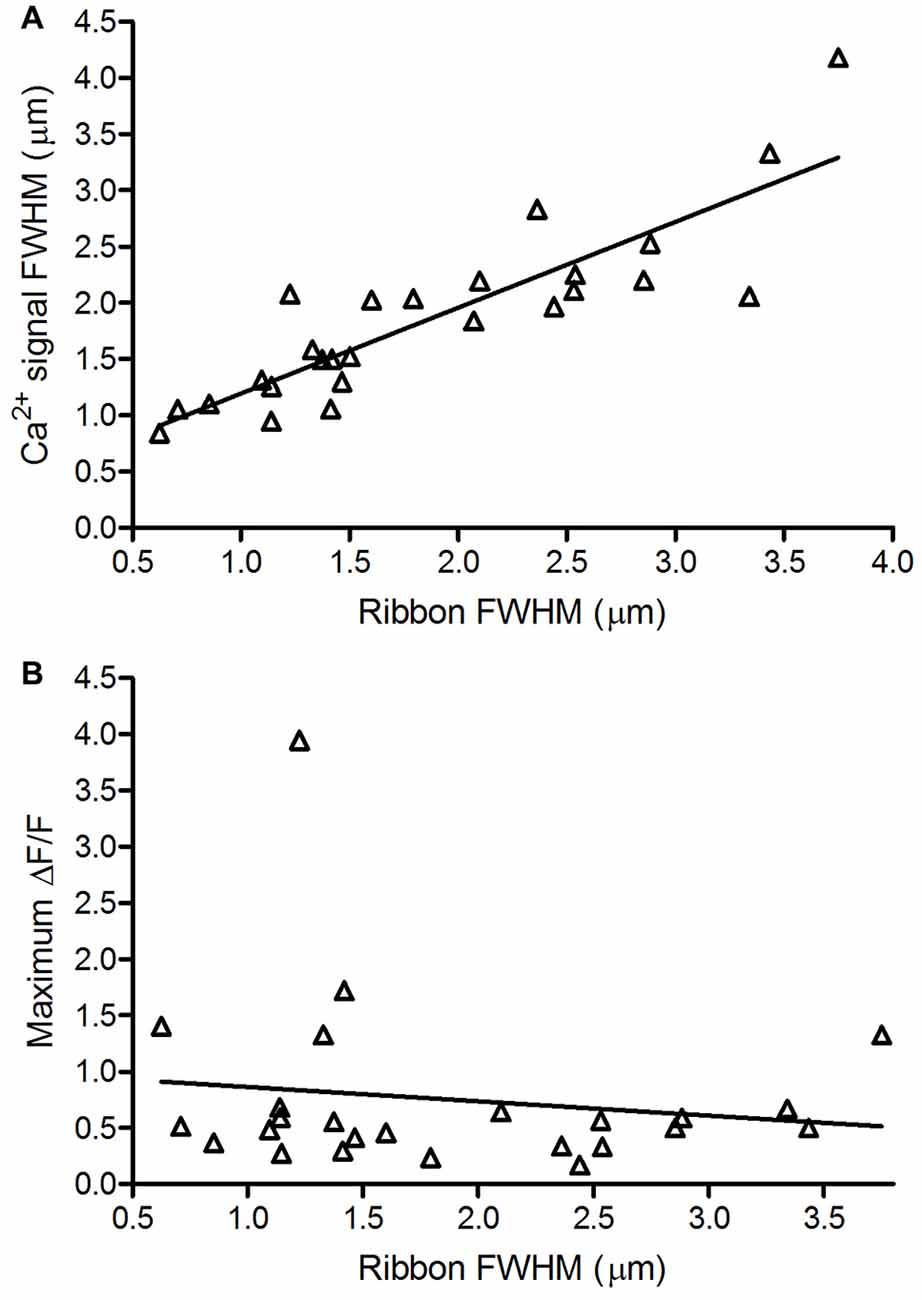
Figure 4. Ribbon size is correlated with Ca2+ domain size but not maximal Ca2+ response amplitude. (A) Spatial extent of Ca2+ signals (1.87 ± 0.77 μm, n = 26; measured as the FWHM of the peak depolarization-evoked OGB-5N fluorescence change) vs. size of the associated ribbon (R2 = 0.75; p < 0.0001, F-test for non-zero slope). (B) Maximum ∆F/F amplitude of Ca2+ signals vs. size of the associated ribbon. Maximum ∆F/F amplitude of Ca2+ signals averaged 0.76 ± 0.77 (n = 25). Ribbon size is represented by the full-width half maximum (FWHM) of the TAMRA-conjugated RIBEYE-binding peptide fluorescence measured along its longest axis in its brightest confocal plane (1.86 ± 0.90 μm, n = 25; R2 = 0.02; p = 0.48, F-test for non-zero slope).
In cochlear inner hair cells, the maximum amplitude of depolarization-evoked Ca2+ signals increased with increasing ribbon size (Frank et al., 2009; Ohn et al., 2016). We found no correlation between ribbon size and peak ∆F/F values attained in the associated Ca2+ hotspot (Figure 4B, R2 = 0.02) and the slope of the regression line did not differ significantly from zero (F-test, p = 0.48). The finding that Ca2+ signals are strongly correlated in spatial extent, but not peak amplitude, with ribbon size suggests that the number of Ca2+ channels generally scales with ribbon size.
The voltage-dependent activation of L-type ICa can be altered changes in extracellular pH (Iijima et al., 1986; Krafte and Kass, 1988; Barnes et al., 1993). To assess our ability to accurately measure small changes in V50 from ribbon-associated changes in Ca2+, we altered the pH of the extracellular saline from 7.8 (control) to 7.6 to induce small changes in voltage dependence of ICa activation. Consistent with earlier measurements of the effect of pH on salamander cone ICa (Barnes and Bui, 1991; Barnes et al., 1993), lowering pH by 0.2 units shifted V50 values of ICa in cones by +3.2 mV (Figure 5, p = 0.03). This 0.2 unit pH change caused a readily detectable and significant shift in the V50 of Ca2+ signals measured optically at individual ribbons in the same cones that averaged +3.3 mV (Figure 5, p = 0.03). These small, reproducible changes in V50 induced by altering extracellular pH confirmed that small differences in Ca2+ signal voltage dependence could be reliably detected at individual ribbons in our experiments.
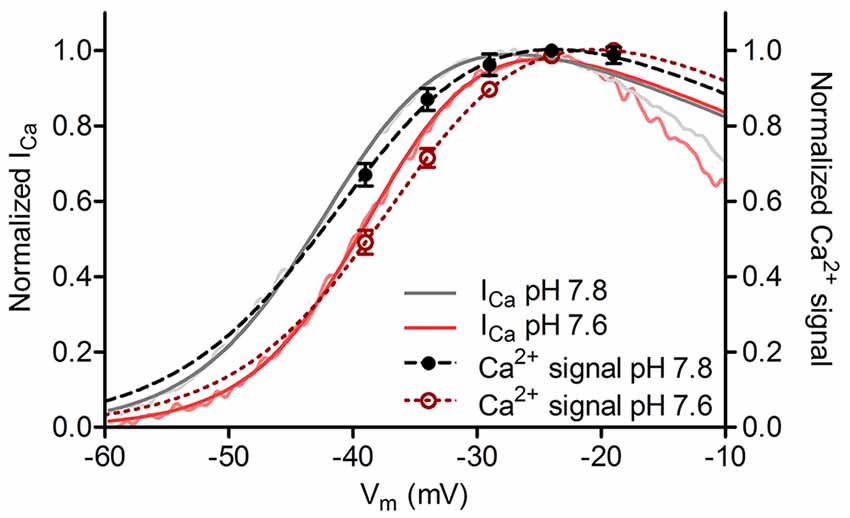
Figure 5. Small changes in voltage dependence of Ca2+ influx could be accurately detected. Cone ICa and ribbon Ca2+ signals plotted against test potential at extracellular pH values of 7.8 and 7.6. Changing the pH of extracellular saline from 7.8 (control condition) to 7.6 produced a positive shift in voltage dependence of ribbon Ca2+ responses (V50 shift = +3.3 mV, dashed lines) and whole cell ICa (V50 shift = +3.2 mV, solid lines; p = 0.03 for both comparisons, paired t-test; n = 8 ribbons in 7 cones). Normalized ICa traces (pink and light gray) were low-pass filtered at 200 Hz to facilitate visual comparison.
Cone-to-Cone ICa V50 Variability
Cone-to-cone differences in the voltage dependence of ICa activation could be a source of post-synaptic variability in bipolar cells as well as a source of variability in V50 values when comparing ribbons in different cones. We therefore examined the variability of V50 values calculated from cone ICa activation curves measured electrophysiologically. Technical variability in measurements of ICa in different cones could arise from differences in series resistance (Rser) during whole-cell patch clamp recordings. To minimize this, we employed an amplifier (Alembic VE-2, Alembic Instruments) with circuitry that allows complete and stable compensation of Rser (Sherman et al., 1999). We measured cone ICa using a ramp voltage protocol (−99 to +51 mV, 0.5 mV/ms) with P/8 subtraction of passive membrane properties and then fit the normalized ICa curve with a Boltzmann function adjusted for driving force. An example of ICa analyzed in this way is shown in Figure 6A, while Figure 6B shows overlaid Boltzmann fits of ICa from 21 cones. Even after compensating for Rser, we found modest differences in the voltage dependence of ICa from cone to cone, with an average V50 of −38.1 ± 3.05 mV (variance = 9.28 mV2, n = 28 cones) and slope factor of 4.90 ± 1.34. The peak amplitude also differed among cones, averaging 163.6 ± 41.6 pA (n = 28).
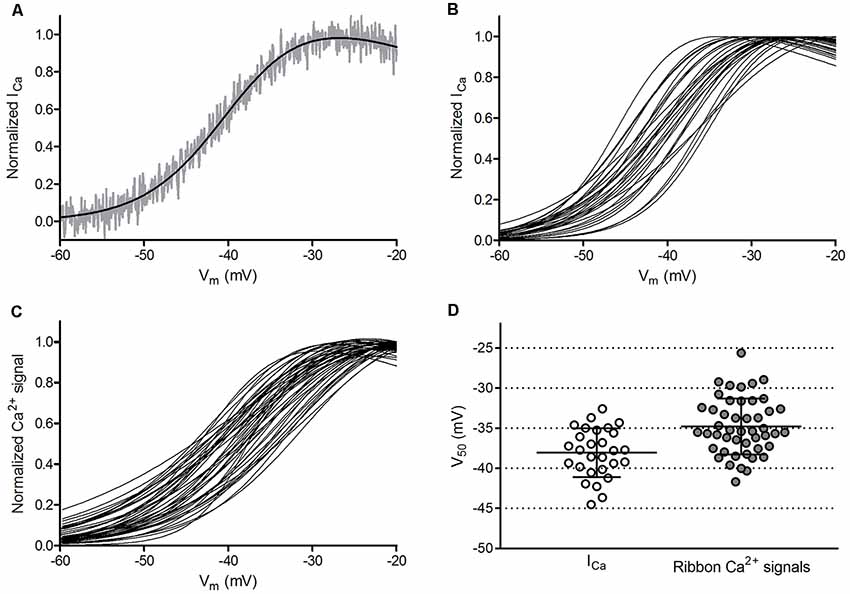
Figure 6. Ribbon-to-ribbon Ca2+ activation is more variable than cone-to-cone ICa activation. (A) ICa in one cone with Rser completely compensated. ICa was normalized to its peak value and plotted against the cone holding potential during the voltage ramp protocol (gray trace). A Boltzmann function adjusted for driving force was fit to these data (black line, V50 = −39.3, slope factor = 4.88). Inward currents are plotted upward to compare more easily with Ca2+ signal measurements. For this illustration, currents were digitally corrected for the passive membrane resistance measured in the range from −85 mV to −70 mV. (B) Overlaid Boltzmann function fits to normalized ICa from the 28 cones in which ribbon Ca2+ signals in Panel (C) were measured. (C) Overlaid Boltzmann function fits to ribbon-associated Ca2+ signals of 47 ribbons in the 28 cones shown in Panel (B). Ribbons were analyzed as illustrated in Figure 1. (D) Distribution of V50 values calculated from Boltzmann function fits to ICa (average = −38.1 ± 3.0 mV) and optical ribbon Ca2+ measurements made with OGB-5N (average = −34.8 ± 3.5 mV). Bars show the mean ± SD.
We analyzed trial-to-trial variability of V50 values obtained from repeated ICa measurements in the same cone, which produced an average variance of 1.0 mV2 (SD = 1.0 mV). The Alembic amplifier circuitry allows near complete compensation for Rser, but the Clampex membrane test evaluator suggested a small residual Rser averaging 2.1 ± 0.58 MΩ (n = 36). In 14 of the 28 cones used for ribbon analysis, we calculated the voltage error that would be introduced by Rser after accounting for both the steady holding current and the magnitude of the inward ICa at its activation midpoint. The voltage error in these recordings caused by residual, uncompensated Rser averaged 0.54 ± 0.19 mV, indicating that the true V50 for the cones in our analysis is slightly more negative than the value reported above. Additionally, this analysis shows that variability in residual Rser among cones had a negligible impact on variance (0.04 mV2) in ICa V50 values among cones.
Assuming a cone should have an unchanging ICa voltage dependence, the genuine biological variability for ICa V50 among cones would have a SD of 2.9 mV (variance = 8.24 mV2 after subtracting trial-to-trial and Rser variance). Our recordings were largely performed in large single cones but also included some small single cones and double cones (Mariani, 1986; Sherry et al., 1998). V50 values for ICa showed a single Gaussian distribution (Figure 6), suggesting considerable overlap of voltage dependence among subtypes. Furthermore, in a separate set of experiments using the same ramp protocol to measure ICa, we found no significant differences in V50 values among these three cone subtypes (p = 0.56, analyses of variance (ANOVA); n = 5 small single cones, 6 large single cones, 6 principal members of double cones). The traditional view is that the membrane potential for cones in darkness (−40 mV) rests near the foot of the activation curve for ICa (Barnes and Kelly, 2002), but our results indicate that ICa would attain approximately half-maximal activation in darkness. As discussed later, small cone-to-cone differences in resting membrane potential and ICa V50 values can produce functionally significant differences in Ca2+ influx and synaptic output.
Ca2+ Signals at Cone Ribbon Sites Exhibited Small Differences in Voltage Activation
Cone synaptic terminals contain a dozen or more synaptic ribbons that are each potentially capable of providing distinct output channels to second-order horizontal and bipolar cells. To determine whether these channels all transmit signals with equal voltage dependence, we examined the Ca2+ activation profiles of many cone ribbon sites, including multiple ribbons from some cones. Figure 6C shows an overlay of the Ca2+ activation curves from 47 ribbons in the 28 cones shown in Figure 6B. The V50 values for cone ribbon Ca2+ signals averaged −34.8 ± 3.49 mV. Slope factors for the Boltzmann fit averaged 6.76 ± 1.73. This differed significantly (p < 0.0001) from slope values for ICa due to the non-linear binding properties of the Ca2+ dye. The distributions of V50 values calculated for cone ICa (Figure 6B) and ribbon Ca2+ signals within these cones (Figure 6C) are both plotted in Figure 6D, and both exhibited a normal distribution (p = 0.71 and 0.57, respectively, D’Agostino and Pearson omnibus normality test). Even though multiple ribbons were often measured in a single cone, V50 values of ribbon Ca2+ signals showed slightly greater variability than V50 values of cone ICa. Thus, the voltage dependence of ribbon Ca2+ signals was more variable than would be expected if all ribbons within a cone operated identically.
The V50 values calculated from ribbon Ca2+ influx in cones were 3.3 mV more positive than V50 values determined from ICa (Figure 6D). We hypothesized that this rightward shift in activation was due to the low sensitivity of the low affinity Ca2+ indicator (OGB-5N, Kd = 20 μM), such that small Ca2+ influxes evoked by weak depolarization lie below the dye’s linear response range. To test this idea, we repeated our experiments using a slightly higher-affinity Ca2+ indicator, OGB-6F (Kd = 3 μM), and expanded the test step series to include weaker steps to −49 and −44 mV. In support of our hypothesis, the difference in V50 between Ca2+ signals and ICa was reduced to 2.3 mV when using OGB-6F (n = 25 ribbons in 11 cones). However, Ca2+ hotspots were less tightly constrained with this higher-affinity dye, so we used OGB-5N for experiments examining ribbon-to-ribbon differences in Ca2+ signals.
Estimating Genuine Ribbon-to-Ribbon Variability
To analyze how much ribbons truly differ in voltage dependence from one another, we evaluated sources of technical and biological variability in our measurements. Variability in V50 values for ribbon-associated Ca2+ signals (SD = 3.49 mV, variance = 12.18 mV2, see Figure 6) could potentially arise from four sources: (1) technical variability in electrophysiological control of cone ICa; (2) biological cone-to-cone variability in ICa activation; (3) technical variability in optical measurements of Ca2+ signals; and (4) biological ribbon-to-ribbon variability in ribbon-associated Ca2+ signals. The combined impact of sources 1 and 2 (technical and biological variability of ICa among cones) was captured by measurements of variability among whole cell ICa in different cones (V50 SD = 3.05 mV, variance = 9.28 mV2, n = 28 cones, see Figure 6D).
We assessed the amount of variance in Ca2+ signals among ribbons that can be explained by the variance in whole cell ICa among cones by examining the correlation between V50 values of cone ICa and V50 values of the ribbons measured in the same cones. We expected to find that much of the ribbon-to-ribbon variability would be explained by cone-to-cone variability in whole cell ICa. However, we instead found that V50 values for ribbon Ca2+ signals were only weakly correlated with ICa V50 values from the cones in which they were measured (R2 = 0.105, slope = 0.39 ± 0.17 [SEM]; p = 0.026). To avoid weighting some cells more heavily than others, we repeated this comparison after choosing a single ribbon from each cell. Selecting a single ribbon from each cone to minimize the difference between ribbon V50 and ICa V50 (and thus maximize the correlation) improved the correlation to R2 = 0.228 (gray circles in Figure 7A; slope = 0.52 ± 0.19 [SEM]; p = 0.01). Selecting the one ribbon from each cone that maximized the difference between ribbon V50 and ICa V50 also slightly improved the correlation (open circles in Figure 7A; R2 = 0.164, slope = 0.52 ± 0.23 [SEM]; p = 0.03). These coefficients of determination indicate that 16.4%–22.8% of ribbon-to-ribbon variance can be attributed to variance in ICa among cones. Thus, while the amount of variance among V50 values for ribbon Ca2+ measurements was not significantly greater than the variance among V50 values for ICa (F-test, p = 0.46), the sources of variance in the two samples were largely independent.
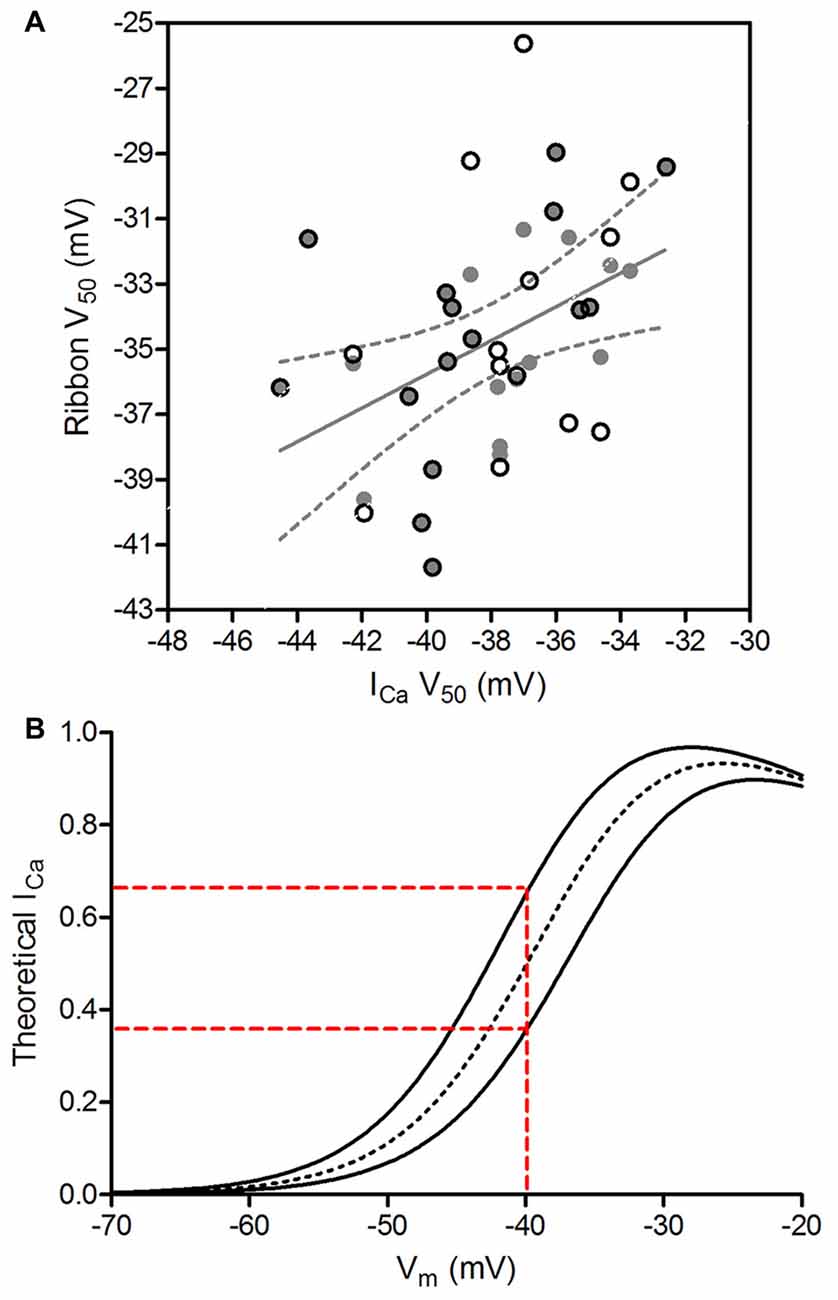
Figure 7. Genuine ribbon-to-ribbon variability can be functionally relevant. (A) V50 values of ribbon Ca2+ signals were not strongly correlated with V50 values of whole cell ICa from the cones in which they were measured. The strongest correlation was obtained by using one data point per cone and selecting the V50 values for ribbon Ca2+ signals that were most similar to V50 for ICa in the same cone (gray circles). The graph shows the linear regression fit to this subset of data along with the 95% confidence interval (R2 = 0.228, slope = 0.517 ± 0.187 [SEM]; p = 0.01, F-test for non-zero slope). Open circles show the single ribbons from each cone with V50 values that were least similar to V50 for ICa in the same cone. (B) Ribbons can exhibit functionally relevant differences in Ca2+ influx. The dotted black line simulates a ribbon with the average ICa parameters from our analysis (V50 = −38.1 mV, slope = 4.9, Imax = 0.0251). The two solid lines show curves differing in V50 by ±1 SD (V50 = −40.6 and −35.6 mV). The more positively-activating ribbon would experience >45% less Ca2+ influx than the more negatively-activating ribbon at a cone membrane potential of −40 mV (red dashed lines). Alternatively, the more negatively-activating ribbon would experience >80% more influx than the more positively-activating ribbon at −40 mV.
We also assessed technical variability in optical measurements of Ca2+ signals (source 3). For each ribbon, we fit the voltage-dependent ∆F/F profiles with a Boltzmann function adjusted for driving force. We acquired up to five replicate data points for each depolarizing step in some experiments, and when such replicates were available, we fit the entire sample as one. The standard errors for V50 values obtained by nonlinear regression fits to ribbon Ca2+ signals provide a way to quantify uncertainties in V50 contributed by optical Ca2+ measurement variability. From the standard errors of Boltzmann fits to Ca2+ imaging data, we found that measurement uncertainty contributed an average variance of 3.61 mV2 (95% confidence interval: 2.35–4.87 mV2).
The genuine biological variability among ribbons was then determined by subtracting contributions from sources 1, 2 and 3 from the overall ribbon-to-ribbon variability. We found that 16.4–22.8% of the overall ribbon-to-ribbon variance arises from cone-to-cone variance in ICa (sources 1 and 2). Subtracting this contribution of cone-to-cone variance reduces ribbon-to-ribbon variance from 12.18 mV2 to 9.50–10.23 mV2. Subtracting the additional variance introduced by uncertainties in fitting Ca2+ responses (source 3: 3.61 mV2) leaves an estimated genuine biological ribbon-to-ribbon variance of 5.89–6.62 mV2 (SD = 2.4–2.6 mV). Employing this same analysis with data obtained from experiments with the Ca2+ dye OGB-6F yielded a similar ribbon-to-ribbon variance (5.96–6.48 mV2, SD = 2.4–2.5 mV). This range of variability is consistent with the example in Figure 1 showing differences in V50 averaging 3.3 mV between two ribbons in the same cone and indicates that the V50 values in a population of ribbons from a single cone are likely to span a range of at least 5.0 mV (±1 SD).
While a 5 mV range of V50 values may seem modest, an activation difference of this magnitude can alter Ca2+ influx by more than 45% when the cone is at a resting membrane potential in darkness of −40 mV. This is illustrated by the theoretical Ca2+ response curves shown in Figure 7B. We simulated the voltage dependence of ICa in cones using the average best-fit parameters of the ICa curves shown in Figure 6B (dashed line in Figure 7B), as well as curves with V50 values varying by ±1 SD from the mean (SD = 2.5 mV, solid lines in Figure 7B). At a membrane potential of −40 mV, a ribbon exhibiting the more positive Ca2+ activation function (V50 = −35.6 mV) that is 1 SD above the mean would experience 45% less Ca2+ influx than a ribbon exhibiting a more negative activation function (V50 = −40.6 mV) that is 1 SD below the mean. Extending this analysis to consider V50 values ±2 SD away from the mean indicated a difference in Ca2+ influx of 70% or more. Nearly identical differences in Ca2+ influx were obtained using average parameters of the curves fit to optical ribbon Ca2+ measurements (i.e., Figure 6C). In addition to altering the Ca2+ influx at a given membrane potential, changes in V50 will also alter the slope of the relationship between voltage and Ca2+ influx, thereby altering synaptic gain. At any given membrane potential, the slope of this relationship will differ for ribbons exhibiting different V50 values, producing ribbon-to-ribbon differences in synaptic gain.
Horizontal Cell Feedback Modulates Ca2+ Influx at Individual Ribbons Within Cones
Inhibitory feedback from HCs regulates synaptic transmission from cones, contributing to the formation of center-surround receptive fields and color opponency in downstream retinal neurons (Thoreson and Mangel, 2012). Hyperpolarizing a HC, as occurs in light, reduces the peak amplitude of cone ICa and shifts its activation positively by a few millivolts (Verweij et al., 1996). In the experiments described above, we measured intrinsic differences among ribbons while blocking inhibitory synaptic feedback from HCs to cones by using a superfusate lacking bicarbonate and strongly buffered with 10 mM HEPES (Hirasawa and Kaneko, 2003). As a further test of the ability of cone ribbons to be regulated independently, we measured Ca2+ changes at individual ribbons while manipulating HC feedback during paired whole cell recordings between cones and postsynaptic HCs. For these experiments, we superfused the retinal slices with a bicarbonate-buffered medium that permits feedback (Warren et al., 2016a).
We compared ribbon Ca2+ responses when a postsynaptic HC was voltage clamped at either −9 or −79 mV (i.e., with active or inactive inhibitory feedback, respectively). Before imaging, we first confirmed electrophysiologically that HC-to-cone feedback was present by holding the cone at −39 mV for 2 s to activate ICa and then hyperpolarizing the HC with a step from −39 mv to −99 mV to relieve inhibitory feedback. When feedback is present, hyperpolarizing the HC relieves feedback inhibition of cone ICa and stimulates an inward current (Figure 8A; Warren et al., 2016b). Figure 8B shows Ca2+ responses measured simultaneously at three different ribbons in one cone, with and without negative feedback from the HC (red and black traces, respectively). In this example, depolarizing the HC to activate inhibitory feedback reduced the amplitude of Ca2+ influx at one ribbon (top set of traces) but not at the other two. Presumably, dendrites from the voltage-clamped HC did not contact the two non-responsive ribbons. The Ca2+ changes at the ribbon subject to HC feedback are plotted in Figure 8C and show that depolarization of the HC reduced the magnitude of Ca2+ influx at every cone test potential. By fitting Boltzmann functions to these activation profiles, we also found that the V50 shifted positively by 1.0 mV when negative feedback was activated by depolarizing the HC. In this example, we held the HC at either −79 or −9 mV while testing cone responses over the entire voltage range (six replicate trials for each HC condition). Averaging multiple trials in this way reduced trial-to-trial changes in Ca2+ response amplitude.
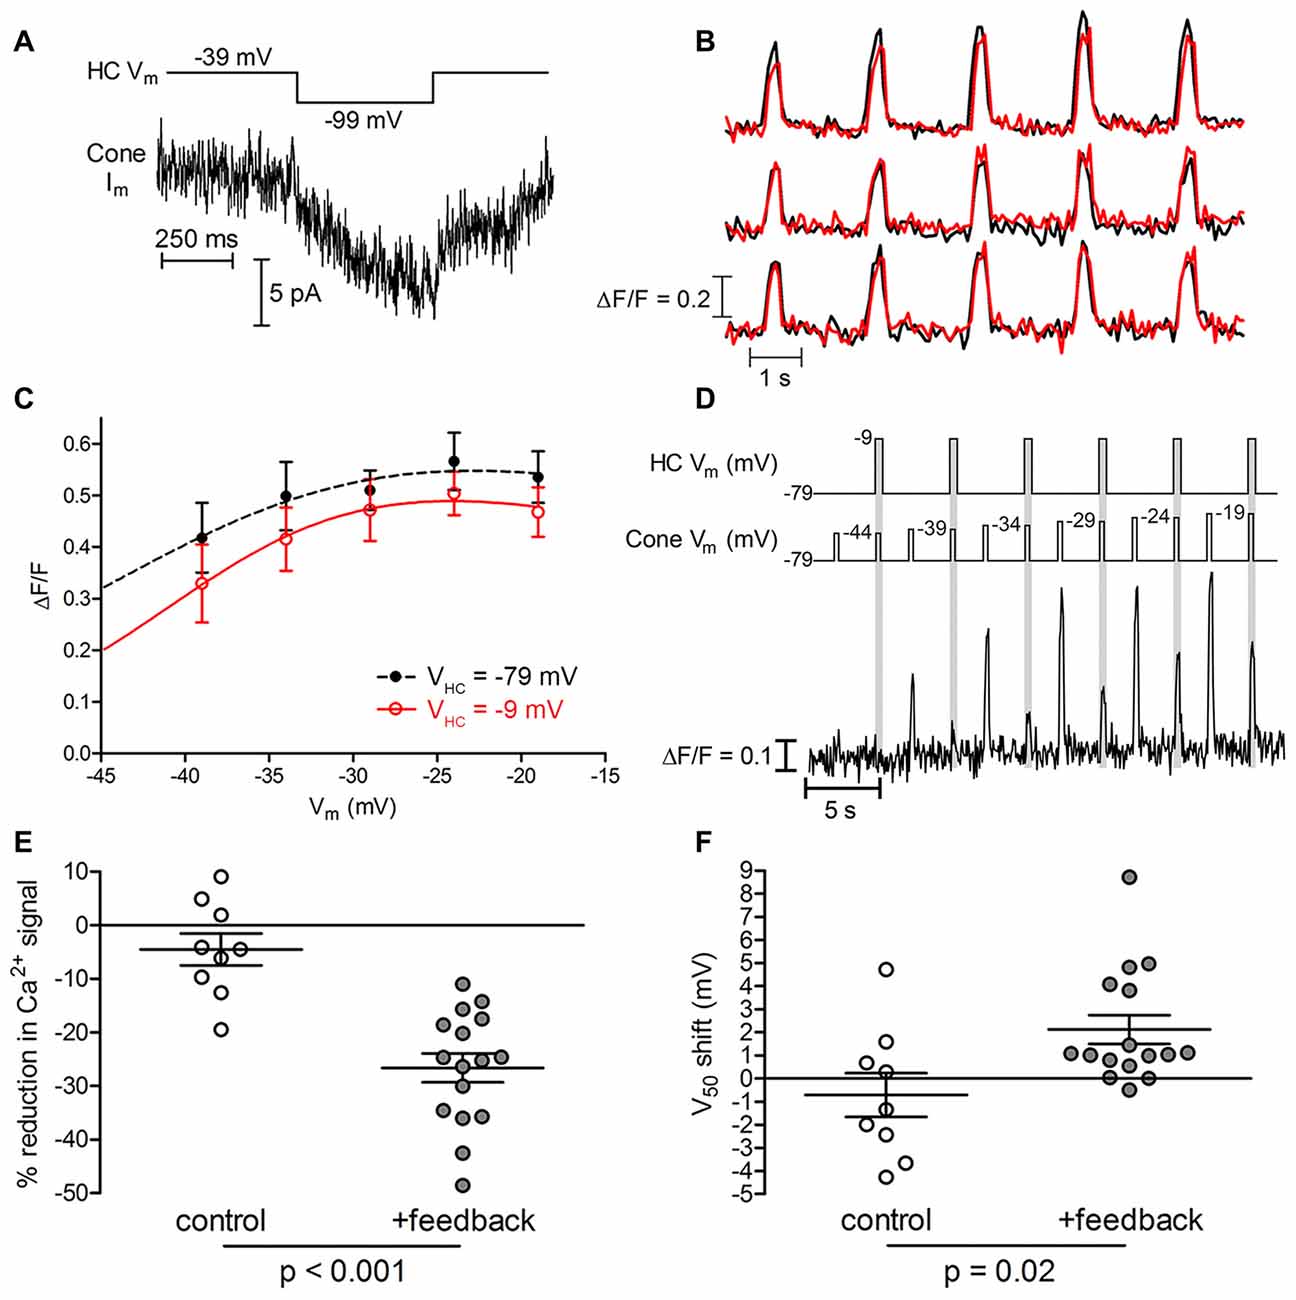
Figure 8. Negative feedback from horizontal cells (HCs) modulates cone ribbons independently. (A) HC-induced feedback current for the cone with ribbon Ca2+ responses illustrated in panels (B,C). HC-to-cone feedback was confirmed electrophysiologically by holding the cone at −39 mV for 2 s to partially activate ICa and then testing whether hyperpolarizing the HC with a step from −39 mV to −99 mV to relieve inhibitory feedback stimulated an inward current arising from an increase in cone ICa (Warren et al., 2016b). (B) Ca2+ responses (∆F/F) measured simultaneously from three ribbons in a cone. Black traces show control responses obtained when the HC was voltage clamped at −79 mV. Red traces show responses obtained while activating inhibitory feedback to the cone by depolarizing the HC to −9 mV. In this cone, only one of the three ribbons (top set of traces) showed a reduction in the amplitude of Ca2+ influx when negative feedback was activated by depolarizing the HC. (C) Average amplitude (∆F/F) of Ca2+ signals plotted against cone membrane potential for the ribbon showing a feedback effect in panel (B). When negative feedback was activated by depolarizing the HC to −9 mV, ribbon Ca2+ influx amplitude was decreased and the V50 shifted from −39.7 mV to −38.7 mV. (D) Alternative stimulus protocol for testing HC-mediated feedback effects. This example shows an exemplar ribbon’s Ca2+ responses during a sequence of depolarizing steps in the absence (white epochs) or presence (gray epochs) of inhibitory feedback from a simultaneously voltage-clamped HC. Test potentials delivered to the cone are indicated as Cone Vm. A second sequence was subsequently performed in this pair but with HC depolarization applied first rather than second for each test step pair delivered to the cone. Measurements from the two trials were averaged to calculate the feedback-mediated amplitude reduction and V50 shift of Ca2+ responses at this ribbon. (E) Reduction in peak ∆F/F amplitude by HC negative feedback (feedback trials: −26.6 ± 10.6%; p < 0.001, paired t-test; n = 16 ribbons in 14 cones; control trials: −3.7 ± 12.6%; p = 0.4, paired t-test; n = 9 ribbons in 5 cones; p < 0.001 between conditions, t-test). (F) Magnitude of V50 shift in ribbon Ca2+ signals induced by depolarizing HCs from −79 mV to −9 mV (feedback trials: +2.1 ± 2.5 mV; p < 0.001, paired t-test; n = 16 ribbons in 14 cones; control trials: −0.7 ± 2.8 mV; p = 0.5, paired t-test; n = 9 ribbons in 5 cones; p = 0.02 between conditions, Mann Whitney test). Data are displayed as mean ± SEM in panels (E,F).
In another approach to minimize trial-to-trial differences, we applied the same voltage step to some cones twice in succession, changing the HC holding potential from −79 mV to −9 mV (or vice versa) between the two steps (Figure 8D). In the example shown in Figure 8D, activating negative feedback by holding the HC at −9 mV strongly inhibited Ca2+ responses at this ribbon compared to responses evoked by the preceding test step applied when the HC was held at −79 mV. Strong inhibition of cone Ca2+ responses by inhibitory feedback from the HC in this example was evident despite the fact that in separate control trials conducted without a paired HC, the second in a pair of depolarizing test steps applied to the cone sometimes evoked a larger response than the first. To quantify feedback-evoked changes in amplitude and voltage dependence, we eliminated possible order effects of this protocol by averaging two sequences in which we swapped the order in which we applied the HC voltage changes. In one sequence, the first cone test step was applied while feedback was activated by holding the HC at −9 mV and the second cone test step was applied while holding the HC at −79 mV. In the other sequence, we reversed the order of HC test potentials to activate feedback during the second of each pair of cone test steps (e.g., Figure 8D).
Not every cone ribbon showed feedback-induced changes in Ca2+ signals. We saw feedback-evoked modulation at 16 out of 25 ribbons (64%) in 14 cone-HC pairs in which the presence of feedback was confirmed electrophysiologically (e.g., Figure 8A). In four of these cone-HC pairs, we saw changes at one ribbon but not another in the same cone. For ribbons that exhibited a feedback effect, inducing negative feedback by depolarizing the HC from −79 mV to −9 mV caused a significant reduction in peak Ca2+ signal ∆F/F amplitude at the 16 responsive ribbons (−26.6 ± 10.6%, p < 0.001). In identical control trials conducted without simultaneously voltage-clamped HCs, we saw no significant change in Ca2+ signal amplitude (p = 0.4); the difference between feedback and control conditions was significant (Figure 8E, p < 0.001). Depolarizing HCs from −79 mV to −9 mV also caused a significant positive shift in V50 (+2.1 ± 2.5 mV, p < 0.001) at ribbons sensitive to feedback, which differed significantly from control trials without a voltage-clamped HC (Figure 8F, p = 0.02). The ability of HCs to regulate Ca2+ signals at some ribbons but not others within a single cone provides further evidence that ribbons can operate in a functionally independent manner. Modulation by HC feedback could increase or diminish intrinsic differences in ribbon Ca2+ responses seen in the absence of feedback.
Discussion
Differences in Voltage Dependence and Amplitude of Ribbon Ca2+ Signals
Our experiments reveal significant ribbon-to-ribbon differences in the voltage dependence of ribbon-associated Ca2+ signals. After accounting for technical variability in Ca2+ signal measurements and contributions from cone-to-cone variability in ICa, we found intrinsic variability (i.e., in the absence of inhibitory feedback from HCs) of V50 values among ribbon-localized Ca2+ signals with a SD of ~2.5 mV. Ribbon V50 values were normally distributed, suggesting that 68% (±1 SD) of ribbons in a cone exhibit V50 values spanning a range of 5 mV. We found a similar degree of ribbon-to-ribbon variability using the higher affinity Ca2+ dye OGB-6F. Consistent with this range of V50 values, we also observed reproducible V50 differences of up to 3.5 mV between neighboring ribbons in the same cone (e.g., Figure 1). Measurements of ribbon Ca2+ signals at two different pH values (7.6 and 7.8) confirmed that we could accurately detect 3 mV changes in voltage dependence (Figure 5). Functional independence of ribbons was also demonstrated by manipulating HC membrane potential to alter the strength of HC to cone feedback and thereby produce reversible shifts in the V50 and amplitude of Ca2+ responses at individual cone ribbons. Small variations in positioning the focal plane of measurement or the size of ROIs did not contribute significantly to V50 variability. Although seemingly modest, differences in activation voltage of a few millivolts can have a significant impact on Ca2+ influx. A typical cone dark resting membrane potential of −40 mV places ICa quite close to its activation midpoint. A difference in V50 values of 5 mV about that mean (±1 SD) would produce a difference in Ca2+ influx of more than 45%. Variation in the voltage dependence of whole-cell ICa would also produce cone-to-cone differences in Ca2+ influx. Because release from cones is linearly related to ICa (Jackman et al., 2009; Duncan et al., 2010; Bartoletti et al., 2011), ribbon-to-ribbon differences in Ca2+ influx would be expected to produce differences in release exceeding 45% at the dark resting potential.
We first assessed intrinsic differences in V50 variability among cone ribbons under conditions where inhibitory feedback from HCs to cones was blocked by use of the pH buffer HEPES (Hirasawa and Kaneko, 2003). In recordings where we allowed feedback to be active, directly depolarizing a voltage-clamped HC to stimulate inhibitory feedback in a simultaneously voltage-clamped cone shifted V50 of Ca2+ signals at cone ribbons by an average of +2.1 mV and reduced the amplitude of ribbon-associated Ca2+ responses by an average of 27%. HC feedback could therefore increase or diminish intrinsic differences in Ca2+ responses between individual ribbons in the same cone. Effects of feedback evoked by depolarizing a single HC were not exerted at every ribbon, but were instead restricted to a subset of ribbons within presynaptic cones.
We focused our study on differences in voltage dependence among ribbon-associated Ca2+ signals rather than amplitude. One major reason for this was that response amplitude measurements were more sensitive than V50 measurements to differences in placement of the focal plane or delineation of the ROI (Figures 2, 3). However, some of the differences in response amplitude observed between ribbons were far too large to be explained by these technical factors, indicating that there are genuine differences in Ca2+ influx magnitude between ribbons. Genuine ribbon-to-ribbon differences in response amplitude were also shown by feedback experiments in which the amplitude of ribbon-associated Ca2+ signals could be reversibly inhibited at one ribbon but not another in the same cone by activating feedback from postsynaptic HCs (e.g., Figure 8).
Salamander cone terminals do not exhibit Ca2+-induced Ca2+ release from intracellular stores (unlike rods: Krizaj et al., 2003; Cadetti et al., 2006) nor do these terminals possess mitochondria (Linton et al., 2010). Local differences in mitochondrial Ca2+ uptake or release of Ca2+ from endoplasmic reticulum stores are therefore not likely to be responsible for differences in voltage dependence or amplitude among ribbon-style active zones in salamander cones. Instead, these differences are more likely due to variability in Ca2+ influx through L-type Ca2+ channels clustered beneath individual ribbons (tom Dieck et al., 2005; Cadetti et al., 2006; Lv et al., 2012).
In addition to modulation of Ca2+ signals by HC feedback, there are many factors that could contribute to intrinsic ribbon-to-ribbon differences in Ca2+ influx. Differences in Ca2+ response amplitude at different ribbons could arise from differences in the number of Ca2+ channels at each ribbon. But in addition, Éltes et al. (2017) found significant differences in Ca2+ influx at different hippocampal terminals that exceeded differences in Ca2+ channel number, suggesting that differences in the function or subunit composition of Ca2+ channels also contribute to differences among active zones. The main Ca2+ channel subtype in rod and cone photoreceptors is CaV1.4 but there is also evidence for CaV1.3 channels (Xiao et al., 2007). Both of these channel types possess splice variants with altered voltage dependence (Bock et al., 2011; Tan et al., 2011; Haeseleer et al., 2016). Due to differences in the C-terminal domain, CaV1.4 channels lack Ca2+-dependent inactivation (Wahl-Schott et al., 2006) and the inactivation properties of CaV1.3 channels can vary among cells (Scharinger et al., 2015). It was suggested that interactions between Ca2+ channels and accessory Gipc3 proteins may contribute to observed differences in the voltage dependence of Ca2+ influx among ribbons in inner hair cells (Ohn et al., 2016). Similarly, differences in the voltage dependence and amplitude of Ca2+ signals at photoreceptor ribbons could potentially involve accessory proteins like CaBP4 (Haeseleer et al., 2004; Lee et al., 2014). Voltage dependence and conductance of photoreceptor Ca2+ channels can also be regulated by a host of neuromodulators including dopamine, cannabinoids, nitric oxide, somatostatin, fatty acids, and insulin (Stella and Thoreson, 2000; Vellani et al., 2000; Stella et al., 2001; Straiker and Sullivan, 2003; Kourennyi et al., 2004; Herrmann et al., 2011), the influence of which might vary among ribbons. Ca2+ channel voltage dependence and conductance are also regulated by local extracellular concentrations of Ca2+, H+, Zn2+, Cl− or K+ ions (Wilkinson and Barnes, 1996; Cadetti et al., 2004; Cadetti and Thoreson, 2006; Babai and Thoreson, 2009). Ca2+ channels beneath ribbons are located at the apex of membrane invaginations that extend hundreds of nanometers into the cone terminal (Sterling and Matthews, 2005; tom Dieck et al., 2005; Lv et al., 2012). By isolating ribbon-associated Ca2+ channel clusters, this anatomical arrangement could promote local differences in the extracellular ionic microenvironment between invaginations. In the limited extracellular volume surrounding cone Ca2+ channels, small differences in the expression of a handful of ion channels, receptors, transporters, or binding partners could change the microenvironment enough to alter Ca2+ channel voltage dependence and channel conductance. Bipolar cells terminate in elaborately branched terminals possessing multiple presynaptic puncta (Euler et al., 2014). Ribbons at spatially distinct puncta in bipolar cells may also exhibit functional independence in their Ca2+ responses, especially given the relatively strong endogenous calcium buffers that are present in bipolar cells, equivalent to 1.2 mM BAPTA (Burrone et al., 2002).
In addition to differences in Ca2+ responses among ribbons, we found variability in the voltage dependence of ICa among cones, with a SD in V50 of 2.9 mV after accounting for trial-to-trial variability. The variance introduced by residual uncompensated Rser was negligible. In isolated rods, voltage dependence of ICa shifted to more negative values over the first 3 min of whole cell recording as the pipette solution entered the cell (Corey et al., 1984). Time-dependent changes in voltage dependence may have contributed to the observed variability but we waited at least 3 min before making Ca2+ measurements and did not see consistent time-dependent changes. Differential effects of dopamine on ICa in small single vs. large single cones in salamander retina indicate that different cone subtypes can possess different Ca2+ channel types or key modulators (Stella and Thoreson, 2000). Immunohistochemical differences among medium and short wavelength-sensitive cones of tree shrew retina also suggest that Ca2+ channel expression may differ among cone subtypes (Morgans, 1999). Although these studies suggest that some of the differences in ICa voltage dependence we observed might arise from differences in Ca2+ channel subtypes or regulation among different classes of cones, we found no significant differences in ICa voltage dependence among the three cone subtypes examined in our studies.
Consistent with ultrastructural studies (Pierantoni and McCann, 1984; Ahnelt et al., 1990; Sterling and Matthews, 2005; Pang et al., 2008), we found that the size of ribbons measured with fluorescently-conjugated RIBEYE-binding peptides can vary appreciably. In inner hair cells, Ca2+ signal amplitude varied significantly among ribbons, with larger ribbons attaining higher depolarization-evoked Ca2+ levels (Frank et al., 2009; Ohn et al., 2016). We did not find a correlation between ribbon size and Ca2+ response amplitude, but did find that ribbon size was strongly correlated with the spatial extent of Ca2+ signals (Figure 4). This suggests that the average density of functional Ca2+ channels along the extent of a ribbon, which has been estimated at ~3 channels per vesicle in the readily releasable pool (Bartoletti et al., 2010; Thoreson et al., 2016), is similar for different-sized ribbons. While larger ribbons did not necessarily exhibit larger peak Ca2+ responses, they nevertheless experienced greater total Ca2+ influx because of the larger area of Ca2+ entry.
Functional Consequences of Ribbon Variability
It has typically been thought that at the dark resting membrane potential, cone ICa is near the foot of its activation function (Barnes and Kelly, 2002). However, we found an average V50 for cone ICa of −38.1 mV, close to the average resting membrane potential for cones in darkness of −40 mV (Thoreson and Burkhardt, 1991). Because the ICa/voltage activation curve is steepest at its V50, this arrangement is optimal for maximizing changes in release during small light-evoked changes in membrane voltage near darkness (Sterling and Laughlin, 2015). Such considerations also extend to local ribbon Ca2+ signals. At any given cone membrane potential, ribbons with V50 values near the membrane potential would exhibit the largest changes in synaptic output for a small change in voltage. Ribbon-to-ribbon differences in the voltage dependence of Ca2+ influx would therefore allow some ribbons to respond with greater sensitivity to light-evoked voltage changes under dim illumination, when the cone membrane potential is more depolarized, and other ribbons to respond with greater sensitivity in bright conditions when cones are more hyperpolarized. Individual bipolar and HCs receive inputs from many cone ribbons. Receiving an ensemble of inputs from ribbons with varying but overlapping sensitivities could improve the ability of bipolar and HCs to respond to contrasts over a wide range of light intensities.
Release of a vesicle at cone ribbon synapses requires the opening of an average of only 2–3 Ca2+ channels per vesicle (Bartoletti et al., 2011). A ribbon possessing more Ca2+ channels would be more likely to have an open channel and therefore release a vesicle at a given membrane voltage than a ribbon possessing fewer channels. This effectively makes ribbons with more Ca2+ channels more sensitive to small changes in membrane potential at hyperpolarized potentials, functioning much like a negative activation shift.
In the cochlea each postsynaptic spiral ganglion neuron contacts a single presynaptic inner hair cell ribbon, so variability among ribbons has been proposed to drive the diversity of spiking behaviors observed in spiral ganglion cells (Frank et al., 2009; Ohn et al., 2016). Unlike spiral ganglion neurons, bipolar and HCs in the retina receive inputs from many photoreceptor ribbons. It is therefore less likely that ribbon-to-ribbon differences in V50 and amplitude of Ca2+ responses would produce significant differences in the responses of second-order neurons (Burkhardt and Fahey, 1998; Burkhardt et al., 2006). To achieve such differences, the distribution a cell’s ribbon inputs would have to be skewed towards more positive or negative potentials. Postsynaptic differences in bipolar cell anatomy and physiology are more likely to be responsible for differences in their response properties. A number of postsynaptic factors have been identified as contributing to differences in response characteristics among bipolar cells, including differential expression of glutamate receptors and ion channels, dendritic anatomy (e.g., dendritic extent and position of postsynaptic contacts relative to the ribbon), and influence of lateral feedback from HCs to bipolar cells (DeVries et al., 2006; Szmajda and Devries, 2011; Thoreson and Mangel, 2012; Puller et al., 2013; Euler et al., 2014; Lindstrom et al., 2014). Although ribbon-to-ribbon variability seems unlikely to be a major factor in generating response differences among bipolar cells, cone-to-cone differences in both resting membrane voltage and the voltage dependence of whole cell ICa could produce differences among the responses of foveal midget bipolar cells in primate retina that receive inputs from only a single cone.
Endogenous Ca2+ buffering in cones is surprisingly weak, equivalent to only 50–100 μM EGTA (Van Hook and Thoreson, 2014). To improve the spatial resolution for detection of Ca2+ signals by confocal microscopy at individual ribbons, we used a higher concentration of EGTA (5 mM). Fast release of membrane-associated vesicles, as might occur during a rapid decrement in light, is regulated by Ca2+ within highly localized nanodomains <100 nm from Ca2+ channels even in the presence of weak exogenous buffering (Mercer et al., 2011; Van Hook and Thoreson, 2015). On the other hand, the slower sustained release that dominates in darkness is governed more strongly by the rate at which vesicles can be delivered to ribbons and ribbon-release sites (Jackman et al., 2009). The replenishment process that controls sustained release is itself regulated by Ca2+ acting at ribbon-associated sites located a few hundred nanometers above Ca2+ channels, and so sustained release is much more sensitive than fast release to Ca2+ buffering and global Ca2+ levels (Babai et al., 2010; Vaithianathan and Matthews, 2014; Van Hook et al., 2014; Van Hook and Thoreson, 2015). The impact of ribbon-to-ribbon differences in Ca2+ entry would therefore diminish during sustained release that occurs under conditions of dim illumination when Ca2+ levels are elevated similarly throughout the terminal.
HC activity is governed by glutamatergic inputs from presynaptic photoreceptors. Although there is controversy about the underlying mechanisms (Kramer and Davenport, 2015), there is an emerging consensus that changes in voltage dependence and amplitude of Ca2+ influx in cones caused by HC feedback involves extracellular proton levels within the synaptic cleft (Barnes and Bui, 1991; Hirasawa and Kaneko, 2003; Cadetti and Thoreson, 2006; Kemmler et al., 2014; Vroman et al., 2014; Warren et al., 2016a). Not every ribbon within a cone terminal was subject to feedback regulation from a single postsynaptic HC in our experiments. However, we found that 64% of the ribbons we analyzed in synaptically-connected cone-HC pairs were sensitive to feedback from a single postsynaptic HC. This was a higher percentage than predicted from previous work suggesting that a single HC in salamander retinal slices makes an average of 2.1 synaptic ribbon contacts per presynaptic cone (Bartoletti et al., 2010). Because salamander cones possess an average of 13 ribbons per cell (Bartoletti et al., 2010), we expected to see detectable feedback effects in fewer than 20% of ribbons. Furthermore, if only the few ribbons that directly contact an individual HC were influenced by its feedback, we would predict that the impact of feedback on whole cell ICa—which is the summed currents from all the ribbons—would be less than 20% of the impact on Ca2+ responses at single ribbons. Instead, feedback-induced changes in the amplitude and voltage dependence of whole-cell ICa measured under similar experimental conditions in paired cone-HC recordings (Warren et al., 2016a) were only slightly smaller than changes observed at individual ribbons in the present study. The unexpectedly high prevalence of feedback effects suggests that the strong HC depolarization used to elicit negative feedback in these experiments may have spread through gap junctions to nearby coupled HCs, allowing feedback effects to become evident at ribbons that were not directly contacted by dendrites of the voltage-clamped HC. Much of the HC network is excised by slicing the retina into vertical sections, suggesting that this signal spread is likely to occur close to the recipient cone. The spread of voltage from one HC to another may contribute to the slower components of feedback seen in response to an abrupt change in HC membrane potential (Figure 8A; see also Warren et al., 2016b). These findings suggest that feedback effects from individual HCs are amplified by local interactions among HCs at photoreceptor synapses.
Our results show that Ca2+ signals at individual synaptic ribbons in cone photoreceptors can vary significantly from one another in both amplitude and voltage dependence. V50 values of ribbons within single cochlear inner hair cells varied with a SD of 3.2 mV (Frank et al., 2009; Ohn et al., 2016). Voltage dependence of inner hair cell ribbons also varied with subcellular location, with active zones on the modiolar side of inner hair cells activating at more positive voltages than pillar active zones. Thus, at least some of the differences among hair cell ribbons must arise from non-random processes (Ohn et al., 2016). Our results show that Ca2+ influx at individual cone ribbons can be rapidly and actively regulated by HC feedback in a non-random fashion. Intrinsic ribbon-to-ribbon differences in cones may also be actively regulated by cellular processes operating on a slow time scale. Alternatively, they may simply result from random differences in the expression and delivery of proteins to different parts of the cone. Regardless, ribbon-to-ribbon differences in Ca2+ signals expand the range of transformations available to cones for converting light-evoked voltage responses into synaptic release, and can thus expand the range of information provided to downstream neurons about changing light levels.
Author Contributions
Both authors designed experiments, conducted experiments, analyzed data and wrote the article.
Funding
This study was supported by the National Eye Institute, National Institutes of Health grant EY010542 (WBT), Research to Prevent Blindness Senior Scientific Investigator Award (WBT), UNMC graduate assistantship (JJG) and Purdue Pharma Scholars Fellowship (JJG).
Conflict of Interest Statement
The authors declare that the research was conducted in the absence of any commercial or financial relationships that could be construed as a potential conflict of interest.
Acknowledgments
We thank Dr. David Zenisek for the gift of RIBEYE-binding peptides and Dr. Matthew Van Hook for helpful discussion.
References
Ahnelt, P., Keri, C., and Kolb, H. (1990). Identification of pedicles of putative blue-sensitive cones in the human retina. J. Comp. Neurol. 293, 39–53. doi: 10.1002/cne.902930104
Babai, N., Bartoletti, T. M., and Thoreson, W. B. (2010). Calcium regulates vesicle replenishment at the cone ribbon synapse. J. Neurosci. 30, 15866–15877. doi: 10.1523/JNEUROSCI.2891-10.2010
Babai, N., and Thoreson, W. B. (2009). Horizontal cell feedback regulates calcium currents and intracellular calcium levels in rod photoreceptors of salamander and mouse retina: horizontal cell to rod feedback in salamander and mouse retina. J Physiol. 587, 2353–2364. doi: 10.1113/jphysiol.2009.169656
Barnes, S., and Bui, Q. (1991). Modulation of calcium-activated chloride current via pH-induced changes of calcium channel properties in cone photoreceptors. J. Neurosci. 11, 4015–4023.
Barnes, S., and Hille, B. (1989). Ionic channels of the inner segment of tiger salamander cone photoreceptors. J. Gen. Physiol. 94, 719–743. doi: 10.1085/jgp.94.4.719
Barnes, S., and Kelly, M. E. M. (2002). Calcium channels at the photoreceptor synapse. Adv. Exp. Med. Biol. 514, 465–476. doi: 10.1007/978-1-4615-0121-3_28
Barnes, S., Merchant, V., and Mahmud, F. (1993). Modulation of transmission gain by protons at the photoreceptor output synapse. Proc. Natl. Acad. Sci. U S A 90, 10081–10085. doi: 10.1073/pnas.90.21.10081
Bartoletti, T. M., Babai, N., and Thoreson, W. B. (2010). Vesicle pool size at the salamander cone ribbon synapse. J. Neurophysiol. 103, 419–423. doi: 10.1152/jn.00718.2009
Bartoletti, T. M., Jackman, S. L., Babai, N., Mercer, A. J., Kramer, R. H., and Thoreson, W. B. (2011). Release from the cone ribbon synapse under bright light conditions can be controlled by the opening of only a few Ca2+ channels. J. Neurophysiol. 106, 2922–2935. doi: 10.1152/jn.00634.2011
Bock, G., Gebhart, M., Scharinger, A., Jangsangthong, W., Busquet, P., Poggiani, C., et al. (2011). Functional properties of a newly identified C-terminal splice variant of Cav1.3 L-type Ca2+ channels. J. Biol. Chem. 286, 42736–42748. doi: 10.1074/jbc.m111.269951
Brandt, A., Khimich, D., and Moser, T. (2005). Few CaV1.3 channels regulate the exocytosis of a synaptic vesicle at the hair cell ribbon synapse. J. Neurosci. 25, 11577–11585. doi: 10.1523/jneurosci.3411-05.2005
Burkhardt, D. A., and Fahey, P. K. (1998). Contrast enhancement and distributed encoding by bipolar cells in the retina. J. Neurophysiol. 80, 1070–1081.
Burkhardt, D. A., Fahey, P. K., and Sikora, M. A. (2006). Natural images and contrast encoding in bipolar cells in the retina of the land- and aquatic-phase tiger salamander. Vis. Neurosci. 23, 35–47. doi: 10.1017/s0952523806231043
Burrone, J., Neves, G., Gomis, A., Cooke, A., and Lagnado, L. (2002). Endogenous calcium buffers regulate fast exocytosis in the synaptic terminal of retinal bipolar cells. Neuron 33, 101–112. doi: 10.1016/s0896-6273(01)00565-7
Cadetti, L., Bryson, E. J., Ciccone, C. A., Rabl, K., and Thoreson, W. B. (2006). Calcium-induced calcium release in rod photoreceptor terminals boosts synaptic transmission during maintained depolarization. Eur. J. Neurosci. 23, 2983–2990. doi: 10.1111/j.1460-9568.2006.04845.x
Cadetti, L., and Thoreson, W. B. (2006). Feedback effects of horizontal cell membrane potential on cone calcium currents studied with simultaneous recordings. J. Neurophysiol. 95, 1992–1995. doi: 10.1152/jn.01042.2005
Cadetti, L., Thoreson, W. B., and Piccolino, M. (2004). Pre- and post-synaptic effects of manipulating surface charge with divalent cations at the photoreceptor synapse. Neuroscience 129, 791–801. doi: 10.1016/j.neuroscience.2004.08.043
Carter-Dawson, L. D., and LaVail, M. M. (1979). Rods and cones in the mouse retina. I. Structural analysis using light and electron microscopy. J. Comp. Neurol. 188, 245–262. doi: 10.1002/cne.901880204
Choi, S.-Y., Jackman, S., Thoreson, W. B., and Kramer, R. H. (2008). Light regulation of Ca2+ in the cone photoreceptor synaptic terminal. Vis. Neurosci. 25, 693–700. doi: 10.1017/s0952523808080814
Corey, D. P., Dubinsky, J. M., and Schwartz, E. A. (1984). The calcium current in inner segments of rods from the salamander (Ambystoma tigrinum) retina. J. Physiol. 354, 557–575. doi: 10.1113/jphysiol.1984.sp015393
DeVries, S. H., Li, W., and Saszik, S. (2006). Parallel processing in two transmitter microenvironments at the cone photoreceptor synapse. Neuron 50, 735–748. doi: 10.1016/j.neuron.2006.04.034
Duncan, G., Rabl, K., Gemp, I., Heidelberger, R., and Thoreson, W. B. (2010). Quantitative analysis of synaptic release at the photoreceptor synapse. Biophys. J. 98, 2102–2110. doi: 10.1016/j.bpj.2010.02.003
Eggermann, E., Bucurenciu, I., Goswami, S. P., and Jonas, P. (2011). Nanodomain coupling between Ca2+ channels and sensors of exocytosis at fast mammalian synapses. Nat. Rev. Neurosci. 13, 7–21. doi: 10.1038/nrn3125
Éltes, T., Kirizs, T., Nusser, Z., and Holderith, N. (2017). Target cell type-dependent differences in Ca2+ channel function underlie distinct release probabilities at hippocampal glutamatergic terminals. J. Neurosci. 37, 1910–1924. doi: 10.1523/jneurosci.2024-16.2017
Euler, T., Haverkamp, S., Schubert, T., and Baden, T. (2014). Retinal bipolar cells: elementary building blocks of vision. Nat. Rev. Neurosci. 15, 507–519. doi: 10.1038/nrn3783
Frank, T., Khimich, D., Neef, A., and Moser, T. (2009). Mechanisms contributing to synaptic Ca2+ signals and their heterogeneity in hair cells. Proc. Natl. Acad. Sci. U S A 106, 4483–4488. doi: 10.1073/pnas.0813213106
Goutman, J. D., and Glowatzki, E. (2007). Time course and calcium dependence of transmitter release at a single ribbon synapse. Proc. Natl. Acad. Sci. U S A 104, 16341–16346. doi: 10.1073/pnas.0705756104
Graydon, C. W., Zhang, J., Oesch, N. W., Sousa, A. A., Leapman, R. D., and Diamond, J. S. (2014). Passive diffusion as a mechanism underlying ribbon synapse vesicle release and resupply. J. Neurosci. 34, 8948–8962. doi: 10.1523/jneurosci.1022-14.2014
Haeseleer, F., Imanishi, Y., Maeda, T., Possin, D. E., Maeda, A., Lee, A., et al. (2004). Essential role of Ca2+-binding protein 4, a Cav1.4 channel regulator, in photoreceptor synaptic function. Nat. Neurosci. 7, 1079–1087. doi: 10.1038/nn1320
Haeseleer, F., Williams, B., and Lee, A. (2016). Characterization of C-terminal splice variants of Cav1.4 Ca2+ channels in human retina. J. Biol. Chem. 291, 15663–15673. doi: 10.1074/jbc.M116.731737
Herrmann, R., Heflin, S. J., Hammond, T., Lee, B., Wang, J., Gainetdinov, R. R., et al. (2011). Rod vision is controlled by dopamine-dependent sensitization of rod bipolar cells by GABA. Neuron 72, 101–110. doi: 10.1016/j.neuron.2011.07.030
Hirasawa, H., and Kaneko, A. (2003). pH changes in the invaginating synaptic cleft mediate feedback from horizontal cells to cone photoreceptors by modulating Ca2+ channels. J. Gen. Physiol. 122, 657–671. doi: 10.1085/jgp.200308863
Iijima, T., Ciani, S., and Hagiwara, S. (1986). Effects of the external pH on Ca channels: experimental studies and theoretical considerations using a two-site, two-ion model. Proc. Natl. Acad. Sci. U S A 83, 654–658. doi: 10.1073/pnas.83.3.654
Jackman, S. L., Choi, S.-Y., Thoreson, W. B., Rabl, K., Bartoletti, T. M., and Kramer, R. H. (2009). Role of the synaptic ribbon in transmitting the cone light response. Nat. Neurosci. 12, 303–310. doi: 10.1038/nn.2267
Jarsky, T., Tian, M., and Singer, J. H. (2010). Nanodomain control of exocytosis is responsible for the signaling capability of a retinal ribbon synapse. J. Neurosci. 30, 11885–11895. doi: 10.1523/jneurosci.1415-10.2010
Kemmler, R., Schultz, K., Dedek, K., Euler, T., and Schubert, T. (2014). Differential regulation of cone calcium signals by different horizontal cell feedback mechanisms in the mouse retina. J. Neurosci. 34, 11826–11843. doi: 10.1523/jneurosci.0272-14.2014
Kourennyi, D. E., Liu, X., Hart, J., Mahmud, F., Baldridge, W. H., and Barnes, S. (2004). Reciprocal modulation of calcium dynamics at rod and cone photoreceptor synapses by nitric oxide. J. Neurophysiol. 92, 477–483. doi: 10.1152/jn.00606.2003
Krafte, D. S., and Kass, R. S. (1988). Hydrogen ion modulation of Ca channel current in cardiac ventricular cells. Evidence for multiple mechanisms. J. Gen. Physiol. 91, 641–657. doi: 10.1085/jgp.91.5.641
Kramer, R. H., and Davenport, C. M. (2015). Lateral inhibition in the vertebrate retina: the case of the missing neurotransmitter. PLoS Biol. 13:e1002322. doi: 10.1371/journal.pbio.1002322
Krizaj, D., Lai, F. A., and Copenhagen, D. R. (2003). Ryanodine stores and calcium regulation in the inner segments of salamander rods and cones. J. Physiol. 547, 761–774. doi: 10.1113/jphysiol.2002.035683
Lee, A., Fakler, B., Kaczmarek, L. K., and Isom, L. L. (2014). More than a pore: ion channel signaling complexes. J. Neurosci. 34, 15159–15169. doi: 10.1523/jneurosci.3275-14.2014
Lindstrom, S. H., Ryan, D. G., Shi, J., and DeVries, S. H. (2014). Kainate receptor subunit diversity underlying response diversity in retinal off bipolar cells. J. Physiol. 592, 1457–1477. doi: 10.1113/jphysiol.2013.265033
Linton, J. D., Holzhausen, L. C., Babai, N., Song, H., Miyagishima, K. J., Stearns, G. W., et al. (2010). Flow of energy in the outer retina in darkness and in light. Proc. Natl. Acad. Sci. U S A 107, 8599–8604. doi: 10.1073/pnas.1002471107
Lv, C., Gould, T. J., Bewersdorf, J., and Zenisek, D. (2012). High-resolution optical imaging of zebrafish larval ribbon synapse protein RIBEYE, RIM2, and CaV1.4 by stimulation emission depletion microscopy. Microsc. Microanal. 18, 745–752. doi: 10.1017/s1431927612000268
Lv, C., Stewart, W. J., Akanyeti, O., Frederick, C., Zhu, J., Santos-Sacchi, J., et al. (2016). Synaptic ribbons require ribeye for electron density, proper synaptic localization, and recruitment of calcium channels. Cell Rep. 15, 2784–2795. doi: 10.1016/j.celrep.2016.05.045
Mansergh, F., Orton, N. C., Vessey, J. P., Lalonde, M. R., Stell, W. K., Tremblay, F., et al. (2005). Mutation of the calcium channel gene Cacna1f disrupts calcium signaling, synaptic transmission and cellular organization in mouse retina. Hum. Mol. Genet. 14, 3035–3046. doi: 10.1093/hmg/ddi336
Mariani, A. P. (1986). Photoreceptors of the larval tiger salamander retina. Proc. R. Soc. Lond. B Biol. Sci. 227, 483–492. doi: 10.1098/rspb.1986.0035
Maxeiner, S., Luo, F., Tan, A., Schmitz, F., and Südhof, T. C. (2016). How to make a synaptic ribbon: RIBEYE deletion abolishes ribbons in retinal synapses and disrupts neurotransmitter release. EMBO J. 35, 1098–1114. doi: 10.15252/embj.201592701
Mercer, A. J., Rabl, K., Riccardi, G. E., Brecha, N. C., Stella, S. L. Jr., and Thoreson, W. B. (2011). Location of release sites and calcium-activated chloride channels relative to calcium channels at the photoreceptor ribbon synapse. J. Neurophysiol. 105, 321–335. doi: 10.1152/jn.00332.2010
Mercer, A. J., and Thoreson, W. B. (2011). The dynamic architecture of photoreceptor ribbon synapses: cytoskeletal, extracellular matrix and intramembrane proteins. Vis. Neurosci. 28, 453–471. doi: 10.1017/s0952523811000356
Morgans, C. W. (1999). Calcium channel heterogeneity among cone photoreceptors in the tree shrew retina. Eur. J. Neurosci. 11, 2989–2993. doi: 10.1046/j.1460-9568.1999.00719.x
Ohn, T.-L., Rutherford, M. A., Jing, Z., Jung, S., Duque-Afonso, C. J., Hoch, G., et al. (2016). Hair cells use active zones with different voltage dependence of Ca2+ influx to decompose sounds into complementary neural codes. Proc. Natl. Acad. Sci. U S A 113, E4716–E4725. doi: 10.1073/pnas.1605737113
Pang, J.-J., Gao, F., Barrow, A., Jacoby, R. A., and Wu, S. M. (2008). How do tonic glutamatergic synapses evade receptor desensitization? J. Physiol. 586, 2889–2902. doi: 10.1113/jphysiol.2008.151050
Pierantoni, R. L., and McCann, G. D. (1984). “A quantitative study on synaptic ribbons in the photoreceptors of turtle and frog,” in Photoreceptors, eds. A. Borsellino and L. Cervetto (Boston, MA: Springer), 255–283.
Puller, C., Ivanova, E., Euler, T., Haverkamp, S., and Schubert, T. (2013). OFF bipolar cells express distinct types of dendritic glutamate receptors in the mouse retina. Neuroscience 243, 136–148. doi: 10.1016/j.neuroscience.2013.03.054
Rabl, K., and Thoreson, W. B. (2002). Calcium-dependent inactivation and depletion of synaptic cleft calcium ions combine to regulate rod calcium currents under physiological conditions. Eur. J. Neurosci. 16, 2070–2077. doi: 10.1046/j.1460-9568.2002.02277.x
Scharinger, A., Eckrich, S., Vandael, D. H., Schönig, K., Koschak, A., Hecker, D., et al. (2015). Cell-type-specific tuning of Cav1.3 Ca2+-channels by a C-terminal automodulatory domain. Front. Cell. Neurosci. 9:309. doi: 10.3389/fncel.2015.00309
Schmitz, F. (2009). The making of synaptic ribbons: how they are built and what they do. Neuroscientist 15, 611–624. doi: 10.1177/1073858409340253
Sherman, A. J., Shrier, A., and Cooper, E. (1999). Series resistance compensation for whole-cell patch-clamp studies using a membrane state estimator. Biophys. J. 77, 2590–2601. doi: 10.1016/s0006-3495(99)77093-1
Sherry, D. M., Bui, D. D., and Degrip, W. J. (1998). Identification and distribution of photoreceptor subtypes in the neotenic tiger salamander retina. Vis. Neurosci. 15, 1175–1187. doi: 10.1017/s0952523898156201
Stella, S. L., Bryson, E. J., and Thoreson, W. B. (2001). Insulin inhibits voltage-dependent calcium influx into rod photoreceptors. Neuroreport 12, 947–951. doi: 10.1097/00001756-200104170-00017
Stella, S. L., and Thoreson, W. B. (2000). Differential modulation of rod and cone calcium currents in tiger salamander retina by D2 dopamine receptors and cAMP. Eur. J. Neurosci. 12, 3537–3548. doi: 10.1046/j.1460-9568.2000.00235.x
Sterling, P., and Matthews, G. (2005). Structure and function of ribbon synapses. Trends Neurosci. 28, 20–29. doi: 10.1016/j.tins.2004.11.009
Straiker, A., and Sullivan, J. M. (2003). Cannabinoid receptor activation differentially modulates ion channels in photoreceptors of the tiger salamander. J. Neurophysiol. 89, 2647–2654. doi: 10.1152/jn.00268.2002
Szmajda, B. A., and Devries, S. H. (2011). Glutamate spillover between mammalian cone photoreceptors. J. Neurosci. 31, 13431–13441. doi: 10.1523/jneurosci.2105-11.2011
Tan, B. Z., Jiang, F., Tan, M. Y., Yu, D., Huang, H., Shen, Y., et al. (2011). Functional characterization of alternative splicing in the C terminus of L-type CaV1.3 channels. J. Biol. Chem. 286, 42725–42735. doi: 10.1074/jbc.M111.265207
Thoreson, W. B., and Burkhardt, D. A. (1991). Ionic influences on the prolonged depolarization of turtle cones in situ. J. Neurophysiol. 65, 96–110.
Thoreson, W. B., and Mangel, S. C. (2012). Lateral interactions in the outer retina. Prog. Retin. Eye Res. 31, 407–441. doi: 10.1016/j.preteyeres.2012.04.003
Thoreson, W. B., Van Hook, M. J., Parmelee, C., and Curto, C. (2016). Modeling and measurement of vesicle pools at the cone ribbon synapse: changes in release probability are solely responsible for voltage-dependent changes in release. Synapse 70, 1–14. doi: 10.1002/syn.21871
tom Dieck, S., Altrock, W. D., Kessels, M. M., Qualmann, B., Regus, H., Brauner, D., et al. (2005). Molecular dissection of the photoreceptor ribbon synapse: physical interaction of Bassoon and RIBEYE is essential for the assembly of the ribbon complex. J. Cell Biol. 168, 825–836. doi: 10.1083/jcb.200408157
Vaithianathan, T., and Matthews, G. (2014). Visualizing synaptic vesicle turnover and pool refilling driven by calcium nanodomains at presynaptic active zones of ribbon synapses. Proc. Natl. Acad. Sci. U S A 111, 8655–8660. doi: 10.1073/pnas.1323962111
Van Hook, M. J., and Thoreson, W. B. (2013). Simultaneous whole-cell recordings from photoreceptors and second-order neurons in an amphibian retinal slice preparation. J. Vis. Exp. 76:e50007. doi: 10.3791/50007
Van Hook, M. J., and Thoreson, W. B. (2014). Endogenous calcium buffering at photoreceptor synaptic terminals in salamander retina. Synapse 68, 518–528. doi: 10.1002/syn.21768
Van Hook, M. J., and Thoreson, W. B. (2015). Weak endogenous Ca2+ buffering supports sustained synaptic transmission by distinct mechanisms in rod and cone photoreceptors in salamander retina. Physiol. Rep. 3:e12567. doi: 10.14814/phy2.12567
Van Hook, M. J., Parmelee, C. M., Chen, M., Cork, K. M., Curto, C., and Thoreson, W. B. (2014). Calmodulin enhances ribbon replenishment and shapes filtering of synaptic transmission by cone photoreceptors. J. Gen. Physiol. 144, 357–378. doi: 10.1085/jgp.201411229
Vellani, V., Reynolds, A. M., and McNaughton, P. A. (2000). Modulation of the synaptic Ca2+ current in salamander photoreceptors by polyunsaturated fatty acids and retinoids. J. Physiol. 529, 333–344. doi: 10.1111/j.1469-7793.2000.00333.x
Verweij, J., Kamermans, M., and Spekreijse, H. (1996). Horizontal cells feed back to cones by shifting the cone calcium-current activation range. Vision Res. 36, 3943–3953. doi: 10.1016/s0042-6989(96)00142-3
Vroman, R., Klaassen, L. J., Howlett, M. H. C., Cenedese, V., Klooster, J., Sjoerdsma, T., et al. (2014). Extracellular ATP hydrolysis inhibits synaptic transmission by increasing ph buffering in the synaptic cleft. PLoS Biol. 12:e1001864. doi: 10.1371/journal.pbio.1001864
Wahl-Schott, C., Baumann, L., Cuny, H., Eckert, C., Griessmeier, K., and Biel, M. (2006). Switching off calcium-dependent inactivation in L-type calcium channels by an autoinhibitory domain. Proc. Natl. Acad. Sci. U S A 103, 15657–15662. doi: 10.1073/pnas.0604621103
Warren, T. J., Van Hook, M. J., Supuran, C. T., and Thoreson, W. B. (2016a). Sources of protons and a role for bicarbonate in inhibitory feedback from horizontal cells to cones in Ambystoma tigrinum retina. J. Physiol. 594, 6661–6677. doi: 10.1113/JP272533
Warren, T. J., Van Hook, M. J., Tranchina, D., and Thoreson, W. B. (2016b). Kinetics of inhibitory feedback from horizontal cells to photoreceptors: implications for an ephaptic mechanism. J. Neurosci. 36, 10075–10088. doi: 10.1523/JNEUROSCI.1090-16.2016
Wilkinson, M. F., and Barnes, S. (1996). The dihydropyridine-sensitive calcium channel subtype in cone photoreceptors. J. Gen. Physiol. 107, 621–630. doi: 10.1085/jgp.107.5.621
Xiao, H., Chen, X., and Steele, E. C. Jr. (2007). Abundant L-type calcium channel Ca(v)1.3 (alpha1D) subunit mRNA is detected in rod photoreceptors of the mouse retina via in situ hybridization. Mol. Vis. 13, 764–771. Available online at: http://www.molvis.org/molvis/v13/a83/
Xu, J. W., and Slaughter, M. M. (2005). Large-conductance calcium-activated potassium channels facilitate transmitter release in salamander rod synapse. J. Neurosci. 25, 7660–7668. doi: 10.1523/JNEUROSCI.1572-05.2005
Zenisek, D., Davila, V., Wan, L., and Almers, W. (2003). Imaging calcium entry sites and ribbon structures in two presynaptic cells. J. Neurosci. 23, 2538–2548.
Keywords: ribbon synapse, retina, exocytosis, calcium imaging, cone photoreceptor, active zone
Citation: Grassmeyer JJ and Thoreson WB (2017) Synaptic Ribbon Active Zones in Cone Photoreceptors Operate Independently from One Another. Front. Cell. Neurosci. 11:198. doi: 10.3389/fncel.2017.00198
Received: 17 March 2017; Accepted: 26 June 2017;
Published: 11 July 2017.
Edited by:
Carol Mason, Columbia University, United StatesReviewed by:
Victoria P. Connaughton, American University, United StatesC. Peter Bengtson, Heidelberg University, Germany
Copyright © 2017 Grassmeyer and Thoreson. This is an open-access article distributed under the terms of the Creative Commons Attribution License (CC BY). The use, distribution or reproduction in other forums is permitted, provided the original author(s) or licensor are credited and that the original publication in this journal is cited, in accordance with accepted academic practice. No use, distribution or reproduction is permitted which does not comply with these terms.
*Correspondence: Wallace B. Thoreson, d2J0aG9yZXNAdW5tYy5lZHU=