 Starlee Lively
 Doris Lam
 Raymond Wong
 Lyanne C. Schlichter
- 1Krembil Research Institute, Genes and Development Division, University Health Network, Toronto, ON, Canada
- 2Department of Physiology, University of Toronto, Toronto, ON, Canada
The cytokine, transforming growth factor β1 (TGFβ1), is up-regulated after central nervous system (CNS) injuries or diseases involving microglial activation, and it has been proposed as a therapeutic agent for treating neuroinflammation. Microglia can produce and respond to TGFβ1. While rats and mice are commonly used for studying neuroinflammation, very few reports directly compare them. Such studies are important for improving pre-clinical studies and furthering translational progress in developing therapeutic interventions. After intracerebral hemorrhage (ICH) in the rat striatum, the TGFβ1 receptor was highly expressed on microglia/macrophages within the hematoma. We recently found species similarities and differences in response to either a pro-inflammatory (interferon-γ, IFN-γ, +tumor necrosis factor, TNF-α) or anti-inflammatory interleukin-4 (IL-4) stimulus. Here, we assessed whether rat and mouse microglia differ in their responses to TGFβ1. Microglia were isolated from Sprague-Dawley rats and C57BL/6 mice and treated with TGFβ1. We quantified changes in expression of >50 genes, in their morphology, proliferation, apoptosis and in three potassium channels that are considered therapeutic targets. Many inflammatory mediators, immune receptors and modulators showed species similarities, but notable differences included that, for some genes, only one species responded (e.g., Il4r, Il10, Tgfbr2, colony-stimulating factor receptor (Csf1r), Itgam, suppressor of cytokine signaling 1 (Socs1), toll-like receptors 4 (Tlr4), P2rx7, P2ry12), and opposite responses were seen for others (Tgfb1, Myc, Ifngr1). In rat only, TGFβ1 affected microglial morphology and proliferation, but there was no apoptosis in either species. In both species, TGFβ1 dramatically increased Kv1.3 channel expression and current (no effects on Kir2.1). KCa3.1 showed opposite species responses: the current was low in unstimulated rat microglia and greatly increased by TGFβ1 but higher in control mouse cells and decreased by TGFβ1. Finally, we compared TGFβ1 and IL10 (often considered similar anti-inflammatory stimuli) and found many different responses in both species. Overall, the numerous species differences should be considered when characterizing neuroinflammation and microglial activation in vitro and in vivo, and when targeting potassium channels.
Introduction
In the central nervous system (CNS), transforming growth factor β1 (TGFβ1) is important for development of microglia (Butovsky et al., 2014), and is thought to help maintain their “resting” state (Spittau et al., 2013). TGFβ1 is up-regulated after CNS damage or in disease states that involve microglial activation, including stroke and neurodegenerative diseases (Lehrmann et al., 1998; Lively and Schlichter, 2012; Lively et al., 2016; Chen et al., 2017; Taylor et al., 2017). TGFβ1 is expressed in microglia in the healthy brain (De Groot et al., 1999) as is the TGFβ1 receptor (De Groot et al., 1999; Pál et al., 2014). After experimental stroke, TGFβ1 (Wiessner et al., 1993; Lehrmann et al., 1998) and the TGFβ1 receptor (Pál et al., 2014) are up-regulated, especially in microglia/activated macrophages. Brain TGFβ1 also rapidly increased in a mouse model of intracerebral hemorrhage (ICH; Taylor et al., 2017). To improve the use of animal models for translation to human CNS diseases, it is important to determine whether immune responses are conserved among species. As a prelude to this in vitro study, we first determined that TGFβ1 mRNA (Lively and Schlichter, 2012) and the TGFβ1 receptor protein (present study) increased in a rat model of ICH.
There are surprisingly few studies comparing microglial responses in these rodent species. Our recent study showed many differences in responses of rat and mouse microglia to pro- and anti-inflammatory cytokines (Lam et al., 2017). Based on microglial responses to TGFβ1 in vitro and in vivo, it is thought that this cytokine promotes a homeostatic phenotype (Abutbul et al., 2012; Spittau et al., 2013; Butovsky et al., 2014; Krasemann et al., 2017). The microglial reaction after CNS damage is often followed by resolution and repair phases, and many authors have defined a microglial “acquired deactivation” state, similar to macrophage responses to TGFβ1, interleukin-10 (IL-10) or glucocorticoids (Mantovani et al., 2004; Boche et al., 2013; Cherry et al., 2014; Orihuela et al., 2016). Recently, some transcriptional profiling of TGFβ1 responses has been published for mouse microglia (Butovsky et al., 2014; Taylor et al., 2017), and two studies compared a small number of molecular responses to TGFβ1 and IL-10 in mouse (Ledeboer et al., 2000) and rat microglia (Lodge and Sriram, 1996). However, more detailed comparisons of both species are needed. Here, we compared transcriptional profiles of rat and mouse microglia in response to TGFβ1 application in vitro by quantifying >50 genes that included microglial activation markers, pro- and anti-inflammatory mediators and receptors, signaling molecules, nicotinamide adenine dinucleotide phosphate (NADPH) oxidases (NOX enzymes), purinergic and phagocytic receptors, as well as several ion channels and regulators. At the protein level, we also assessed the TGFβ1 receptor (TGFβR1), the interferon-γ (IFNγ) receptor (IFNGR1), the mannose receptor (CD206/MRC1) and the Ca2+-activated K+ channel, KCa3.1. While there were some species similarities in responses to TGFβ1, the observed differences reinforce the importance of analyzing both species in pre-clinical studies. Moreover, in comparing the TGFβ1 responses with our recently published analysis of IL-10 responses of primary rat and mouse microglia, substantial differences were seen between these two anti-inflammatory cytokines.
When considering microglial contributions to CNS damage and recovery, numerous recent studies using specific K+ channel blockers have shown roles for Kv1.3, Kir2.1 and KCa3.1 channels, leading to their consideration as targets for regulating neuroinflammation (for recent reviews and further references, see Lam and Schlichter, 2015; Lam et al., 2017; Nguyen et al., 2017a,b). In principle, K+ channels hyperpolarize cells and increase the driving force for Ca2+ entry. Previous work from our lab (for instance, Jiang et al., 2003; Ohana et al., 2009; Ferreira et al., 2014; Siddiqui et al., 2014; Lam and Schlichter, 2015) and others (e.g., Heo et al., 2015; Michaelis et al., 2015) shows that microglia use Ca2+ entry through store-operated channels (SOC) and Ca2+-release-activated Ca2+ (CRAC) channels to regulate many microglial functions, including proliferation, migration, phagocytosis and cytokine production (reviewed in Möller, 2002; Färber and Kettenmann, 2006). Therefore, we compared transcript expression between rat and mouse microglia, with and without TGFβ1 treatment, for several Ca2+ and K+ channels and regulators; as well as current amplitudes (the final outcome of functioning channel proteins) for Kir2.1, Kv1.3, and KCa3.1. Again, despite some similar responses, there were species differences that should be considered for future translational studies.
Materials and Methods
All procedures on animals adhered to the Canadian Council on Animal Care guidelines for humane animal use and were approved by the University Health Network Animal Care Committee (Animal Use Protocols 914, 1573 and 1132).
Staining Intracerebral Hemorrhage Tissue
The methods for creating an ICH by injecting collagenase into the striatum of male Sprague-Dawley rats (300–350 g; Charles River, Saint-Constant, QC, Canada), and preparing the tissue and cryosections for immunohistochemistry were exactly as in our recent work (Moxon-Emre and Schlichter, 2011; Lively and Schlichter, 2012; Joseph et al., 2016). Microglia/macrophages were labeled with antibodies against CD11b (OX42, 1:200, Bio-Rad/AbD Serotec, RRID:SCR_013553; Cat# MCA275G, RRID:AB_321301) and TGFβR1 (1:500, Abcam, RRID:SCR_012931; Cat# ab31013, RRID:AB_778352). Secondary antibodies were Alexa-conjugated and used at 1:200 dilution (Jackson ImmunoResearch Labs, West Grove, PA; Cat# 715-545-150, RRID:AB_2340846; Cat# 711-585-152, RRID:AB_2340621) in phosphate buffered saline (PBS; Wisent, Saint-Jean-Baptiste, QC, Canada; Cat# 311-010-CL) with 0.2% Triton X-100 (Sigma-Aldrich, RRID:SCR_008988; Cat# T8787) and 5% donkey serum (Jackson ImmunoResearch Labs; Cat# 017-000-121). To label cell nuclei, 4’-6-diamidino-2-phenylindole (DAPI; 1:5000; Sigma-Aldrich; Cat# D9542) was applied for 10 min. Slides were mounted in Dako mounting medium (Agilent-Dako, RRID:SCR_013530; Cat# S302380-2) and stored in the dark at 4°C. Images were obtained with a confocal microscope (model LSM880; Zeiss, Oberkochen, Germany) and processed using ImageJ software, version 1.47v1(RRID:SCR_003070).
Isolating Microglia and Treating Them With TGFβ1
Neonatal Microglia
Microglia were isolated from Sprague-Dawley rat pups (P1–P2) and C57BL/6 mouse pups (P0–P2; both from Charles River), as recently described (Lam et al., 2017). These strains were selected because they are widely used, and C57BL/6 is the main strain for transgenic studies. In brief, mashed brain tissue was strained and centrifuged (300× g, 10 min) in cold Minimal Essential Medium (MEM; Thermo Fisher Scientific, RRID:SCR_008452; Cat# 11095080). Mixed brain cell cultures were established by re-suspending the pellet in MEM, incubating in 75 cm2 flasks with 20 ml MEM supplemented with 10% fetal bovine serum (FBS; Wisent; Cat# 080-150) and 0.05 mg/ml gentamycin (Thermo Fisher Scientific; Cat# 15710072). The medium was changed after 2 days, and microglia (≥99% pure) were harvested a few days later by shaking the flasks (5 h, 65 rpm) on an orbital shaker in the incubator, centrifuging the supernatant, and re-suspending the cells in fresh MEM (with 2% FBS, 0.05 mg/ml gentamycin). Microglia were seeded onto UV-irradiated 15 mm coverslips (Fisher Scientific, Ottawa, ON, Canada; Cat# 12-545-83) at densities that are noted under each assay. Their initial state was similar for both species, as confirmed from the expression of numerous genes (see “Results” section).
Adult Microglia
Adult male Sprague-Dawley rats (300–350 g) or C57BL/6J mice (20–30 g; Charles River) were deeply anesthetized with isoflurane and decapitated. After 400 mg of cerebral cortex was harvested, it was chopped into small pieces in 1 ml HBSS without Ca2+ or Mg2+ (Thermo Fisher; Cat# 14170112), and centrifuged (300× g, 2 min) to pellet the tissue. Following the manufacturer’s protocol for the Neural Dissociation Kit (P; Miltenyi Biotec, RRID:SCR_008984; Cat# 130-092-628), the supernatant was removed, cells were dissociated using Pasteur pipettes. To trap myelin, cells were incubated with myelin removal beads (Miltenyi Biotec; Cat# 130-096-733) at 4°C for 15 min, washed in PBS containing 0.5% bovine serum albumin (BSA; Bioshop, Burlington, ON, Canada; Cat# ALB001), centrifuged, resuspended in PBS/BSA buffer, and passed through LS columns (Miltenyi Biotech; Cat# 130-042-401). Eluted cells were centrifuged, resuspended in PBS/BSA buffer, and incubated at 4°C for 15 min with either human/mouse CD11b or rat CD11b/c microbeads (Miltenyi Biotech; Cat# 130-093-634 and 130-105-634, respectively). To collect eluted microglia, the cell suspension was washed, centrifuged, and resuspended in PBS/BSA buffer, and passed through MS columns (Miltenyi Biotech; Cat# 130-042-201). Microglia were centrifuged, resuspended in fresh MEM (with 2% FBS, 0.05 mg/ml gentamycin), seeded at 8 × 10⁴ cells/coverslip, and grown for 1–2 days before treating with TGFβ1.
Neonatal and adult microglia were left untreated (control; CTL) or treated with TGFβ1, which was diluted from a stock solution in sterile PBS with 0.3% BSA that was stored at −20°C. The mature form of the cytokine binds to its receptor, and the amino acid sequences for mature rat, mouse and human TGFβ1 are 99%–100% identical. Therefore, either mouse or human recombinant TGFβ1 could be used. Mouse cells were treated with recombinant mouse TGFβ1 (rmTGFβ1; R&D Systems Inc., RRID:SCR_006140; Cat# 7666-MB), and rat cells were treated with recombinant human TGFβ1 (rhTGFβ1; R&D Systems Inc.; Cat# 240-B) because a rat cytokine was not commercially available. rhTGFβ1 has often been used on rodent cells (e.g., Merrill and Zimmerman, 1991; Constam et al., 1992; Butovsky et al., 2014). Widely varying TGFβ1 concentrations have previously been used on microglia (0.001–100 ng/ml), but the type (species, purified, recombinant) was not always specified. For instance, 1–100 ng/ml of an unspecified type of TGFβ1 was needed to see effects on gene expression and cytokine production (Suzumura et al., 1993). hTGFβ1 was used on mouse cells at 10 ng/ml (Xiao et al., 1997; Schilling et al., 2000; Schilling and Eder, 2003) or 50 ng/ml (Butovsky et al., 2014), and on both species at 0.1 ng/ml (Merrill and Zimmerman, 1991; Constam et al., 1992). In the past, outcomes have usually been examined from 24 h to 72 h after treatment (e.g., Suzumura et al., 1993; Xiao et al., 1997; Butovsky et al., 2014). Therefore, we first conducted a pilot study on rat microglia with 6 or 24 h treatment at 1, 5, 10 or 20 ng/ml rhTGFβ1, and then selected 24 h for most experiments. Some 6 h results are mentioned in the text.
Microglia Morphology, Proliferation and Apoptosis
Morphology
Microglial morphology and proliferation were examined, as before (Ferreira et al., 2014; Lam and Schlichter, 2015; Lam et al., 2017). For imaging, cells were seeded at 8 × 10⁴ cells/coverslip, stimulated with TGFβ1 for 24 h, and fixed in 4% paraformaldehyde (PFA; Electron Microscopy Sciences, Hatfield, PA, USA; Cat# 15710) for 10 min, permeabilized with 0.2% Triton X-100 for 5 min, washed, and labeled overnight with CD11b (1:2500, Bio-Rad/AbD Serotec). The next day, cells were washed in PBS and incubated for 1 h with Alexa 594-conjugated secondary antibody (Jackson ImmunoResearch Labs; Cat# 715-585-151, RRID:AB_2340855; 1:200). Cells were counterstained for 1 h with Acti-stain 488 phalloidin (1:50; Cytoskeleton Inc., RRID:SCR_013532; Cat# PHDG1-A) to visualize filamentous (F-) actin, and with DAPI (1:3000, 10 min) to label nuclei. Coverslips were mounted on glass slides using Dako mounting medium and stored in the dark at 4°C until images were acquired with a confocal microscope (model LSM880; Zeiss) and processed in ImageJ. Unipolar cells (those with a lamellum and trailing uropod) were counted using ImageJ in three micrographs each (20× magnification) and expressed as a percentage of total cells counted (~120–200/culture).
Proliferation
Proliferation was quantified using the CyQUANT™ NF assay (Thermo Fisher Scientific; Cat # C35006), as before (Lam and Schlichter, 2015). Microglia were seeded at 2–3 × 10⁴ cells/well of a 96-well flat-bottom plate in MEM with 2% FBS and allowed to settle for 24 h, then left untreated (control) or stimulated with TGFβ1 for 24 h. The detection dye was added to each well for 30 min (37°C, 5% CO2), and the fluorescence intensity was measured using a multi-label plate reader (Victor3 1420, Perkin Elmer, Woodbridge, ON, Canada), with excitation at 485 nm and emission at 535 nm. Duplicate readings were taken for 0.1 s at 3 mm from the bottom of the plate, averaged, and then the background was subtracted before normalizing to the control group.
Apoptosis
Cells were seeded at 4 × 10⁴ cells/well in 96-well plates (as for proliferation, above), treated with TGFβ1 for 24 h, and fixed in 4% PFA for 7 min, washed in PBS and post-fixed in methanol for 20 min. Apoptotic cells were detected using the TiterTACS™ Colorimetric Apoptosis Detection Kit (Trevigen Cell Assays, Gaithersburg, MD, RRID:SCR_012449; Cat# 4822-96-K), with positive controls (TACS-Nuclease™ added for 10–20 min to generate DNA breaks) and negative controls (omitting TdT enzyme). Absorbance was measured at 450 nm using a SPECTROstar Nano plate reader (BMG LABTECH, Offenburg, Germany).
NanoString Gene Expression Analysis
Microglia were seeded at 5 × 10⁵ cells/coverslip in a 12-well culture plate, allowed to settle for 1–2 days (37°C, 5% CO2), and then left untreated (control) or stimulated with TGFβ1 for 24 h. In a pilot study on primary rat microglia, some genes were also analyzed at 6 h after TGFβ1 treatment and the relevant results are mentioned in the text. The sample preparation and transcriptional profiling were conducted as before (Ferreira et al., 2014; Siddiqui et al., 2014, 2016; Lam et al., 2017). Microglia were stimulated with TGFβ1 for 24 h, and then total RNA was extracted using TRIzol reagent (Thermo Fisher Scientific; Cat# 15596018), purified using an RNeasy Mini Kit (QIAGEN, Mississauga, ON, Canada; Cat# 74104), and stored at −80°C. Extracted RNA (200 ng per sample) was sent to the Princess Margaret Genomics Centre (Toronto, ON, Canada2) where the assay was conducted (hybridization, detection, scanning). Separate plates had to be used for each species, with different probe sets that were designed and synthesized by NanoString nCounter technologies (see Supplementary Tables S1, S2 for probe sequences). Because gene names sometimes differ between species, for clarity, rat names are used.
Data were analyzed with nSolver Analysis Software (ver3.0; RRID:SCR_00342). Each transcript of interest was recognized by a capture probe and a reporter probe, and assay variability was minimized using negative reporter probes for background subtraction. Positive control reporter probes were included to assess the hybridization efficiency and detection range, and to calculate a scaling factor that was applied to all mRNA counts in each sample. Finally, a reference gene scaling factor was calculated in the same manner using the housekeeping genes, Hprt1 and Gusb, and used to adjust the counts for each sample (control, TGFβ1 treated).
Western Blot Analysis
Protein changes generally map well onto mRNA changes, which we previously validated for several molecules investigated here (iNOS, COX-2, Pyk-2, CD206, Arg1, Iba1; Lam et al., 2017), and here, we examined four proteins using the same methods. Microglia were seeded on 25 mm coverslips (Fisher Scientific, Ottawa, ON, Canada; Cat# 12-545-86) in 35 mm culture dishes at 1–3 × 10⁶ cells (4–7 independent cell cultures for rat; 4–8 for mouse). Cells were incubated for 24 h with or without TGFβ1, and then briefly washed with PBS, lysed for 30 min in ice-cold RIPA lysis buffer with a mammalian protease inhibitor cocktail (Sigma-Aldrich; Cat# P3840), and spun down to remove insoluble material. Protein concentration was determined with a Pierce™ BCA protein assay (Thermo Fisher Scientific; Cat# 23225), and lysates were stored at −80°C until used. Proteins were denatured (100°C for 5 min in a dry-bath incubator) in NuPage LDS sample buffer (Thermo Fisher Scientific; Cat# NP0007) with 5% 2-β-mercaptoethanol. Samples were subjected to SDS-PAGE on 8% or 12% acrylamide gels at 10 μg protein/lane, and electrophoresed for 1.5–2 h at 80 mV (stacking gel) and 120 mV (resolving gel). Proteins were then transferred to a PVDF membrane and blocked (2–3 h) in 5% non-fat dry milk in Tris-Tween buffered saline (TTBS).
Protein levels were measured for IFNGR1, TGFβR1, CD206 and KCa3.1. Polyclonal rabbit primary antibodies were applied overnight (4°C) in TTBS with 1% BSA, as follows: anti-IFNGR1 (1:250, Biorbyt, San Francisco, CA, RRID:SCR_013542; Cat# orb338837), anti-TGFβR1 (1:500; Abcam; Cat# ab31013, RRID:AB_778352), anti-CD206 (1:2000, Abcam; Cat# ab64693, RRID:AB_1523910), and anti-KCNN4 (KCa3.1; 1:2000, Bioss Inc., Boston, MA, USA; Cat# bs-6675R, RRID:AB_11058017). After washing in 1% BSA-TTBS (4 × 10 min), membranes were incubated for 1 h at room temperature in horseradish peroxidase-labeled secondary anti-rabbit IgG antibodies (1:3000; Cedarlane, Burlington, ON, Canada, RRID:SCR_004462; Cat# CLAS09-602) in 1% BSA-TTBS. After repeated washes, membranes were treated with GE Healthcare ECL™ Start Western Blotting Detection Reagent (Sigma-Aldrich; Cat# GERPN3243), and protein bands were visualized using the ChemiDoc™ XRS System (Bio-Rad).
We used total protein normalization of Coomassie-stained immunoblots (Welinder and Ekblad, 2011) by adding 0.1% Coomassie Brilliant Blue G (Sigma-Aldrich; Cat# B8522) for 1 min, de-staining for 2 min in acetic acid/methanol/water (1:5:4), air-drying, and imaging with a ChemiDoc™ XRS System. Using Image Lab (ver.5.2.1, RRID:SCR_014210), gel lanes and bands were user-delineated, background was subtracted using the software’s rolling disk algorithm, and signal intensities of identified bands were determined. Bands of interest were then normalized to the total Coomassie blue staining intensity of a given lane, and expressed as fold-changes relative to unstimulated (control) cells. Supplementary Figure S1 shows uncropped images of representative blots used for quantification.
Whole-Cell Patch-Clamp Recordings
Microglia were plated at 7–9 × 10⁴ cells/coverslip, mounted in a 300 μL volume perfusion chamber (Model RC-25, Warner Instruments, Hamden, CT, USA) at room temperature, and recorded in the whole-cell configuration. The bath solution consisted of (in mM): 125 NaCl, 5 KCl, 1 CaCl2, 1 MgCl2, 10 HEPES, 5 D-glucose, adjusted to pH 7.4 and 290–300 mOsm/kg H2O. Pipettes were pulled from thin wall borosilicate glass (World Precision Instruments, Sarasota, FL, USA, RRID:SCR_008593) on a Narishige puller (Narishige Scientific, Setagaya-Ku, Tokyo) and fire polished with a microforge (MF 900; Narishige) from about 2 MΩ to 5–8 MΩ. The pipette (internal) solution was 40 KCl, 100 K aspartate, 1 MgCl2, 10 HEPES, 2 MgATP (pH 7.2; 290–300 mOsm/kg H2O), and with 0.5 CaCl2 and 1 EGTA to buffer internal free Ca2+ to ~120 nM. The same bath and pipette solutions were used to record all currents. Data were acquired using an Axopatch 200A amplifier, filtered at 5 Hz with a DigiDATA 1322A board, and analyzed with pCLAMP 10 software (all from Molecular Devices, Sunnyvale, CA, USA). Junction/offset potentials were calculated with the pCLAMP utility and used to correct each figure. Voltage protocols are indicated in the Figure Legends and the rationale briefly explained in the “Results” section text.
Channel Blockers and Activators
To quantify the Kv1.3 current, the potent Kv1.3 blocker, agitoxin-2 (5 nM AgTx-2; Sigma-Aldrich, Cat# A9219) was added to the bath and the remaining current was subtracted from the total current to yield the Kv1.3 component. AgTx-2 was prepared from a stock solution in double-distilled water with 0.02% BSA. To quantify Kir2.1, the current was blocked with 20 μM ML133 (Tocris Bioscience, MO, RRID:SCR_003689; Cat# 4549) or Ba2+, and the blocker-sensitive Kir2.1 component was assessed, as before (Lam and Schlichter, 2015; Lam et al., 2017). Ba2+ was prepared in double-distilled water, and ML133 was prepared from a stock solution in dimethyl sulfoxide (DMSO; Tocris Bioscience; Cat# 3176). To quantify the KCa3.1 current, it was evoked by the positive-gating modulator, 1 μM SKA-111 (gift from Prof. Heiki Wulff, Department of Pharmacology, University of California, Davis, CA, USA; Wulff and Castle, 2010) followed by addition of the blocker, 1 μM TRAM-34 (prepared in DMSO; Sigma-Aldrich; Cat# T6700; Coleman et al., 2014), after which the blocker-sensitive KCa3.1 component was calculated.
Statistics
Quantified data are expressed as mean ± SEM for the number of biological replicates indicated in figure and table legends. For Nanostring mRNA analysis, a one-way analysis of variance (ANOVA) with Dunnett’s post hoc test was used to assess TGFβ1-induced changes within a rodent species. To compare effects of TGFβ1 and IL-10 between rat and mouse microglia, mRNA counts were normalized to housekeeping genes, and then results were expressed as fold-changes relative to control cells. A 2-way ANOVA with Fisher’s LSD test was conducted in Graphpad Prism ver 6.01 (RRID:SCR_002798). The p values for differences in treatment or species were adjusted using a 5% false discovery rate correction for multiple comparisons (Benjamini and Yekutieli, 2001) in the program R (version 3.3.1; R Project for Statistical Computing, RRID:SCR_001905). Proliferation, apoptosis, Western blotting, and electrophysiological data were analyzed in GraphPad Prism using a 2-way ANOVA with Bonferroni or Tukey’s post hoc analysis.
Results
As mentioned in the “Introduction” section, TGFβ1 is often increased after acute CNS damage, and microglia are important responders to this cytokine. We previously reported an increase in TGFβ1 mRNA in the damaged rat striatum after ICH was induced by collagenase injection (Lively and Schlichter, 2012). Before assessing TGFβ1 effects on isolated microglia, we wanted to ensure that the TGFβR1 receptor is well expressed on microglia in this model of acute CNS injury. We previously showed that at 3–7 days after ICH in the rat striatum, the number of microglia/activated macrophages dramatically increases in the hematoma (Wasserman and Schlichter, 2007; Wasserman et al., 2007; Moxon-Emre and Schlichter, 2011; Lively and Schlichter, 2012). Here, we show that at 7 days after ICH, there was substantial TGFβR1 staining in microglia/macrophages in the hematoma (Figure 1A; CD11b staining; the hematoma was readily identified by the presence of blood). More distant from the hematoma (toward the right side of each image), and in the undamaged contralateral striatum, there was ubiquitous, diffuse TGFβR1 staining. The remainder of this study addresses the questions: what are the effects of TGFβ1 exposure on isolated microglia, and do the outcomes differ between rat and mouse?
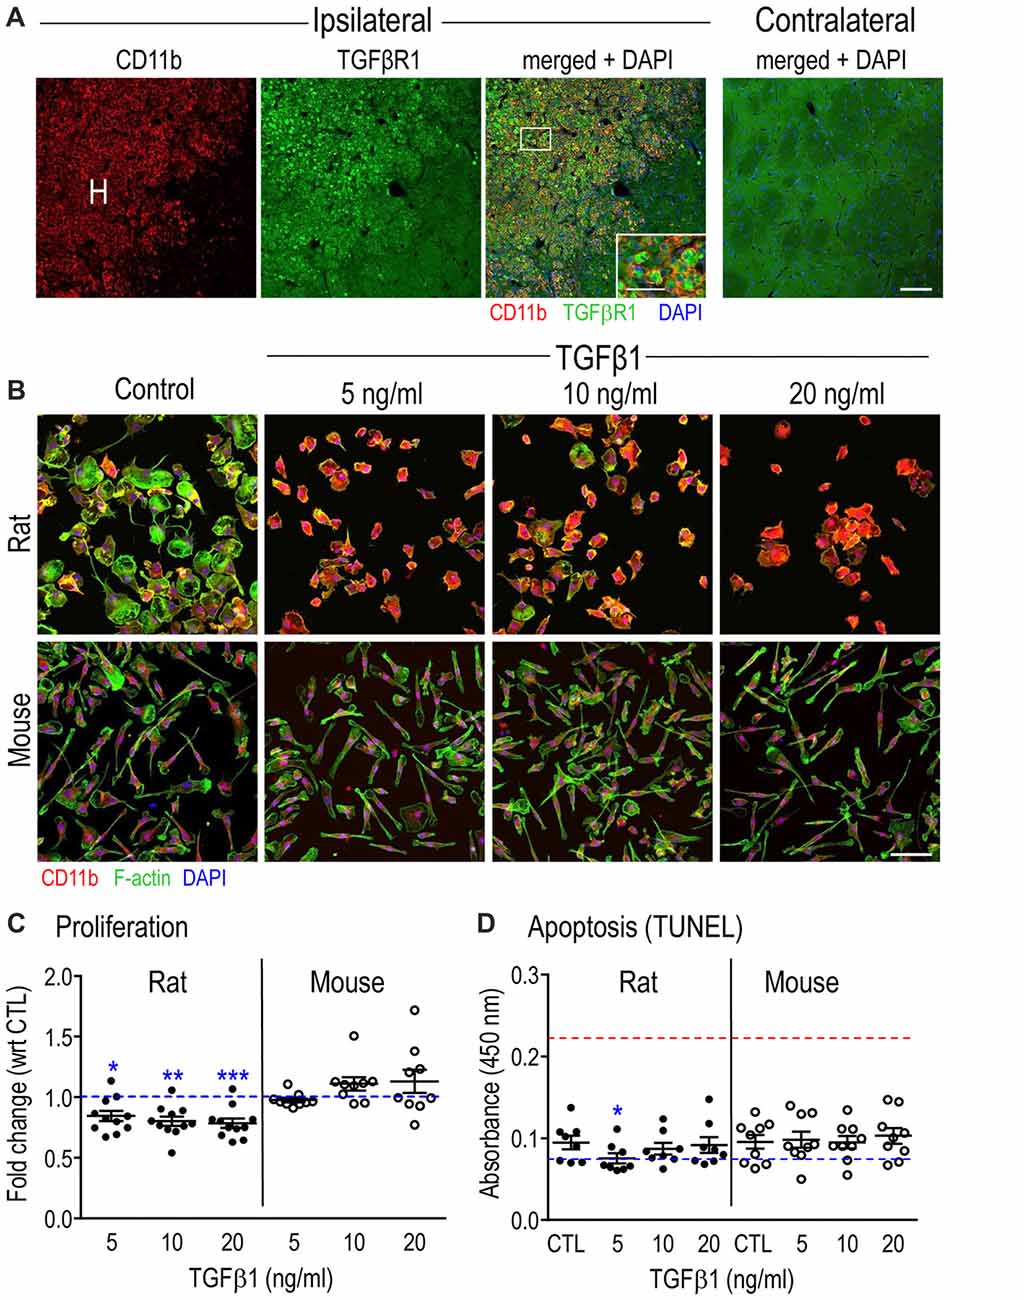
Figure 1. Transforming growth factor β1 (TGFβ1) receptor in microglia after Intracerebral hemorrhage (ICH), and general effects of TGFβ1 on microglia in vitro. (A) Microglia/macrophages increase in the hematoma (H) after ICH and express TGFβR1. Representative confocal micrographs taken at 7 days in the damaged ipsilateral rat striatum (left) and the undamaged contralateral striatum (right). The inset is a higher magnification image of the boxed area (scale bar, 20 μm) showing microglia and infiltrating macrophages in the hematoma labeled with CD11b (OX-42 antibody; red) and TGFβR1 (green). Cell nuclei are labeled with 4’-6-diamidino-2-phenylindole (DAPI; blue). Scale bar for main images is 100 μm. (B) The morphology of isolated microglia (stained for CD11b, red, as in (A) was assessed using phalloidin to stain F-actin (green) and DAPI (blue) to label nuclei. Images are representative of results from six separate cell cultures for each species. Scale bar is 100 μm. (C) Microglia proliferation was determined 24 h after TGFβ1 treatment using the CyQUANT™ assay. Results are shown as fold-change with respect to untreated (control, CTL) microglia (blue dashed line) and expressed as mean ± SEM for 9–11 individual cell cultures. (D) Apoptosis was monitored using the TiterTACS™ colorimetric assay at 24 h after TGFβ1 treatment. Results are shown as mean absorbance at 450 nm (mean ± SEM, 8–9 individual cultures). The blue dashed line indicates values for the negative controls, and the red dashed line indicates the positive controls. Significant differences are shown between control and TGFβ1 treated cells (*). One symbol of indicates p < 0.05; 2, p < 0.01; 3, p < 0.001.
Effects of TGFβ1 on Microglial Morphology, Proliferation and Apoptosis
To assess the general health of isolated rat and mouse microglia and their response to TGFβ1, we first examined morphology, proliferation and apoptosis in a pilot study using 5, 10 and 20 ng/ml of TGFβ1 (Figures 1B–D). As seen in Figure 1B, untreated cells had a similar morphology to our recent studies of primary rat (Siddiqui et al., 2012; Lively and Schlichter, 2013; Lam et al., 2017) and mouse (Lam et al., 2017) microglia. That is, about half the cells had a distinct unipolar, migratory phenotype with a lamellum at the leading edge and a tail/uropod at the trailing end (50 ± 2%, 12 individual cultures for rat; 53 ± 2%, eight individual cultures for mouse). For control cells, the main species differences are the wider lamellum in rat (32.5 ± 1.5 μm) than mouse (25.4 ± 0.9 μm; p = 0.0025, unpaired t-test), and greater cell length in mouse (79.2 ± 3.9 μm) than rat (68.0 ± 2.0 μm; p = 0.0273, unpaired t-test). Consequently, the aspect ratio (lamellum width ÷ cell length) was 0.54 ± 0.02 for rat and 0.35 ± 0.01 for mouse (p < 0.0001). Moreover, only in rat cells was the lamellum ever wider than the cell length.
TGFβ1-treated rat cells showed increased CD11b staining and retracted their lamellae and uropods at all concentrations tested. However, visual inspection cannot determine whether the rounding up reflects a change in size or just a change in morphology at a constant size. The measured membrane capacitance can be used as a direct measure of total cell membrane area, regardless of 3-dimensional cell shape. For instance, capacitance accounts for retraction of cell processes, membrane ruffling and changes in cell height. This is because the bimolecular lipid membrane is a remarkably consistent dielectric, and specific membrane capacitance is, in essence, a biological constant (~1 μF/cm2). We measured cell capacitance during patch-clamp experiments (below) and showed no differences between species or with TGFβ1 treatment. For control microglia, the values (mean ± SEM) were 25.3 ± 1.8 pF (n = 32) for rat, and 24.2 ± 1.4 pF (n = 45) for mouse. For mouse microglia, 24 h treatment with TGFβ1 did not obviously affect the morphology or intensity of CD11b staining, and the capacitance was 22.1 ± 1.0 pF (n = 41; p = 0.2206, unpaired t-test). Despite rat cells rounding up, their capacitance was not affected (22.3 ± 1.5 pF; n = 29; p = 0.2125, unpaired t-test). Thus, the shape changes were due to rounding up, not to cell size changes.
The longest TGFβ1 treatment time used for gene and protein analysis in this study was 24 h. The proliferation assay showed a modest decrease (20%–25%) at 24 h in the number of rat microglia at all TGFβ1 concentrations; while mouse cell numbers were unaffected (Figure 1C). Despite the decrease in rat cell numbers, TGFβ1 treatment did not evoke apoptosis at 24 h in either species at any concentration tested (Figure 1D). This suggests that the decrease in rat cell numbers was an effect on cell cycle, although this was not directly examined. Based on the morphological changes and slightly decreased proliferation of rat microglia, we chose the lowest effective TGFβ1 concentration (5 ng/ml) for subsequent rat experiments, while 20 ng/ml was used for mouse.
Transcriptional Profiling to Compare Rat and Mouse Microglial Response to TGFβ1
The next goal was to compare responses of rat and mouse microglia to TGFβ1 by profiling transcript expression of >50 selected genes. We have organized the results into functional groupings, including microglial markers and immunomodulators, pro- and anti-inflammatory mediators and their receptors, and some molecules related to specific microglial physiological functions. The gene nomenclature is indicated for rat (Supplementary Table S1) and mouse (Supplementary Table S2), and where different, the rat names are used.
Microglia Markers and Immune Modulators
First, we quantified expression of several genes that are often used to identify microglial “activation” after acute brain injury, as well as several immunomodulatory molecules (Table 1; Supplementary Table S3).
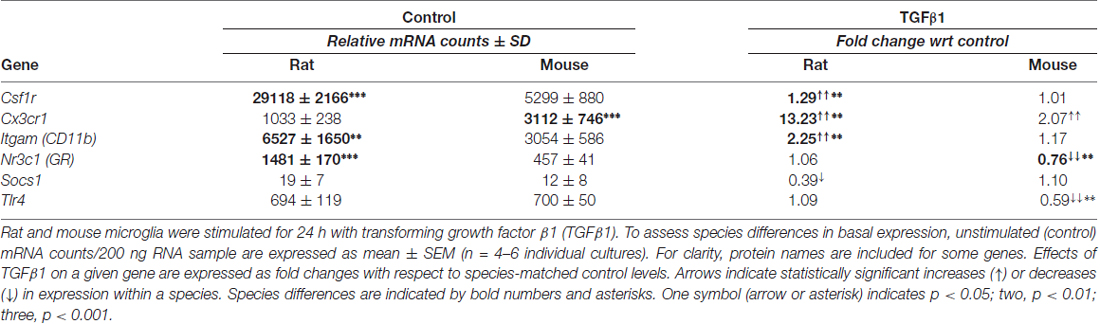
Table 1. Transcript expression of microglia markers and immune modulators.
Control
Microglia of both species expressed moderate levels (>100 counts) of several well-known receptors on microglia: Itgam (CD11b), Cx3cr1 (fractalkine receptor), toll-like receptors 2 and 4 (Tlr2, Tlr4) and Nr3c1 (glucocorticoid receptor, GR), and high levels (>5000 counts) of Cd68 (ED1) and colony-stimulating factor receptor (Csf1r; c-fms). The most striking species differences in control cells were higher Cd68 and much higher Aif1 (Iba1) in rat, as recently reported (Lam et al., 2017). Among known immune modulators, both species expressed low levels (<100 counts) of suppressor of cytokine signaling 1 (Socs1) and Socs3, and moderate levels of Nfkbia (IκBα; endogenous inhibitor of NFκB) and translocator protein (Tspo).
TGFβ1 Treated
Of genes in this category, 6/12 were altered in one or both species but there were several species differences in the magnitude of responses (Table 1). For instance, rat microglia had greater up-regulation of Cx3cr1, Itgam and Csf1r; mouse cells had reduced Nr3c1 and Tlr4 ; and rat cells had reduced Socs1. Several genes in this category were not significantly altered in either species: Aif1, Cd68, Nfkbia, Socs3, Tlr2 and Tspo (Supplementary Table S3). There were several similarities in a pilot study of 6 h TGFβ1 treatment of rat cells, including up-regulated Cx3cr1 and Itgam but no changes in Tlr2 or Tlr4 (not illustrated).
Anti-inflammatory Genes and Receptors
Control
Microglia of both species had moderate resting mRNA levels of Tgfb1, and its cognate receptors, Tgfbr1 and Tgfbr2; however, rat cells had higher Tgfb1 and Tgfbr1 (Table 2). Both species had low resting levels of the interleukins, Il4 and Il10, but moderate levels of their receptors (Il4r, Il13ra1, Il10ra, Il10rb). Several genes associated with alternative activation were very low in both species: Arg1, Ccl22, Cd163 and Retnla (FIZZ1). Il1rn, Mrc1 (CD206), Myc, Pparg and Trem2 were moderately expressed in both species. The main species differences were that unstimulated rat cells had higher levels of Il1rn, Il4r, Il10ra, Il10rb, Pparg, Tgfb1, Tgfbr1 and Trem2.
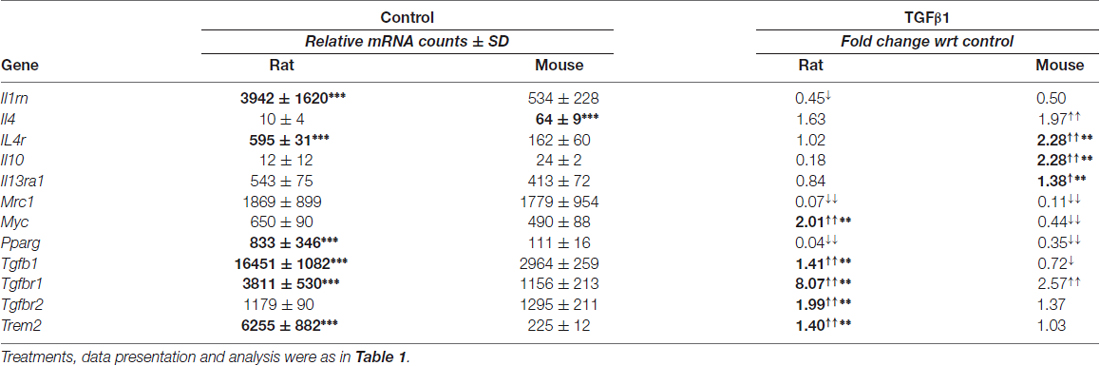
Table 2. Transcript expression of anti-inflammatory genes and receptors.
TGFβ1 Treated
Changes were seen in 12/18 genes examined in one or both species. Both species had decreased Mrc1 and Pparg, and increased Tgfbr1 (Table 2). We previously showed that mRNA changes in several hallmark genes corresponded well with protein changes in both rat and mouse microglia (Lam et al., 2017). Here, we corroborated protein changes for two exemplary molecules. Figure 2 shows representative Western blots and summarized protein changes for CD206 (Mrc1; Figure 2A) and TGFβR1 (Figure 2B). In accord with the mRNA changes, CD206 protein decreased in both species (Figure 2A), and TGFβR1 protein increased, particularly in rat microglia (Figure 2B). With respect to mRNA levels, there were several species differences in the magnitude or even in the direction of responses. For instance, Tgfb1 and Myc increased in rat but decreased in mouse. Only rat cells showed increases in Tgfbr2 and Trem2, and only mouse cells showed increases in Il4, Il10, Il4r and Il13ra1. Interestingly, neither species showed a change in several alternative activation-associated genes: Arg1, Ccl22, Cd163, Retnla or the IL10 receptors: Il10ra and Il10rb (Supplementary Table S3). A pilot study of 6 h TGFβ1 treatment of rat cells showed several similarities: decreased Mrc1 and Pparg, and no change in Ccl22 (not illustrated).
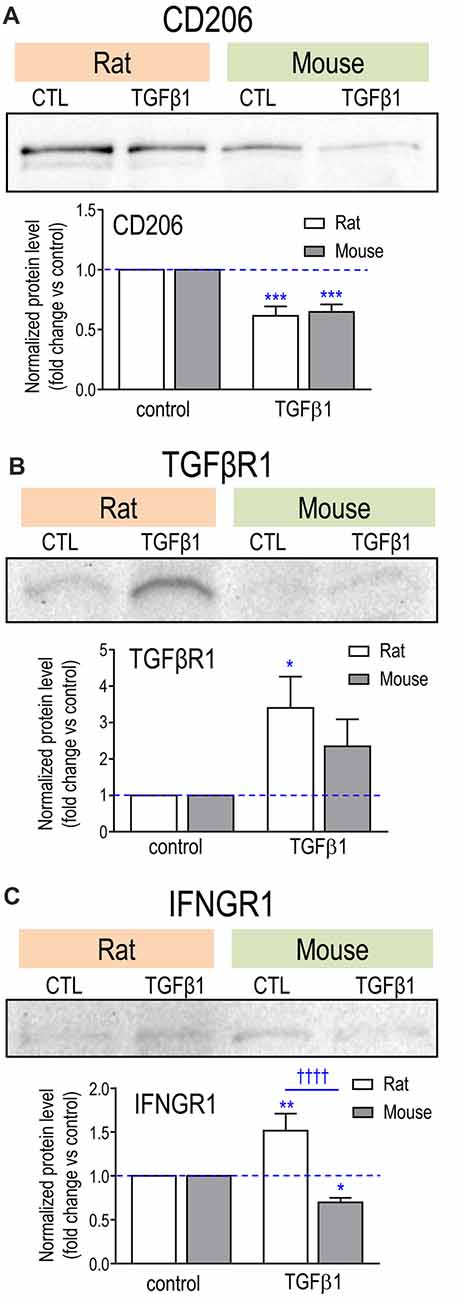
Figure 2. Effect of TGFβ1 treatment on protein levels for exemplary molecules. (A) CD206; (B) TGFβR1; (C) IFNGR1. Microglia were unstimulated (CTL, control) or stimulated with TGFβ1 for 24 h. Representative Western blots, with both species on the same gel. For each blot, the band of interest was normalized to total protein in that lane (Coomassie blue staining), and then the fold-changes were calculated with respect to unstimulated (control) microglia (mean ± SEM; 4–7 individual cultures for mouse, 5–6 for rat). Significant differences are shown between control and TGFβ1 treated cells (*), and between species (†). One symbol of either type indicates p < 0.05; 2, p < 0.01; 3, p < 0.001; and 4, p < 0.0001.
Pro-inflammatory Genes and Receptors
Control
As we previously found for rat microglia (Sivagnanam et al., 2010; Liu et al., 2013; Lively and Schlichter, 2013; Siddiqui et al., 2016; Lam et al., 2017); here, unstimulated microglia from both species were in a relatively resting state, exemplified by very low expression of several pro-inflammatory mediators: Nos2 (iNOS), Il6, Ptgs2 (COX-2), Ifng and Il1r1 (IL-1β receptor; Supplementary Table S3). Nevertheless, cells of both species were poised to respond to the pro-inflammatory cytokines, IFNγ and TNFα, having moderate levels of the receptors, Ifngr1, Tnfrsf1a (TNFR1) and Tnfrsf1b (TNFR2; Table 3; Supplementary Table S3). Both species also expressed moderate levels of Tnf (TNFα, which is normally expressed in the healthy brain), caspase-1 (Casp1), IL-1-converting enzyme (ICE), Ccl3 (macrophage inflammatory protein 1-alpha), and the protein kinase, Ptk2b (proline-rich tyrosine kinase 2, PYK2). The main species differences were that rat showed much lower Ifngr2 and higher Ccr5, Ifngr1, Il1b, Tnfrsf1a, Tnfrsf1b and Trem1.
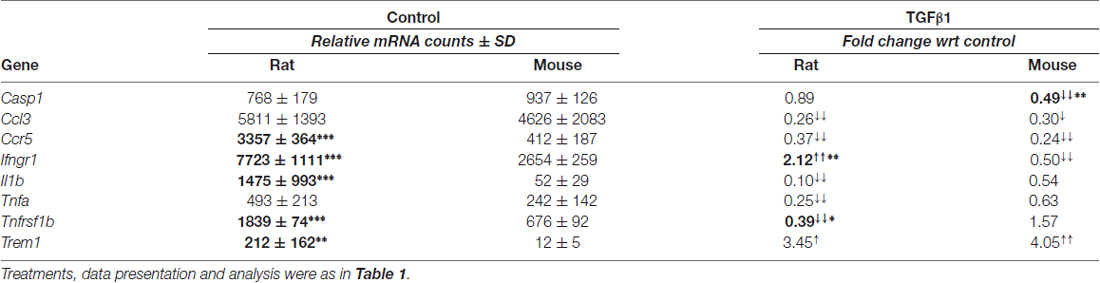
Table 3. Transcript expression of pro-inflammatory genes and receptors.
TGFβ1 Treated
There were changes in 8/17 in one or both species, but again, there were species differences. Ifngr1 increased in rat but decreased in mouse. Representative Western blots and summarized protein changes for IFNGR1 (Figure 2C) corroborate this species difference in response to TGFβ1 treatment. In rat, five genes were decreased (Ccl3, Ccr5, Il1b, Tnfa, Tnfrsf1b) and Trem1 was increased. There were some similarities in mouse (decreased Ccl3 and Ccr5, increased Trem1) but a unique response was decreased Casp1, an enzyme that contributes to IL1β activation. Hallmark pro-inflammatory genes that did not change in either species included Ccr2, Ifng, Ifngr2, Il1r1, Il6, Nos2, Ptgs2, Ptk2b and Tnfrs1a (Supplementary Table S3). It appears that many transcriptional responses to TGFβ1 were rapid; i.e., in a pilot study of 6 h treatment of rat microglia (not illustrated), 17/25 genes showed qualitatively similar responses to those seen at 24 h; e.g., increases in Cx3cr1, Itgam, Ncf1 and P2rx7; decreases in Tnfa, Mrc1 and Pparg, and no changes in Nos2, Il4, Il4ra, Tlr4, Cd163 and Retnla.
Additional Genes Related to Microglial Physiology
Our earlier qRT-PCR (Sivagnanam et al., 2010) and recent Nanostring analyses (Siddiqui et al., 2016; Lam et al., 2017) showed that unstimulated rat microglia express several phagocytosis-related receptors, oxygen radical-producing NOX enzymes, as well as purinergic receptors that can respond to adenosine triphosphate (ATP) released from damaged and dying cells, modulate microglial phagocytosis, reactive oxygen species production and migration. Expression of some of these molecules changed according to the activation state (Sivagnanam et al., 2010; Siddiqui et al., 2016; Lam et al., 2017). For instance, those studies showed that pro-inflammatory stimuli elevated Cybb (NOX2), Ncf1, Fcgr3a; while IL-4 treatment reduced Cybb and increased Fcgr2b. Cybb is the main contributor to the respiratory burst in microglia (Siddiqui et al., 2016), and its activation requires (neutrophil cytosolic factor 1, Ncf1/p47phox) relocation to the plasma membrane (reviewed in El-Benna et al., 2009). The voltage-gated proton channel, Hvcn1 (Hv1), can promote NOX enzyme activity by allowing H+ efflux as charge compensation for NADPH-generated electrons (Ramsey et al., 2009; DeCoursey, 2013).
Control
Unstimulated microglia from both species had very low expression of Nox1, Nox4, P2ry2, Adora1 (adenosine A1 receptor), and Adora2a (adenosine A2A receptor). Both species had moderate to high levels of Hvcn1, Cybb, Ncf1, P2rx7, P2ry12, Itgb2 and the phagocytosis-related molecules, Fcgr1 (CD64), Fcgr2b (CD32), Fcgr3a (CD16) and Msr1 (SR-A; Table 4; Supplementary Table S3). The main species differences were that rat cells had higher levels of Hvcn1, Ncf1, Fcgr1, Fcgr2b, Itgb2, P2ry12 and Msr1, while mouse had higher levels of only Cybb.
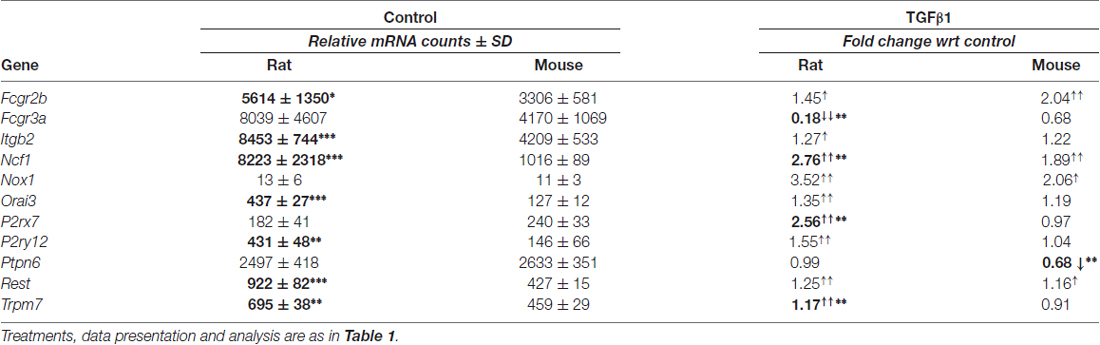
Table 4. Transcript expression of additional genes related to microglial physiology and ion signaling.
TGFβ1 Treated
Several genes were affected by TGFβ1 (Table 4), including up-regulated Fcgr2b, Ncf1 (higher in rat) and Nox1 in both species. Species differences were decreased Fcgr3a and increased P2rx7 (also seen at 6 h, not illustrated) and P2ry12 in rat cells only. In both species, Adora1, Adora2a, Cybb, Fcgr1, Hvcn1, Msr1, Nox4 and P2ry2 were unchanged (Supplementary Table S3).
Ion Channels and Regulators
Many microglial functions depend on Ca2+ signaling (see “Introduction” and “Discussion” sections); thus, we asked whether TGFβ1 treatment affects expression of several ion channel genes that are linked to Ca2+ entry. These included the Ca2+-permeable channels, Trpm2, Trpm4 and Trpm7, the pore-forming subunits of CRAC channels (Orai1, Orai3), and the CRAC regulator, Stim1. We then assessed several K+ channels that potentially regulate the driving force for Ca2+ entry: Kcna2 (Kv1.2), Kcna3 (Kv1.3), Kcna5 (Kv1.5), Kcnj2 (Kir2.1), Kcnma1 (KCa1.1/BK/maxi K), Kcnn3 (KCa2.3/SK3) and Kcnn4 (KCa3.1/SK4). In addition, several important K+ channel regulators were monitored: Ptpn6 (Src homology region 2 domain-containing phosphatase-1; SHP-1), calmodulin (Calm), RE1 silencing transcription factor (Rest), Phtp1 (phosphohistidine phosphatase 1, PHP), and Nme2 (nucleoside diphosphate kinase 2, NDPK2). Note: for ease of comparison with the literature, results are presented using the protein names. While modest effects of TGFβ1 were seen in one or both species for Orai3, Rest, SHP-1 and Trpm7 (Table 4), several genes were unaffected: Kv1.2, Kir2.1, KCa1.1, Trpm2, Trpm4, Orai1, Stim1, and the KCa channel regulators, calmodulin, NDPK2 and PHP (Supplementary Table S3). Some of these were not considered further. We then focussed on the K+ channels, Kv1.3, Kir2.1 and KCa3.1, quantifying both mRNA expression and ion currents (the ultimate output of gene and protein expression). Those results are organized below under each channel type. For Kv1.3 and Kir2.1, adult microglia were also examined because some researchers have questioned whether their expression differs from neonatal microglia (see “Discussion” section).
TGFβ1 Increases Kv1.3 mRNA and Current in Neonatal and Adult Rat and Mouse Microglia
Transcripts and protein have been detected for Kv1.2, Kv1.3 and Kv1.5 in primary neonatal rat microglia (Kotecha and Schlichter, 1999; Khanna et al., 2001; Fordyce et al., 2005; Li et al., 2008), and primary neonatal mouse microglia (Kv1.2: Lam et al., 2017; Kv1.3: Schilling et al., 2000; Pannasch et al., 2006; Lam et al., 2017; Kv1.5: Pannasch et al., 2006). Here, unstimulated (control) microglia of both species expressed low transcript levels of Kv1.2 and Kv1.3 and nearly undetectable Kv1.5. mRNA counts/200 ng RNA were: Kcna2 (Kv1.2) 73 ± 47 in rat, 10 ± 6 in mouse (p = 0.011; n = 6 each); Kcna3 (Kv1.3) 109 ± 18 in rat, 70 ± 14 in mouse (p = 0.013); Kcna5 (Kv1.5) 4 ± 2 in rat, 3 ± 2 in mouse. TGFβ1 treatment did not alter Kv1.2 mRNA, but significantly increased Kv1.3 mRNA: about 7.4-fold at 24 h in rat (~10 fold at 6 h, data not shown), and 5.6-fold in mouse (Figure 3A). Kv1.5 mRNA also increased about 4.2-fold in rat and 3.4-fold in mouse cells.
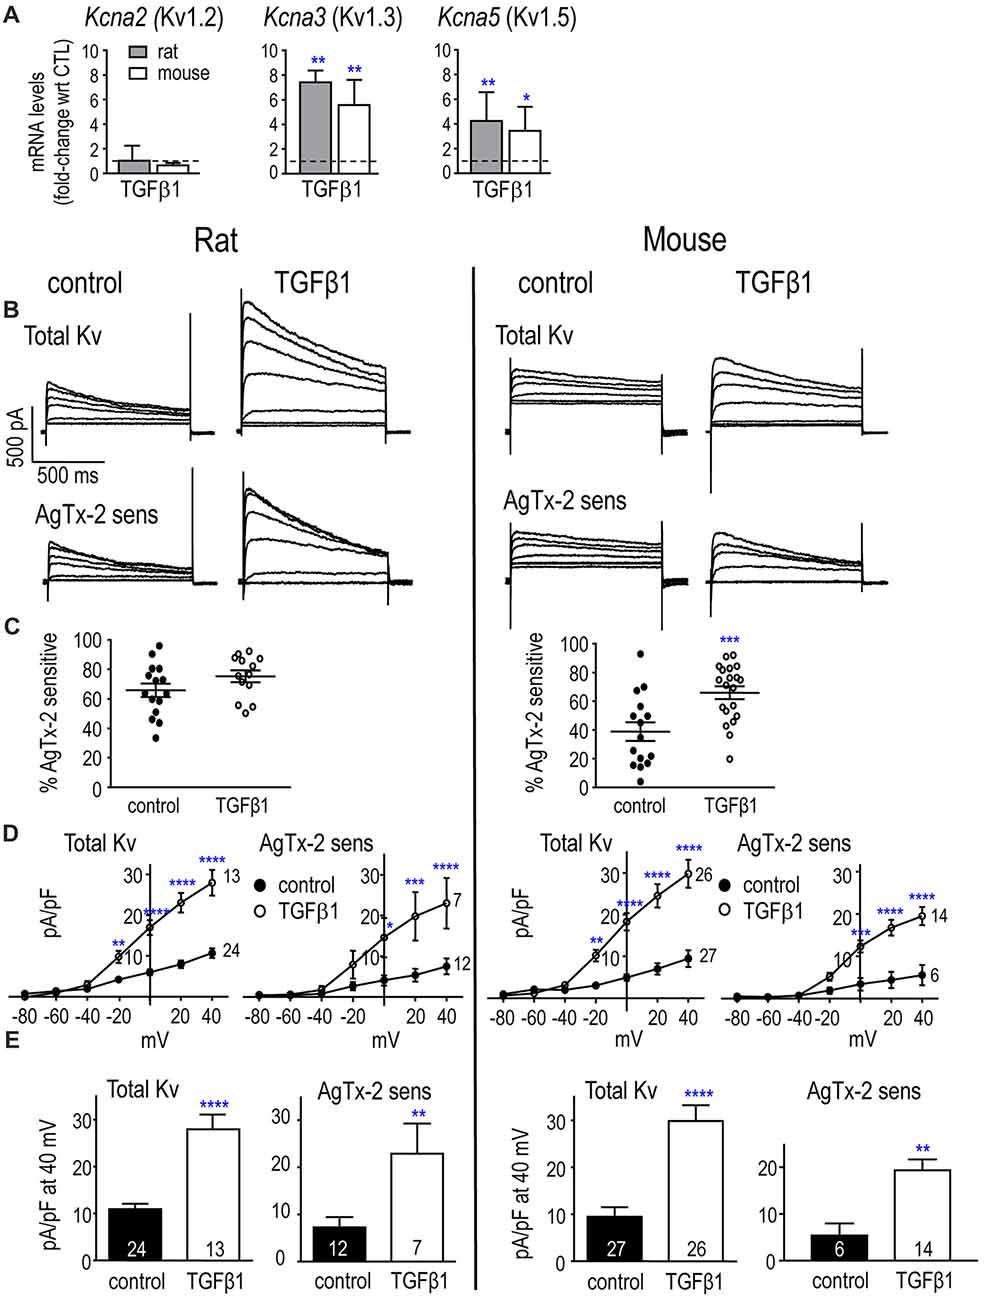
Figure 3. In neonatal rat and mouse microglia, TGFβ1 increases Kcna3 mRNA expression and Kv1.3 current. (A) Transcript expression of selected Kv1-family channel members. Rat and mouse microglia were unstimulated (control) or stimulated with TGFβ1 for 24 h (expression data) or 30 h (whole-cell recordings). mRNA expression (mRNA counts/200 ng total RNA) was determined by NanoString and expressed as fold-change relative to unstimulated control cells (mean ± SEM; n = 4–6 individual cultures). (B) Representative whole-cell Kv currents in control (untreated) microglia, and in TGFβ1-treated cells. The voltage clamp protocol consisted of 1 s-long voltage steps from −80 mV to +40 mV in 20 mV increments, applied every 60 s from a holding potential of −100 mV. Then, for each cell, 5 nM AgTx-2 was perfused into the bath to record the AgTx-2-insensitive component, which was then subtracted from the total current to yield the Kv1.3 current. (C) Scatter plot of individual cells showing the proportion of the peak current (at +40 mV) that was blocked by AgTx-2. (D) Peak current density (pA/pF) as a function of voltage for the total Kv current and the AgTx-2-sensitive Kv1.3 component. Data are shown as mean ± SEM for the number of cells indicated. (E) Summary of current density (pA/pF) measured at +40 mV. For all graphs, one symbol indicates p < 0.05; 2, p < 0.01; 3, p < 0.001; and 4, p < 0.0001.
Low levels of mRNA for K+ channels can nonetheless result in robust currents, as we previously observed for Kv1.3 and Kir2.1 (Lam and Schlichter, 2015; Lam et al., 2017), possibly because channel proteins can have very slow turnover (Jugloff et al., 2000; Balut et al., 2012). Thus, it is important to measure the currents as a direct measure of functional ion channels. We used whole-cell patch-clamp recordings to compare the total Kv and Kv1.3 currents with and without TGFβ1 treatment. Cells were treated for 30 h to provide additional time for channel protein expression, trafficking and post-translational modifications, as before (Lam et al., 2017). The cell capacitance (shown in the first section of the “Results”) was used to normalize each current to the cell size.
Kv and Kv1.3 Currents
The voltage protocols used to quantify Kv currents were essentially as in our earlier work (Kotecha and Schlichter, 1999; Cayabyab et al., 2000; Newell and Schlichter, 2005; Lam et al., 2017). Importantly, they were designed to consider that the current amplitude depends on the holding potential, test potential, and frequency of depolarization (Grissmer et al., 1994; Nörenberg et al., 1994; Kotecha and Schlichter, 1999; Cayabyab et al., 2000). The holding potential (−105 mV) was used to relieve channel inactivation, and 60 s intervals between successive depolarizing steps allowed recovery from use-dependent (cumulative) inactivation. The rat protocol required ~20 min, and because mouse recordings did not usually last long enough, the protocol was modified to a voltage ramp from −75 mV to +45 mV from the −105 mV holding potential. This protocol was first validated by ensuring that the amplitude at +45 mV was the same as for a single voltage step.
Neonatal Rat
Kv currents were observed in every rat microglial cell examined, with or without TGFβ1 treatment (examples shown in Figure 3B), and a similar proportion of the total current was Kv1.3 (i.e., blocked by AgTx-2) in both groups: 66 and 75% (Figure 3C). Both the total Kv current and AgTx-2 sensitive Kv1.3 component activated in a time- and voltage-dependent manner above about −40 mV (corrected for junction potential offsets), and the currents increased with depolarization (Figures 3B,D). Time-dependent inactivation was also apparent during the 1-s depolarizing test pulses. TGFβ1 treatment increased the total Kv current and AgTx-2 sensitive Kv1.3 component (Figures 3D,E), and is consistent with the increase in Kv1.3 mRNA (Figure 3A).
Neonatal Mouse
Two species differences in control mouse microglia were the lower prevalence of observing a Kv current (18/31 cells) and that, among cells with a detectable current, less was AgTx-2-sensitive compared to control rat microglia (~40%; Figure 3C). This implies that unstimulated mouse microglia have an additional, unidentified Kv current type. Of note, all TGFβ1-treated mouse cells expressed a Kv current (20/20), and a greater proportion of the current was Kv1.3 (65%; p < 0.001). TGFβ1 increased the amplitudes of total Kv and Kv1.3 currents (Figures 3B,D), consistent with the increase in Kv1.3 mRNA. In both species, control and TGFβ1-treated cells produced substantial currents despite the relatively low Kcna3 mRNA levels. This is consistent with our previous studies on neonatal microglia from rat (Kotecha and Schlichter, 1999; Cayabyab et al., 2000; Newell and Schlichter, 2005; Lam et al., 2017) and mouse (Lam et al., 2017).
Adult Rat and Mouse
Figure 4 shows Kv currents in adult rat and mouse microglia. In both species, a Kv current was always observed in untreated and TGFβ1-treated cells (>100 cells). In control cells, the proportion of Kv current contributed by Kv1.3 was similar in rat and mouse cells (~62 and 71%, respectively; Figure 4A). After TGFβ1 treatment, the Kv1.3 component was 78% in mouse but only 56% in rat because two cells appeared to express an AgTx-2-insensitive Kv current (Figure 4A). Effects of TGFβ1 on current amplitudes were similar to neonatal cells; i.e., both total Kv and Kv1.3 currents increased (Figures 4B,C).
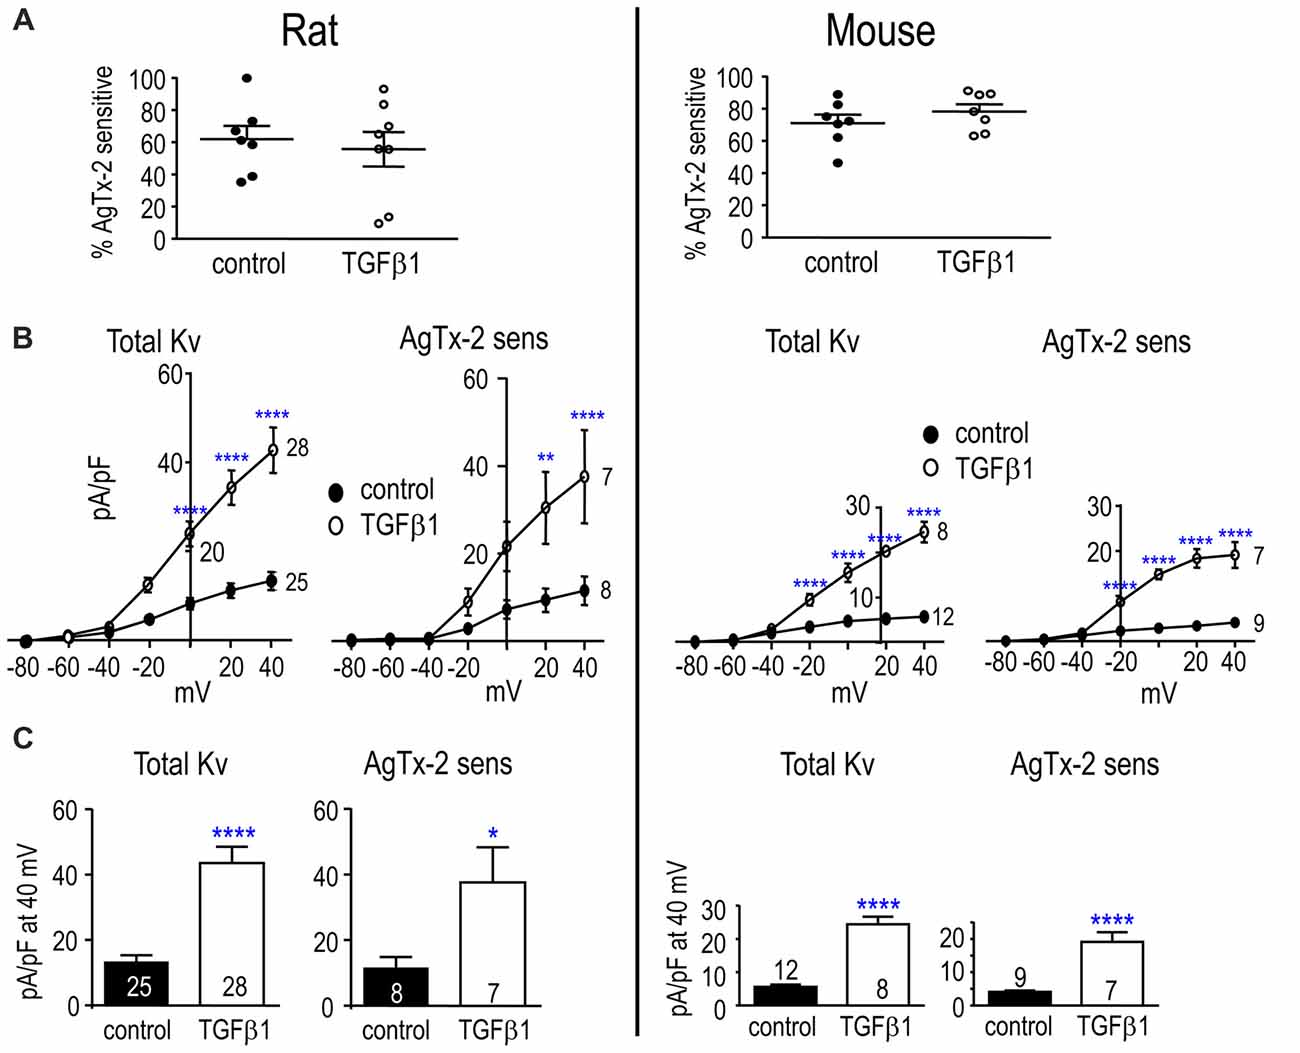
Figure 4. TGFβ1 increases the Kv1.3 current in adult rat and mouse microglia. Treatments and recording conditions were as in Figure 3. (A) Scatter plot of individual cells showing the proportion of the peak current (at +40 mV) that was blocked by AgTx-2. (B) Peak current density (pA/pF) as a function of voltage for the total Kv current and the AgTx-2-sensitive Kv1.3 component. (C) Summary of current density (pA/pF) measured at +40 mV. Data are shown as mean ± SEM for the number of cells indicated. One symbol of either type indicates p < 0.05; 2, p < 0.01; and 4, p < 0.0001.
Kir2.1 mRNA and Current Were Unchanged By TGFβ1 in Neonatal and Adult Rat and Mouse Microglia
Primary neonatal rat and mouse microglia express Kcnj2 mRNA and Kir2.1 protein, and our recent studies strongly suggest that homomeric Kir2.1 channels produce the inward-rectifying K+ current in both species (Lam and Schlichter, 2015; Lam et al., 2017). In unstimulated microglia, there was a species difference with 4.5-fold higher Kcnj2 mRNA expression in rat; i.e., mRNA counts/200 ng RNA were 1913 ± 657 in rat and 422 ± 90 in mouse (p < 0.001). TGFβ1 treatment did not significantly alter Kcnj2 mRNA expression in either species (Figure 5A).
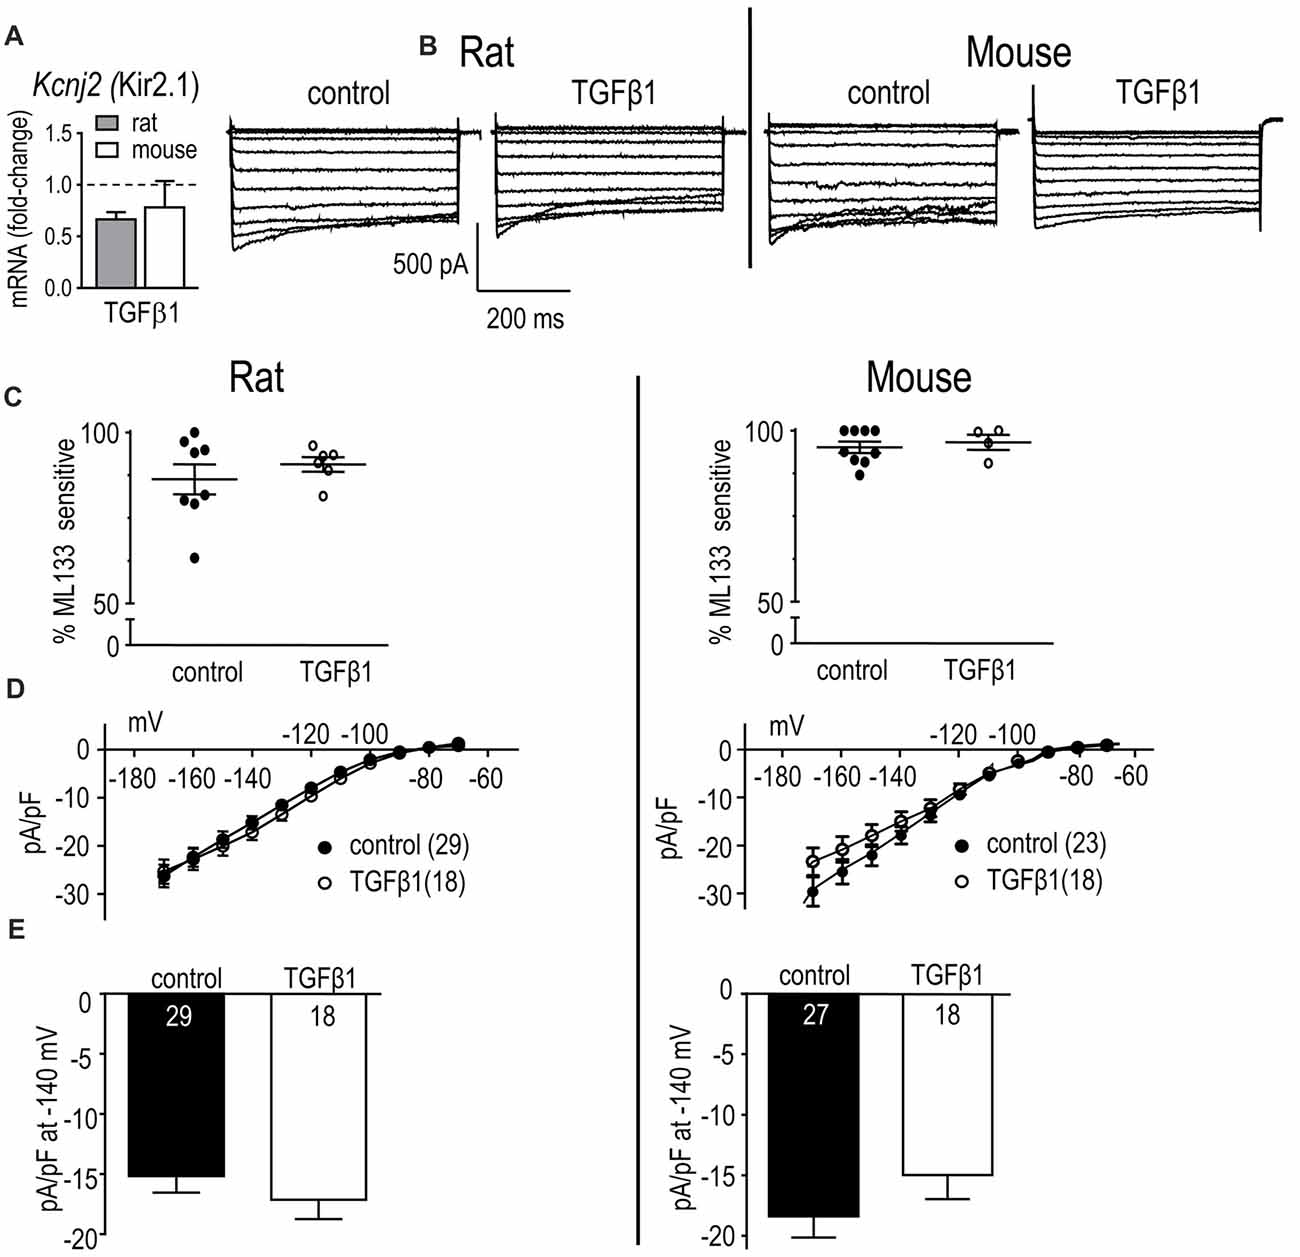
Figure 5. In neonatal rat and mouse microglia, TGFβ1 did not affect Kcnj2 mRNA expression or Kir2.1 current. Microglia were unstimulated (control) or treated with TGFβ1 for 24 h (expression data) or 30 h (whole-cell recordings). (A) mRNA expression. Data are expressed as fold-change relative to control (unstimulated) microglia (mean ± SEM of 4–6 individual cultures). (B) Inward-rectifier (Kir) current. Representative traces of total inward current in control microglia, and in TGFβ1-treated cells. Whole-cell currents were recorded in response to 500 ms-long voltage steps between −170 mV and −70 mV in 10 mV increments from a holding potential of −20 mV. (C) Scatterplot of individual cells showing the proportion of the peak current (at −140 mV) that was blocked by 20 μM ML133. (D) Peak Kir2.1 current density (pA/pF) as a function of voltage. Data are shown as mean ± SEM for the number of cells indicated. (E) Summary of peak inward current density (pA/pF) measured at −140 mV. There were no significant TGFβ1 effects at the p < 0.05 confidence level.
Kir Current
Inward currents were recorded in response to 500 ms-long voltage steps between −170 mV and −70 mV in 10 mV increments from a holding potential of −20 mV. A Kir current was detected in every rat and mouse microglial cell examined with and without TGFβ1 treatment. As previously described (Lam and Schlichter, 2015; Lam et al., 2017), microglia Kir currents display the stereotypical features of Kir2.1, with rapid activation at negative potentials, and current relaxation at very negative potentials (Figure 5B). The blocker, ML133 was used to quantify the Kir2.1 component of the whole-cell current, as before (Lam and Schlichter, 2015; Lam et al., 2017). In both species, almost all of the Kir current was blocked by 20 μM ML133 in both control and TGFβ1 conditions (86% and 91% in rat, 95% and 96% in mouse, respectively; Figure 5C); therefore, we subsequently compared the total Kir current density. In both species, the I-V relations showed inward rectification and reversal at about −82 mV after junction potential correction (Figure 5D), which is close to the K+ Nernst potential in these solutions (−84 mV). In control microglia, there was a similar magnitude of Kir2.1 current in both species, and TGFβ1 treatment had no effect (Figures 5D,E).
Results from adult rat and mouse microglia are shown in Figure 6. In both species, Kir-like currents were always observed with or without TGFβ1 treatment (n > 70 cells), and almost all the current was contributed by Kir2.1 (i.e., blocked by Ba2+; Figure 6A). Similar to neonatal cells, TGFβ1 did not change the Kir2.1 current (Figures 6B,C).
Figure 6. In adult rat and mouse microglia, TGFβ1 had no effect on the Kir2.1 current. Treatments and recording conditions were as in Figure 5. (A) Scatterplot of individual cells showing the proportion of the peak current (at −140 mV) that was blocked by 100 μM Ba2+. (B) Peak Kir2.1 current density (pA/pF) as a function of voltage (mean ± SEM for the number of cells indicated). (C) Summary of peak inward current density (pA/pF) measured at −140 mV. There were no significant TGFβ1 effects at the p < 0.05 confidence level.
Species-Specific Effects of TGFβ1 on KCa3.1 mRNA and Current
In control microglia, mRNA counts/200 ng RNA for the three K+ channels examined were: Kcnma1 (KCa1.1/BK) 6 ± 3 in rat vs. 30 ± 10 in mouse (p < 0.01; n = 4–6 each); Kcnn3 (KCa2.3) 25 ± 14 in rat vs. 9 ± 3 in mouse (p = 0.08); Kcnn4 (KCa3.1) 52 ± 11 in rat vs. 644 ± 331 in mouse (p < 0.001). Calmodulin binds to KCa3.1 and KCa2-family channels and then, Ca2+ binding to calmodulin causes the channels to open (Xia et al., 1998; Fanger et al., 1999; Khanna et al., 1999; Wong and Schlichter, 2014). Of note, Calm1 mRNA was 37-fold higher in unstimulated rat microglia (i.e., 21,304 ± 3538 counts in rat vs. 579 ± 40 in mouse, p < 0.001) and was not affected by TGFβ1 in either species (Figure 7A). A striking species difference was that TGFβ1 treatment increased Kcnn3 in mouse cells only and increased Kcnn4 in rat only (the Kcnn4 result on rat was corroborated in a pilot study using quantitative RT-PCR, normalized to Hprt1, in which TGFβ1 up-regulated Kcnn4 expression 4.5-fold (p < 0.01; n = 3; not illustrated). Furthermore, the species difference in Kcnn4 mRNA corresponded with increased KCa3.1 protein in rat (but not mouse) microglia (Figure 7B).
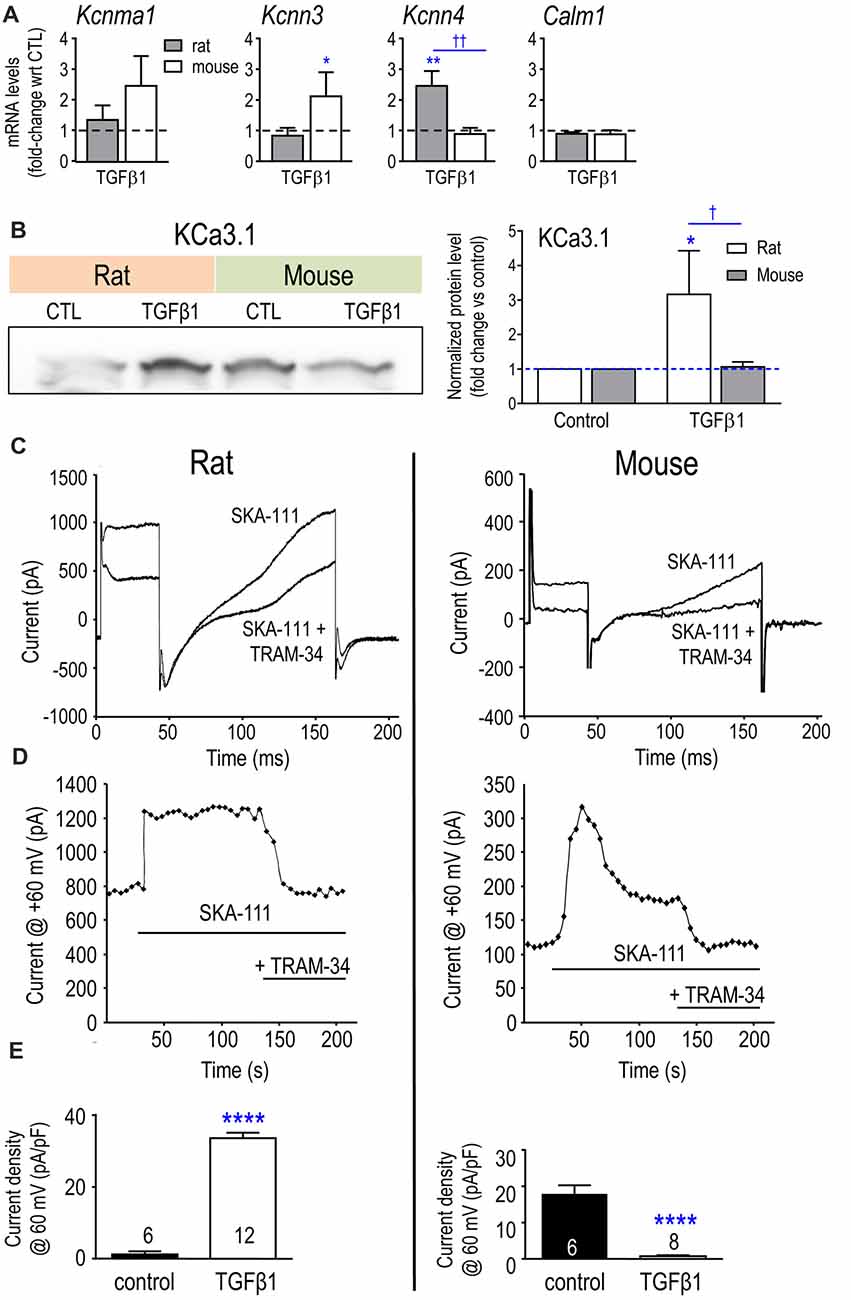
Figure 7. Expression of Kcnn4 mRNA, KCa3.1 protein and current are differently affected by TGFβ1 in neonatal rat and mouse microglia. (A) Transcript expression of the Ca2+-activated K+ channels (mean ± SEM; 4–6 individual cultures): Kcnma1 (KCa1.1/BK/maxi-K), Kcnn3 (KCa2.3/SK3), Kcnn4 (KCa3.1/SK4) and the regulatory molecule, calmodulin (Calm1). (B) Representative Western blot of KCa3.1 with both species on the same gel. Quantification resulting from normalization of each KCa3.1 band to total protein (Coomassie blue staining) in each lane. Fold changes were calculated with respect to unstimulated (control) microglia (mean ± SEM; 4–7 individual cultures for mouse, 5–6 for rat). For remaining figure, left panels represent neonatal rat microglia; right panels, neonatal mouse microglia. (C) Representative whole-cell recording showing KCa3.1 current evoked by the positive gating modulator, SKA-111 (1 μM), followed by inhibition by the blocker, 1 μM TRAM-34. From a holding potential of −90 mV, the voltage was stepped to +30 mV, followed by a ramp from −120 mV to +60 mV. (D) Examples of the time course, showing activation by the positive-gating modulator, SKA-111, and inhibition by the blocker, TRAM-34. (E) Summary of KCa3.1 current activation (i.e., the TRAM-34-sensitive component) in control cells vs. TGFβ1-treated microglia. Significant differences are shown between control and TGFβ1 treated cells (*), and between species (†). One symbol of either type indicates p < 0.05; 2, p < 0.01; and 4, p < 0.0001.
KCa3.1 is the only Ca2+-activated K+ current we have detected in primary rat microglia (Khanna et al., 2001; Ferreira and Schlichter, 2013; Ferreira et al., 2014, 2015; Wong and Schlichter, 2014). To activate KCa3.1 currents during whole-cell recordings, we used a positive-gating modulator, either NS309 or SKA-111 (Coleman et al., 2014; reviewed in Balut et al., 2012). First, total inward and outward K+ currents were measured from a holding potential of −90 mV, by stepping to +30 mV followed by a ramp from −120 mV to +60 mV (Figure 7B). Then, TRAM-34 was added to the bath, and the KCa3.1 component was isolated by subtracting the unblocked current (almost entirely Kv at depolarized voltages). Figure 7C illustrates an example of the time course of experiments. Figure 7D shows that SKA-111 activated a very small KCa3.1 current in control rat microglia (1.2 ± 0.8 pA/pF); whereas, after TGFβ1 treatment, a large KCa3.1 current was activated in 12/19 cells (33.6 ± 1.5 pA/pF for responders; p < 0.0001). In a pilot study on rat microglia (not illustrated), 500 nM NS309 failed to activate a current (3/3 cells) but after TGFβ1 treatment there was a robust current in 6/8 cells (33.6 ± 5.3 pA/pF; p < 0.01). Surprisingly, the opposite was seen for mouse cells. SKA-111 activated a large KCa3.1 current in control mouse microglia (17.9 ± 2.4 pA/pF) but after TGFβ1 treatment, almost no current was evoked (0.8 ± 0.2 pA/pF; p < 0.0001).
Comparing Microglial Responses to TGFβ1 and IL-10
As anti-inflammatory or resolving cytokines, TGFβ1 and IL-10 are often assumed to have similar effects (see “Discussion” section). In Figure 8, we compare transcriptional responses of rat and mouse microglia to TGFβ1 (present study) with responses to IL-10 from our recent study (Lam et al., 2017) and some additional genes (Ccl3, Ccr5, Csf1r, Itgb2, Kcnn3, Kcnn4, Orai3). [Note: expression of 33/80 genes was unchanged; all the data are shown in Supplementary Table S4]. For ease of comparison, the bubble chart visually highlights both the magnitude and direction of changes. There were some intriguing differences in TGFβ1 and IL-10 responses, and we will highlight some examples under each category.
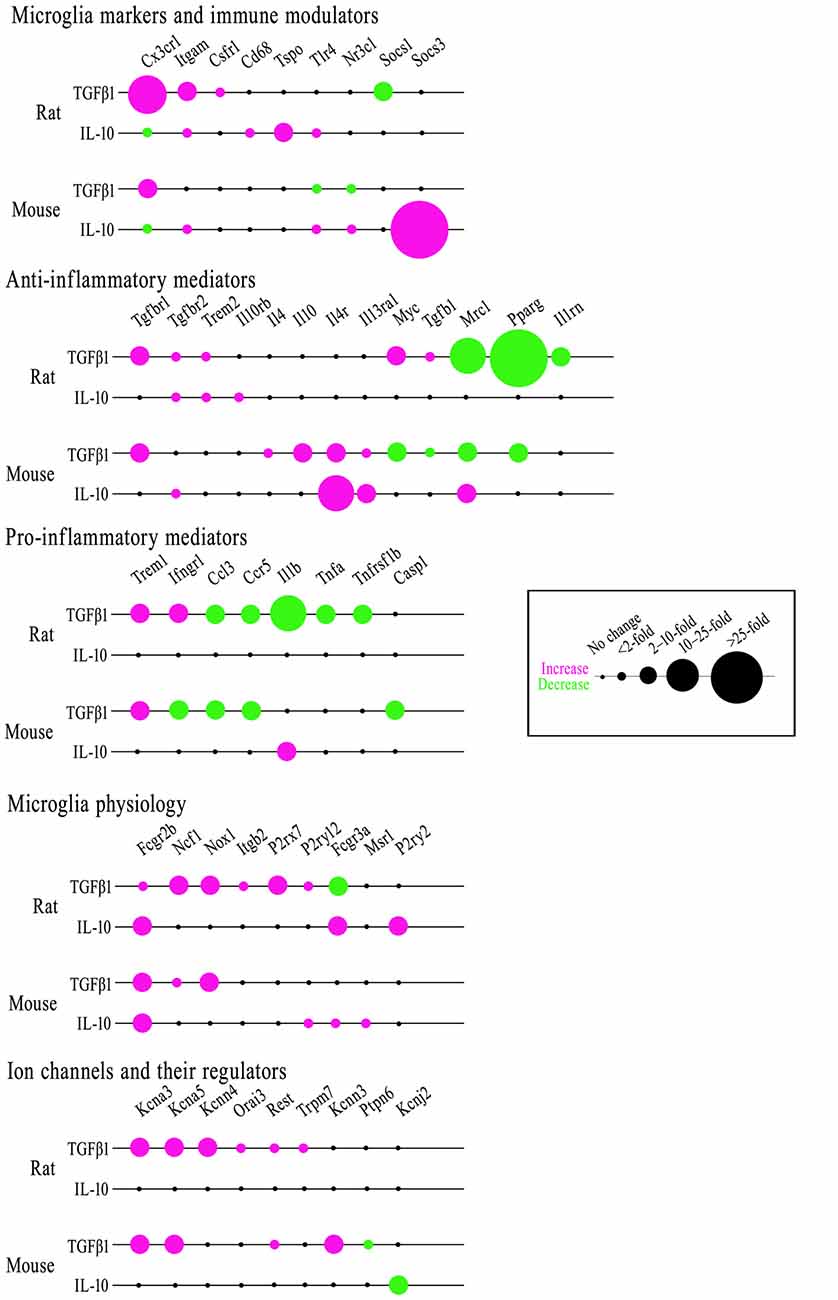
Figure 8. Comparing effects of TGFβ1 and IL-10 on gene expression in rat and mouse microglia. Microglia were stimulated with either cytokine for 24 h. mRNA transcript levels were determined by NanoString, expressed as fold-change relative to unstimulated control cells (p < 0.05 after FDR correction; n = 4–6 individual cultures). The bubble chart shows gene expression changes, sorted into bins according to ranges in the fold change. Magenta indicates increased expression; green shows decreases.
Microglial Markers and Immune Modulators
In both species, TGFβ1 increased Cx3cr1 expression; whereas, IL-10 decreased it. TGFβ1 decreased Socs1 only in rat. IL-10 increased Socs3 only in mouse. IL-10 increased Tlr4 in both species but TGFβ1 did not; indeed, Tlr4 decreased in mouse. Both cytokines increased Itgam in rat; only IL-10 increased it in mouse. TGFβ1 increased Csf1r in rat only; IL-10 did not affect either species. IL-10 increased Cd68 and Tspo in rat only. In mouse, TGFβ1 decreased Nr3c1 but IL-10 increased it.
Anti-inflammatory Genes and Receptors
In both species, TGFβ1 decreased Pparg and increased Tgfbr1; both were unaffected by IL-10. TGFβ1 decreased Mrc1 in both species; IL-10 increased it in mouse. TGFβ1 increased Tgfb1 and Myc in rat but decreased them in mouse. However, TGFβ1 decreased Il1rn in rat. In mouse only, TGFβ1 increased Il4 and Il10 and both cytokines increased Il4r and Il13ra1. Both cytokines increased Trem2 and Tgfbr2 in rat; whereas, IL-10 only elevated Tgfbr2 in mouse. IL-10 increased Il10rb only in rat.
Pro-inflammatory Genes and Receptors
In both species, TGFβ1 increased Trem1 but decreased Ccl3 and Ccr5. TGFβ1 decreased Tnfa and Tnfrsf1b only in rat and Casp1 only in mouse. Ifngr1 was oppositely affected by TGFβ1; increased in rat, decreased in mouse. IL-10 increased Il1b in mouse, while TGFβ1 decreased it in rat.
Additional Genes Related to Microglial Physiology
In both species, both cytokines increased Fcgr2b, and only TGFβ1 increased Ncf1 and Nox1. In mouse, there were no other effects of TGFβ1; however, in rat, P2rx7, Itgb2 and P2ry12 were increased and Fcgr3a was decreased. In contrast, IL-10 increased Fcgr3a in both species. IL-10 also elevated P2ry2 in rat, and P2ry12 and Msr1 in mouse.
Ion Channels and Regulators
TGFβ1 increased Kcna3, Kcna5 and Rest in both species; Kcnn4, Orai3 and Trpm7 in rat; and Kcnn3 in mouse. The only effect of IL-10 was reduced Kcnj2 in mouse. For the K+ currents, there were some notable differences. In both species, the Kv1.3 current was unaffected by IL-10 (Lam et al., 2017) but increased by TGFβ1 in both neonatal and adult microglia (present study). Here, TGFβ1 did not affect the Kir2.1 (inward-rectifier) current in neonatal or adult microglia of either species; whereas, it was decreased by IL-10 in neonatal mouse microglia (Lam et al., 2017; KCa currents were not assessed in our recent study of IL-10).
Discussion
We will summarize the present findings and relevant literature on rat and mouse under several topics. The emphasis will be on studies using primary rodent microglia because cell lines (e.g., BV-2 cells) differ in transcriptional responses (Butovsky et al., 2014; Das et al., 2016) and ion channel expression (Cayabyab et al., 2000; Ferreira and Schlichter, 2013; Liu et al., 2013).
TGFβ1 in the Brain
TGFβ1 is a pleiotropic cytokine with immunosuppressive and anti-inflammatory properties (Colton, 2009; Cherry et al., 2014; Orihuela et al., 2016). TGFβ1 levels are often increased with brain damage or disease (see “Introduction” section), and it can act on microglia and other cells. We previously found that TGFβ1 expression is up-regulated in the damaged rat striatum in the first week after ICH or ischemia (Lively and Schlichter, 2012; Lively et al., 2016). It was also increased by intracerebral injection of IL-4 in vivo (Lively et al., 2016) or by adding IL-4 to rat microglia in vitro (Liu et al., 2013). A recent study of ICH in mice showed an increase in TGFβ1 in vivo (days 1–10), and an important role in reducing microglial inflammatory cytokine and chemokine expression in vitro (Taylor et al., 2017). In that study, microglia assumed a pro-inflammatory phenotype in vivo (expressing Tnf, Il6, Ccl2, Cxcl10) up to 3 days after ICH, and then during the recovery period (days 7–14), they up-regulated Tgfb1, Tgfbr1 and Tgfbr2. Here, we found that 7 days after ICH in the rat, there was strong expression of the TGFβ1 receptor in microglia/activated macrophages within the hematoma.
Effects of TGFβ1 on Microglia in Vitro
In vitro, microglia can be skewed to multiple anti-inflammatory phenotypes, which are usually assessed by molecular profiles and functional outcomes (reviewed in Colton, 2009; Cherry et al., 2014; Orihuela et al., 2016). Such states are increasingly defined by the stimulus (e.g., IL-4, IL-10, TGFβ1, glucocorticoids); however, it is not clear to what degree microglial responses to these stimuli differ and whether there are species differences.
Effects of TGFβ1 on Microglial Health
TGFβ1 is required for production of microglia in the mouse (Butovsky et al., 2014). Only a small number of in vitro studies have addressed whether TGFβ1 affects microglial health and survival. The results vary, but whether this reflects differences in protocols or species is not known. Stimulating primary mouse microglia with a wide range of TGFβ1 concentrations (0.001–1 ng/ml) did not affect proliferation 3 days later; but if proliferation was first stimulated by a mitogen (conditioned medium or granulocyte-macrophage colony-stimulating factor; GM-CSF), it was inhibited by as little as 0.01 ng/ml TGFβ1 (Suzumura et al., 1993). TGFβ1 inhibited proliferation when it was added to mouse microglia grown on a rat astrocyte bed (Jones et al., 1998). We found that 24 h treatment with 5, 10 or 20 ng/ml TGFβ1 did not affect primary mouse microglia proliferation (in agreement with Suzumura et al., 1993) but reduced proliferation of rat microglia by 20%–25%. We did not observe microglial apoptosis in either species at 24 h. In the only relevant study that we found of primary rat microglia, 10 ng/ml hTGFβ1 increased apoptosis at 48 h (Xiao et al., 1997); the 24 h time point was not mentioned.
TGFβ1-Induced Inflammatory Profile
Based mainly on mouse studies, it is thought that TGFβ1 can maintain a resting microglial state and can also contribute to alternative activation. IL-4-mediated up-regulation of Ym1 and Arg1 mRNA depended on TGFβ1 autocrine actions on Ras/MEK/ERK signaling (Zhou et al., 2012) and, conversely, inhibition of TGFβ1 signaling decreased Ym1 and Arg1 protein levels and up-regulated Il6 and iNOS mRNA (Spittau et al., 2013). Broader transcriptional profiling of responses to TGFβ1 has recently begun for mouse microglia. An extensive microarray study applied TGFβ1 with CSF-1 (48 h), characterized the resulting state, which they called M0 because it was similar to freshly isolated adult microglia (Butovsky et al., 2014), and observed increases in 60 microglial genes, including Tgfbr1, Tgfbr2, Kcnd1 (Kv4.1) and P2ry12. There were very few genes in common with the present study but qualitatively similar results following TGFβ1 treatment were seen for Cx3cr1, Myc, Tgfbr1 and Ccr5 in mouse microglia. Applying the blood product, thrombin, to cultured mouse microglia to model ICH, up-regulated Il6, Tnf and Ccl2 and reduced Tgfbr1, and these changes were reversed by adding TGFβ1 (Taylor et al., 2017). Numerous in vitro studies have shown that TGFβ can interfere with pro-inflammatory signaling pathways induced by lipopolysaccharide (LPS; Kim et al., 2004; Le et al., 2004; Herrera-Molina and von Bernhardi, 2005; Naiki et al., 2005), and it inhibited LPS-, IFNγ- and GM-CSF-induced expression of major histocompatibility complex class II molecules (Loughlin et al., 1993; Suzumura et al., 1993; Lee et al., 1997; Hailer et al., 1998; O’Keefe et al., 1999). Such studies have led to TGFβ1 being proposed as a therapeutic strategy for treating CNS disease (reviewed in Cherry et al., 2014); however, few studies have compared microglial responses in rat and mouse (Patrizio and Levi, 1994; Du et al., 2017; Lam et al., 2017).
Comparing Responses to TGFβ1 and IL-10
With CNS damage or disease, both TGFβ and IL-10 are released by multiple cell types, including microglia (De Simone et al., 2004; Minghetti et al., 2005) and astrocytes (Dobolyi et al., 2012; Villacampa et al., 2015). Historically, many researchers have implied that TGFβ and IL-10 evoke equivalent “acquired deactivation” of microglia and macrophages (reviewed in Colton and Wilcock, 2010; Cherry et al., 2014; Orihuela et al., 2016). However, very few studies have directly compared actions of the two cytokines on microglia. Two older studies examined their ability to resolve LPS-induced activation (Lodge and Sriram, 1996; Ledeboer et al., 2000). Co-treatment of mouse microglia with LPS and either TGFβ or IL-10 reduced TNFα and NO production, but only IL-10 inhibited LPS-induced IL-12 production (Lodge and Sriram, 1996). Simultaneous treatment of rat microglia/astrocyte co-cultures with LPS and a cocktail of TGFβ1 and TGFβ2 reduced NO production, but not release of IL-1β, TNFα or IL-6; whereas, IL-10 inhibited production of NO and pro-inflammatory cytokines (Ledeboer et al., 2000). Our transcription data on >50 genes comparing effects of TGFβ1 (present study) with IL-10 (Lam and Schlichter, 2015; Siddiqui et al., 2016; Lam et al., 2017) show important differences, despite some similarities. For instance, TGFβ1 reduced pro-inflammatory mediators more than IL-10 (e.g., Casp1, Ccl3, Ccr5, Il1b, Ifngr1, Tnfa, Tnfrsf1b were reduced in one or both species). TGFβ1 increased molecules involved in superoxide production (Ncf1, Nox1), while IL-10 increased several phagocytosis-related molecules (Cd68, Mrc1, Fcgr3a, Msr1). The two cytokines evoked opposite changes in Cx3cr1. Differing responses were also seen in channel activity. Notably, in both species, TGFβ1 increased Kv1.3 currents (present study) but IL-10 had no effect (Lam et al., 2017).
Differences in responsiveness to TGFβ1 and IL-10 were not accompanied by a deficiency or down-regulation of any of the cognate receptors in either species. Receptor transcript levels (Il10ra, Il10rb, Tgfbr1, Tgfbr2) were moderately high in unstimulated rat and mouse microglia, and not reduced by either of the cytokine treatments (Lam et al., 2017; present study). The finding that TGFβ1 treatment increased Tgfbr1 and Tgfbr2 expression suggests an increased capacity for autocrine anti-inflammatory signaling, which was not the case for IL-10 treatment. Instead, IL-10 increased expression of some pro-inflammatory receptors (Tlr4, Tnfrsf1a) as well as anti-inflammatory receptors (Il4r, Il13ra1, Tgfbr2), suggesting an overall increased ability to respond to subsequent inflammatory stimuli.
Potassium Channel Expression and Function Is Affected By TGFβ1
Numerous microglial functions depend on Ca2+ signaling through CRAC (produced by Orai + Stim subunits) and SOC channels (Möller, 2002; Färber and Kettenmann, 2006), signaling that can be evoked by metabotropic purinergic (P2Y) receptors. K+ channels affect the membrane potential (Chung et al., 1998, 1999; Franchini et al., 2004; Newell and Schlichter, 2005) and regulate numerous microglia functions (Kettenmann et al., 2011; Stebbing et al., 2015). Here, TGFβ1 treatment did not affect the CRAC channel pore-forming subunit, Orai1, the CRAC regulator, Stim1, or P2ry2 in either species. Orai3 and P2ry12 were up-regulated by TGFβ1 only in rat microglia. However, there were important effects on the K+ channels, each of which will be discussed separately with an emphasis on literature from primary rodent microglia. Even within studies on primary rodent microglia, there are considerable discrepancies in which K+ channel types are expressed, which currents are active, and what changes occur with different activation states. Recent patch-clamp studies of microglia in pro- and anti-inflammatory states have examined Kir2.1 in neonatal rat microglia (Lam and Schlichter, 2015), Kv1.3, Kir2.1 and KCa3.1 in neonatal mouse microglia (Nguyen et al., 2017a,b), and have compared Kv1.3 and Kir2.1 between neonatal mouse and rat microglia (Lam et al., 2017). From these and earlier studies, it is becoming clear that there are substantial qualitative and quantitative differences between the two species.
Kv1.3 Channels
An early hypothesis was that Kv current is induced by “activation” (Nörenberg et al., 1994; Fischer et al., 1995; Visentin et al., 1995; Illes et al., 1996) but the diversity of microglial states was not recognized nor were potential species differences. Kv currents can be up-regulated by pro-inflammatory stimuli (LPS, IFNγ, IFNγ+TNFα) in rat (Nörenberg et al., 1992, 1994; Visentin et al., 1995; Fordyce et al., 2005; Lam et al., 2017) and mouse microglia (Draheim et al., 1999; Prinz et al., 1999; Pannasch et al., 2006; Lam et al., 2017; Nguyen et al., 2017a). More than one Kv channel type has been detected in rodent microglia; e.g., Kv1.3 and Kv1.5 currents in ex vivo rat microglia (Kotecha and Schlichter, 1999) and LPS-stimulated mouse microglia (Pannasch et al., 2006). Thus, it is important to use selective blockers to identify Kv1.3. Using such blockers, we almost always detect robust Kv1.3 currents in unstimulated rat microglia (Schlichter et al., 1996; Cayabyab et al., 2000; Fordyce et al., 2005; Newell and Schlichter, 2005; Lam et al., 2017; present study). In unstimulated neonatal mouse microglia, we detected Kv1.3 currents less often, and they were small and accompanied by an additional Kv current (Lam et al., 2017; present study) that might be Kv1.5. In contrast, adult mouse microglia always had a Kv current, and it was predominantly Kv1.3, suggesting a developmental change. Of note, anti-inflammatory stimuli can also increase Kv1.3 expression and current in microglia; i.e., in response to IL-4 in rat (Lam et al., 2017), and TGFβ1 in neonatal mouse (Schilling et al., 2000) and neonatal and adult rat and mouse microglia (present study). Thus, Kv1.3 current is not specific to either a pro- or anti-inflammatory state and, instead, its up-regulation appears to signal a change from the resting, surveillance state. This might not be surprising, given that Kv1.3 is involved in numerous microglial functions that might occur in pro- or anti-inflammatory milieu, including proliferation (Kotecha and Schlichter, 1999), chemotactic migration (Nutile-McMenemy et al., 2007), chemokine and cytokine production (Liu et al., 2012; Charolidi et al., 2015), respiratory burst (Khanna et al., 2001), and even, neurotoxicity (Fordyce et al., 2005). The observed expression and roles need to be considered when targeting this channel in vivo to affect CNS inflammation.
Kir2.1 Channels
From the earliest recordings onward, a Kir2.1-like inward-rectifying current has usually been seen in unstimulated rat (Kettenmann et al., 1990; Korotzer and Cotman, 1992; Visentin et al., 1995; Schlichter et al., 1996) and mouse cells (Draheim et al., 1999; Prinz et al., 1999). But there are inconsistencies concerning its prevalence and amplitude in stimulated cells, and it is possible that they reflect heterogeneity in culture, stimuli or activation states. In response to LPS, IFNγ or IFNγ+TNFα, mouse microglia had smaller Kir currents (Draheim et al., 1999; Prinz et al., 1999; Boucsein et al., 2003; Lam et al., 2017) but in a recent study, LPS did not affect the current (Nguyen et al., 2017b). Rat cells varied from no change to a small increase with LPS, a large increase with IFNγ (Nörenberg et al., 1992, 1994; Visentin et al., 1995; Draheim et al., 1999), and a decrease with IFNγ+TNFα (Lam et al., 2017). The contrast with earlier studies using IFNγ might relate to our additional use of TNFα. While less is known about Kir2.1 responses to anti-inflammatory stimuli, the results also vary. In primary mouse microglia, IL-4-treated cells had large currents (Lam et al., 2017; Nguyen et al., 2017b), and the current was reduced by IL-10 (Lam et al., 2017) but not affected by TGFβ1 (Schilling et al., 2000; present study). In primary rat microglia, Kir2.1 was reduced by IL-4 (Lam et al., 2017) but unaffected by TGFβ1 in either neonatal or adult cells (present study). Roles of Kir2.1 are not well understood, possibly because the earlier blockers were not sufficiently potent or selective. In rat microglia, there is evidence that Kir2.1 regulates proliferation (Schlichter et al., 1996), and using a better blocker (ML133) we found that it regulates CRAC-mediated Ca2+ entry and ATP-induced chemotaxis (Lam and Schlichter, 2015). The observed decreases in Kir2.1 current by some pro- and anti-inflammatory stimuli, and possible species differences might make it difficult to target this channel for controlling microglial functions.
KCa3.1 Channels
KCa3.1 is considered a therapeutic target in the CNS because selective KCa3.1 blockers have improved the outcome in animal models of trauma, spinal cord injury, stroke and neurodegeneration (reviewed in Maezawa et al., 2012; Feske et al., 2015; Chen et al., 2016; Dale et al., 2016). Although Kcnn4 transcripts have been reported in primary microglia both from rats (Khanna et al., 2001; Kaushal et al., 2007) and mice (Bouhy et al., 2011), the presence of a KCa3.1 current appears to be quite variable and dependent on the activation state. In rat microglia, small TRAM-34-sensitive KCa3.1 currents were recorded in a minority of unstimulated cells but transcripts and current were dramatically up-regulated by IL-4 (Ferreira et al., 2014) or TGFβ1 (present study). IL-4 up-regulated KCa3.1 through Ras/MEK/ERK signaling, and the channel then contributed to migration, invasion and Ca2+ signaling (Ferreira et al., 2014). However, KCa3.1 also regulates LPS-mediated activation (through p38 MAPK), leading to production of pro-inflammatory mediators and neuron killing (Kaushal et al., 2007; Liu et al., 2013), and UTP-stimulated chemotaxis and expression of the pro-inflammatory genes, IL-1β and iNOS (Ferreira and Schlichter, 2013). In mouse microglia, KCa3.1 currents are also variable, and apparently susceptible to culturing conditions and activation states but effects of TGFβ1 were not studied. In early studies, moderate charybdotoxin-sensitive KCa currents were seen when microglia from NMRI mice were cultured with M-CSF and astrocyte-conditioned medium (Eder et al., 1997; Schilling et al., 2002). Later studies using the more selective blocker, TRAM-34, showed that unstimulated cells had small (Maezawa et al., 2011; Nguyen et al., 2017b) to moderate KCa3.1 currents (present study). Intriguingly, the current was unaffected by IL-4 or LPS alone, and moderately increased by IFNγ but not by IFNγ + LPS (Nguyen et al., 2017b), while we found that it was greatly decreased by TGFβ1 (present study). Variable KCa3.1 expression was seen in ex vivo tissue from damage models. For instance, no KCa3.1 current was seen in juvenile mouse microglia within acute brain slices (Schilling and Eder, 2007); whereas in adult microglia isolated using CD11b-coated magnetic beads, there were KCa3.1 currents in some microglia at 8 days after ischemia, and in most microglia isolated from LPS-injected mouse brains (Chen et al., 2016). In adult human microglia from epilepsy patients, most cells expressed a KCa3.1 current, which was unaffected by LPS and slightly increased by IL-4 (Blomster et al., 2016). Thus, a clear picture of KCa3.1 expression in microglia has not emerged.
Conclusions and Future Directions
Studies of disease mechanisms rely heavily on rodent models and translation to humans is a continuing challenge. Transcriptional profiling is increasingly used to investigate microglia in CNS damage and disease states, and an important question is whether differences reported in microglia responses in vivo and in vitro instead reflect species differences. Our in vitro study of >50 targeted molecules showed significant species similarities as well as important differences in microglial responses to TGFβ1. Some genes can be compared with recent high-content studies analyzing microglia isolated from both naive and damaged or diseased brains. Most of those studies were on mice, with some exemplary molecules validated in human brain tissue. Molecular signatures include homeostatic genes expressed in normal microglia (Gautier et al., 2012; Orre et al., 2014; Zhang et al., 2014), a microglial “sensome” in adult and aged mice (Hickman et al., 2013), and a unique plaque-associated phagocytic subtype in Alzheimer’s (“Disease-associated microglia”/DAM; Keren-Shaul et al., 2017; Krasemann et al., 2017). Several molecules that we found were well expressed in control microglia and up-regulated by TGFβ1 are in a homeostatic fingerprint that is maintained by TGFβ1 signaling (Butovsky et al., 2014; Gosselin et al., 2014); e.g., Csf1r, Cx3cr1, P2ry12. Several microglial signature molecules were also restricted to microglia in humans; i.e., C1qa, Gas6, Mertk, P2ry12, and Pros1 (Butovsky et al., 2014). Some molecules we examined (including P2ry12, Csf1r, Cx3cr1, Itgam (CD11b), Cd68, Tlr2, Itgb2, and various Fc receptors) are part of the “sensome”, which is a large group of molecules and receptors at the cell surface involved in microglia sensing environmental perturbations, as in damage or disease (Hickman et al., 2013). Some sensome-related molecules that were increased by TGFβ1 in our study are commonly down-regulated in AD-associated microglia and DAM (Keren-Shaul et al., 2017; Krasemann et al., 2017); e.g., Csf1r, Cx3cr1, P2ry12, Tgfbr1.
Goals of molecular fingerprinting studies include: selecting and interpreting markers and molecules in animal models of CNS disease; identifying a reliable panel of human markers to help define disease progress and determine whether treatments are effective; and identifying molecular targets to control neuroinflammation. To this end, it is essential to compare human microglia with rodent models; however, there is very little published data comparing human responses to TGFβ1. A recent article raises concerns because a hallmark TGFβ1 response in rodents was not seen in human microglia (Smith et al., 2013). The authors investigated human leukocyte antigen (HLA) molecules, which are human analogs of the MHC II complex. IFNγ increases HLA expression and TGFβ1 blocks this response in rodent microglia; however, in adult human microglia, TGFβ1 (10 ng/ml) was completely ineffective. In future, it will be crucial to compare a wide range of TGFβ1 responses between human and rodent microglia.
Data Availability
The raw data supporting the conclusions of this manuscript will be made available by the authors, without undue reservation, to any qualified researcher.
Author Contributions
The project was mainly conceived and spearheaded by LCS, with important contributions from SL, DL and RW. SL carried out the analyses of ICH tissue, Nanostring, Western blotting and functional studies (morphology, proliferation, apoptosis; Tables 1–4, Figures 1, 2, 8, Supplementary Tables S3, S4). DL and RW conducted all the patch-clamp electrophysiology and analysis (Figures 3–7). LCS and SL wrote the manuscript, with input from DL and RW.
Funding
This work was supported by operating grants to LCS from the Canadian Institutes of Health Research (CIHR; MOP 119578), the Canadian Stroke Network (CSN 1007005), and by the Toronto General/Toronto Western Hospital Foundation.
Conflict of Interest Statement
The authors declare that the research was conducted in the absence of any commercial or financial relationships that could be construed as a potential conflict of interest.
The reviewer RR and handling Editor declared their shared affiliation.
Acknowledgments
We thank Tamjeed Siddiqui, Samireh Ghafouri and Chunxiang Fan for help preparing microglial cells. The Princess Margaret Genomic Centre conducted the NanoString assay.
Footnotes
Supplementary Material
The Supplementary Material for this article can be found online at: https://www.frontiersin.org/articles/10.3389/fncel.2018.00115/full#supplementary-material
References
Abutbul, S., Shapiro, J., Szaingurten-Solodkin, I., Levy, N., Carmy, Y., Baron, R., et al. (2012). TGF-β signaling through SMAD2/3 induces the quiescent microglial phenotype within the CNS environment. Glia 60, 1160–1171. doi: 10.1002/glia.22343
Balut, C. M., Hamilton, K. L., and Devor, D. C. (2012). Trafficking of intermediate (KCa3.1) and small (KCa2.x) conductance, Ca2+-activated K+ channels: a novel target for medicinal chemistry efforts? ChemMedChem 7, 1741–1755. doi: 10.1002/cmdc.201200226
Benjamini, Y., and Yekutieli, D. (2001). The control of the false discovery rate in multiple testing under dependency. Ann. Stat. 29, 1165–1188. doi: 10.1214/aos/1013699998
Blomster, L. V., Strobaek, D., Hougaard, C., Klein, J., Pinborg, L. H., Mikkelsen, J. D., et al. (2016). Quantification of the functional expression of the Ca2+ -activated K+ channel KCa 3.1 on microglia from adult human neocortical tissue. Glia 64, 2065–2078. doi: 10.1002/glia.23040
Boche, D., Perry, V. H., and Nicoll, J. A. (2013). Review: activation patterns of microglia and their identification in the human brain. Neuropathol. Appl. Neurobiol. 39, 3–18. doi: 10.1111/nan.12011
Boucsein, C., Zacharias, R., Farber, K., Pavlovic, S., Hanisch, U. K., and Kettenmann, H. (2003). Purinergic receptors on microglial cells: functional expression in acute brain slices and modulation of microglial activation in vitro. Eur. J. Neurosci. 17, 2267–2276. doi: 10.1046/j.1460-9568.2003.02663.x
Bouhy, D., Ghasemlou, N., Lively, S., Redensek, A., Rathore, K. I., Schlichter, L. C., et al. (2011). Inhibition of the Ca2+-dependent K+ channel, KCNN4/KCa3.1, improves tissue protection and locomotor recovery after spinal cord injury. J. Neurosci. 31, 16298–16308. doi: 10.1523/JNEUROSCI.0047-11.2011
Butovsky, O., Jedrychowski, M. P., Moore, C. S., Cialic, R., Lanser, A. J., Gabriely, G., et al. (2014). Identification of a unique TGF-β-dependent molecular and functional signature in microglia. Nat. Neurosci. 17, 131–143. doi: 10.1038/nn.3599
Cayabyab, F. S., Khanna, R., Jones, O. T., and Schlichter, L. C. (2000). Suppression of the rat microglia Kv1.3 current by src-family tyrosine kinases and oxygen/glucose deprivation. Eur. J. Neurosci. 12, 1949–1960. doi: 10.1046/j.1460-9568.2000.00083.x
Charolidi, N., Schilling, T., and Eder, C. (2015). Microglial Kv1.3 channels and P2Y12 receptors differentially regulate cytokine and chemokine release from brain slices of young adult and aged mice. PLoS One 10:e0128463. doi: 10.1371/journal.pone.0128463
Chen, X., Liu, Z., Cao, B. B., Qiu, Y. H., and Peng, Y. P. (2017). TGF-β1 neuroprotection via inhibition of microglial activation in a rat model of Parkinson’s disease. J. Neuroimmune Pharmacol. 12, 433–446. doi: 10.1007/s11481-017-9732-y
Chen, Y. J., Nguyen, H. M., Maezawa, I., Grössinger, E. M., Garing, A. L., Köhler, R., et al. (2016). The potassium channel KCa3.1 constitutes a pharmacological target for neuroinflammation associated with ischemia/reperfusion stroke. J. Cereb. Blood Flow Metab. 36, 2146–2161. doi: 10.1177/0271678X15611434
Cherry, J. D., Olschowka, J. A., and O’Banion, M. K. (2014). Neuroinflammation and M2 microglia: the good, the bad and the inflamed. J. Neuroinflammation 11:98. doi: 10.1186/1742-2094-11-98
Chung, S., Joe, E., Soh, H., Lee, M. Y., and Bang, H. W. (1998). Delayed rectifier potassium currents induced in activated rat microglia set the resting membrane potential. Neurosci. Lett. 242, 73–76. doi: 10.1016/s0304-3940(98)00029-9
Chung, S., Jung, W., and Lee, M. Y. (1999). Inward and outward rectifying potassium currents set membrane potentials in activated rat microglia. Neurosci. Lett. 262, 121–124. doi: 10.1016/s0304-3940(99)00053-1
Coleman, N., Brown, B. M., Oliván-Viguera, A., Singh, V., Olmstead, M. M., Valero, M. S., et al. (2014). New positive Ca2+-activated K+ channel gating modulators with selectivity for KCa3.1. Mol. Pharmacol. 86, 342–357. doi: 10.1124/mol.114.093286
Colton, C. A. (2009). Heterogeneity of microglial activation in the innate immune response in the brain. J. Neuroimmune Pharmacol. 4, 399–418. doi: 10.1007/s11481-009-9164-4
Colton, C., and Wilcock, D. M. (2010). Assessing activation states in microglia. CNS Neurol. Disord. Drug Targets 9, 174–191. doi: 10.2174/187152710791012053
Constam, D. B., Philipp, J., Malipiero, U. V., ten Dijke, P., Schachner, M., and Fontana, A. (1992). Differential expression of transforming growth factor-β 1, -β 2, and -β 3 by glioblastoma cells, astrocytes, and microglia. J. Immunol. 148, 1404–1410.
Dale, E., Staal, R. G., Eder, C., and Moller, T. (2016). KCa3.1-a microglial target ready for drug repurposing? Glia 64, 1733–1741. doi: 10.1002/glia.22992
Das, A., Kim, S. H., Arifuzzaman, S., Yoon, T., Chai, J. C., Lee, Y. S., et al. (2016). Transcriptome sequencing reveals that LPS-triggered transcriptional responses in established microglia BV2 cell lines are poorly representative of primary microglia. J. Neuroinflammation 13:182. doi: 10.1186/s12974-016-0644-1
De Groot, C. J., Montagne, L., Barten, A. D., Sminia, P., and Van Der Valk, P. (1999). Expression of transforming growth factor (TGF)-β1, -β2, and -β3 isoforms and TGF-β type I and type II receptors in multiple sclerosis lesions and human adult astrocyte cultures. J. Neuropathol. Exp. Neurol. 58, 174–187. doi: 10.1097/00005072-199902000-00007
De Simone, R., Ajmone-Cat, M. A., and Minghetti, L. (2004). Atypical antiinflammatory activation of microglia induced by apoptotic neurons: possible role of phosphatidylserine-phosphatidylserine receptor interaction. Mol. Neurobiol. 29, 197–212. doi: 10.1385/mn:29:2:197
DeCoursey, T. E. (2013). Voltage-gated proton channels: molecular biology, physiology, and pathophysiology of the HV family. Physiol. Rev. 93, 599–652. doi: 10.1152/physrev.00011.2012
Dobolyi, A., Vincze, C., Pál, G., and Lovas, G. (2012). The neuroprotective functions of transforming growth factor β proteins. Int. J. Mol. Sci. 13, 8219–8258. doi: 10.3390/ijms13078219
Draheim, H. J., Prinz, M., Weber, J. R., Weiser, T., Kettenmann, H., and Hanisch, U. K. (1999). Induction of potassium channels in mouse brain microglia: cells acquire responsiveness to pneumococcal cell wall components during late development. Neuroscience 89, 1379–1390. doi: 10.1016/s0306-4522(98)00407-2
Du, Y., Deng, W., Wang, Z., Ning, M., Zhang, W., Zhou, Y., et al. (2017). Differential subnetwork of chemokines/cytokines in human, mouse, and rat brain cells after oxygen-glucose deprivation. J. Cereb. Blood Flow Metab. 37, 1425–1434. doi: 10.1177/0271678x16656199
Eder, C., Klee, R., and Heinemann, U. (1997). Pharmacological properties of Ca2+-activated K+ currents of ramified murine brain macrophages. Naunyn Schmiedebergs Arch. Pharmacol. 356, 233–239. doi: 10.1007/pl00005046
El-Benna, J., Dang, P. M., Gougerot-Pocidalo, M. A., Marie, J. C., and Braut-Boucher, F. (2009). p47phox, the phagocyte NADPH oxidase/NOX2 organizer: structure, phosphorylation and implication in diseases. Exp. Mol. Med. 41, 217–225. doi: 10.3858/emm.2009.41.4.058
Fanger, C. M., Ghanshani, S., Logsdon, N. J., Rauer, H., Kalman, K., Zhou, J., et al. (1999). Calmodulin mediates calcium-dependent activation of the intermediate conductance KCa channel, IKCa1. J. Biol. Chem. 274, 5746–5754. doi: 10.1074/jbc.274.9.5746
Färber, K., and Kettenmann, H. (2006). Purinergic signaling and microglia. Pflugers Arch. 452, 615–621. doi: 10.1007/s00424-006-0064-7
Ferreira, R., Lively, S., and Schlichter, L. C. (2014). IL-4 type 1 receptor signaling up-regulates KCNN4 expression and increases the KCa3.1 current and its contribution to migration of alternative-activated microglia. Front. Cell. Neurosci. 8:183. doi: 10.3389/fncel.2014.00183
Ferreira, R., and Schlichter, L. C. (2013). Selective activation of KCa3.1 and CRAC channels by P2Y2 receptors promotes Ca2+ signaling, store refilling and migration of rat microglial cells. PLoS One 8:e62345. doi: 10.1371/journal.pone.0062345
Ferreira, R., Wong, R., and Schlichter, L. C. (2015). KCa3.1/IK1 channel regulation by cGMP-dependent protein kinase (PKG) via reactive oxygen species and CaMKII in microglia: an immune modulating feedback system? Front. Immunol. 6:153. doi: 10.3389/fimmu.2015.00153
Feske, S., Wulff, H., and Skolnik, E. Y. (2015). Ion channels in innate and adaptive immunity. Annu. Rev. Immunol. 33, 291–353. doi: 10.1146/annurev-immunol-032414-112212
Fischer, H. G., Eder, C., Hadding, U., and Heinemann, U. (1995). Cytokine-dependent K+ channel profile of microglia at immunologically defined functional states. Neuroscience 64, 183–191. doi: 10.1016/0306-4522(94)00398-o
Fordyce, C. B., Jagasia, R., Zhu, X., and Schlichter, L. C. (2005). Microglia Kv1.3 channels contribute to their ability to kill neurons. J. Neurosci. 25, 7139–7149. doi: 10.1523/JNEUROSCI.1251-05.2005
Franchini, L., Levi, G., and Visentin, S. (2004). Inwardly rectifying K+ channels influence Ca2+ entry due to nucleotide receptor activation in microglia. Cell Calcium 35, 449–459. doi: 10.1016/j.ceca.2003.11.001
Gautier, E. L., Shay, T., Miller, J., Greter, M., Jakubzick, C., Ivanov, S., et al. (2012). Gene-expression profiles and transcriptional regulatory pathways that underlie the identity and diversity of mouse tissue macrophages. Nat. Immunol. 13, 1118–1128. doi: 10.1038/ni.2419
Gosselin, D., Link, V. M., Romanoski, C. E., Fonseca, G. J., Eichenfield, D. Z., Spann, N. J., et al. (2014). Environment drives selection and function of enhancers controlling tissue-specific macrophage identities. Cell 159, 1327–1340. doi: 10.1016/j.cell.2014.11.023
Grissmer, S., Nguyen, A. N., Aiyar, J., Hanson, D. C., Mather, R. J., Gutman, G. A., et al. (1994). Pharmacological characterization of five cloned voltage-gated K+ channels, types Kv1.1, 1.2, 1.3, 1.5, and 3.1, stably expressed in mammalian cell lines. Mol. Pharmacol. 45, 1227–1234.
Hailer, N. P., Heppner, F. L., Haas, D., and Nitsch, R. (1998). Astrocytic factors deactivate antigen presenting cells that invade the central nervous system. Brain Pathol. 8, 459–474. doi: 10.1111/j.1750-3639.1998.tb00168.x
Heo, D. K., Lim, H. M., Nam, J. H., Lee, M. G., and Kim, J. Y. (2015). Regulation of phagocytosis and cytokine secretion by store-operated calcium entry in primary isolated murine microglia. Cell. Signal. 27, 177–186. doi: 10.1016/j.cellsig.2014.11.003
Herrera-Molina, R., and von Bernhardi, R. (2005). Transforming growth factor-β 1 produced by hippocampal cells modulates microglial reactivity in culture. Neurobiol. Dis. 19, 229–236. doi: 10.1016/j.nbd.2005.01.003
Hickman, S. E., Kingery, N. D., Ohsumi, T. K., Borowsky, M. L., Wang, L. C., Means, T. K., et al. (2013). The microglial sensome revealed by direct RNA sequencing. Nat. Neurosci. 16, 1896–1905. doi: 10.1038/nn.3554
Illes, P., Nörenberg, W., and Gebicke-Haerter, P. J. (1996). Molecular mechanisms of microglial activation. B. Voltage- and purinoceptor-operated channels in microglia. Neurochem. Int. 29, 13–24.
Jiang, X., Newell, E. W., and Schlichter, L. C. (2003). Regulation of a TRPM7-like current in rat brain microglia. J. Biol. Chem. 278, 42867–42876. doi: 10.1074/jbc.M304487200
Jones, L. L., Kreutzberg, G. W., and Raivich, G. (1998). Transforming growth factor β’s 1, 2 and 3 inhibit proliferation of ramified microglia on an astrocyte monolayer. Brain Res. 795, 301–306. doi: 10.1016/s0006-8993(98)00325-4
Joseph, M. J., Caliaperumal, J., and Schlichter, L. C. (2016). After intracerebral hemorrhage, oligodendrocyte precursors proliferate and differentiate inside white-matter tracts in the rat striatum. Transl. Stroke Res. 7, 192–208. doi: 10.1007/s12975-015-0445-3
Jugloff, D. G., Khanna, R., Schlichter, L. C., and Jones, O. T. (2000). Internalization of the Kv1.4 potassium channel is suppressed by clustering interactions with PSD-95. J. Biol. Chem. 275, 1357–1364. doi: 10.1074/jbc.275.2.1357
Kaushal, V., Koeberle, P. D., Wang, Y., and Schlichter, L. C. (2007). The Ca2+-activated K+ channel KCNN4/KCa3.1 contributes to microglia activation and nitric oxide-dependent neurodegeneration. J. Neurosci. 27, 234–244. doi: 10.1523/JNEUROSCI.3593-06.2007
Keren-Shaul, H., Spinrad, A., Weiner, A., Matcovitch-Natan, O., Dvir-Szternfeld, R., Ulland, T. K., et al. (2017). A unique microglia type associated with restricting development of Alzheimer’s disease. Cell 169, 1276.e17–1290.e17. doi: 10.1016/j.cell.2017.05.018
Kettenmann, H., Hanisch, U. K., Noda, M., and Verkhratsky, A. (2011). Physiology of microglia. Physiol. Rev. 91, 461–553. doi: 10.1152/physrev.00011.2010
Kettenmann, H., Hoppe, D., Gottmann, K., Banati, R., and Kreutzberg, G. (1990). Cultured microglial cells have a distinct pattern of membrane channels different from peritoneal macrophages. J. Neurosci. Res. 26, 278–287. doi: 10.1002/jnr.490260303
Khanna, R., Chang, M. C., Joiner, W. J., Kaczmarek, L. K., and Schlichter, L. C. (1999). hSK4/hIK1, a calmodulin-binding KCa channel in human T lymphocytes. Roles in proliferation and volume regulation. J. Biol. Chem. 274, 14838–14849. doi: 10.1074/jbc.274.21.14838
Khanna, R., Roy, L., Zhu, X., and Schlichter, L. C. (2001). K+ channels and the microglial respiratory burst. Am. J. Physiol. Cell Physiol. 280, C796–C806. doi: 10.1152/ajpcell.2001.280.4.c796
Kim, W. K., Hwang, S. Y., Oh, E. S., Piao, H. Z., Kim, K. W., and Han, I. O. (2004). TGF-β1 represses activation and resultant death of microglia via inhibition of phosphatidylinositol 3-kinase activity. J. Immunol. 172, 7015–7023. doi: 10.4049/jimmunol.172.11.7015
Korotzer, A. R., and Cotman, C. W. (1992). Voltage-gated currents expressed by rat microglia in culture. Glia 6, 81–88. doi: 10.1002/glia.440060202
Kotecha, S. A., and Schlichter, L. C. (1999). A Kv1.5 to Kv1.3 switch in endogenous hippocampal microglia and a role in proliferation. J. Neurosci. 19, 10680–10693.
Krasemann, S., Madore, C., Cialic, R., Baufeld, C., Calcagno, N., El Fatimy, R., et al. (2017). The TREM2-APOE pathway drives the transcriptional phenotype of dysfunctional microglia in neurodegenerative diseases. Immunity 47, 566.e9–581.e9. doi: 10.1016/j.immuni.2017.08.008
Lam, D., Lively, S., and Schlichter, L. C. (2017). Responses of rat and mouse primary microglia to pro- and anti-inflammatory stimuli: molecular profiles, K+ channels and migration. J. Neuroinflammation 14:166. doi: 10.1186/s12974-017-0941-3
Lam, D., and Schlichter, L. C. (2015). Expression and contributions of the Kir2.1 inward-rectifier K+ channel to proliferation, migration and chemotaxis of microglia in unstimulated and anti-inflammatory states. Front. Cell. Neurosci. 9:185. doi: 10.3389/fncel.2015.00185
Le, Y., Iribarren, P., Gong, W., Cui, Y., Zhang, X., and Wang, J. M. (2004). TGF-β1 disrupts endotoxin signaling in microglial cells through Smad3 and MAPK pathways. J. Immunol. 173, 962–968. doi: 10.4049/jimmunol.173.2.962
Ledeboer, A., Breve, J. J., Poole, S., Tilders, F. J., and Van Dam, A. M. (2000). Interleukin-10, interleukin-4, and transforming growth factor-β differentially regulate lipopolysaccharide-induced production of pro-inflammatory cytokines and nitric oxide in co-cultures of rat astroglial and microglial cells. Glia 30, 134–142. doi: 10.1002/(sici)1098-1136(200004)30:2<134::aid-glia3>3.0.co;2-3
Lee, Y. J., Han, Y., Lu, H. T., Nguyen, V., Qin, H., Howe, P. H., et al. (1997). TGF-β suppresses IFN-γ induction of class II MHC gene expression by inhibiting class II transactivator messenger RNA expression. J. Immunol. 158, 2065–2075.
Lehrmann, E., Kiefer, R., Christensen, T., Toyka, K. V., Zimmer, J., Diemer, N. H., et al. (1998). Microglia and macrophages are major sources of locally produced transforming growth factor-β1 after transient middle cerebral artery occlusion in rats. Glia 24, 437–448. doi: 10.1002/(sici)1098-1136(199812)24:4<437::aid-glia9>3.0.co;2-x
Li, F., Lu, J., Wu, C. Y., Kaur, C., Sivakumar, V., Sun, J., et al. (2008). Expression of Kv1.2 in microglia and its putative roles in modulating production of proinflammatory cytokines and reactive oxygen species. J. Neurochem. 106, 2093–2105. doi: 10.1111/j.1471-4159.2008.05559.x
Liu, B. S., Ferreira, R., Lively, S., and Schlichter, L. C. (2013). Microglial SK3 and SK4 currents and activation state are modulated by the neuroprotective drug, riluzole. J. Neuroimmune Pharmacol. 8, 227–237. doi: 10.1007/s11481-012-9365-0
Liu, J., Xu, C., Chen, L., Xu, P., and Xiong, H. (2012). Involvement of Kv1.3 and p38 MAPK signaling in HIV-1 glycoprotein 120-induced microglia neurotoxicity. Cell Death Dis. 3:e254. doi: 10.1038/cddis.2011.140
Lively, S., Hutchings, S., and Schlichter, L. C. (2016). Molecular and cellular responses to interleukin-4 treatment in a rat model of transient ischemia. J. Neuropathol. Exp. Neurol. 75, 1058–1071. doi: 10.1093/jnen/nlw081
Lively, S., and Schlichter, L. C. (2012). Age-related comparisons of evolution of the inflammatory response after intracerebral hemorrhage in rats. Transl. Stroke Res. 3, 132–146. doi: 10.1007/s12975-012-0151-3
Lively, S., and Schlichter, L. C. (2013). The microglial activation state regulates migration and roles of matrix-dissolving enzymes for invasion. J. Neuroinflammation 10:75. doi: 10.1186/1742-2094-10-75
Lodge, P. A., and Sriram, S. (1996). Regulation of microglial activation by TGF-β, IL-10, and CSF-1. J. Leukoc. Biol. 60, 502–508. doi: 10.1002/jlb.60.4.502
Loughlin, A. J., Woodroofe, M. N., and Cuzner, M. L. (1993). Modulation of interferon-γ-induced major histocompatibility complex class II and Fc receptor expression on isolated microglia by transforming growth factor-β 1, interleukin-4, noradrenaline and glucocorticoids. Immunology 79, 125–130.
Maezawa, I., Jenkins, D. P., Jin, B. E., and Wulff, H. (2012). Microglial KCa3.1 channels as a potential therapeutic target for Alzheimer’s disease. Int. J. Alzheimers Dis. 2012:868972. doi: 10.1155/2012/868972
Maezawa, I., Zimin, P. I., Wulff, H., and Jin, L. W. (2011). Amyloid-β protein oligomer at low nanomolar concentrations activates microglia and induces microglial neurotoxicity. J. Biol. Chem. 286, 3693–3706. doi: 10.1074/jbc.M110.135244
Mantovani, A., Sica, A., Sozzani, S., Allavena, P., Vecchi, A., and Locati, M. (2004). The chemokine system in diverse forms of macrophage activation and polarization. Trends Immunol. 25, 677–686. doi: 10.1016/j.it.2004.09.015
Merrill, J. E., and Zimmerman, R. P. (1991). Natural and induced cytotoxicity of oligodendrocytes by microglia is inhibitable by TGF β. Glia 4, 327–331. doi: 10.1002/glia.440040311
Michaelis, M., Nieswandt, B., Stegner, D., Eilers, J., and Kraft, R. (2015). STIM1, STIM2, and Orai1 regulate store-operated calcium entry and purinergic activation of microglia. Glia 63, 652–663. doi: 10.1002/glia.22775
Minghetti, L., Ajmone-Cat, M. A., De Berardinis, M. A., and De Simone, R. (2005). Microglial activation in chronic neurodegenerative diseases: roles of apoptotic neurons and chronic stimulation. Brain Res. Rev. 48, 251–256. doi: 10.1016/j.brainresrev.2004.12.015
Moxon-Emre, I., and Schlichter, L. C. (2011). Neutrophil depletion reduces blood-brain barrier breakdown, axon injury, and inflammation after intracerebral hemorrhage. J. Neuropathol. Exp. Neurol. 70, 218–235. doi: 10.1097/NEN.0b013e31820d94a5
Naiki, Y., Michelsen, K. S., Zhang, W., Chen, S., Doherty, T. M., and Arditi, M. (2005). Transforming growth factor-β differentially inhibits MyD88-dependent, but not TRAM- and TRIF-dependent, lipopolysaccharide-induced TLR4 signaling. J. Biol. Chem. 280, 5491–5495. doi: 10.1074/jbc.c400503200
Newell, E. W., and Schlichter, L. C. (2005). Integration of K+ and Cl- currents regulate steady-state and dynamic membrane potentials in cultured rat microglia. J. Physiol. 567, 869–890. doi: 10.1113/jphysiol.2005.092056
Nguyen, H. M., Blomster, L. V., Christophersen, P., and Wulff, H. (2017a). Potassium channel expression and function in microglia: plasticity and possible species variations. Channels 11, 305–315. doi: 10.1080/19336950.2017.1300738
Nguyen, H. M., Grossinger, E. M., Horiuchi, M., Davis, K. W., Jin, L. W., Maezawa, I., et al. (2017b). Differential Kv1.3, KCa3.1, and Kir2.1 expression in “classically” and “alternatively” activated microglia. Glia 65, 106–121. doi: 10.1002/glia.23078
Nörenberg, W., Gebicke-Haerter, P. J., and Illes, P. (1992). Inflammatory stimuli induce a new K+ outward current in cultured rat microglia. Neurosci. Lett. 147, 171–174. doi: 10.1016/0304-3940(92)90587-w
Nörenberg, W., Gebicke-Haerter, P. J., and Illes, P. (1994). Voltage-dependent potassium channels in activated rat microglia. J. Physiol. 475, 15–32. doi: 10.1113/jphysiol.1994.sp020046
Nutile-McMenemy, N., Elfenbein, A., and Deleo, J. A. (2007). Minocycline decreases in vitro microglial motility, β1-integrin, and Kv1.3 channel expression. J. Neurochem. 103, 2035–2046. doi: 10.1111/j.1471-4159.2007.04889.x
Ohana, L., Newell, E. W., Stanley, E. F., and Schlichter, L. C. (2009). The Ca2+ release-activated Ca2+ current (ICRAC) mediates store-operated Ca2+ entry in rat microglia. Channels 3, 129–139. doi: 10.4161/chan.3.2.8609
O’Keefe, G. M., Nguyen, V. T., and Benveniste, E. N. (1999). Class II transactivator and class II MHC gene expression in microglia: modulation by the cytokines TGF-β, IL-4, IL-13 and IL-10. Eur. J. Immunol. 29, 1275–1285. doi: 10.1002/(sici)1521-4141(199904)29:04<1275::aid-immu1275>3.0.co;2-t
Orihuela, R., McPherson, C. A., and Harry, G. J. (2016). Microglial M1/M2 polarization and metabolic states. Br. J. Pharmacol. 173, 649–665. doi: 10.1111/bph.13139
Orre, M., Kamphuis, W., Osborn, L. M., Melief, J., Kooijman, L., Huitinga, I., et al. (2014). Acute isolation and transcriptome characterization of cortical astrocytes and microglia from young and aged mice. Neurobiol. Aging 35, 1–14. doi: 10.1016/j.neurobiolaging.2013.07.008
Pál, G., Lovas, G., and Dobolyi, A. (2014). Induction of transforming growth factor Beta receptors following focal ischemia in the rat brain. PLoS One 9:e106544. doi: 10.1371/journal.pone.0106544
Pannasch, U., Färber, K., Nolte, C., Blonski, M., Yan Chiu, S., Messing, A., et al. (2006). The potassium channels Kv1.5 and Kv1.3 modulate distinct functions of microglia. Mol. Cell. Neurosci. 33, 401–411. doi: 10.1016/j.mcn.2006.08.009
Patrizio, M., and Levi, G. (1994). Glutamate production by cultured microglia: differences between rat and mouse, enhancement by lipopolysaccharide and lack effect of HIV coat protein gp120 and depolarizing agents. Neurosci. Lett. 178, 184–189. doi: 10.1016/0304-3940(94)90755-2
Prinz, M., Kann, O., Draheim, H. J., Schumann, R. R., Kettenmann, H., Weber, J. R., et al. (1999). Microglial activation by components of gram-positive and -negative bacteria: distinct and common routes to the induction of ion channels and cytokines. J. Neuropathol. Exp. Neurol. 58, 1078–1089. doi: 10.1097/00005072-199910000-00006
Ramsey, I. S., Ruchti, E., Kaczmarek, J. S., and Clapham, D. E. (2009). Hv1 proton channels are required for high-level NADPH oxidase-dependent superoxide production during the phagocyte respiratory burst. Proc. Natl. Acad. Sci. U S A 106, 7642–7647. doi: 10.1073/pnas.0902761106
Schilling, T., and Eder, C. (2003). Effects of kinase inhibitors on TGF-β induced upregulation of Kv1.3 K+ channels in brain macrophages. Pflugers Arch. 447, 312–315. doi: 10.1007/s00424-003-1155-3
Schilling, T., and Eder, C. (2007). Ion channel expression in resting and activated microglia of hippocampal slices from juvenile mice. Brain Res. 1186, 21–28. doi: 10.1016/j.brainres.2007.10.027
Schilling, T., Quandt, F. N., Cherny, V. V., Zhou, W., Heinemann, U., DeCoursey, T. E., et al. (2000). Upregulation of Kv1.3 K+ channels in microglia deactivated by TGF-β. Am. J. Physiol. Cell Physiol. 279, C1123–C1134. doi: 10.1152/ajpcell.2000.279.4.C1123
Schilling, T., Repp, H., Richter, H., Koschinski, A., Heinemann, U., Dreyer, F., et al. (2002). Lysophospholipids induce membrane hyperpolarization in microglia by activation of IKCa1 Ca2+-dependent K+ channels. Neuroscience 109, 827–835. doi: 10.1016/s0306-4522(01)00534-6
Schlichter, L. C., Sakellaropoulos, G., Ballyk, B., Pennefather, P. S., and Phipps, D. J. (1996). Properties of K+ and Cl- channels and their involvement in proliferation of rat microglial cells. Glia 17, 225–236. doi: 10.1002/(sici)1098-1136(199607)17:3<225::aid-glia5>3.0.co;2-#
Siddiqui, T., Lively, S., Ferreira, R., Wong, R., and Schlichter, L. C. (2014). Expression and contributions of TRPM7 and KCa2.3/SK3 channels to the increased migration and invasion of microglia in anti-inflammatory activation states. PLoS One 9:e106087. doi: 10.1371/journal.pone.0106087
Siddiqui, T. A., Lively, S., and Schlichter, L. C. (2016). Complex molecular and functional outcomes of single versus sequential cytokine stimulation of rat microglia. J. Neuroinflammation 13:66. doi: 10.1186/s12974-016-0531-9
Siddiqui, T. A., Lively, S., Vincent, C., and Schlichter, L. C. (2012). Regulation of podosome formation, microglial migration and invasion by Ca2+-signaling molecules expressed in podosomes. J. Neuroinflammation 9:250. doi: 10.1186/1742-2094-9-250
Sivagnanam, V., Zhu, X., and Schlichter, L. C. (2010). Dominance of E. coli phagocytosis over LPS in the inflammatory response of microglia. J. Neuroimmunol 227, 111–119. doi: 10.1016/j.jneuroim.2010.06.021
Smith, A. M., Graham, E. S., Feng, S. X., Oldfield, R. L., Bergin, P. M., Mee, E. W., et al. (2013). Adult human glia, pericytes and meningeal fibroblasts respond similarly to IFNy but not to TGFβ1 or M-CSF. Cytotherapy 8:e80463. doi: 10.1371/journal.pone.0080463
Spittau, B., Wullkopf, L., Zhou, X., Rilka, J., Pfeifer, D., and Krieglstein, K. (2013). Endogenous transforming growth factor-β promotes quiescence of primary microglia in vitro. Glia 61, 287–300. doi: 10.1002/glia.22435
Stebbing, M. J., Cottee, J. M., and Rana, I. (2015). The role of ion channels in microglial activation and proliferation—a complex interplay between ligand-gated ion channels, K+ channels, and intracellular Ca2+. Front. Immunol. 6:497. doi: 10.3389/fimmu.2015.00497
Suzumura, A., Sawada, M., Yamamoto, H., and Marunouchi, T. (1993). Transforming growth factor-β suppresses activation and proliferation of microglia in vitro. J. Immunol. 151, 2150–2158.
Taylor, R. A., Chang, C. F., Goods, B. A., Hammond, M. D., Mac Grory, B., Ai, Y., et al. (2017). TGF-β1 modulates microglial phenotype and promotes recovery after intracerebral hemorrhage. J. Clin. Invest. 127, 280–292. doi: 10.1172/JCI88647
Villacampa, N., Almolda, B., Vilella, A., Campbell, I. L., Gonzalez, B., and Castellano, B. (2015). Astrocyte-targeted production of IL-10 induces changes in microglial reactivity and reduces motor neuron death after facial nerve axotomy. Glia 63, 1166–1184. doi: 10.1002/glia.22807
Visentin, S., Agresti, C., Patrizio, M., and Levi, G. (1995). Ion channels in rat microglia and their different sensitivity to lipopolysaccharide and interferon-γ. J. Neurosci. Res. 42, 439–451. doi: 10.1002/jnr.490420402
Wasserman, J. K., and Schlichter, L. C. (2007). Neuron death and inflammation in a rat model of intracerebral hemorrhage: effects of delayed minocycline treatment. Brain Res. 1136, 208–218. doi: 10.1016/j.brainres.2006.12.035
Wasserman, J. K., Zhu, X., and Schlichter, L. C. (2007). Evolution of the inflammatory response in the brain following intracerebral hemorrhage and effects of delayed minocycline treatment. Brain Res. 1180, 150–154. doi: 10.1016/j.brainres.2007.08.058
Welinder, C., and Ekblad, L. (2011). Coomassie staining as loading control in Western blot analysis. J. Proteome Res. 10, 1416–1419. doi: 10.1021/pr1011476
Wiessner, C., Gehrmann, J., Lindholm, D., Töpper, R., Kreutzberg, G. W., and Hossmann, K. A. (1993). Expression of transforming growth factor-β 1 and interleukin-1 β mRNA in rat brain following transient forebrain ischemia. Acta Neuropathol. 86, 439–446. doi: 10.1007/BF00228578
Wong, R., and Schlichter, L. C. (2014). PKA reduces the rat and human KCa3.1 current, CaM binding, and Ca2+ signaling, which requires Ser332/334 in the CaM-binding C terminus. J. Neurosci. 34, 13371–13383. doi: 10.1523/JNEUROSCI.1008-14.2014
Wulff, H., and Castle, N. A. (2010). Therapeutic potential of KCa3.1 blockers: recent advances and promising trends. Expert Rev. Clin. Pharmacol. 3, 385–396. doi: 10.1586/ecp.10.11
Xiao, B. G., Bai, X. F., Zhang, G. X., and Link, H. (1997). Transforming growth factor-β1 induces apoptosis of rat microglia without relation to bcl-2 oncoprotein expression. Neurosci. Lett. 226, 71–74. doi: 10.1016/s0304-3940(97)00234-6
Xia, Y., Tsai, A. L., Berka, V., and Zweier, J. L. (1998). Superoxide generation from endothelial nitric-oxide synthase. A Ca2+/calmodulin-dependent and tetrahydrobiopterin regulatory process. J. Biol. Chem. 273, 25804–25808. doi: 10.1074/jbc.273.40.25804
Zhang, Y., Chen, K., Sloan, S. A., Bennett, M. L., Scholze, A. R., O’Keeffe, S., et al. (2014). An RNA-sequencing transcriptome and splicing database of glia, neurons, and vascular cells of the cerebral cortex. J. Neurosci. 34, 11929–11947. doi: 10.1523/JNEUROSCI.1860-14.2014
Keywords: microglia, rat, mouse, TGFβ1, potassium channels, transcription profiling, microglial activation, anti-inflammatory
Citation: Lively S, Lam D, Wong R and Schlichter LC (2018) Comparing Effects of Transforming Growth Factor β1 on Microglia From Rat and Mouse: Transcriptional Profiles and Potassium Channels. Front. Cell. Neurosci. 12:115. doi: 10.3389/fncel.2018.00115
Received: 29 January 2018; Accepted: 11 April 2018;
Published: 03 May 2018.
Edited by:
Rocío Martínez De Pablos, Universidad de Sevilla, SpainReviewed by:
Björn Spittau, Universitätsmedizin Rostock, GermanyRocío Ruiz, Universidad de Sevilla, Spain
Copyright © 2018 Lively, Lam, Wong and Schlichter. This is an open-access article distributed under the terms of the Creative Commons Attribution License (CC BY). The use, distribution or reproduction in other forums is permitted, provided the original author(s) and the copyright owner are credited and that the original publication in this journal is cited, in accordance with accepted academic practice. No use, distribution or reproduction is permitted which does not comply with these terms.
*Correspondence: Lyanne C. Schlichter, bHlhbm5lLnNjaGxpY2h0ZXJAdWhucmVzZWFyY2guY2E=
† Present address: Doris Lam, Physical and Life Sciences Directorate, Lawrence Livermore National Laboratory, Livermore, CA, United States