 Claas Halfmann
 Thomas Rüland1,2,3
 Kevin Jehasse
 Björn M. Kampa
- 1Systems Neurophysiology, Institute of Zoology, RWTH Aachen University, Aachen, Germany
- 2Molecular and Cellular Physiology, Institute of Biological Information Processing (IBI-1), Forschungszentrum Jülich GmbH, Jülich, Germany
- 3Research Training Group 2416 MultiSenses-MultiScales, RWTH Aachen University, Aachen, Germany
- 4Research Training Group 2610 Innoretvision, RWTH Aachen University, Aachen, Germany
- 5JARA BRAIN, Institute of Neuroscience and Medicine (INM-10), Forschungszentrum Jülich, Jülich, Germany
Retinal degeneration is one of the main causes of visual impairment and blindness. One group of retinal degenerative diseases, leading to the loss of photoreceptors, is collectively termed retinitis pigmentosa. In this group of diseases, the remaining retina is largely spared from initial cell death making retinal ganglion cells an interesting target for vision restoration methods. However, it is unknown how downstream brain areas, in particular the visual cortex, are affected by the progression of blindness. Visual deprivation studies have shown dramatic changes in the electrophysiological properties of visual cortex neurons, but changes on a cellular level in retinitis pigmentosa have not been investigated yet. Therefore, we used the rd10 mouse model to perform patch-clamp recordings of pyramidal neurons in layer 2/3 of the primary visual cortex to screen for potential changes in electrophysiological properties resulting from retinal degeneration. Compared to wild-type C57BL/6 mice, we only found an increase in intrinsic excitability around the time point of maximal retinal degeneration. In addition, we saw an increase in the current amplitude of spontaneous putative inhibitory events after a longer progression of retinal degeneration. However, we did not observe a long-lasting shift in excitability after prolonged retinal degeneration. Together, our results provide evidence of an intact visual cortex with promising potential for future therapeutic strategies to restore vision.
1. Introduction
Retinitis pigmentosa (RP) is a group of retinal degenerative diseases responsible for the loss of photoreceptor cells, due to genetic mutations altering cellular signaling cascades (Hartong et al., 2006; Newton and Megaw, 2020). Yet retinal ganglion cells, which generate the output of the retina to the brain, remain intact for an extended time after disease onset. This initial resilience is rendering retinal ganglion cells a prime target for vision restoration methods. Several therapeutic approaches, such as optogenetic, pharmacological, or electrical stimulation, were used in animal models of retinitis pigmentosa to elicit activity in retinal and downstream circuits to restore vision or delay retinal degeneration (Aghaizu et al., 2017; Dias et al., 2018; Ayton et al., 2020; Farnum and Pelled, 2020; Kleinlogel et al., 2020; Prosseda et al., 2022). In human patients, electrical stimulation of retinal ganglion cells via retinal implants is able to elicit reliable responses in the visual cortex of RP patients, but the perception is usually restricted to light flashes or phosphenes (Humayun et al., 2012; Keserü et al., 2012; Yue et al., 2021; Wang et al., 2022). One reason for the limited success of these approaches, in addition to retinal changes, might be found in an altered visual system that has already undergone homeostatic changes due to the lack of visual input (Bhattacharyya, 2022; Caravaca-Rodriguez et al., 2022).
Primary visual cortex (V1) activity is susceptible to changes in sensory experience. Such changes are known to trigger modifications of cellular excitability by Hebbian as well as homeostatic plasticity mechanisms (Keck et al., 2017; Turrigiano, 2017). For example, a decrease in excitability is observed in layers 2 and 3 (L2/3) of pyramidal neurons (PNs) with development (Tatti et al., 2017; Ciganok-Hückels et al., 2023), together with an increase in functional inputs from the retina after eye-opening, leading to a refinement of the V1 network (Desai et al., 2002; Lu and Constantine-Paton, 2004; Ishikawa et al., 2014). In addition, visual deprivation experiments showed that the lack of correct visual input, especially around the critical period, leads to changes in rheobase, input resistance, and action potential threshold and shifts in the balance of excitatory and inhibitory inputs (Desai et al., 2002; Maffei and Turrigiano, 2008; Lambo and Turrigiano, 2013; Kannan et al., 2016). Some of these effects are not restricted to the critical period as the induction of homeostatic plasticity is also possible in adult animals (Goel and Lee, 2007; Wen and Turrigiano, 2021). Therefore, retinal activity is crucial to sustain the functional activity of V1. However, when the retina is subject to degeneration, it might also trigger neuronal homeostatic plasticity mechanisms, which could potentially counteract a successful vision restoration approach on a retinal level (Bhattacharyya, 2022; Caravaca-Rodriguez et al., 2022). Despite the great amount of literature on visual deprivation, remarkably little is known about the integrity of the visual cortex in retinitis pigmentosa. Few studies in murine retinitis pigmentosa models have shown a transient alteration in excitation and inhibition balance (Pietra et al., 2021), a reduction of dendritic spine density in L5 PNs (Martinez-Galan et al., 2022), and preserved synaptic plasticity (Begenisic et al., 2020). In addition, mouse models of other retinal degenerative diseases, such as glaucoma, also show adjustments in morphological and electrophysiological properties in areas downstream of the retina (Bhandari et al., 2019; Van Hook et al., 2021; Bhattacharyya, 2022). However, a detailed analysis of the electrophysiological properties of V1 neurons is still missing.
Therefore, we screened the electrophysiological properties of L2/3 PNs in V1 of the rd10 mouse model of retinitis pigmentosa. In this model, the loss of rod photoreceptor cells starts after eye-opening around p18 and peaks around p30 (Chang et al., 2007; Gargini et al., 2007; Rösch et al., 2014). We used patch-clamp recording to compare the passive, active, and network properties of rd10 and wild-type C57BL/6 mice. We recorded before and right after the critical period (Desai et al., 2002; Hooks and Chen, 2007; Espinosa and Stryker, 2012), and in rd10 mice, this intersects with a maximum of degeneration of retinal outer nuclear layer (ONL) cells (Chang et al., 2007; Gargini et al., 2007; Rösch et al., 2014). We also included a later adult stage to test visual cortex physiology after prolonged retinal degeneration and impaired visual input. In juvenile rd10 mice, after the critical period, we observed an increased intrinsic excitability profile within L2/3, but these changes were not permanent. In adult mice, after prolonged retinal degeneration, we only observed a slight increase in the current amplitude of spontaneous putative inhibitory events. Overall, the visual cortex of rd10 mice remained similar to its wild-type counterpart, providing evidence for an intact visual cortex as required for future therapeutic strategies to restore vision.
2. Materials and methods
2.1. Animals
All mice were bred and housed according to standards and guidelines set by the European Directive on the Protection of Animals used for Scientific Purposes (2010/63/EU), the Federation of European Laboratory Animal Science Associations (FELASA), and the German Animal Welfare Act [Tierschutzgesetz (TierSchG), 2006]. Mice of both sexes were killed in accordance with the State Agency for Nature, Environment, and Consumer Protection (LANUV) of the State of North Rhine-Westphalia and supervised by the local animal welfare office (Institute for Laboratory Animal Science, RWTH Aachen). Two strains of mice were used: B6.CXB1-Pde6brd10/J (rd10), from the local animal facility (Institute of Laboratory Animal Science, RWTH Aachen), and C57BL/6J (B6), initially from Charles River Laboratories, as a control group. Rd10 mice harbor a mutation in the gene encoding the beta-subunit of rod cGMP phosphodiesterase-6 (Pde6b), leading to retinal degeneration (Chang et al., 2007; Chang, 2016). Mice were housed under a normal 12-h light/dark cycle with access to food and water ad libitum. Both strains did not receive any enrichment as this might interfere with the severity of retinal degeneration (Barone et al., 2014).
We used three age groups (I, II, and III) to monitor the electrophysiological properties of the visual cortex L2/3 PNs. As our first age group, we chose a time period shortly after eye-opening and before the onset of the critical period for visual experience-dependent development (Hooks and Chen, 2007; Espinosa and Stryker, 2012) as well as retinal degeneration in rd10 mice (Chang et al., 2007) [age group I: pre-critical period p14–p16 (median age of mice in age group I B6: p14, rd10: p15.5; n = 3 and 4 mice, respectively)]. Since eye-opening occurs around p12 to p14 (Hoy and Niell, 2015; Cheng et al., 2022; Ciganok-Hückels et al., 2023), we only included animals that had fully opened eyes. The second age group covered a time period around the end of the critical period, in rd10 mice this intersects with a maximum degeneration of retinal outer nuclear layer (ONL) cells (Chang et al., 2007; Gargini et al., 2007; Rösch et al., 2014) and the start of aberrant retinal activity (Stasheff et al., 2011; Biswas et al., 2014; Rösch et al., 2014) [age group II: post-critical period p29–p42 (median age of mice in age group II B6: p33, n = 21 mice; rd10: p31, n = 28 mice)]. The third age group consisted of a broader range of adult mice in which death of both rod and cone cells, as well as further retinal alterations in the form of oscillation and hyperactivity, occur in rd10 mice (Chang et al., 2007; Gargini et al., 2007; Barhoum et al., 2008; Stasheff et al., 2011; Pennesi et al., 2012; Biswas et al., 2014; Rösch et al., 2014) [age group III: adult p59–p100 (median age of mice in age group III B6: p89, n = 29 mice; rd10: p90, n = 31 mice)]. For sub- and suprathreshold properties, we also included an additional supplementary age group before eye-opening [p10–p11 (median age of mice in age group pre-eye open B6: p11, rd10: p10.5, n = 2 mice for each genotype)]. In this group, we only included animals whose eyelids were completely closed. A detailed overview of the number of mice and recorded cells is provided as Supplementary Tables.
2.2. Acute brain slice preparation
Mice were anesthetized with isoflurane (AbbVie, UK) and killed by decapitation. The brain was quickly submerged in ice-cold slicing-artificial cerebrospinal fluid (aCSF) containing (in mM) 125 NaCl, 2.5 KCl, 1.25 NaH2PO4, 25 NaHCO3, 25 glucose, 6 MgCl2, 1 CaCl2, pH 7.4 (95% O2/5% CO2 and ~310 mOsm/l). Coronal slices (300 μm) were cut with a vibratome (VT1200S, Leica Biosystems, Germany) and then incubated at approximately 34°C for 40–60 min in regular aCSF containing (in mM): 125 NaCl, 2.5 KCl, 1.25 NaH2PO4, 25 NaHCO3, 25 Glucose, 1 MgCl2, 2 CaCl2, pH 7.4 (95% O2/5% CO2 and ~310 mOsm/l), before being stored at room temperature.
2.3. Electrophysiology
2.3.1. Recording conditions
Slices were placed in a recording chamber (Luigs & Neumann, Germany) and continuously superfused with heated (32 ± 1°C) aCSF. The recording chamber was integrated into an upright microscope (LNscope, Luigs & Neumann, Germany). The primary visual cortex was identified by the visual inspection of slices with a 4x air objective (Olympus, Japan) and comparison of gray and white matter shape and borders with respect to reference brain atlantes (Paxinos, Allen Brain Institute). A 40x water immersion objective (Olympus, Japan) with infrared-Dodt (Luigs & Neumann, Germany) gradient contrast to a CMOS camera (Chameleon USB 3.0 monochrome camera, Point Gray-Teledyne FLIR, OR, USA) was used to visualize neurons. L2/3 was identified by distance to pia (100–300 μm), and PNs were selected based on the presence of an apical dendrite in combination with a soma shape. Patch pipettes (4–8 MΩ) were pulled from borosilicate filamented glass (GB150F-10, Scientific Products GmbH, Germany) with a horizontal pipette puller (P-1000, Sutter Instruments, Novato, CA, USA). For all experiments, pipettes were filled with an internal solution containing (in mM): 135 K-gluconate, 4 KCl, 10 HEPES, 4 Mg-ATP, 0.3 Na-GTP, 10 Na2-phosphocreatine, pH 7.2 adjusted with KOH (300 mOsm/l).
Whole-cell patch-clamp recordings were performed in voltage and current clamp with ELC-03XS and ELC-01MX amplifiers (NPI Electronic, Germany). Signals were low-pass filtered at 10 kHz and digitized at 20 kHz with a data acquisition board (PCle 6323, National Instruments, TX, USA) connected to a computer (Dell, Windows 8, 64-bit). Access resistance and electrode capacitance were compensated directly at the amplifier, while all other experimental settings were controlled by the recording software (WaveSurfer version 0.965, Howard Hughes Medical Institute, Janelia Research Campus, USA, https://wavesurfer.janelia.org/) running with MATLAB 2018 (MathWorks, CA, USA). Recorded data were not corrected for liquid junction potential. Data were not included in the analysis if resting membrane potential was unstable, visible as severe changes in membrane potential ~10 mV or more around the stimulation time, or if access resistance was higher than 40 MΩ.
2.3.2. Sub- and suprathreshold recordings
Sub- and suprathreshold electrophysiological properties were recorded in aCSF by injecting 500 ms current steps from −100 to 300 pA for the age group I (and supplementary age group pre-eye-opening) and from −100 to 500 pA for age groups II and III. Current was injected in 50 pA increments, with an additional current step at −30 pA.
The stimulation pattern was recorded for 10 consecutive trials, properties were calculated on single sweeps and averaged across all 10 trials. Resting membrane potential was measured at 0 pA current step. Input resistance was obtained by the slope of the current–voltage relationship from −50 to 0 pA current steps. The time constant of the membrane was calculated with a mono-exponential fit to voltage changes resulting from a −50 pA current step. Voltage sag was calculated as the percentage difference between the initial voltage response and the sustained steady-state voltage response to a current injection of −100 and −50 pA. Afterward, the two responses were linearly fitted and interpolated to a response that would cause a hyperpolarization of −7.5 mV (van Aerde and Feldmeyer, 2015; Ciganok-Hückels et al., 2023).
Action potential (AP) properties were calculated from the first action potential. The AP threshold was calculated with the first derivative of the action potential, the threshold was set as the value where the mean of the first AP derivative exceeded two standard deviations. AP amplitude was calculated as the total voltage change from AP threshold to AP maximum. AP rise time was calculated as the time to reach maximal AP amplitude from the AP threshold. AP half-width was calculated as the full width at half-maximal AP amplitude. Rheobase was set as the first current step that was able to elicit action potentials. For a subset of cells, rheobase was subsequently checked with 10 pA current steps, oriented around the rheobase value that we found with the 50 pA current steps. Both mean values (rheobase with 50 pA steps and 10 pA steps) were very similar (data not shown); therefore, we combined both values. Area under curve (a.u.c.) values of frequency–current (FI) curves were calculated by trapezoidal numerical integration. For AP amount in 100 ms time bins of stimulation time, the APs in each respective bin were counted at fixed current steps (age group I 250 pA, age groups II and III 400 pA). The inter-spike interval (ISI) was calculated for neurons with at least 10 APs, regardless of the current step, across the stimulation period. ISIs were calculated for each inter-spike interval by dividing ISI-n = 1–8 by the ninth ISI (ISI-n/ISI-9).
2.3.3. Extracellular stimulation
For extracellular stimulation, a second glass pipette (stimulation electrode filled with aCSF) connected to an isolated stimulator (DS2A, Digitimer Ltd, UK) was brought close to the slice surface and to the recorded neuron. Extracellular stimulation was controlled at the stimulation device and triggered by the recording software. After a trigger, cathodic square pulse stimuli (0.2 ms duration) were generated, and the resulting response of the stimulated network was measured in the recorded cell. Calculations were done on averaged traces from 40 sweeps in total.
Current-clamp (CC) recordings were done at resting membrane potential, with both electrodes (recording and stimulation) present in L2/3. The strength of the stimulation electrode was set to a value that would elicit a clear visible response but no detrimental effects. The collective potential change at the soma was measured, resulting in a subthreshold depolarizing event at resting membrane potential. For 20-Hz stimuli, each sweep contained five stimuli, while for 40-Hz stimulation, the stimuli alternated one sweep with one stimulus followed by a sweep containing two stimuli, resulting in 20 sweeps with 40-Hz stimulation.
Voltage clamp (VC) recordings followed initial recordings of cell properties in CC. Membrane potential was clamped at −45 and +10 mV. Calculation of equilibrium potentials and electrochemical driving forces showed that recordings at −45 mV would allow us to record putative excitatory postsynaptic currents (EPSCs) and putative inhibitory postsynaptic currents (IPSCs), since −45 mV is sufficiently distant from our chloride reversal potential of −92 mV. Ultimately, currents analyzed at −45 mV are confined to putative EPSCs, while putative IPSCs were recorded at +10 mV. The stimulation was set up as described above, but here the recording electrode is in L2/3, while the stimulation electrode was placed perpendicularly below the recording electrode in L4. Stimulation strength was slowly raised until a clear, but not saturated, response was visible in the recording electrode. Calculations were done on averaged traces from 40 sweeps in total. Failures were excluded to better monitor the potential effect of retinal degeneration on event parameters.
2.3.4. Spontaneous activity
For CC recordings, the membrane potential was raised to −50 and −40 mV by short (500 ms) test current injections. Once a current value to raise the membrane potential to the goal potential was determined, the test pulse was changed to the stimulation pulse of 120 s. Cells that did not show a strong divergence from the goal potential were used for analysis. During the stimulation, cells were able to fire action potentials or display subthreshold synaptic events that depolarized or hyperpolarized the membrane. For CC recordings of action potential frequency, we used only cells at −40 mV that displayed action potentials. Subthreshold events are putative excitatory or inhibitory postsynaptic potential (EPSP/IPSP). Since we did not use synaptic blockers, we referred to these events as depolarizing or hyperpolarizing events.
Depolarizing and hyperpolarizing events at −50 mV were detected on filtered (10 ms moving average) sweeps excluding action potentials by a MATLAB implementation of a detection algorithm by Clements and Bekkers (1997). For all event types and cells, the same template was used. The detection criterion was set to 4 × SD. In subsequent analysis, only events that were greater than 3 × SD of the membrane potential and had a rise time below 10 ms were accepted. These events were used to calculate amplitude and frequency.
Spontaneous events in VC were recorded at the respective clamped membrane potential (−45 mV, +10 mV). The same post-processing steps as with CC events were applied to VC events using the same detection algorithm (Clements and Bekkers, 1997). Since we did not use synaptic blockers, we referred to these events as putative EPSCs and putative IPSCs. For all event types, cells, and holding voltage steps, the same template was used, and the detection criterion was set to 5 × SD. Up to two 120-s sessions for CC and up to three for VC were recorded, inter-session interval of <10 s. Sessions values were averaged.
2.4. Data analysis and statistics
Data and statistical analysis were performed in MATLAB (MathWorks, versions 2019b and 2022a). Recorded data were accessed via MATLAB scripts provided by the recording software (WaveSurfer version 1.0.2, Howard Hughes Medical Institute, Janelia Research Campus, USA) and subsequently analyzed with custom-made scripts. Experiments and data analysis were not blinded to genotype.
For the statistical analysis, we performed non-parametric tests for our entire dataset, since the data were not normally distributed. For intra-age group differences (B6 vs. rd10), we used the independent, two-sided Wilcoxon rank-sum test. In addition to intra-age group differences, which are the main focus of our study, we also tested the respective inter-age group differences for sub- and suprathreshold electrophysiological properties of B6 and rd10 (Kruskal–Wallis test with post-hoc Bonferroni corrected multiple comparisons). Our data followed a similar developmental trend described in previous studies for rodent primary visual cortex (Supplementary Tables 12–15) (Etherington and Williams, 2011; Tatti et al., 2017; Ciganok-Hückels et al., 2023), despite small differences in the change in rheobase current with age compared to the previous literature, which might be due to differences in internal solutions and age group distribution.
Data in figures and Supplementary Tables are presented as mean ± one standard deviation (SD). Significance levels are given as *p < 0.05, **p < 0.01, ***p < 0.001, and NS not significant (p > 0.05) and are displayed in the figures and Supplementary Tables. Sample sizes of recorded cells are presented as part of each figure caption. In addition, Supplementary Tables present a detailed overview of the number of mice and recorded cells.
3. Results
3.1. Gradual retinal degeneration does not lead to a long-lasting shift of sub- and suprathreshold membrane properties
First, we recorded subthreshold properties to monitor changes in intrinsic excitability between B6 and rd10 mice from each respective age group (Figure 1; Supplementary Table 1; age group I: p14–p16, II: p29–p42, III: p59–p100). In addition to these age groups, sub- and suprathreshold properties were tested in a supplementary age group before eye-opening, in this age group, rd10 and B6 neurons showed no significant differences (Supplementary Figure 1; Supplementary Table 11). We found no significant difference in resting membrane potential (Figure 1B), voltage sag (Figure 1C), and membrane time constant (Figure 1D). However, the input resistance of age group I is significantly higher for B6 cells compared to rd10 (Figure 1E, I: B6: 202.4 ± 52.3 MΩ, rd10: 148.7 ± 28.3 MΩ, **p < 0.01, Wilcoxon rank-sum test). Moreover, rd10 PNs from age group II had a significantly higher input resistance (Figure 1E, II: B6: 64.3 ± 18.3 MΩ, rd10: 78.8 ± 21.4 MΩ, ***p < 0.001, Wilcoxon rank-sum test). Within age group III, there was no significant difference. These results indicate that retinal degeneration has a small and short-lasting impact on the intrinsic excitability of L2/3 PNs, with a decreased input resistance right after eye-opening and before the onset of retinal degeneration and an increased input resistance after the critical period and progression of retinal degeneration.
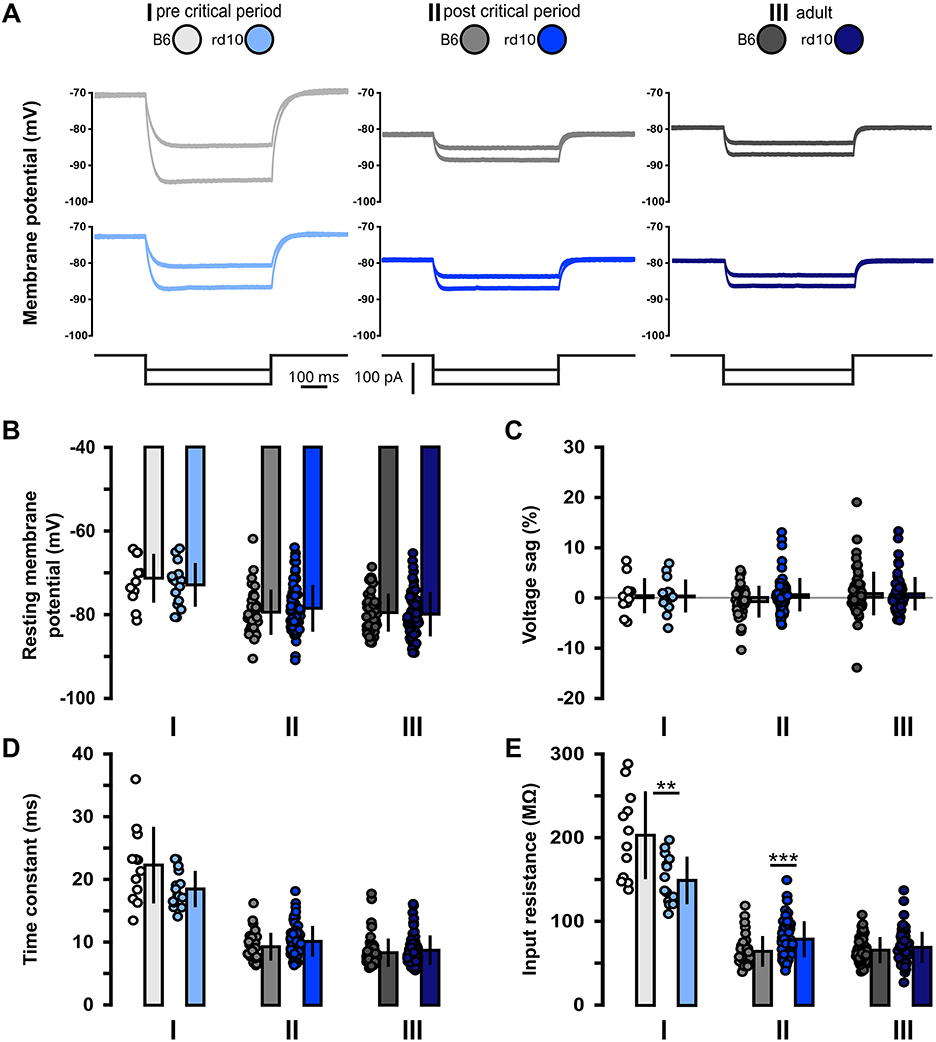
Figure 1. Acute but non-long-lasting shift of subthreshold membrane properties of rd10 L2/3 PNs. (A) Examples of voltage responses to hyperpolarizing current steps for each of the three age groups (I, II, and III) and genotypes (gray traces B6, blue traces rd10). Bottom traces show injected current steps (−50 and −100 pA). (B) No change in resting membrane potential between B6 and rd10 in all age groups. (C) Voltage sag is not changed between B6 and rd10 in all age groups. (D) Time constant is not different between B6 and rd10 in all age groups. (E) Input resistance of age groups I and II showed a significant difference between B6 and rd10. Sample size of recorded cells for (B–E) I: n = 12 B6; 15 rd10, II: n = 35 B6; 65 rd10, III: n = 60 B6; 66 rd10.
Next, we looked at the suprathreshold properties to characterize the effect of retinal degeneration on the input–output properties of L2/3 PNs (Figure 2; Supplementary Table 1). Within all age groups, we found no significant differences between B6 and rd10 AP threshold and amplitude (Figures 2B, C). In age group II, AP rise time was slightly increased in rd10 L2/3 PNs compared to control animals (Figure 2D, age group II: B6: 0.61 ± 0.06 ms, rd10: 0.66 ± 0.09 ms, *p < 0.05, Wilcoxon rank-sum test). Similarly, the AP half-width of rd10 L2/3 PNs was slightly broader in comparison to B6 (Figure 2E, age group II: B6: 1.03 ± 0.12 ms, rd10: 1.15 ± 0.17 ms, ***p < 0.001, Wilcoxon rank-sum test). In age groups I and III, these two parameters were not significantly different from the control.
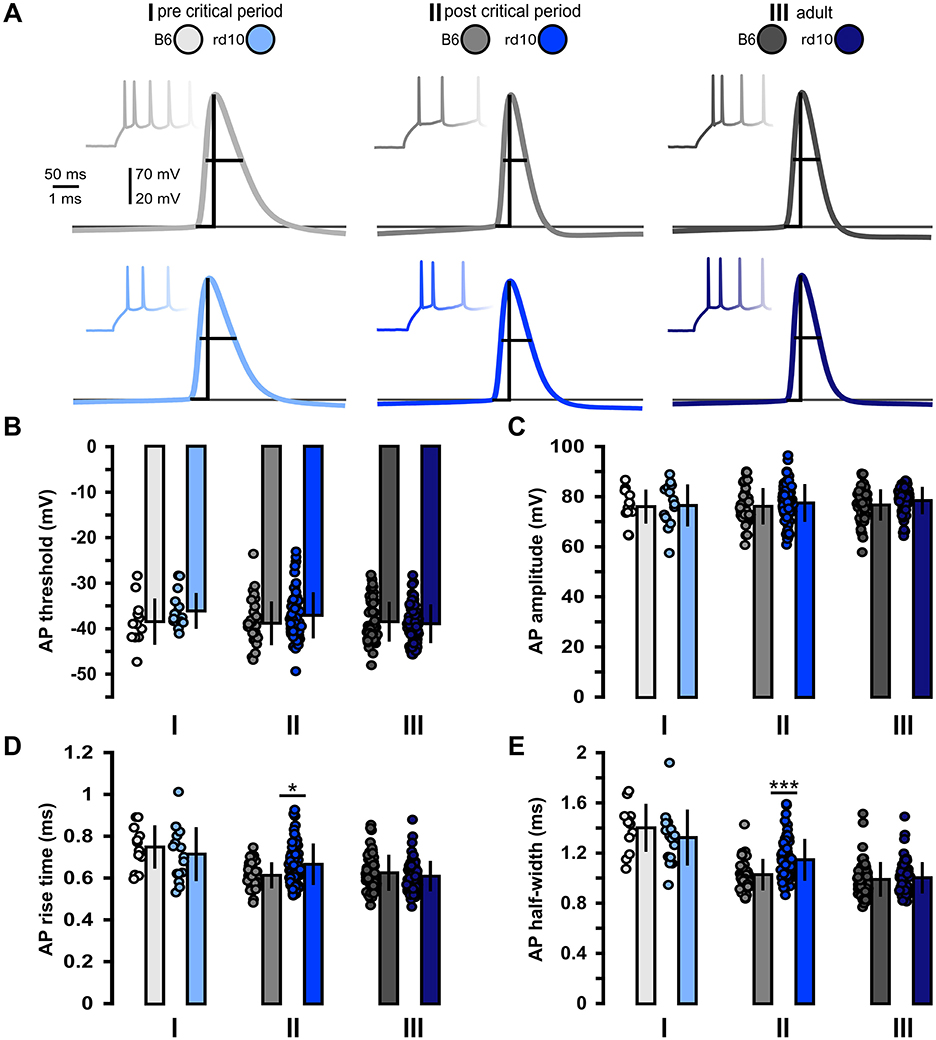
Figure 2. Acute but non-long-lasting changes in action potential properties in rd10 L2/3 PNs. (A) Example traces of action potential firing elicited by depolarizing current steps. Traces in the background show the first few action potentials elicited by current step injections. Traces in front are examples of the first action potential of these trains for each of the three age groups (I, II, and III) and genotypes (gray traces B6, blue traces rd10). Vertical and horizontal lines indicate action potential amplitude and half-width, respectively, bottom line indicates action potential threshold. (B) Action potential threshold and (C) action potential amplitude did not show significant differences between B6 and rd10. (D) Action potential rise time and (E) Action potential half-width were significantly increased in rd10 from age group II. Sample size of recorded cells for (B–E) I: n = 12 B6; 15 rd10, II: n = 35 B6; 65 rd10, III: n = 60 B6; 66 rd10.
As we observed a slight increase in the excitability of L2/3 PNs after the onset of retinal degeneration in rd10 mice, we also tested how this observation transfers to action potential firing by injecting increasing depolarizing currents steps (Figure 3A). Indeed, the resulting frequency–current (FI) curves showed an increase in evoked firing frequency for rd10 mice in age group II compared to control (Figure 3B; Supplementary Table 2). The FI curves of the other age groups I and III were similar between the two mouse lines. To better quantify the increase in AP firing, we analyzed the mean area under curve (a.u.c.) values for B6 and rd10 FI curves. For age groups I and III, we found no significant differences. For age group II, we observed a significantly greater area under the FI curve in rd10 mice compared to B6, indicating increased action potential firing in rd10 at age group II after the critical period (Figure 3B inset; age group II: B6 = 64.31 ± 41.14 pA*Hz, rd10: 92.22 ± 46.72 pA*Hz, **p < 0.01, Wilcoxon rank-sum test; Supplementary Table 5). Similarly, the rheobase was smaller in rd10 mice of age group II compared to control, also indicating an increased excitability of visual cortex neurons in the critical period (Figure 3C; age group II: B6: 314.3 ± 65.5 pA, rd10: 246.5 ± 61.1 pA, ***p < 0.001, Wilcoxon rank-sum test). No difference could be observed between the two mouse lines in age groups I and III (Supplementary Table 5). Furthermore, testing the AP amount in 100 ms time bins of the stimulation period revealed a significant increase in each time bin in APs for rd10 in AG-II (time bin 1, **p < 0.01, time bin 2–5, *p < 0.05), age groups I and III did not show such a difference (Figure 3D; Supplementary Table 3), while for the AP adaptation ratio, we did not find any difference in any age group (Figure 3E; Supplementary Table 4).
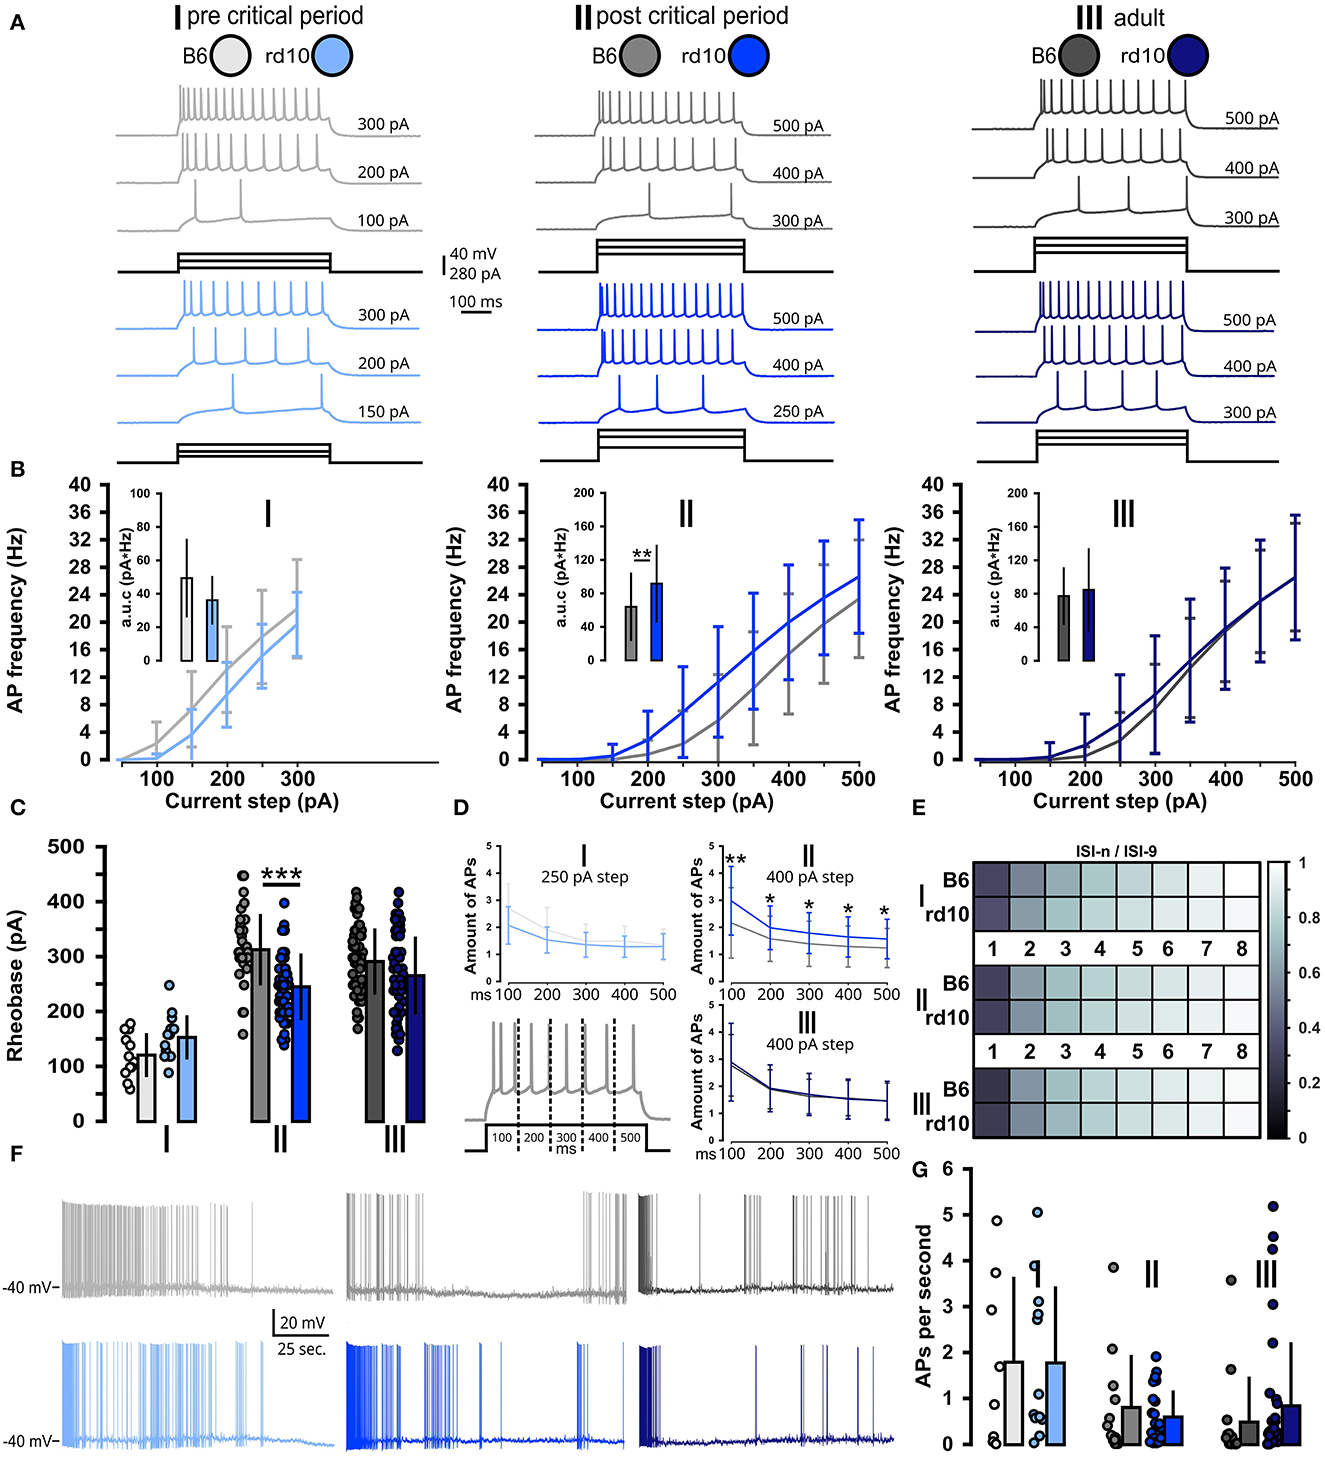
Figure 3. Acute but non-long-lasting shift of suprathreshold properties in rd10 L2/3 PNs. (A) Example traces of action potential firing. For each of the three age groups (I, II, and III) and two genotypes (B6 gray traces and rd10 blue traces), one exemplary cell is presented. Each of these cells is shown at three different depolarizing current steps, from rheobase to the maximal current step. (B) AP firing frequency at each depolarizing current step (FI curve). Insets show the area under the FI curve. Only rd10 neurons from age group II had significantly higher evoked AP firing rates. (C) Rheobase of rd10 L2/3 PNs from age group II is significantly decreased. (D) AP amount in 100 ms time bins of the stimulation period, dashed lines indicate the different time bins for analysis of AP firing in the respective time bin. Age group II had a significantly higher number of APs in each time bin. (E) Intensity plot of the adaptation ratio (ISI-n/ISI-9) did not reveal any differences between rd10 and B6. (F) Example traces of ongoing AP firing while membrane potential is raised to −40 mV. (G) Quantification of spontaneous AP firing did not reveal significant differences between B6 and rd10 across all age groups. Sample size of recorded cells for (B–D) I: n = 12 B6; 15 rd10, II: n = 35 B6; 65 rd10, III: n = 60 B6; 66 rd10, (E) I: n = 11 B6; 15 rd10, II: n = 22 B6; 48 rd10, III: n = 47 B6; 54 rd10, and (G) I: n = 8 B6; 12 rd10, II: n = 12 B6; 23 rd10, III: n = 14 B6; 33 rd10.
In addition to evoked AP firing (Figures 3A–E), visual deprivation has been shown to also influence spontaneous AP firing in L4 and L2/3 (Maffei et al., 2004; Maffei and Turrigiano, 2008). For this, we brought the recorded neuron closer to the AP firing threshold by raising the membrane potential to −40 mV where small fluctuations evoked by spontaneous synaptic input from the surrounding network of L2/3 PNs or intrinsic properties can lead to AP induction (Figure 3F). Overall PNs presented a broad range of mean action potential firing, ranging from a few cells with higher spiking rate (2 Hz) to predominantly cells with lower spontaneous AP firing (below 1 Hz). Yet, no significant difference between B6 and rd10 was found in any age group (Figure 3G; Supplementary Table 5).
Taken together, these results showed that in addition to the increased subthreshold excitability, rd10 L2/3 PNs also became more likely to fire APs after the onset of retinal degeneration but only at the end of the critical period. B6 and rd10 neurons expressed similar sub- and suprathreshold properties after full maturation of the visual system.
3.2. Gradual retinal degeneration does not lead to a long-lasting shift of pre- and postsynaptic network properties
Visual deprivation leads not only to increased excitability of cortical neurons but also to changes in synaptic efficacy. Therefore, we investigated whether retinal degeneration also has an impact on synaptic short-term plasticity in the visual cortex. To address this, we recorded postsynaptic activity in L2/3 PNs by stimulating the surrounding neurons with an extracellular stimulation electrode placed in the same L2/3 in cortical brain slices of rd10 or B6 mice (Figure 4A). The stimulation protocol consisted of trains of five stimuli at 20 Hz or two stimuli at 40 Hz (Figure 4B). We quantified the change in the postsynaptic response within these trains by calculating paired-pulse ratios (PPRs) between the response to the first stimulus and those to each of the following stimuli. PPRs for stimuli at 20 Hz were similar for rd10 and B6 across all age groups (Figure 4C; Supplementary Table 6). However, at 40 Hz, the second pulse in a train was less efficient in rd10 compared to B6 mice in age group II (Figure 4D, II: B6 = 1.33 ± 0.15, rd10 = 1.10 ± 0.18, ***p < 0.001, Wilcoxon rank-sum test). This suggests an increased release probability in the presynaptic boutons of rd10 neurons after the progression of retinal degeneration at the end of the critical period.
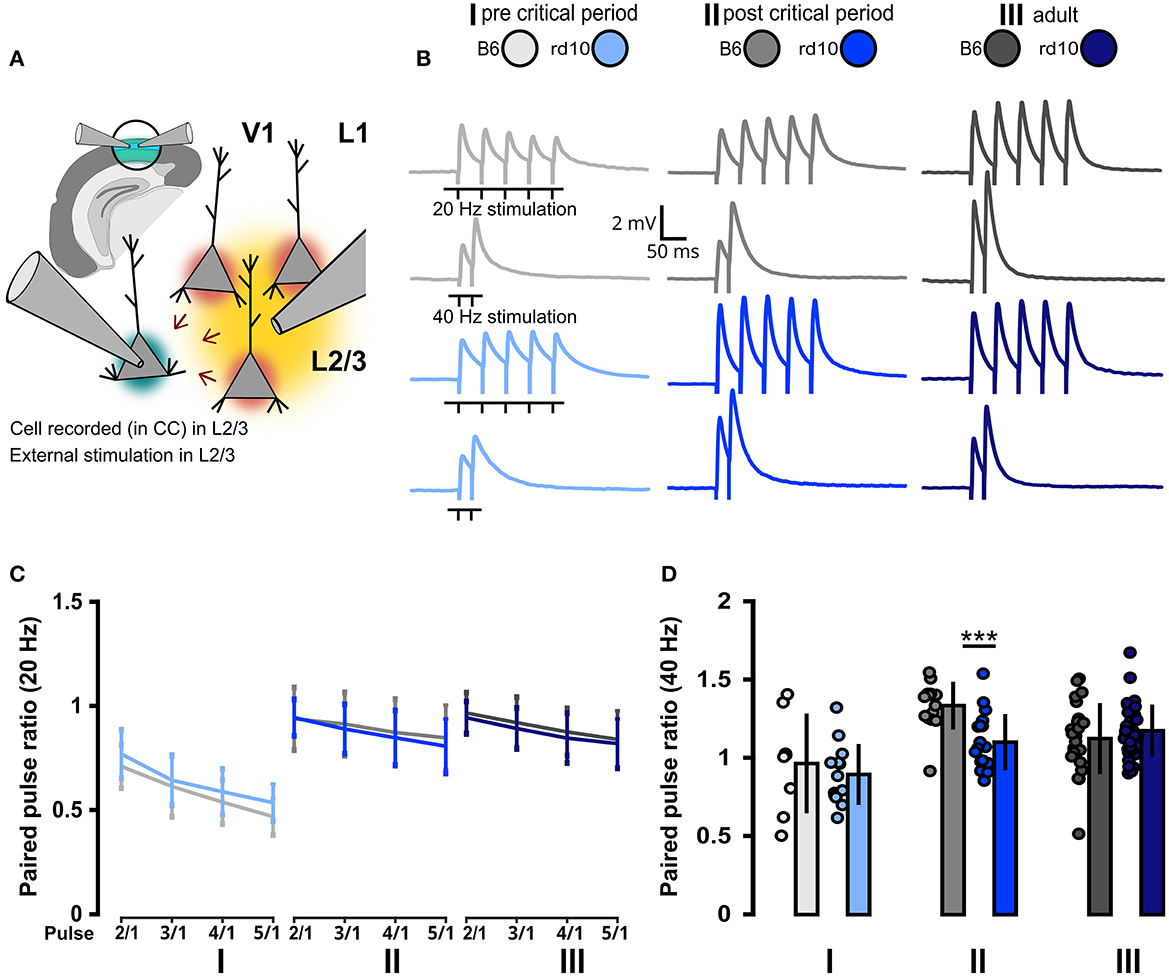
Figure 4. Consistent pre- and postsynaptic network properties in rd10 and B6 L2/3 PNs. (A) Schematic representation of the experimental setup. V1 in the brain slice is highlighted in green. Layer 2/3 PNs were recorded in current-clamp mode (green highlighted cell), while a second pipette is used for the extracellular stimulation of the surrounding L2/3 neurons (yellow area of stimulation and red highlighted cells affected by stimulation). (B) Example traces of voltage responses evoked by the extracellular stimulation of the surrounding network (five stimuli at 20 Hz and two stimuli at 40 Hz). (C) Paired pulse ratios {PPR [event(n)/event(1)]} at 20 Hz did not reveal any difference between B6 and rd10. (D) Paired pulse ratios {PPR [event(2)/event(1)]} at 40 Hz show a significant difference between B6 and rd10 in age group II. Sample size of recorded cells for (C) I: n = 8 B6; 13 rd10, II: n = 13 B6; 16 rd10, III: n = 21 B6; 29 rd10, (D) I: n = 8 B6; 13 rd10, II: n = 14 B6; 19 rd10, III: n = 24 B6; 37 rd10.
We, therefore, also measured the occurrences of spontaneous excitatory and inhibitory postsynaptic potentials (Barnes et al., 2015; Alejandre-García et al., 2022) by raising the resting membrane potential to −50 mV (Figure 5A). The raised membrane potential increases the distance to the inhibitory reversal potential and therefore also allows simultaneous measurements of inhibitory postsynaptic potentials (see Supplementary Figure 2) (Sanchez-Vives and McCormick, 2000; Okun and Lampl, 2008). For spontaneous synaptic inputs in CC, we did not observe any difference between rd10 and B6 mice, neither in event frequency (Figure 5B) nor in event amplitudes (Figure 5C; see also Supplementary Table 7). Next, we recorded spontaneous synaptic inputs in VC to better distinguish excitatory (−45 mV) and inhibitory (+10 mV) events (Figure 5D). Since retinal degeneration starts occurring in age group II, we only recorded this group and age group III to monitor a possible long-lasting change. We did not see significant changes neither in the frequency of synaptic events (Figure 5E; Supplementary Table 8) nor in inter-event interval (IEI) distribution (Supplementary Figure 3). However, we did observe a slightly increased amplitude of inhibitory currents for rd10 mice in age group III (Figure 5F, age group III: B6: 10.05 ± 4.09 pA, rd10 = 17.49 ± 6.15 pA, **p < 0.01, Wilcoxon rank-sum test).
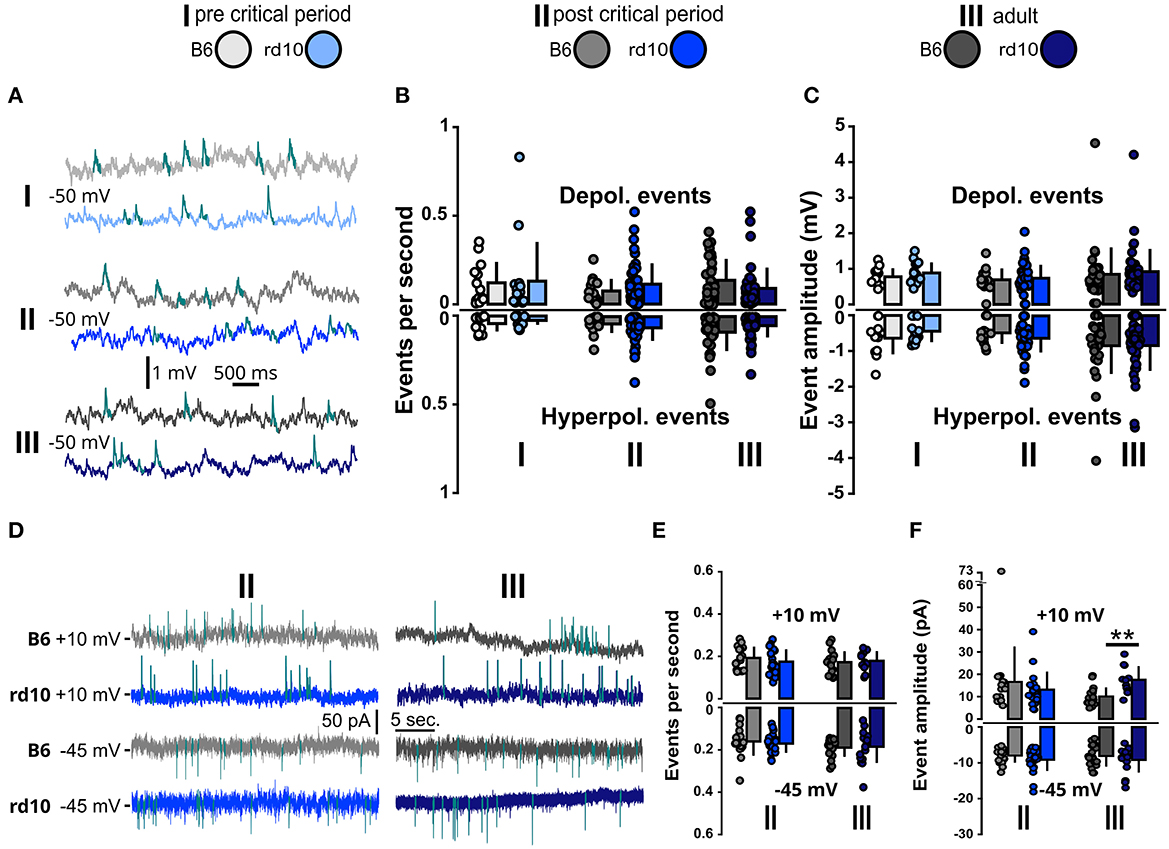
Figure 5. Spontaneous synaptic inputs are stable in rd10 L2/3 PNs. (A) Example traces of spontaneous depolarizing events in the current clamp at membrane potential raised to −50 mV (for hyperpolarizing events, see Supplementary Figure 2). (B) Mean events per second for depolarizing and hyperpolarizing events measured at −50 mV membrane potential and (C) Mean median amplitudes of depolarizing and hyperpolarizing events remain similar between B6 and rd10 across all age groups. (D) Example traces of spontaneous inhibitory and excitatory currents in voltage clamp at +10 mV (two upper sweeps) and −45 mV (two lower sweeps), respectively. (E) Mean events per second of spontaneous postsynaptic currents at +10 mV and −45 mV were not different between B6 and rd10. (F) Mean median amplitudes of spontaneous membrane currents at +10 mV and −45 mV. Age group III currents at +10 mV show a significant difference between B6 and rd10. Sample size of recorded cells for (B, C) I: n = 13 B6; 15 rd10, II: n = 14 B6; 44 rd10, III: n = 31 B6; 41 rd10 cells, (E, F) (+10 mV): II: n = 16 B6; 19 rd10, III: n = 18 B6; 11 rd10 and (E, F) (−45 mV): II: n = 18 B6; 24 rd10, III: n = 19 B6; 17 rd10.
Since visual input to the cortex is mainly transmitted from thalamocortical projections to L4 and from there further to L2/3, we also wanted to test whether synaptic short-term plasticity is altered between these layers after retinal degeneration. Therefore, we stimulated L4 and measured postsynaptic responses in L2/3 (Figures 6A, B). We recorded PPR in VC to better distinguish excitatory (−45 mV) and inhibitory (+10 mV) inputs. While changes in PPR could be a potential effect of retinal degeneration, we did not detect differences in PPR at 20 and 40 Hz for excitatory and inhibitory inputs from L4 neurons (Figures 6C–F; Supplementary Tables 9–10).
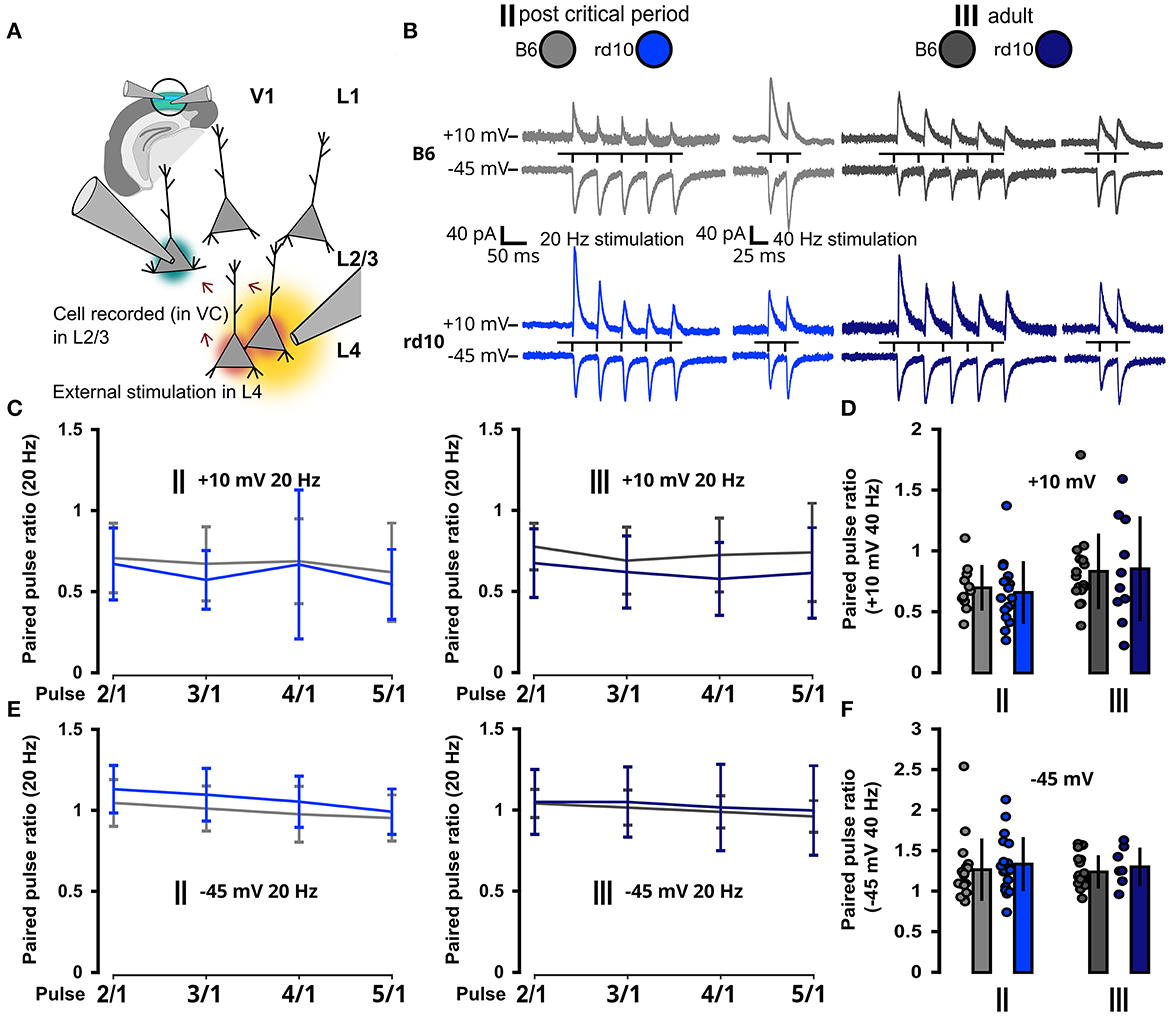
Figure 6. No change in synaptic properties from L4 in rd10 L2/3 PNs. (A) Schematic representation of the experimental setup. V1 in the brain slice is highlighted in green. L2/3 PNs were recorded in voltage clamp mode (green highlighted cell), while a second pipette was used for the extracellular stimulation of L4 neurons (yellow area of stimulation and red highlighted cells affected by stimulation). (B) Example traces of postsynaptic current responses to stimulation in L4 recorded in L2/3 PNs at different holding membrane potentials (stimulation protocol was five stimuli at 20 Hz and two stimuli at 40 Hz). (C) Paired pulse ratio {PPR [event(n)/event(1)]} with 5 stimuli at 20 Hz at +10 mV. (D) Paired pulse ratio with two stimuli at 40 Hz at +10 mV. (E) Paired pulse ratio with five stimuli at 20 Hz at −45 mV. (F) Paired pulse ratio with two stimuli at 40 Hz at −45 mV. None of the paired pulse ratio values (C–F) was significantly different between B6 and rd10. Sample size of recorded cells for (C) II: n = 10 B6; 13 rd10, III: n = 12 B6; 8 rd10, (D) II: n = 11 B6; 17 rd10, III: n = 16 B6; 10 rd10, (E) II: n = 17 B6; 14 rd10, III: n = 19 B6; 7 rd10, (F) II: n = 18 B6; 20 rd10, III: n = 19 B6; 7 rd10.
Taken together, these data suggest that direct inter-layer feedforward visual inputs to L2/3 PNs from L4 are not affected by retinal degeneration. Rather the L2/3 intra-layer network shows effects of retinal degeneration around the onset of the pathology, due to intrinsic changes in the excitability of L2/3 PNs.
4. Discussion
We performed an in vitro screening of electrophysiological properties in the rd10 retinitis pigmentosa mouse model to test whether retinal degeneration affects L2/3 pyramidal neurons in V1. After the onset of retinal degeneration, the intrinsic excitability increased, but these changes were not long-lasting, since we observed no difference between B6 and rd10 L2/3 PNs in adult mice with further progressive retinal degeneration. Moreover, we did not reveal long-lasting changes in synaptic efficacy in adult rd10. Only the current amplitude of spontaneous putative inhibitory events showed a slight increase after prolonged retinal degeneration. L2/3 cells in V1 of rd10 mice did not develop an electrophysiological profile that was severely different from its wild-type counterpart.
While no severe changes exist in the visual cortex of rd10 mice after retinal degeneration, our data show changes in several sub- and suprathreshold membrane properties (Figures 1, 2), an increase in excitability (Figure 3) and an increase in release probability for excitatory synaptic inputs (Figure 4) around the peak of retinal degeneration (age group II) (Chang et al., 2007; Gargini et al., 2007; Rösch et al., 2014). This increase in the excitability of L2/3 PNs is similar to what has been observed after prolonged visual deprivation (Maffei and Turrigiano, 2008; Lambo and Turrigiano, 2013). Furthermore, prolonged exposure of adult mice to darkness for up to 5 weeks triggered an increase in the resting membrane potential and input resistance as well as a decrease in the rheobase current, together making the L2/3 PNs in V1 more sensitive to synaptic input (Brown et al., 2019). In addition to changes in intrinsic excitability, we observed a decreased PPR within L2/3 in rd10 age group II at the end of the critical period, suggesting an increased release probability, which rebounds back to control levels after prolonged retinal degeneration in age group III. It has been shown previously that changes in activity and sensory input can lead to the accumulation of synaptic vesicles (Nahmani and Turrigiano, 2014), which could be connected to an increase in readily releasable pool size (Murthy et al., 2001; Han and Stevens, 2009). In addition, activity changes are known to influence release probability (Maffei and Turrigiano, 2008; Zhao et al., 2011; Kannan et al., 2016; Zhuang et al., 2020). Retinal degeneration is also known to alter the release probability of retinal ganglion cells (Bhandari et al., 2019), while for rd10 an increase in evoked release of cortical neurotransmitters, which rebounds back to baseline in older animals, has been described (Pietra et al., 2021). These results, combined with our data shown here, highlight that gradual retinal degeneration in rd10 mice shows similarities to the effects of visual deprivation studies.
In age group III, we saw an increase in the amplitude of spontaneous putative IPSCs (Figure 5). Changes in visual input around the critical period are well-known to affect inhibitory properties in L4 (Maffei et al., 2006, 2010; Nahmani and Turrigiano, 2014) and L2/3 (Gao et al., 2014, 2017; Kannan et al., 2016). A change in mIPSC frequency (Kannan et al., 2016; Gao et al., 2017) and a shift of the excitation to inhibition ratio toward inhibition (Kannan et al., 2016), in combination with an upregulation of excitatory components (Hengen et al., 2013; Lambo and Turrigiano, 2013), are thought to counteract the loss of visual input and reestablish a firing rate set point (Turrigiano, 2017). For rd10 in age group III, the result of such homeostatic processes seems to be an increase in inhibitory amplitude. Interestingly, our data are similar to those from visual deprivation experiments when patterned vision is lost for both eyes via binocular lid sutures. In this case, the effects are often less pronounced than those with monocular lid suture, as shown in in vivo and in vitro experiments (Gordon and Stryker, 1996; Sato and Stryker, 2008; Lambo and Turrigiano, 2013). Together, it can be suggested that Hebbian and homeostatic plasticity effects also occur after gradual retinal degeneration, leading to a temporary shift in electrophysiological properties at the peak of retinal degeneration.
In addition to retinal degeneration in rd10 mice, normal development and aging also influence electrophysiological properties. Studies that follow maturing cells in the cortex report age-dependent changes in morphological and electrophysiological properties. These changes are well-documented for several brain areas (Zhang, 2004; Oswald and Reyes, 2008; Kroon et al., 2019; Perez-García et al., 2021), including rodent primary visual cortex (Kasper et al., 1994; Etherington and Williams, 2011; Tatti et al., 2017; Ciganok-Hückels et al., 2023). Our overall wild-type B6 and rd10 sub- and suprathreshold data (Figures 1–3) are in accordance with the time course and extent of developmental electrophysiological changes presented in these studies. Furthermore, we show that neurons in V1 of rd10 mice are similar to control at an age before eye-opening and before the onset of retinal degeneration (Supplementary Figure 1; Supplementary Table 11). A diversity of molecular mechanisms are responsible for such changes in intrinsic excitability, including different types of ion channels (Wefelmeyer et al., 2016; Debanne and Russier, 2019; Debanne et al., 2019). Depriving cultured pyramidal neurons of activity increases their excitability by reducing the persistent potassium current and increasing voltage-gated sodium currents (Desai et al., 1999). Whereas, in L5 PNs, visual deprivation reduces excitability by increasing a persistent voltage-gated potassium current (Nataraj et al., 2010). These mechanisms are likely to be also involved in age- or development-induced changes of intrinsic excitability in the visual cortex (Etherington and Williams, 2011; Tatti et al., 2017; Ciganok-Hückels et al., 2023) and similarly in the observed changes in rd10 mice.
While retinal degeneration leads to the loss of photoreceptors, retinal ganglion cells remain intact and can still produce a retinal output via intrinsic activity or upon reactivation, which is projected downstream to central brain regions including V1 (Mazzoni et al., 2008; Ivanova et al., 2016; Sahel et al., 2021; Yue et al., 2021). Ongoing ganglion cell activity could, therefore, provide input to V1 even without visual input or functional photoreceptors. Indeed, because of photoreceptor loss, the remaining retina develops aberrant oscillatory activity in mouse models of retinitis pigmentosa (rd1 and rd10) (Margolis et al., 2008; Biswas et al., 2014; Goo et al., 2016; Ivanova et al., 2016; Gehlen et al., 2020; Ahn et al., 2022) and hyperactivity in retinal ganglion cells (Margolis and Detwiler, 2011; Stasheff et al., 2011; Telias et al., 2019; Ahn et al., 2022). This aberrant retinal activity develops with the onset of retinal degeneration and is reported for our age group III and beyond, up until 12 months (Stasheff et al., 2011; Biswas et al., 2014). Moreover, murine models of retinitis pigmentosa provided evidence that this aberrant activity is not confined to the retina but also translated to higher visual areas downstream of the retina, such as the superior colliculus and V1 (Dräger and Hubel, 1978; Ivanova et al., 2016; Wang et al., 2016; Rüland, 2023).
Since mouse models of retinitis pigmentosa are only an abstraction that do not fully encompass the disease progression in humans, the results from these models need to be seen with this caveat. In relation to humans, rd10 mice show an earlier loss of rod and cone photoreceptors and a critical period that coincides with retinal degeneration. In humans, for most cases, retinal degeneration begins after the critical period (Hamel, 2006; Hartong et al., 2006; Sahel et al., 2014), while there is evidence that altered and reduced visual experience around early childhood can impact visual properties later in life, even if visual experience is restored (Maurer, 2017; Segalowitz et al., 2017; Caravaca-Rodriguez et al., 2022; May et al., 2022; Xiang et al., 2023). This needs to be considered for the assessment of possible vision restoration approaches in the rd10 mouse model as well as in human patients. The prerequisite for a vision restoration attempt is also a better understanding of the electrophysiological properties of the visual cortex and higher visual areas in regard to aberrant activity from the retina.
Similar to our observations after the onset of retinal degeneration, different murine models of retinitis pigmentosa showed heightened excitability in V1 (Wang et al., 2016; Chen et al., 2020; Leinonen et al., 2022), accompanied by impairments in neurophysiological properties such as visual stimulus direction selectivity (Chen et al., 2016; Leinonen et al., 2022). In addition, human retinitis pigmentosa patients report visual impairments beyond loss of vision, which might be attributed to aberrant retinal activity (Stasheff, 2018). Even though retinal aberrant activity is intensively studied, it is not fully known if this aberrant activity, together with the overall change in input due to retinal degeneration, affects the properties of neurons in V1. This has potential implications for vision restoration methods, since aberrant retinal activity could maintain constant input to V1 (Dräger and Hubel, 1978; Ivanova et al., 2016; Wang et al., 2016; Rüland, 2023) and therefore prevent plastic changes or shifts in the electrophysiological properties of V1 neurons.
5. Conclusion
Successful vision restoration therapy after retinal degeneration in retinitis pigmentosa requires intact structures downstream of the retina in the thalamus and visual cortex. Long-term visual deprivation can lead to potential changes in cortical circuits, posing significant constraints on the success of retinal or cortical implants for restoring vision (Caravaca-Rodriguez et al., 2022). Our study provides direct evidence that the electrophysiological properties of V1 neurons remain intact in the rd10 mouse model after progressing retinal degeneration. We showed distinct changes in the excitability of rd10 L2/3 PNs after retinal degeneration onset and during the critical period. These changes were, however, transient and V1 neurons appeared similar to control at adult age. In regard to vision restoration therapy, this outcome would be beneficial, as targets downstream of the retina seem to be unaffected by the retinal pathology and still offer potential for electrical or optogenetic stimulation. Improved retinal implants, taking into account ongoing oscillation states of retinal ganglion cells, will offer more efficient stimulation at the level of the retina (Rincón Montes et al., 2019). In addition to retinal stimulation, cortical electrodes with improved long-term stability for chronic recordings and stimulation (Srikantharajah et al., 2021) also provide a promising approach for evoking visual percepts by electrical stimulation of the visual cortex (Beauchamp et al., 2020; Roelfsema, 2020; Fernández et al., 2021). Our results shown here imply that the visual cortex will still be functional and accessible for vision restoration even after prolonged retinal degeneration and blindness.
Data availability statement
The raw data supporting the conclusions of this article will be made available by the authors, without undue reservation.
Ethics statement
The animal study was approved by Landesamt für Natur, Umwelt und Verbraucherschutz Nordrhein-Westfalen. The study was conducted in accordance with the local legislation and institutional requirements.
Author contributions
BK: Conceptualization, Funding acquisition, Project administration, Resources, Supervision, Writing—original draft, Writing—review and editing. CH: Conceptualization, Data curation, Formal analysis, Investigation, Methodology, Software, Visualization, Writing—original draft, Writing—review and editing. TR: Data curation, Software, Writing—review and editing. FM: Conceptualization, Resources, Writing—review and editing. KJ: Writing—review and editing.
Funding
The author(s) declare financial support was received for the research, authorship, and/or publication of this article. This study was funded by the Deutsche Forschungsgemeinschaft (DFG, German Research Foundation)−368482240/GRK2416 and GRK2610: Innoretvision.
Acknowledgments
The authors would like to thank Dr. Thomas Künzel for his help with the analysis of the synaptic event data and Prof. Dr. Peter Walter and Dr. Sandra Johnen (Department of Ophthalmology, RWTH Aachen University) for providing us with initial rd10 mice.
Conflict of interest
The authors declare that the research was conducted in the absence of any commercial or financial relationships that could be construed as a potential conflict of interest.
The author(s) declared that they were an editorial board member of Frontiers, at the time of submission. This had no impact on the peer review process and the final decision.
Publisher's note
All claims expressed in this article are solely those of the authors and do not necessarily represent those of their affiliated organizations, or those of the publisher, the editors and the reviewers. Any product that may be evaluated in this article, or claim that may be made by its manufacturer, is not guaranteed or endorsed by the publisher.
Supplementary material
The Supplementary Material for this article can be found online at: https://www.frontiersin.org/articles/10.3389/fncel.2023.1258773/full#supplementary-material
References
Aghaizu, N. D., Kruczek, K., Gonzalez-Cordero, A., Ali, R. R., and Pearson, R. A. (2017). Pluripotent stem cells and their utility in treating photoreceptor degenerations. Prog. Brain Res. 231, 191–223. doi: 10.1016/bs.pbr.2017.01.001
Ahn, J., Cha, S., Choi, K.-E., Kim, S.-W., Yoo, Y., and Goo, Y. S. (2022). Correlated activity in the degenerate retina inhibits focal response to electrical stimulation. Front. Cell. Neurosci. 16, 889663. doi: 10.3389/fncel.2022.889663
Alejandre-García, T., Kim, S., Pérez-Ortega, J., and Yuste, R. (2022). Intrinsic excitability mechanisms of neuronal ensemble formation. Elife 11, e77470. doi: 10.7554/eLife.77470.sa2
Ayton, L. N., Barnes, N., Dagnelie, G., Fujikado, T., Goetz, G., Hornig, R., et al. (2020). An update on retinal prostheses. Clin. Neurophysiol. 131, 1383–1398. doi: 10.1016/j.clinph.2019.11.029
Barhoum, R., Martínez-Navarrete, G., Corrochano, S., Germain, F., Fernandez-Sanchez, L., de la Rosa, E. J., et al. (2008). Functional and structural modifications during retinal degeneration in the rd10 mouse. Neuroscience 155, 698–713. doi: 10.1016/j.neuroscience.2008.06.042
Barnes, S. J., Sammons, R. P., Jacobsen, R. I., Mackie, J., Keller, G. B., and Keck, T. (2015). Subnetwork-specific homeostatic plasticity in mouse visual cortex in vivo. Neuron 86, 1290–1303. doi: 10.1016/j.neuron.2015.05.010
Barone, I., Novelli, E., and Strettoi, E. (2014). Long-term preservation of cone photoreceptors and visual acuity in rd10 mutant mice exposed to continuous environmental enrichment. Mol. Vis. 20, 1545–1556.
Beauchamp, M. S., Oswalt, D., Sun, P., Foster, B. L., Magnotti, J. F., Niketeghad, S., et al. (2020). Dynamic stimulation of visual cortex produces form vision in sighted and blind humans. Cell 181, 774–783.e5. doi: 10.1016/j.cell.2020.04.033
Begenisic, T., Mazziotti, R., Sagona, G., Lupori, L., Sale, A., Galli, L., et al. (2020). Preservation of visual cortex plasticity in retinitis pigmentosa. Neuroscience 424, 205–210. doi: 10.1016/j.neuroscience.2019.10.045
Bhandari, A., Smith, J. C., Zhang, Y., Jensen, A. A., Reid, L., Goeser, T., et al. (2019). Early-stage ocular hypertension alters retinal ganglion cell synaptic transmission in the visual thalamus. Front. Cell. Neurosci. 13, 426. doi: 10.3389/fncel.2019.00426
Bhattacharyya, A. (2022). The detrimental effects of progression of retinal degeneration in the visual cortex. Front. Cell. Neurosci. 16, 904175. doi: 10.3389/fncel.2022.904175
Biswas, S., Haselier, C., Mataruga, A., Thumann, G., Walter, P., and Müller, F. (2014). Pharmacological analysis of intrinsic neuronal oscillations in rd10 retina. PLoS ONE 9, e99075. doi: 10.1371/journal.pone.0099075
Brown, A. P. Y., Cossell, L., and Margrie, T. W. (2019). Visual experience regulates the intrinsic excitability of visual cortical neurons to maintain sensory function. Cell Rep 27, 685–689.e4. doi: 10.1016/j.celrep.2019.03.073
Caravaca-Rodriguez, D., Gaytan, S. P., Suaning, G. J., and Barriga-Rivera, A. (2022). Implications of neural plasticity in retinal prosthesis. Invest. Ophthalmol. Vis. Sci. 63, 11. doi: 10.1167/iovs.63.11.11
Chang, B. (2016). “Animal models of retinitis pigmentosa (RP),” in Animal Models of Ophthalmic Diseases Essentials in Ophthalmology, ed C.-C. Chan (Cham: Springer International Publishing), 101–116.
Chang, B., Hawes, N. L., Pardue, M. T., German, A. M., Hurd, R. E., Davisson, M. T., et al. (2007). Two mouse retinal degenerations caused by missense mutations in the beta-subunit of rod cGMP phosphodiesterase gene. Vision Res. 47, 624–633. doi: 10.1016/j.visres.2006.11.020
Chen, K., Hou, B., Zhao, Y., Yuan, P., Yao, D., and Chan, L. L. H. (2020). Residual contrast response in primary visual cortex of rats with inherited retinal degeneration. Vision Res. 177, 6–11. doi: 10.1016/j.visres.2020.08.007
Chen, K., Wang, Y., Liang, X., Zhang, Y., Ng, T. K., and Chan, L. L. (2016). Electrophysiology alterations in primary visual cortex neurons of retinal degeneration (S334ter-line-3) rats. Sci. Rep. 6, 26793. doi: 10.1038/srep26793
Cheng, S., Butrus, S., Tan, L., Xu, R., Sagireddy, S., Trachtenberg, J. T., et al. (2022). Vision-dependent specification of cell types and function in the developing cortex. Cell 185, 311–327.e24. doi: 10.1016/j.cell.2021.12.022
Ciganok-Hückels, N., Jehasse, K., Kricsfalussy-Hrabár, L., Ritter, M., Rüland, T., and Kampa, B. M. (2023). Postnatal development of electrophysiological and morphological properties in layer 2/3 and layer 5 pyramidal neurons in the mouse primary visual cortex. Cereb. Cortex 33, 5875–5884. doi: 10.1093/cercor/bhac467
Clements, J. D., and Bekkers, J. M. (1997). Detection of spontaneous synaptic events with an optimally scaled template. Biophys. J. 73, 220–229. doi: 10.1016/S0006-3495(97)78062-7
Debanne, D., Inglebert, Y., and Russier, M. (2019). Plasticity of intrinsic neuronal excitability. Curr. Opin. Neurobiol. 54, 73–82. doi: 10.1016/j.conb.2018.09.001
Debanne, D., and Russier, M. (2019). The contribution of ion channels in input-output plasticity. Neurobiol. Learn. Mem. 166, 107095. doi: 10.1016/j.nlm.2019.107095
Desai, N. S., Cudmore, R. H., Nelson, S. B., and Turrigiano, G. G. (2002). Critical periods for experience-dependent synaptic scaling in visual cortex. Nat. Neurosci. 5, 783–789. doi: 10.1038/nn878
Desai, N. S., Rutherford, L. C., and Turrigiano, G. G. (1999). Plasticity in the intrinsic excitability of cortical pyramidal neurons. Nat. Neurosci. 2, 515–520. doi: 10.1038/9165
Dias, M. F., Joo, K., Kemp, J. A., Fialho, S. L., da Silva Cunha, A., Woo, S. J., et al. (2018). Molecular genetics and emerging therapies for retinitis pigmentosa: basic research and clinical perspectives. Prog. Retin. Eye Res. 63, 107–131. doi: 10.1016/j.preteyeres.2017.10.004
Dräger, U. C., and Hubel, D. H. (1978). Studies of visual function and its decay in mice with hereditary retinal degeneration. J. Comp. Neurol. 180, 85–114. doi: 10.1002/cne.901800107
Espinosa, J. S., and Stryker, M. P. (2012). Development and plasticity of the primary visual cortex. Neuron 75, 230–249. doi: 10.1016/j.neuron.2012.06.009
Etherington, S. J., and Williams, S. R. (2011). Postnatal development of intrinsic and synaptic properties transforms signaling in the layer 5 excitatory neural network of the visual cortex. J. Neurosci. 31, 9526–9537. doi: 10.1523/JNEUROSCI.0458-11.2011
Farnum, A., and Pelled, G. (2020). New vision for visual prostheses. Front. Neurosci. 14, 36. doi: 10.3389/fnins.2020.00036
Fernández, E., Alfaro, A., Soto-Sánchez, C., Gonzalez-Lopez, P., Lozano, A. M., Peña, S., et al. (2021). Visual percepts evoked with an intracortical 96-channel microelectrode array inserted in human occipital cortex. J. Clin. Invest. 131, e151331. doi: 10.1172/JCI151331
Gao, M., Maynard, K. R., Chokshi, V., Song, L., Jacobs, C., Wang, H., et al. (2014). Rebound potentiation of inhibition in juvenile visual cortex requires vision-induced BDNF expression. J. Neurosci. 34, 10770–10779. doi: 10.1523/JNEUROSCI.5454-13.2014
Gao, M., Whitt, J. L., Huang, S., Lee, A., Mihalas, S., Kirkwood, A., et al. (2017). Experience-dependent homeostasis of “noise” at inhibitory synapses preserves information coding in adult visual cortex. Philos. Trans. R. Soc. Lond. B Biol. Sci. 372, 20160156. doi: 10.1098/rstb.2016.0156
Gargini, C., Terzibasi, E., Mazzoni, F., and Strettoi, E. (2007). Retinal organization in the retinal degeneration 10 (rd10) mutant mouse: a morphological and ERG study. J. Comp. Neurol. 500, 222–238. doi: 10.1002/cne.21144
Gehlen, J., Esser, S., Schaffrath, K., Johnen, S., Walter, P., and Müller, F. (2020). Blockade of retinal oscillations by benzodiazepines improves efficiency of electrical stimulation in the mouse model of RP, rd10. Invest. Ophthalmol. Vis. Sci. 61, 37. doi: 10.1167/iovs.61.13.37
Goel, A., and Lee, H.-K. (2007). Persistence of experience-induced homeostatic synaptic plasticity through adulthood in superficial layers of mouse visual cortex. J. Neurosci. 27, 6692–6700. doi: 10.1523/JNEUROSCI.5038-06.2007
Goo, Y. S., Park, D. J., Ahn, J. R., and Senok, S. S. (2016). Spontaneous oscillatory rhythms in the degenerating mouse retina modulate retinal ganglion cell responses to electrical stimulation. Front. Cell. Neurosci. 9, 512. doi: 10.3389/fncel.2015.00512
Gordon, J. A., and Stryker, M. P. (1996). Experience-dependent plasticity of binocular responses in the primary visual cortex of the mouse. J. Neurosci. 16, 3274–3286. doi: 10.1523/JNEUROSCI.16-10-03274.1996
Han, E. B., and Stevens, C. F. (2009). Development regulates a switch between post- and presynaptic strengthening in response to activity deprivation. Proc. Natl. Acad. Sci. U. S. A. 106, 10817–10822. doi: 10.1073/pnas.0903603106
Hartong, D. T., Berson, E. L., and Dryja, T. P. (2006). Retinitis pigmentosa. Lancet 368, 1795–1809. doi: 10.1016/S0140-6736(06)69740-7
Hengen, K. B., Lambo, M. E., Van Hooser, S. D., Katz, D. B., and Turrigiano, G. G. (2013). Firing rate homeostasis in visual cortex of freely behaving rodents. Neuron 80, 335–342. doi: 10.1016/j.neuron.2013.08.038
Hooks, B. M., and Chen, C. (2007). Critical periods in the visual system: changing views for a model of experience-dependent plasticity. Neuron 56, 312–326. doi: 10.1016/j.neuron.2007.10.003
Hoy, J. L., and Niell, C. M. (2015). Layer-specific refinement of visual cortex function after eye opening in the awake mouse. J. Neurosci. 35, 3370–3383. doi: 10.1523/JNEUROSCI.3174-14.2015
Humayun, M. S., Dorn, J. D., da Cruz, L., Dagnelie, G., Sahel, J.-A., Stanga, P. E., et al. (2012). Interim results from the international trial of Second Sight's visual prosthesis. Ophthalmology 119, 779–788. doi: 10.1016/j.ophtha.2011.09.028
Ishikawa, A. W., Komatsu, Y., and Yoshimura, Y. (2014). Experience-dependent emergence of fine-scale networks in visual cortex. J. Neurosci. 34, 12576–12586. doi: 10.1523/JNEUROSCI.1346-14.2014
Ivanova, E., Yee, C. W., Baldoni, R., and Sagdullaev, B. T. (2016). Aberrant activity in retinal degeneration impairs central visual processing and relies on Cx36-containing gap junctions. Exp. Eye Res. 150, 81–89. doi: 10.1016/j.exer.2015.05.013
Kannan, M., Gross, G. G., Arnold, D. B., and Higley, M. J. (2016). Visual deprivation during the critical period enhances layer 2/3 GABAergic inhibition in mouse V1. J. Neurosci. 36, 5914–5919. doi: 10.1523/JNEUROSCI.0051-16.2016
Kasper, E. M., Larkman, A. U., Lübke, J., and Blakemore, C. (1994). Pyramidal neurons in layer 5 of the rat visual cortex. II. Development of electrophysiological properties. J. Comp. Neurol. 339, 475–494. doi: 10.1002/cne.903390403
Keck, T., Hübener, M., and Bonhoeffer, T. (2017). Interactions between synaptic homeostatic mechanisms: an attempt to reconcile BCM theory, synaptic scaling, and changing excitation/inhibition balance. Curr. Opin. Neurobiol. 43, 87–93. doi: 10.1016/j.conb.2017.02.003
Keserü, M., Feucht, M., Bornfeld, N., Laube, T., Walter, P., Rössler, G., et al. (2012). Acute electrical stimulation of the human retina with an epiretinal electrode array. Acta Ophthalmol. 90, e1–8. doi: 10.1111/j.1755-3768.2011.02288.x
Kleinlogel, S., Vogl, C., Jeschke, M., Neef, J., and Moser, T. (2020). Emerging approaches for restoration of hearing and vision. Physiol. Rev. 100, 1467–1525. doi: 10.1152/physrev.00035.2019
Kroon, T., van Hugte, E., van Linge, L., Mansvelder, H. D., and Meredith, R. M. (2019). Early postnatal development of pyramidal neurons across layers of the mouse medial prefrontal cortex. Sci. Rep. 9, 5037. doi: 10.1038/s41598-019-41661-9
Lambo, M. E., and Turrigiano, G. G. (2013). Synaptic and intrinsic homeostatic mechanisms cooperate to increase L2/3 pyramidal neuron excitability during a late phase of critical period plasticity. J. Neurosci. 33, 8810–8819. doi: 10.1523/JNEUROSCI.4502-12.2013
Leinonen, H., Lyon, D. C., Palczewski, K., and Foik, A. T. (2022). Visual system hyperexcitability and compromised V1 receptive field properties in early-stage retinitis pigmentosa in mice. eNeuro 9, ENEURO.0107-22.2022. doi: 10.1523/ENEURO.0107-22.2022
Lu, W., and Constantine-Paton, M. (2004). Eye opening rapidly induces synaptic potentiation and refinement. Neuron 43, 237–249. doi: 10.1016/j.neuron.2004.06.031
Maffei, A., Lambo, M. E., and Turrigiano, G. G. (2010). Critical period for inhibitory plasticity in rodent binocular V1. J. Neurosci. 30, 3304–3309. doi: 10.1523/JNEUROSCI.5340-09.2010
Maffei, A., Nataraj, K., Nelson, S. B., and Turrigiano, G. G. (2006). Potentiation of cortical inhibition by visual deprivation. Nature 443, 81–84. doi: 10.1038/nature05079
Maffei, A., Nelson, S. B., and Turrigiano, G. G. (2004). Selective reconfiguration of layer 4 visual cortical circuitry by visual deprivation. Nat. Neurosci. 7, 1353–1359. doi: 10.1038/nn1351
Maffei, A., and Turrigiano, G. G. (2008). Multiple modes of network homeostasis in visual cortical layer 2/3. J. Neurosci. 28, 4377–4384. doi: 10.1523/JNEUROSCI.5298-07.2008
Margolis, D. J., and Detwiler, P. B. (2011). Cellular origin of spontaneous ganglion cell spike activity in animal models of retinitis pigmentosa. J. Ophthalmol. 2011, 507037. doi: 10.1155/2011/507037
Margolis, D. J., Newkirk, G., Euler, T., and Detwiler, P. B. (2008). Functional stability of retinal ganglion cells after degeneration-induced changes in synaptic input. J. Neurosci. 28, 6526–6536. doi: 10.1523/JNEUROSCI.1533-08.2008
Martinez-Galan, J. R., Garcia-Belando, M., Cabanes-Sanchis, J. J., and Caminos, E. (2022). Pre- and postsynaptic alterations in the visual cortex of the P23H-1 retinal degeneration rat model. Front. Neuroanat. 16, 1000085. doi: 10.3389/fnana.2022.1000085
Maurer, D. (2017). Critical periods re-examined: Evidence from children treated for dense cataracts. Cogn. Dev. 42, 27–36. doi: 10.1016/j.cogdev.2017.02.006
May, E., Arach, P., Kishiki, E., Geneau, R., Maehara, G., Sukhai, M., et al. (2022). Learning to see after early and extended blindness: a scoping review. Front. Psychol. 13, 954328. doi: 10.3389/fpsyg.2022.954328
Mazzoni, F., Novelli, E., and Strettoi, E. (2008). Retinal ganglion cells survive and maintain normal dendritic morphology in a mouse model of inherited photoreceptor degeneration. J. Neurosci. 28, 14282–14292. doi: 10.1523/JNEUROSCI.4968-08.2008
Murthy, V. N., Schikorski, T., Stevens, C. F., and Zhu, Y. (2001). Inactivity produces increases in neurotransmitter release and synapse size. Neuron 32, 673–682. doi: 10.1016/S0896-6273(01)00500-1
Nahmani, M., and Turrigiano, G. G. (2014). Deprivation-induced strengthening of presynaptic and postsynaptic inhibitory transmission in layer 4 of visual cortex during the critical period. J. Neurosci. 34, 2571–2582. doi: 10.1523/JNEUROSCI.4600-13.2014
Nataraj, K., Le Roux, N., Nahmani, M., Lefort, S., and Turrigiano, G. (2010). Visual deprivation suppresses L5 pyramidal neuron excitability by preventing the induction of intrinsic plasticity. Neuron 68, 750–762. doi: 10.1016/j.neuron.2010.09.033
Newton, F., and Megaw, R. (2020). Mechanisms of photoreceptor death in retinitis pigmentosa. Genes 11, 1120. doi: 10.3390/genes11101120
Okun, M., and Lampl, I. (2008). Instantaneous correlation of excitation and inhibition during ongoing and sensory-evoked activities. Nat. Neurosci. 11, 535–537. doi: 10.1038/nn.2105
Oswald, A.-M. M., and Reyes, A. D. (2008). Maturation of intrinsic and synaptic properties of layer 2/3 pyramidal neurons in mouse auditory cortex. J. Neurophysiol. 99, 2998–3008. doi: 10.1152/jn.01160.2007
Pennesi, M. E., Michaels, K. V., Magee, S. S., Maricle, A., Davin, S. P., Garg, A. K., et al. (2012). Long-term characterization of retinal degeneration in rd1 and rd10 mice using spectral domain optical coherence tomography. Invest. Ophthalmol. Vis. Sci. 53, 4644–4656. doi: 10.1167/iovs.12-9611
Perez-García, P., Pardillo-Díaz, R., Geribaldi-Doldán, N., Gómez-Oliva, R., Domínguez-García, S., Castro, C., et al. (2021). Refinement of active and passive membrane properties of layer V pyramidal neurons in rat primary motor cortex during postnatal development. Front. Mol. Neurosci. 14, 754393. doi: 10.3389/fnmol.2021.754393
Pietra, G., Bonifacino, T., Talamonti, D., Bonanno, G., Sale, A., Galli, L., et al. (2021). Visual cortex engagement in retinitis pigmentosa. Int. J. Mol. Sci. 22, 9412. doi: 10.3390/ijms22179412
Prosseda, P. P., Tran, M., Kowal, T., Wang, B., and Sun, Y. (2022). Advances in ophthalmic optogenetics: approaches and applications. Biomolecules 12, 269. doi: 10.3390/biom12020269
Rincón Montes, V., Gehlen, J., Lück, S., Mokwa, W., Müller, F., Walter, P., et al. (2019). Toward a bidirectional communication between retinal cells and a prosthetic device - a proof of concept. Front. Neurosci. 13, 367. doi: 10.3389/fnins.2019.00367
Roelfsema, P. R. (2020). Writing to the mind's eye of the blind. Cell 181, 758–759. doi: 10.1016/j.cell.2020.03.014
Rösch, S., Johnen, S., Müller, F., Pfarrer, C., and Walter, P. (2014). Correlations between ERG, OCT, and anatomical findings in the rd10 mouse. J. Ophthalmol. 2014, 874751. doi: 10.1155/2014/874751
Rüland, T. (2023). Neuronal Activity in Primary Visual Cortex and Superior Colliculus of the rd10 Mouse Model for Retinal Degeneration. Available online at: https://publications.rwth-aachen.de (accessed September 06, 2023).
Sahel, J.-A., Boulanger-Scemama, E., Pagot, C., Arleo, A., Galluppi, F., Martel, J. N., et al. (2021). Partial recovery of visual function in a blind patient after optogenetic therapy. Nat. Med. 27, 1223–1229. doi: 10.1038/s41591-021-01351-4
Sahel, J.-A., Marazova, K., and Audo, I. (2014). Clinical characteristics and current therapies for inherited retinal degenerations. Cold Spring Harb. Perspect. Med. 5, a017111. doi: 10.1101/cshperspect.a017111
Sanchez-Vives, M. V., and McCormick, D. A. (2000). Cellular and network mechanisms of rhythmic recurrent activity in neocortex. Nat. Neurosci. 3, 1027–1034. doi: 10.1038/79848
Sato, M., and Stryker, M. P. (2008). Distinctive features of adult ocular dominance plasticity. J. Neurosci. 28, 10278–10286. doi: 10.1523/JNEUROSCI.2451-08.2008
Segalowitz, S. J., Sternin, A., Lewis, T. L., Dywan, J., and Maurer, D. (2017). Electrophysiological evidence of altered visual processing in adults who experienced visual deprivation during infancy. Dev. Psychobiol. 59, 375–389. doi: 10.1002/dev.21502
Srikantharajah, K., Medinaceli Quintela, R., Doerenkamp, K., Kampa, B. M., Musall, S., Rothermel, M., et al. (2021). Minimally-invasive insertion strategy and in vivo evaluation of multi-shank flexible intracortical probes. Sci. Rep. 11, 18920. doi: 10.1038/s41598-021-97940-x
Stasheff, S. F. (2018). Clinical impact of spontaneous hyperactivity in degenerating retinas: significance for diagnosis, symptoms, and treatment. Front. Cell. Neurosci. 12, 298. doi: 10.3389/fncel.2018.00298
Stasheff, S. F., Shankar, M., and Andrews, M. P. (2011). Developmental time course distinguishes changes in spontaneous and light-evoked retinal ganglion cell activity in rd1 and rd10 mice. J. Neurophysiol. 105, 3002–3009. doi: 10.1152/jn.00704.2010
Tatti, R., Swanson, O. K., Lee, M. S. E., and Maffei, A. (2017). Layer-specific developmental changes in excitation and inhibition in rat primary visual cortex. eNeuro 4, ENEURO.0402-17.2017. doi: 10.1523/ENEURO.0402-17.2017
Telias, M., Denlinger, B., Helft, Z., Thornton, C., Beckwith-Cohen, B., and Kramer, R. H. (2019). Retinoic acid induces hyperactivity, and blocking its receptor unmasks light responses and augments vision in retinal degeneration. Neuron 102, 574–586.e5. doi: 10.1016/j.neuron.2019.02.015
Turrigiano, G. G. (2017). The dialectic of Hebb and homeostasis. Philos. Trans. R. Soc. Lond. B,. Biol. Sci. 372, 20160258. doi: 10.1098/rstb.2016.0258
van Aerde, K. I., and Feldmeyer, D. (2015). Morphological and physiological characterization of pyramidal neuron subtypes in rat medial prefrontal cortex. Cereb. Cortex 25, 788–805. doi: 10.1093/cercor/bht278
Van Hook, M. J., Monaco, C., Bierlein, E. R., and Smith, J. C. (2021). Neuronal and synaptic plasticity in the visual thalamus in mouse models of glaucoma. Front. Cell. Neurosci. 14, 626056. doi: 10.3389/fncel.2020.626056
Wang, J., Zhao, R., Li, P., Fang, Z., Li, Q., Han, Y., et al. (2022). Clinical progress and optimization of information processing in artificial visual prostheses. Sensors 22, 6544. doi: 10.3390/s22176544
Wang, Y., Chen, K., Xu, P., Ng, T. K., and Chan, L. L. H. (2016). Spontaneous neural activity in the primary visual cortex of retinal degenerated rats. Neurosci. Lett. 623, 42–46. doi: 10.1016/j.neulet.2016.04.062
Wefelmeyer, W., Puhl, C. J., and Burrone, J. (2016). Homeostatic plasticity of subcellular neuronal structures: from inputs to outputs. Trends Neurosci. 39, 656–667. doi: 10.1016/j.tins.2016.08.004
Wen, W., and Turrigiano, G. G. (2021). Developmental regulation of homeostatic plasticity in mouse primary visual cortex. J. Neurosci. 41, 9891–9905. doi: 10.1523/JNEUROSCI.1200-21.2021
Xiang, Y., Yang, J., Gao, L., Chen, Z., Chen, J., Yang, Z., et al. (2023). Early visual deprivation impairs functional development of the visual ventral stream. Invest. Ophthalmol. Vis. Sci. 64, 1. doi: 10.1167/iovs.64.11.1
Yue, L., Castillo, J., Gonzalez, A. C., Neitz, J., and Humayun, M. S. (2021). Restoring color perception to the blind: an electrical stimulation strategy of retina in patients with end-stage retinitis pigmentosa. Ophthalmology 128, 453–462. doi: 10.1016/j.ophtha.2020.08.019
Zhang, Z. (2004). Maturation of layer V pyramidal neurons in the rat prefrontal cortex: intrinsic properties and synaptic function. J. Neurophysiol. 91, 1171–1182. doi: 10.1152/jn.00855.2003
Zhao, C., Dreosti, E., and Lagnado, L. (2011). Homeostatic synaptic plasticity through changes in presynaptic calcium influx. J. Neurosci. 31, 7492–7496. doi: 10.1523/JNEUROSCI.6636-10.2011
Keywords: visual cortex, rd10 mouse model, retinitis pigmentosa, electrophysiology, patch-clamp
Citation: Halfmann C, Rüland T, Müller F, Jehasse K and Kampa BM (2023) Electrophysiological properties of layer 2/3 pyramidal neurons in the primary visual cortex of a retinitis pigmentosa mouse model (rd10). Front. Cell. Neurosci. 17:1258773. doi: 10.3389/fncel.2023.1258773
Received: 14 July 2023; Accepted: 25 August 2023;
Published: 15 September 2023.
Edited by:
Michele Giugliano, International School for Advanced Studies (SISSA), ItalyReviewed by:
Stefano Di Marco, Fondazione Istituto Italiano di Tecnologia, ItalyAdema Ribic, University of Virginia, United States
Copyright © 2023 Halfmann, Rüland, Müller, Jehasse and Kampa. This is an open-access article distributed under the terms of the Creative Commons Attribution License (CC BY). The use, distribution or reproduction in other forums is permitted, provided the original author(s) and the copyright owner(s) are credited and that the original publication in this journal is cited, in accordance with accepted academic practice. No use, distribution or reproduction is permitted which does not comply with these terms.
*Correspondence: Björn M. Kampa, a2FtcGFAYnJhaW4ucnd0aC1hYWNoZW4uZGU=