

 and
and - Department of Mathematics, University of Pittsburgh, Pittsburgh, PA, USA
Spike trains from neurons in the basal ganglia of parkinsonian primates show increased pairwise correlations, oscillatory activity, and burst rate compared to those from neurons recorded during normal brain activity. However, it is not known how these changes affect the behavior of downstream thalamic neurons. To understand how patterns of basal ganglia population activity may affect thalamic spike statistics, we study pairs of model thalamocortical (TC) relay neurons receiving correlated inhibitory input from the internal segment of the globus pallidus (GPi), a primary output nucleus of the basal ganglia. We observe that the strength of correlations of TC neuron spike trains increases with the GPi correlation level, and bursty firing patterns such as those seen in the parkinsonian GPi allow for stronger transfer of correlations than do firing patterns found under normal conditions. We also show that the T-current in the TC neurons does not significantly affect correlation transfer, despite its pronounced effects on spiking. Oscillatory firing patterns in GPi are shown to affect the timescale at which correlations are best transferred through the system. To explain this last result, we analytically compute the spike count correlation coefficient for oscillatory cases in a reduced point process model. Our analysis indicates that the dependence of the timescale of correlation transfer is robust to different levels of input spike and rate correlations and arises due to differences in instantaneous spike correlations, even when the long timescale rhythmic modulations of neurons are identical. Overall, these results show that parkinsonian firing patterns in GPi do affect the transfer of correlations to the thalamus.
Introduction
Much research has been dedicated to the study of how parkinsonian conditions affect the firing patterns of the basal ganglia. Hallmarks of the spiking activity in parkinsonian basal ganglia are oscillatory firing patterns, in which neurons' firing rates vary in a regular way over time, and increased burstiness (reviewed in Rivlin-Etzion et al., 2006; Galvan and Wichmann, 2008). Specifically, an increase in the rate of oscillatory bursts has been found in neurons in the globus pallidus (GPi) of monkeys treated with 1-methyl-4-phenyl-1,2,3,6-tetrahydropyridine (MPTP), which induces a parkinsonian state (Bergman et al., 1999; Wichmann and Soares, 2006). Computational studies have suggested that these changes in the firing patterns of neurons in the basal ganglia can compromise the relay capabilities of thalamocortical (TC) neurons to which GPi outputs project (Rubin and Terman, 2004; Guo et al., 2008; Cagnan et al., 2009; Pirini et al., 2009; Dorval et al., 2010).
Parkinsonian changes in basal ganglia activity extend beyond changes in individual neurons' firing patterns, however, to include altered coordination of activity of neuronal populations within the basal ganglia. Experimental studies have provided evidence that the basal ganglia are a collection of circuits that function independently of one another under normal conditions, but that this segregation is broken down in parkinsonism (Filion et al., 1988; Bergman et al., 1998; Bronfeld and Bar-Gad, 2011). In particular, while little correlation is normally present in the activity of GPi neurons (Nini et al., 1995; Bar-Gad et al., 2003), significant correlations between the outputs of GPi neurons arise in non-human primates treated with MPTP (Nini et al., 1995; Bergman et al., 1998; Raz et al., 2000; Heimer et al., 2006) and in humans with Parkinson's disease (Hurtado et al., 1999; Gale et al., 2008). While the implications of parkinsonian changes in single GPi neuron firing patterns have been considered theoretically, the effects of the temporal relationships emerging within GPi population activity have yet to be investigated computationally.
The primary targets of GPi motor outputs are in the thalamus (DeVito and Anderson, 1982; Jones, 2007) and under normal conditions, inhibitory signals from GPi to TC neurons appear to modulate thalamic activity that is driven by other sources, such as excitatory inputs from cortex (Deniau and Chevalier, 1985; Inase et al., 1996). Because GPi inputs to thalamus are inhibitory, it is not clear how parkinsonian increases in correlations within GPi will be transferred to thalamus or how shared changes in GPi firing patterns will affect this correlation transfer; however, an enhancement in correlations and loss of specificity in the stimuli that evoke responses has been found in the thalamic targets of GPi outputs (Pessiglione et al., 2005). The primary aim of this work is to address these questions about correlation transfer computationally. Correlation transfer has been studied extensively in generic feedforward (Stroeve and Gielen, 2001; Galan et al., 2006; Moreno-Bote and Parga, 2006; de la Rocha et al., 2007; Marella and Ermentrout, 2008; Shea-Brown et al., 2008; Ostojic et al., 2009; Barreiro et al., 2010; Tchumatchenko et al., 2010; Rosenbaum and Josic, 2011) and recurrent networks (Doiron et al., 2003, 2004; Lindner et al., 2005; Kriener et al., 2008; Moreno-Bote et al., 2008; Renart et al., 2010). These studies provide a general framework to study correlation transfer; however, in all of these cases, the neuron models did not include the requisite ionic channels for burst discharge and the stochastic input was stationary in time. These assumptions do not adequately model the GPi-thalamic circuit in either normal or parkinsonian conditions, and in our study we extend the correlation transfer framework to include these two important features.
To this end, we subjected pairs of computational model TC neurons to synthetic GPi inputs designed to exhibit various parkinsonian firing patterns, and we studied how these patterns affect the transfer of correlations to these model neurons. Two of our main findings are that bursty GPi patterns enhance thalamic sensitivity to input correlations and that oscillatory input patterns induce oscillations in the timescale of thalamic correlation. We show that the correlation transfer of conductance-based models is very similar to that of integrate-and-fire-or-burst (IFB) models, suggesting that our findings do not arise from particular modeling assumptions. We also show that a minimal point process model is sufficient to capture some of the important trends in correlation transfer seen in the computational models. In particular, under an assumption of rhythmicity in GPi activity there are specific timescales where correlation transfer is maximal. In total, we show how the pattern of GPi activity observed in parkinsonian conditions has distinct consequences for the magnitude and timescale of correlated firing of TC neurons. These results offer the first insights into the details of how a breakdown in GPi response segregation, thought to be a neural correlate of motor pathologies associated with Parkinson's disease, might propagate to other brain areas and thereby impact motor outputs.
Methods
Model of Pallido-Thalamic Correlation Transfer
To investigate how correlations are transferred to the thalamus by GPi activity, we consider two identical model TC neurons. Each neuron receives an independent excitatory input stream from cortex, assumed to be a spike train with a mean rate μ = 20. Hz and Poisson statistics. Each neuron also receives inhibitory input from the GPi, modeled as a time inhomogeneous Poisson spike train, with time-dependent rate λ(t), discussed further below. We include a partial overlap of the GPi spike trains to the two TC neurons, representing divergence in the synaptic projections from GPi to thalamus (Figure 1A), with the fraction of each neuron's spikes that are shared by the other neuron denoted by c ∈ [0, 1]. This degree of input sharing can be achieved by generating three independent spike trains, two with rate λ (t)(1 − c) that are each sent to one neuron only, and one with rate λ (t)c that goes to both neurons, as shown in Figure 1A. (In practice, we use an equivalent algorithm of generating a single train with rate λ (t)/c and, when a spike occurs, sending it to each TC neuron with probability c, checked independently for each of the TC neurons. This approach is advantageous in that it requires only one spike train, not three, to be generated and easily generalizes to larger populations.)
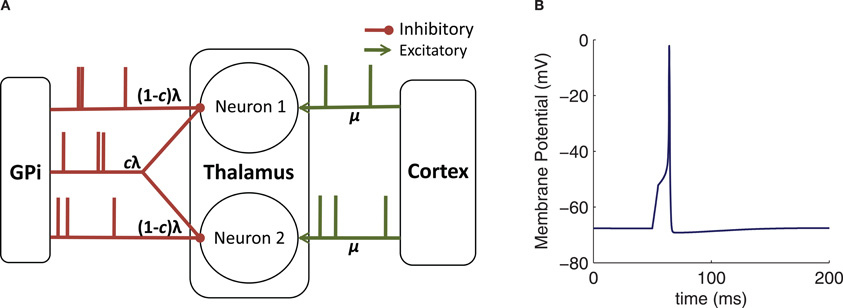
Figure 1. Model schematic and basic behavior. (A) Diagram of the connectivity and inputs used for our computational models. Here, λ denotes a time-dependent rate, c a shared spike fraction, and μ a constant rate. (B) Sample response of the conductance-based TC neuron model to the injection of a 5 ms pulse of 3 pA current.
We consider two different thalamic neuron models. The first is a conductance-based model, and the second is a reduced IFB model. Results using both models are compared, showing the accuracy with which the reduced model replicates the conductance-based model results. In this way, we illustrate that certain properties are unlikely to depend strongly on assumptions inherent in particular model formulations.
Conductance-Based Thalamic Model
In this model, the thalamic neurons are described using Hodgkin–Huxley-style equations (Hodgkin and Huxley, 1952) in which each intrinsic current has a time dependent conductance and a reversal potential. The parameters for this model are given in Table 1. The model is a slight modification of a previously developed model of TC neurons (Rubin and Terman, 2004; Guo et al., 2008) and consists of the following ordinary differential equations:

Here, c is the capacitance in μF/cm2, V is a dynamic variable for the membrane potential of a thalamic neuron in mV, and the right-hand side of Equation (1) incorporates all of the ionic currents that affect this membrane potential. The first term, Iapp, is a constant current that determines the resting membrane potential and is chosen so the neuron is silent in the absence of fluctuations in the synaptic inputs. Each of the other currents is voltage-dependent and includes a parameter g*, the maximal conductance of the corresponding channel population in mS/cm2, and E*, the reversal potential of these channels in mV. The first voltage-dependent current is the leak current, a generic ion current given by Ileak = ḡleak(V − Eleak).
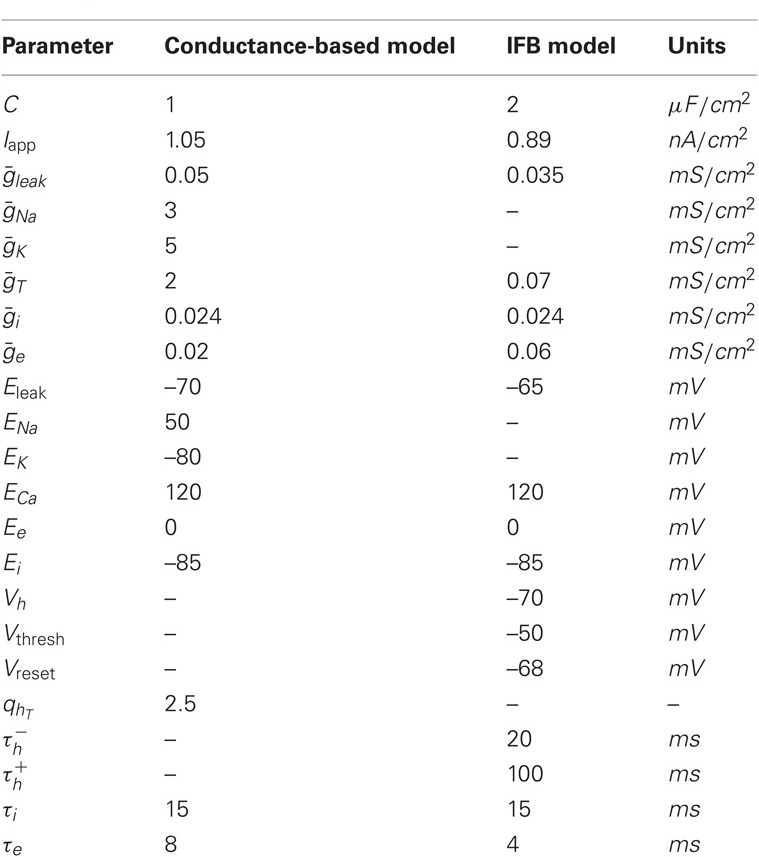
Table 1. Parameter values for the thalamic models..
The fast activating and slower inactivating sodium current is given by INa = ḡNa m3 h(V − ENa). Because the activation is fast, we approximate m by its voltage-dependent steady state value,
The sodium inactivation gate, h, is governed by Equation (2), with
The slower activating and non-inactivating potassium current is IK = ḡK n4(V − EK). We let n = 0.75(1 − h), which is a standard approximation (Rinzel, 1978).
The equation IT = ḡT m2ThT(V − ECa) describes the T-current. This depolarizing calcium current allows the TC neurons to fire characteristic rebound bursts subsequent to appropriate hyperpolarization. Because the activation gate, mT, is fast, we approximate it by
The dynamics of the slower inactivation gate, hT, is governed by Equation (3), with
Figure 1B shows the response of this neuron model to an injected current pulse.
The remaining two currents in the model represent inhibitory inputs from GPi and excitatory inputs from cortex, respectively. The inhibitory synaptic current has the form Iinhib = ḡisi(V − Ei). Here, si represents the synaptic filtering of the Poisson spike trains from GPi, which were described above. For a given GPi spike train starting from  the synaptic gating is determined by the solution to
  with initial condition si(0) = 0. Similarly, the excitatory input current has the form Iexcite = ḡese(V − Ee), where
  and se(0) = 0, for a cortical spike train
  also as described above.
Integrate-and-fire-or-burst (IFB) Thalamic Model
The IFB model was proposed as a simpler model that can capture the essential dynamics of a TC neuron's spike and burst responses (Smith et al., 2000). Each thalamic IFB neuron is governed by the following equations:
As in the conductance-based model, c is the capacitance, V is the membrane potential, Iapp is a constant applied current, Ileak = ḡleak(V − Eleak) is the leak current, and the parameters ḡ* and E* represent the maximal conductances and the reversal potentials of the various channels, respectively. As in the standard leaky integrate-and-fire (LIF) model, when V reaches Vthresh, a spike is counted and V is instantaneously reset to Vreset; when this occurs, we hold V = Vreset for a refractory period of 5 ms.
The main difference between system (4)–(5) and the standard LIF model is the presence of a current due to T-type calcium channels, IT = gThTH[V − Vh](V − ET), where H[x] is the Heaviside function, defined to be 0 for x < 0 and 1 for x > 0. As described by Equation (5), the inactivation variable hT begins to slowly deinactivate, with timescale  when the membrane potential is hyperpolarized below Vh. If the neuron is then depolarized to above Vh, the T-current immediately activates because of H[V − Vh], and hT begins to inactivate the T-current, with timescale
  The synaptic currents, Iexcite and Iinhib, in the IFB model are constructed in exactly the same way as in the conductance-based model and have the same physiological interpretations. The parameters used to simulate the model are given in Table 1.
Patterns of GPi Signals to Thalamus
We use four different patterns for λ(t) (Figures 2A-B). The normal λ(t) is fixed at 70 Hz, matching experimental rates reported from primate GPi under non-parkinsonian conditions (Raz et al., 2000; Wichmann and Soares, 2006; Rivlin-Etzion et al., 2008). For the oscillatory case, we constructed the firing rate λ(t) as a continuous, periodic function of time composed of a weighted sum of 21 sine waves, each oscillating about a mean rate of 80 Hz, with individual frequencies f1 = 5 Hz, f2 = 5.5 Hz,..., f21 = 15 Hz and with random phase shifts (Figure 2). If the resulting λ(t) ever went below 0, it was simply set equal to zero. The weight of the wave with frequency fi was chosen as the amplitude of a Gaussian frequency distribution, with mean 10 Hz and variance 1.5 Hz, evaluated at fi, for each i = 1,..., 21. The firing rate function was created in this way so that the location and width of the peak in the power spectrum of each of our computationally generated GPi spike trains qualitatively matched the power spectra of data taken from oscillatory neurons in the parkinsonian primate GPi, which in particular feature a prominent peak at a frequency near 10 Hz, typically in the 7.5–13.5 Hz range (Heimer et al., 2006) (see Figure A2A, in the Appendix).
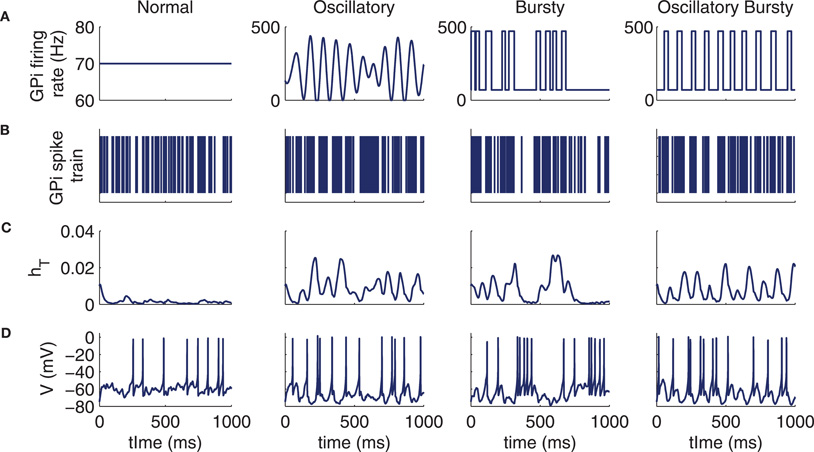
Figure 2. Example model behaviors for each of the four types of GPi input to thalamus: normal, oscillatory, bursty, and oscillatory bursts. (A) Sample GPi firing rates. (B) Corresponding examples of GPi spike trains. (C) T-current inactivation gate, hT, for the conductance-based thalamic model. (D) Spike train of conductance-based thalamic model neuron in response to Poisson excitatory input at 20 spikes per second in addition to the inhibitory input shown above.
The third GPi firing pattern we use is the bursty spike train. Here, the GPi firing rate is discontinuous in time, with a baseline firing rate of 70 Hz augmented by brief burst periods that push the firing rate to 470 Hz. The interburst intervals are Poisson distributed with mean time of 70 ms between bursts and the burst durations are selected from a Gaussian distribution (mean time of 30 ms and variance of 10 ms), yielding an overall mean GPi firing rate of 190 Hz (see below). The final GPi firing pattern that we consider is the case of oscillatory bursts; here the bursts are constructed as in the bursty case, with a baseline firing rate of 70 Hz, with burst durations taken from the same Gaussian distribution, and with a firing at a rate of 470 Hz within the bursts. The difference relative to the bursty case is that the waiting time between the bursts is taken from a Gaussian distribution (mean of 70 ms and a variance of 30 ms) as opposed to a Poisson distribution, increasing the regularity of burst times. These four GPi firing patterns give distinct patterning to thalamic responses, involving different levels of T-current recruitment determined by how the T-current inactivation variable hT tracks the effects of the inhibitory spike trains on membrane potential (Figures 2B-D).
Each of the last three cases represent firing patterns that have been observed to be enhanced in the primate GPi under parkinsonian conditions (Wichmann and Soares, 2006). The parameters used for the spike rates, oscillation frequency, and bursting statistics in Figure 2 are the same parameters used for the conductance-based model's GPi inputs for the remainder of the text, unless otherwise specified.
The quantitative specifics of λ(t) for the four cases were chosen so that the output firing rate of the thalamic neurons was roughly equivalent in all four cases (10.6 Hz for the normal and oscillatory cases and 8.6 Hz for the two bursty cases in the conductance-based model; approximately 6.5 Hz for all four cases in the IFB model). The GPi firing rates within bursts were selected to recruit the rebound mechanism in the thalamic models sufficiently to bring all of the bursty TC firing rates up toward their normal and oscillatory values, without causing any to become excessive (Guehl et al., 2003; Molnar et al., 2004; Pessiglione et al., 2005); with lower GPi firing rates within bursts, inhibition diminished regular TC spiking, and there were insufficient rebound spikes to compensate for this suppression. Although the GPi firing rate within bursts that we used and resulting overall bursty GPi firing rate exceed those found experimentally for single GPi neurons (Wichmann and Soares, 2006), it is possible that the collected inputs from all GPi neurons presynaptic to a TC neuron could achieve such rates; for our theoretical study, the resulting equilibration of TC firing rates across input conditions was necessary since output correlation is strongly dependent on output firing rate (de la Rocha et al., 2007), and we did not want differences in TC rate to confound our comparisons of GPi-thalamic correlation transfer. Model thalamic neuron interspike interval (ISI) distributions as well as power spectra and cross-spectra of GPi and thalamic spike trains resulting from these GPi input patterns are presented in the Appendix.
Correlation Measures
Pearson's Correlation Coefficient
We use the Pearson's correlation coefficient to quantify the tendency of the two spike counts to be linearly related to one another (Averbeck et al., 2006; Cohen and Kohn, 2011). For spike counts taken with a sliding window of size T, n1(T), and n2(T), the Pearson's correlation coefficient is
where cov(A, B) = E[AB] − E[A]E[B] is the covariance, and var(A) = cov (A, A) is the variance. This quantity is computed to measure the correlation ρin between the spike counts of the inputs from GPi as well as the correlation ρout between the output spike counts from the TC neurons.
This correlation coefficient depends on the window size, T, over which the spikes are counted (Kass and Ventura, 2006). For T sufficiently small, the two neurons must spike very close together for both to have a spike counted in the same time bin, so in this limit ρ(T) measures synchrony. On the other hand, when T is large, ρ(T) is a measure of correlations at long timescales and can be thought of as a spike rate correlation. In this case, the exact timing of the spikes makes less of a contribution to the correlations, while co-fluctuations in the firing rates are more important. It was recently noted that measuring co-variability of spike trains using a counting process introduces complications that are not present in spectral analysis (Tetzlaff et al., 2008). In particular, how ρ(T) varies with T reflects a combination of the temporal properties of the spike trains and the windowing function used to convert spike trains to spike counts. Nevertheless, spike count statistics are a standard metric (Cohen and Kohn, 2011) that make our results easily comparable to the results of other studies, and they also convey how a downstream observer that integrates spikes (i.e., a synapse or membrane potential) will measure the co-variability in a spike train. That said, following up on our correlation-based results with a complete spectral theory based on linear response analysis (Doiron et al., 2004; Lindner et al., 2005; de la Rocha et al., 2007) will be an important next step.
Correlation Susceptibility
For a pair of uncoupled neurons, when the input correlation coefficient is zero, the output correlation coefficient must also be zero. Following past work (de la Rocha et al., 2007; Shea-Brown et al., 2008) we take a linear approximation for the correlation transfer between input correlation ρin and output correlation ρout:

In Equation (7), S is called the correlation susceptibility and is the slope of the input-output correlation curve. S measures the extent to which small changes in the input correlation coefficient cause changes in the output correlation coefficient. In this work, we define correlation susceptibility in a slightly more relaxed way, because with shared input rate modulation, it is not possible to get ρin(T) = 0 for non-homogeneous inputs. That is, even with c = 0, such that no single input spike is sent to both postsynaptic neurons, a common variation in input rate will introduce a covariation into the numbers of input spikes arriving in any fixed time window, making ρin(T) non-zero [see Equation (6)]. Thus, we define the correlation susceptibility as the slope of the line of best fit through the attainable portion of the input-output correlation curve, which may have a non-zero intercept,

We have also explicitly denoted the dependence of both the input correlation ρin(T) and the susceptibility S(T) on the window length T. We use this measure of correlation susceptibility as an indicator of the extent of correlation transfer through the system for the observed values of ρin.
Bootstrapping Technique
Confidence bands in Figure 4 were found using a case resampling bootstrapping technique. This technique was applied for each value of T, by taking the set of N pairs (ρin(T), ρout(T)), obtained for every value of c and from every simulation trial run. We ran 30 trials for five different values of c, so N = 150. These pairs were then sampled with replacement to obtain a new set of N pairs. This procedure was repeated 1000 times, and the line of best fit was calculated for each constructed data-set. The confidence intervals for each value of T are such that 98% of the calculated slopes fall within these intervals. For the insets in Figure 4A in particular, the same technique was used except that we only included the 30 simulations from c = 0, which yielded the error bars shown.
Point Process Model
Spike Emission
In an excitable neuron, we can think of spiking as a process that requires a certain amount of activation energy (Lindner et al., 2004). The amount of energy required depends on how far the resting potential is below the spiking threshold and on the strength of the inputs the neuron receives. The process of attaining this activation energy and consequently spiking can be modeled as the escape of a diffusive particle from an energy well, the height of which is related to the distance between rest and threshold.
Under the assumption that the well height is large and the diffusion rate of the particle is small, it has been shown that the rate of escape of a particle from an energy well is given by an Arrhenius escape rate (Hanggi et al., 1990),
Here, D is the rate of diffusion, which depends on the noise strength, and the well height is given by U.
This Arrhenius escape rate has been shown to be a good approximation to the rate of firing of a neuron in the limit of small input strength (rate of diffusion) and large distance between rest and threshold (well height) (Plesser and Gerstner, 2000). When applying this theory to a neuron, β can be thought of as a free parameter that can be fit to data (Plesser and Gerstner, 2000). We assume that the Poisson discharge times of the synaptic inputs provide the noise necessary to reach threshold. We also assume that the modulations of the inhibitory input rate change the average amount of inhibition over time. If the modulations are sufficiently slow then we may use the Arrhenius theory with a time dependence in the height of the energy well U(t) (Wiesenfeld et al., 1994; Lindner et al., 2004).
To model the well modulation that occurs due to non-bursty, oscillatory, inhibitory inputs with frequency Ω, we let
Here, U0 is the average well height and η is the modulation strength. This formulation represents a simplification from the oscillatory inputs used in the computational models in that the modulation consists of a single sinusoid, rather than a sum of sinusoids. This is the same well height modulation used in (Wiesenfeld et al., 1994) and is plotted in Figure 3A.
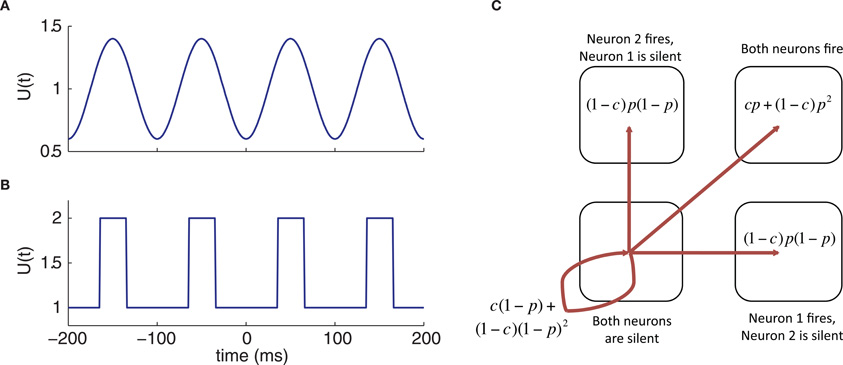
Figure 3. Escape properties of neurons with spike correlation c and escape probability p(t) that depends on well height U(t). (A) Oscillatory well height modulation. (B) Oscillatory bursty well height modulation. (C) Joint escape probabilities of two neurons in the interval (t, t + dt).
To model the well modulation resulting from oscillatory burst inputs, we let

where T1 is the time between bursts, T2 is the burst duration, and M = T1 + T2 is the period of the oscillation; that is, the product of Heaviside functions causes the value of U(t) to jump up to U0(1+η) for a time period of duration T2 and then to jump down to U0 for time T1, and this occurs periodically due to the mod operation. Again, this modulation is a simplification of the oscillatory burst inputs used in the computational models, because the period of the oscillation in this case is fixed, without any of the jitter that the Gaussian distributions of waiting times and burst times introduced in the computational models. This well height is plotted in Figure 3B.
Joint Escape Probabilities
Consider two neurons that each have a source of private noise, of variance η2 (1-c), and a source of common noise, of variance η2 c. Let each neuron have an escape rate η(t), which is determined entirely by its inputs, such that the probability of one neuron firing in the interval (t, t + dt) is

The function α(t) completely determines the marginal spike train statistics of each of the neurons in the pair; however, further information is needed to calculate the joint statistics of the spike train pair. To this end, we assume that the neurons' output correlation equals their input correlation, meaning in effect that S = 1. In our escape model, large input fluctuations lead to barrier crossings, and while the marginal rate of these fluctuations is α(t), the probability that a specific input fluctuation is shared is c, leaving a probability of 1 − c that it occurs independently across the neurons. From this phenomenological separation, we can calculate the joint statistics of the spike train pair as follows. If the fluctuation is independent, then the probability that both neurons will fire in response to it is p(t)2, the probability that one neuron will fire while the other does not is p(t)[1 − p(t)], and the probability that neither neuron fires is [1 − p(t)]2. If the fluctuation is fully shared (c = 1), then both neurons fire with probability p(t), or both neurons are silent with probability 1 − p(t). Combining the probabilities for the cases of independent and identical fluctuations, we have that the total probability of both neurons firing within the interval is cp(t) + (1 − c)p(t)2, the total probability of neither neuron firing is c[1 − p(t)] + (1 − c)[1 − p(t)]2, and the probability of one particular neuron firing, but not the other one, is (1 − c)p(t)[1 − p(t)]. Given these possibilities, each individual neuron in the pair fires with probability p, while the probabilities of all possible distinct events (no firing, only one neuron fires, or both neurons fire) sum to 1, as desired. A schematic illustration outlining the joint probabilities for the firing of two neurons for c is shown in Figure 3A.
Results
We simulated a pair of model thalamic neurons receiving two distinct sources of synaptic input. The first input represented cortical signals and was a train of excitatory inputs with Poisson distributed arrival times, having a time homogeneous rate. The second represented GPi activity and was a pool of correlated inhibitory inputs, each also Poisson distributed yet arriving at a common time-dependent rate λ(t). We explored various aspects of the correlated thalamic activity generated in this scenario, including its dependence on the choice of thalamic model and on the specifics of λ(t).
TC Spike Train Correlations
In this section we measure the correlation transfer from GPi spike train correlation to TC spike train correlation. We focus on the Pearson's correlation coefficient of the spike counts of the neurons computed over windows of T ms (see Methods), a commonly used measure of spike train co-variability (Cox and Isham, 1980; Averbeck et al., 2006; Cohen and Kohn, 2011). Specifically, to assess how correlation is transferred from GPi to thalamus, we compare the inhibitory input correlation to the output spike count correlation. Figure 4A provides an example of this comparison, computed with T = 95 ms (see Correlation Susceptibility section below for choice of time window), for the conductance-based and IFB models, which yield very similar results. For each pattern of GPi spikes, we let c range between 0 and 1. Note that when c = 1, ρout remains less than 1 because the TC neurons are also receiving independent excitatory input.
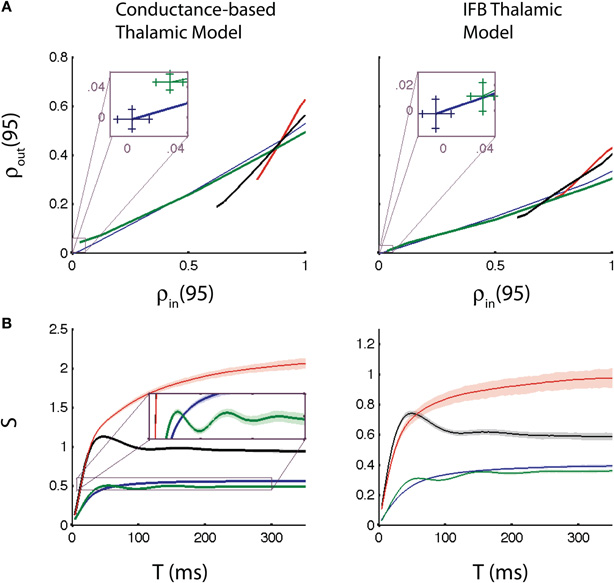
Figure 4. Input-output correlation relationships and correlation susceptibility. (A) Output correlation vs. input correlation for T = 95 ms, including zoomed view near the origin (insets). Curves were generated by varying cin steps from 0 to 1 and computing ρin and ρout for each model, for each c. (B) Correlation susceptibility (S) vs. T. The inset in (B) shows the oscillations in the susceptibility when the thalamic neurons receive oscillatory inputs. The conductance-based model (left), and the IFB model (right) are both shown. The following input conditions are used: normal (blue), oscillatory (green), bursty (red), and oscillatory bursts (black). Error bars in the insets in (A) and confidence bands on the correlation susceptibility in (B) show 98% confidence intervals, calculated using bootstrapping techniques.
Also note that in all three cases for which the GPi firing is temporally inhomogeneous, ρin > 0 even when c = 0, because the two GPi spike trains have identical rate modulations. The value of ρin for c = 0 is indicated as the horizontal coordinate of the leftmost point on each curve in Figure 4A. The insets show that ρin is indeed positive for c = 0 for the oscillatory case, although it remains surprisingly small in that case, presumably because the slow modulation in rate is sufficiently gradual that it does not drastically affect firing rates (e.g., Figure 2D), normal vs. oscillatory cases). Importantly, for identical levels of ρin in the bursty and the normal cases, the causes of the correlations are very different. In the normal case, the correlation comes completely from the spike correlation imposed by c (in fact, ρin = c), while for the bursty spike trains, the slow, shared rate modulation also contributes to ρin.
With this interpretation, we arrive at the conclusion that spike correlations may be transferred to outputs more effectively than rate correlations. To make this inference, we first note that the input-output correlation curves for the bursty cases (red and black curves in Figure 4A) have steeper slope than those for the non-bursty cases. Indeed, for the smallest ρin values arising in the bursty cases, c is small and correlations are mostly due to shared rate fluctuations. Since ρout is smaller for bursty than non-bursty inputs for such ρin, we conclude that these rate correlations are not passed on as efficiently as the spike correlations present in the normal case, where c is larger. As c increases, the input-output correlation curves for the bursty cases rise steeply and cross the curve for the normal case (blue). Eventually, c becomes large enough so that the combination of rate modulation and spike correlations in the bursty cases causes more effective correlation transfer than do the spike correlations alone in the normal case.
Due to the prevalence of rhythmic firing in both normal and parkinsonian conditions, TC spike train responses are often reported through spectral measures. For completeness, we also present an analysis of the spike train auto- and cross-spectra for both the conductance-based and IFB models (see Appendix). Despite the distinction between the models, we found a qualitative agreement in their performance.
Correlation Susceptibility
Figure 4B shows the correlation susceptibility S (see Methods) plotted as a function of T. Taking a linearization of the input-output correlation curve (Figure 4A) is justified since a linear approximation fits the curves very well. We include 98% confidence bands on the correlation susceptibility in Figure 4B. These confidence bands were found using a case resampling bootstrapping technique (Methods). Note that the conductance-based model (left) and the IFB model (right) give qualitatively similar results yet again, providing further evidence that the IFB model is a good reduction of the conductance-based model for studying correlation transfer and that our findings transcend the details associated with a specific neuronal model. Moreover, we see that the susceptibility curves for the four cases consider begin to separate out at time windows T above 50 ms and settle down toward asymptotic behaviors once T exceeds about 200 ms; indeed, we used T = 95 ms in Figure 4A because this choice of T lies in the interval between these values.
Bursts Increase Correlation Susceptibility
Notice that the bursty cases in Figure 4B have increased correlation susceptibility when compared to the non-bursty cases. This increased sensitivity to changes in ρin may stem from two effects. First, in the bursty cases, the entire range c ϵ (0,1) is compressed into a small interval of ρin values. Since ρin increases from some positive value up to 1 as c increases from 0 to 1, instead of from 0 up to 1, a small change in ρin corresponds to a larger change in c in bursty cases, and this larger change in spike correlations can strongly impact ρout. Second, bursty inputs provide a strong temporal signal to both neurons. The neurons simultaneously receive periods of strong inhibition, which will cause decreased firing, and then are simultaneously released from the inhibition, causing them to fire at similar times. Thus, even a small increase in the input correlation may cause a large increase in the output correlation by making the times of firing after the release from inhibition more similar.
Although we have not quantified the relative importance of these two effects, they both do contribute to the enhancement of susceptibility in the bursty cases. That is, the first of these two effects alone is not sufficient to cause enhanced susceptibility, because it does not in itself ensure that ρout for the bursty cases becomes larger than ρout for the non-bursty cases as ρin increases to 1. The second effect also is not sufficient on its own, because common modulations of inhibitory input rate would tend to increase ρout for each c, and thus the bursty ρout can be below the non-bursty ρout at fixed ρin if the c giving that ρin is much smaller in the bursty case than in the non-bursty case.
Finally, one may also ask why the bursty case yields a greater correlation susceptibility than occurs in the oscillatory bursty case. While we do not have a definitive explanation for this relation, one might speculate that the greater irregularity of input spike timing in the bursty case causes larger, more abrupt variations in T-current recruitment, as in Figure 2C, which causes correlated inputs to more strongly impact firing patterns. We shall see, however, that the T-current is not behind this difference, which is evident only when output correlations are measured on sufficiently long time windows (Figure 4B). From Figure 4A, we can speculate that both of the effects mentioned above are stronger in the bursty case than in the oscillatory bursty case, since we see that the minimal ρin, corresponding to c = 0, and the maximal ρout, corresponding to c = 1, are both larger in the bursty than oscillatory bursty case, yielding a larger slope of ρout as a function of ρin.
Oscillatory Firing Causes Oscillatory Susceptibility
As seen most clearly in the inset in Figure 4B, the correlation susceptibility in the cases with oscillatory firing in the GPi is also oscillatory. The frequency of the oscillation of the correlation susceptibility is the same as that of the inhibitory input from GPi, which in the case shown is 10 Hz. The oscillatory bursts yield this same rhythm in correlation susceptibility if the variance of the time between bursts is sufficiently small.
We next ask how changing the frequency of the oscillations in the GPi affects the correlation transfer, since data shows that there is a range of possible GPi oscillation frequencies under Parkinsonian conditions (Raz et al., 2000; Wichmann and Soares, 2006). In Figure 5A, we change the frequency of the oscillatory bursts by shifting the mean waiting time between bursts (holding the variance of the burst durations equal to 5 ms, setting the variance of the interburst intervals equal to 10 ms, and choosing all other parameters as in Figure 2). Interestingly, the rhythm in the correlation susceptibility tracks the frequency of bursts in GPi, pointing to a key role of bursting for the time-dependence of correlation transfer. Notice also that as the mean waiting time between bursts increases, i.e., as the burst frequency drops from 10 to 4 Hz, the amplitude of the oscillation in S also increases. We do not have a clear explanation for this increase in amplitude, which may relate to the increase in thalamic firing rate when longer pauses between inhibitory bursts are available or to thalamic rebound effects. As burst frequency goes to 0, the simulation becomes identical to the normal case, and indeed, we see that lowering burst frequency below 4 Hz first lowers the peak in S and eventually converts S to a monotone function of window size T, approaching the normal curve in Figure 4B (e.g., the light blue curve in Figure 5A, which does not exhibit noticeable oscillations even when plotted out to 1000 ms).
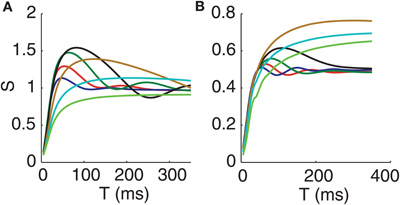
Figure 5. Oscillation frequency of S tracks GPi oscillation frequency while oscillation amplitude of S depends non-monotonically on GPi oscillation frequency. (A) Oscillatory bursts in the inputs from GPi to the conductance-based thalamic model. (B) Non-bursty oscillations in GPi inputs to the conductance-based thalamic model. Frequencies are 10 Hz (dark blue), 8 Hz (red), 6 Hz (green), 4 Hz (black), 2 Hz (tan), 1 Hz (light blue), and 0.5 Hz (green). Note that while two of the curves are colored green, the 0.5 Hz green curve is qualitatively similar to the 1 Hz curve and thus can be clearly distinguished from the 6 Hz green curve.
Figure 5B shows the effects of changing the frequency of oscillations in the GPi for the non-bursty oscillatory case. In this case, GPi activity is generated as a weighted sum of oscillatory components (see Methods), and we bias the weighting progressively toward the zero frequency component to achieve the overall decrease in GPi frequency. Once again, decreasing the frequency of the oscillation initially causes the rhythm in the susceptibility as a function of T to become stronger, with a frequency that matches the frequency of the rhythm in the GPi firing rate. As GPi oscillation frequency is decreased more, however, the rhythm in S is lost, and the S vs. T curve again approaches the normal case, as expected. These results suggest a possible mechanism for the therapeutic effect of deep brain stimulation (DBS) of the basal ganglia for Parkinson's disease. By imposing high frequency rhythms, DBS could decrease the thalamic sensitivity to changes in input correlations that we find with GPi inputs in the 4–10 Hz range and that could be provoked by pathologically synchronized firing rate modulations in the basal ganlia in parkinsonism.
Removing T-current has Little Effect on Correlation Susceptibility
Because we have already seen evidence that the T-current plays a role in the spiking of the thalamic neurons that receive oscillatory or bursty input from GPi, we next investigate how removing this current affects the firing of these neurons and the correlation transfer of the system. When the T-current is removed in the conductance-based model, the firing rate of the thalamic neurons decreases for every input firing pattern we tested. Indeed, the rates of thalamic firing without the T-current drop to 7.5 Hz for normal inputs from GPi, 6.9 Hz for oscillatory inputs, and 2 Hz for both oscillatory and non-oscillatory burst inputs, vs. 10.6 Hz for the former pair of cases and 8.6 Hz for the latter pair with the T-current present. This decrease in firing rate could be compensated for by increasing Iapp; however, we chose to leave all parameters unchanged under T-current block to obtain the most fair comparison.
Figure 6A shows the spike-triggered-averages (STAs) for the conductance-based model with (solid) and without (dashed) the T-current (with the normal case omitted because the T-current is not significantly recruited in that case, see Figure 2, leftmost column). Removing the T-current most strongly affects the STA of the non-oscillatory burst case (red), causing the peak in the inhibition before a spike to completely disappear when the T-current is removed. Indeed, without the T-current, an inhibitory peak no longer promotes rebound firing, so this effect is expected. The STAs for the oscillatory cases on the other hand, are not as strongly affected. Here, input trains always feature peaks, but without the T-current, the peak in the inhibition shifts to the left, so it occurs longer before the spike. Thus, although removing the T-current in these cases changes the rate of firing, it does not significantly change the average input that causes the neurons to fire.
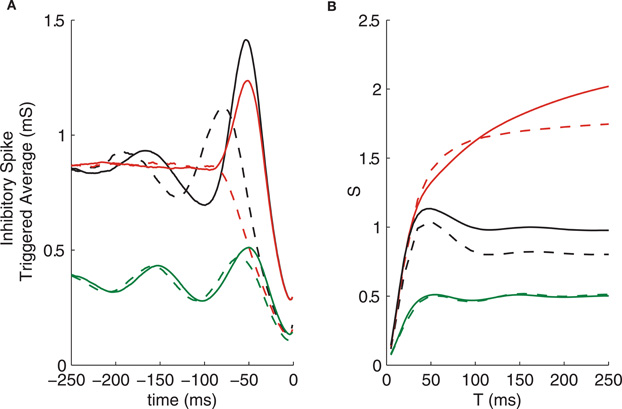
Figure 6. Removing the T-current (dashed lines) affects spike triggered average but not correlation susceptibility. (A) Spike triggered averages. (B) Correlation susceptibility. GPi firing patterns used are: oscillatory (green), bursty (red), and oscillatory bursts (black).
Despite the drastic change in the STA of neurons with bursty inputs from GPi and the large change in the thalamic firing rates for all input types, the correlation susceptibility is not very strongly affected by the removal of the T-current, as seen in Figure 6B. This finding indicates that the T-current is not essential for the patterns of correlation transfer that we see in the system, although it does influence the single neuron firing patterns.
Removing the T-current from the IFB model produces similar results (not shown), in that thalamic firing patterns are strongly affected, while correlation susceptibility shows little change. It is worth nothing that without the T-current, the IFB model is simply an LIF model. Thus, the level of complexity in an LIF model is sufficient to produce the patterns in correlation transfer seen here. This suggests that perhaps even less complex models could be used to explain such patterns.
Point Process Model Results
To provide an analytic explanation for the trends that we see in the transfer of correlations under the oscillatory conditions discussed above, we consider a phenomenological point process model of TC spike activity (see Methods). Although this reduced model lacks T-current effects, the results of the previous section suggest that it may still capture the main correlation transfer mechanisms present in the full computational model. Since the firing rate,  , is an even function, we can write it as the cosine series,
In this case,
is the spike train autocorrelation function of the neuron, as given by Wiesenfeld and colleagues (Wichmann et al., 1994) and derived explicitly in (Reitsma, 2010).
Because the firing is Poisson, and the two neurons are receiving identical input rate modulations, the pairwise spike train cross-correlation function must be identical to the auto-correlation function when  (Lindner et al., 2005). The main difference is that the probability that one neuron will spike in the interval (t, t + dt) is given by p(t) = t + dt, while the probability that both neurons will spike in this interval is given by
Thus, the instantaneous joint firing rate is
so the mean joint firing rate is cα.
Using these two facts we deduce that the spike train cross-correlation function is
The intensity of the delta function is the mean joint firing rate of the two neurons. In agreement with these expressions, numerical calculations show that the auto- and cross-correlation functions of the computational thalamic models with inhibitory inputs that have identical rate modulations are the same for lags sufficiently far from zero, as shown in Figure 7.
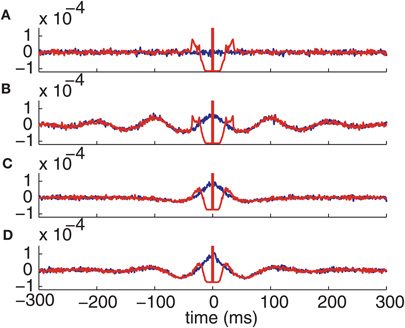
Figure 7. Correlation functions of the conductance-based model spike trains. Autocorrelation (red) and cross-correlation (blue) functions with (A) Normal GPi inputs. (B) Oscillatory GPi inputs. (C) Bursty GPi inputs. (D) Oscillatory bursty GPi inputs.
The variance of the spike count over a finite window of length T is the integral of the autocorrelation function against a weighting factor Cox and Isham (1980):
Because the two neurons are identical, and their correlation is expected to be symmetric about τu, we can calculate the covariance in the same way, using the cross-correlation function instead of the autocorrelation function:
Thus, the Pearson's correlation coefficient is
It is clear from Equation (9) that the rhythms seen in the correlation coefficient are due to a difference in the covariance and variance of spike emission, rather than in long timescale oscillations, since the only difference between the numerator and denominator is the first Fourier coefficient. This similarity arises because the oscillations in the firing probability α(t) are perfectly correlated between the two neurons, which makes the oscillatory terms in the covariance and variance identical. This condition also holds in our computational models, since the neurons receive GPi inputs with identical rate modulations. If GPi rate modulations were made less coherent, then the covariance expression in the numerator in Equation (9) would change. As a result, a mismatch between oscillatory terms in the numerator and denominator would develop and the correlation between TC neurons would decrease, but the dependence of ρ on T would remain non-monotonic, at least for small perturbations from the perfectly coherent case.
Comparison of Model Results
Now that we have an analytic expression for the correlation coefficient of the reduced point process model, we can investigate numerically how this compares with and gives insight into the behavior of ρout(T) in the thalamic computational models. In Figure 8, the output correlation coefficients of the computational models are plotted along with ρ(T) calculated analytically for the reduced point process model using Equation (9), for c = 0 (Figure 8A) and non-zero c (Figure 8B). For the computational model simulations, we simplify the non-bursty oscillatory inputs from GPi by using only a single sine wave instead of a sum of sine waves to set the GPi firing rate. We also simplify the oscillatory bursts in GPi by setting the variances of the waiting time between bursts and of the burst duration equal to zero.
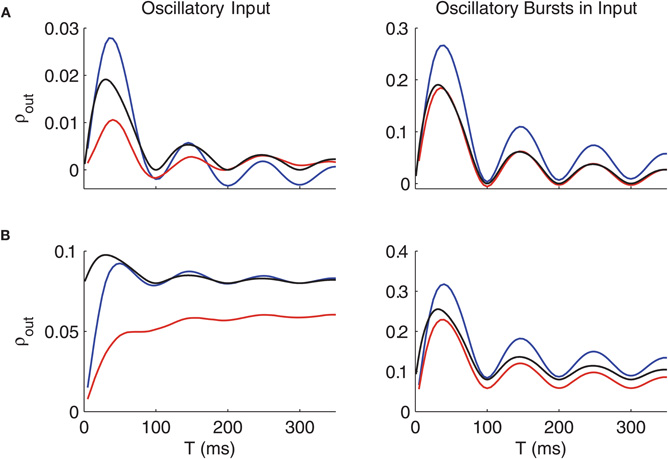
Figure 8. Oscillations of ρ obtained from calculations on the point process model match those in ρout from thalamic model simulations. (A) Comparison of correlation coefficients for the voltage-based thalamic models (conductance-based model, blue; IFB model, red) with input correlation of c = 0and the point process model (black) with c = 0.08. (B) As in (A) with c = 0.2 in the thalamic models. Non-bursty oscillatory inputs from GPi are shown on the left, oscillatory bursty inputs on the right; in both cases, oscillations occur at a frequency of 10 Hz. Parameters for the point process model are D = 0.1, U0 = 1, and η = 0.4 for oscillatory inputs and D = 0.35, U0 = 1, and η-1 for oscillatory bursts.
On the left, ρout is plotted for oscillatory inputs, while on the right, we use oscillatory bursts in the inputs. Both oscillatory inputs and oscillatory bursty inputs show an oscillation in ρout, but the amplitude of this oscillation is much higher for the case of oscillatory bursts. Apparently, the oscillatory bursts with no variability in the interburst intervals cause a very strong dependence of correlation transfer on timescale. Introducing variability in the timing of the bursts for this case causes the oscillations in ρout(T) to have a smaller amplitude and dampen more quickly.
Quantitatively, we do not expect the correlation coefficients of the computational and reduced models to match identically, as even when comparing the conductance-based model and the IFB model, the quantitative results for correlation transfer differ in the two systems. The difference between the reduced model prediction and the computational model results is largest at small window sizes for c non-zero. This difference arises because the instantaneous correlation level for the reduced model is c (obtained by taking ccc. In other words, the reduced model assumes the spike correlations are perfectly transferred from input to output. In the full computational models, however, the spike correlations in the inputs do not directly translate into instantaneous correlations in the outputs because of the membrane dynamics of the thalamic models. Also, the refractory period of the computational models will affect correlation transfer on short timescales, while the reduced model has no refractory period. Some quantitative difference between the reduced model and the computational models is also evident on longer timescales, again because the reduced model assumes perfect correlation transfer, which does not occur in the computational models.
Despite its quantitative differences in performance relative to the computational models, the reduced model sheds light on the qualitative behaviors of the correlation coefficient. In particular, the analysis of the reduced model gives insight into the origin and nature of the rhythms seen in ρout(T). In the computational models, we observed that the time between peaks of ρout(T) is equal to the period of the oscillation in the GPi firing rate. This observation is supported by the reduced model, where the fundamental frequency _ of the oscillation in the correlation coefficient in Equation (9) is the same as the frequency of the well modulation. Thus, the frequency of the oscillation in GPi determines the timescales on which the thalamic neurons will be most correlated. Also, from Equation (9), it is clear that as T, the oscillations in ρout(T) damp out, and ρout asymptotes to a constant value. This effect is seen in the correlation susceptibility of the computational models, in Figures 4 and 5.
Finally, the rhythms in the correlation coefficient are present despite identical inhibitory input rate modulations, due to differences in the covariance and variance of spike emission. The dependence of ρT on the input rate correlations (Equation (9)) shows that very specific matching between input rate correlations and spike time correlations would be necessary to eliminate these rhythms. This observation indicates that the oscillations seen in ρout(T) in the computational models will be robust to changes in parameters.
Discussion
In our study, we have predicted that firing patterns, such as oscillations and bursting, observed in the GPi under parkinsonian conditions directly affect the correlation present between GPi output signals as well as the way that correlations are transferred from GPi to thalamus. This conclusion is supported both by simulations and by calculations with a reduced point process model, even though the latter, by design, lacks rebound effects based on the T-current.
Recordings from MPTP primates (Nini et al., 1995; Bergman et al., 1998; Raz et al., 2000; Bar-Gad et al., 2003; Heimer et al., 2006) show correlations in the activity of GPi neurons that are significantly higher than in normal conditions, and human Parkinson's disease patients also exhibit strong correlations within the GPi (Hurtado et al., 1999; Gale et al., 2008). As expected, we find that simply increasing the instantaneous correlations due to overlap of GPi inputs to a pair of TC cells, c, in our model would be enough to enhance the correlations between TC neurons. This immediate effect may explain the TC correlations observed in those MPTP experiments that do not feature changes in firing patterns (Pessiglione et al., 2005). Interestingly, we also find that for fixed c, the introduction of shared burstiness in GPi spike trains, whether bursts occur at a steady rate or not, is sufficient to increase both the correlation present in the inputs from GPi to TC neurons (ρin) and the pairwise correlations of TC cells (ρout) well beyond the levels arising from shared oscillations alone. Thus, we predict that enhancements in GPi correlations will be particularly prominent when bursting is present and that any surges in TC correlations observed in parkinsonian conditions may be indicative of burstiness in GPi.
By using correlation susceptibility (S) as a particular measure of correlation transfer, we assess how strongly small changes in correlations observed in GPi influence correlation in thalamus under different GPi firing patterns (Figures 4, 5). Our computational models show that patterns of inhibitory neuron firing that include bursts of spikes cause the system to be much more susceptible to passing along correlations. Thus, the models predict that a small change in correlations in GPi will cause a larger change in thalamic correlation when the inputs from GPi are bursty than when the inputs are either purely oscillatory or of constant rate.
Perhaps surprisingly, we showed that although the T-current in the TC neurons affects the pattern of spiking that they exhibit, and the type of inputs that lead to a spike, it does not have a large effect on transfer of correlations through the system, even in cases where the GPi activity is oscillatory, bursty, or both (Bronfeld and Bar-Gad, 2011). In particular, the point process model that we analyzed includes no T-current, yet it still produces a dependence of correlation on timescale that is qualitatively very similar to the computational neuronal models in oscillatory regimes. These results show that even in parkinsonian states where T-current bursts in thalamic neurons are not prominent, such as may be the case in non-tremor parkinsonism Pessiglione et al. (2005), correlation transfer, including its dependence on GPi activity patterns, may still be enhanced. Since the T-current is not needed to explain the difference in thalamic correlation structure resulting from oscillatory inhibition that is not bursty compared to that arising with bursty inhibition, both of which include both spike and rate correlations, we can conclude that the large, fast changes in firing rate that occur when the GPi fires a burst represent a particularly powerful inhomogeneous signal to both neurons, which may make them more sensitive to small changes in the proportion of shared input spikes. More concretely, bursts of inhibition are especially effective at sculpting postsynaptic firing patterns, blocking firing in certain time windows. Our work complements past studies of correlation transfer in LIF model neurons where the impact of either input timescale (Moreno-Bote et al., 2008) or inhibitory conductance (Stroeve and Gielen, 2001) was explicitly considered. In these studies, simplifying assumptions of the spike dynamics or the exponential form of the input statistics permitted deeper analysis. However, for our purposes these simplifications do not capture the critical rhythmicity present in GPi-thalamic circuits. A full mathematical analysis of the relation between bursty inhibition and correlation transfer, beyond the point process analysis of oscillatory effects from oscillatory bursty inhibition that we have performed, remains for future work.
Our study also shows that the correlation susceptibility, S, and the output correlation, ρout, are both affected by the timescale of GPi firing rate oscillations, when these are present, regardless of whether or not GPi bursting occurs. In particular, when two neurons receive identical rate modulations in their inputs, correlations are maximized on a timescale of half the period of the firing rate oscillation (Figure 5). The analysis of our reduced point process model shows that differences in the covariance and variance of spike timing are sufficient to cause this dependency of the correlations on timescale. In brief, oscillations in input rates can be viewed as a factor that modulates a spike-related instantaneous correlation, and as that factor grows and shrinks with window size, the output correlation oscillates correspondingly. This analysis also indicates that the oscillatory dependence of the correlation coefficient on the window size for neurons receiving correlated inhibitory inputs arriving at oscillatory rates is very robust. Finally, this non-monotonic dependency of correlation on window size points to the critical importance of the observation window used when measuring spike count correlations in the parkinsonian GPi-TC network.
In parkinsonian conditions, increased correlations in basal ganglia are thought to represent a pathological breakdown of functional circuit segregation (Filion et al., 1988; Nini et al., 1995; Bergman et al., 1998; Bronfeld and Bar-Gad, 2011). Other work has posited that increased correlations seen in the thalamic targets of GPi in parkinsonism are indicative of desegregation within this nucleus (Pessiglione et al., 2005). Our work shows that the increase in correlations in the thalamusmay be due to a dual effect of increased correlations in basal ganglia as well as increased correlation susceptibility because of bursty GPi firing patterns. Such an increase in correlation susceptibility would make thalamic neurons very sensitive to even small fluctuations in correlations in GPi. This effect could be compounded by the sensitivity of correlations to the timescale of oscillations in the GPi activity levels. This increased correlation in the thalamus may compromise thalamic information processing (Montgomery and Baker, 2000; Grill et al., 2004; Garcia et al., 2005; Dorval et al., 2008, 2010; Xu et al., 2008) and, in particular, may be detrimental to the ability of the thalamus to accurately relay excitatory information it receives (Rubin and Terman, 2004; Guo et al., 2008; Cagnan et al., 2009; Pirini et al., 2009) in order to appropriately contribute to motor control.
Conflict of Interest Statement
The authors declare that the research was conducted in the absence of any commercial or financial relationships that could be construed as a potential conflict of interest.
Acknowledgments
This work was partially supported by National Institutes of Health award 1R01NS070865-01A1 and by United States National Science Foundation Awards DMS1021701 and EMSW21RTG0739261.
Appendix
Interspike Interval (ISI) Distributions
The ISI distributions of our model thalamic neurons depend on the particular GPi firing pattern used (see Methods and Figure 2). Figure A1 shows that all four types of GPi firing patterns yield a dominant, primary peak in the distribution (in the 20–30 ms range in the conductance-based thalamic model). Normal, constant rate inputs from GPi lead to a unimodal ISI distribution, while the other cases result in a bimodal ISI distribution when the conductance-based thalamic model is used. The primary peak in these distributions is due to a combination of spike and burst responses, the latter of which include short ISIs; in the bursty cases, the primary peak shifts to smaller times because T-current-induced thalamic bursts, and hence short ISIs, become more common. The secondary peaks reflect the period of the oscillations present in the GPi firing patterns. In particular, note that the mean interburst interval in our bursty cases is 70 ms. Note that, our mean thalamic firing rates are similar across all cases of GPi inputs, despite their different ISI distributions.
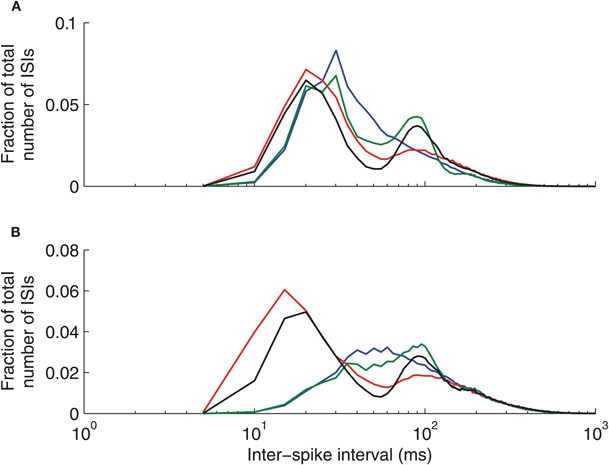
Figure A1. Thalamic neuron interspike interval (ISI) distributions depend on the pattern of inhibitory inputs from GPi. (A) Conductance-based model. (B) IFB model. Normal (blue), oscillatory (green), bursty (red), and oscillatory bursty (black) patterns of GPi inputs are shown.
Interestingly, while the ISI distributions generated by the conductance-based model (Figure A1A) and the IFB model (Figure A1B) are generally quite similar, the IFB distributions for the non-bursty cases lack short ISI peaks. These differences suggest that non-bursty inhibitory inputs are less effective at recruiting the T-current in the IFB model than in the conductance-based model. On the other hand, the similarities evident in the bursty cases illustrates the power of such patterned inhibitory inputs to drive thalamic model neurons to fire in a specific way, regardless of the details of the intrinsic firing mechanism in the neuron model.
Power Spectra
We next consider the power spectra of the GPi spike trains that we generated and of the spike trains produced by our model thalamic neurons, subject to inhibitory inputs from GPi as well as to 20 Hz excitatory inputs (Figure A2A). The power spectra for the thalamic spikes were calculated Chronux software package (Chronux software package; Mitra and Bokil, 2008. Note that in GPi, both oscillations (green) and oscillatory bursts (black) in spike rate yield a 10 Hz peak in the power spectrum. The power spectrum of the oscillatory GPi spike train is a good match to power spectra calculated from recordings in GPi under parkinsonian conditions (Heimer et al., 2006). The spectra from the conductance-based and IFB thalamic models inherit the GPi spectral peaks in the oscillatory cases, as expected.
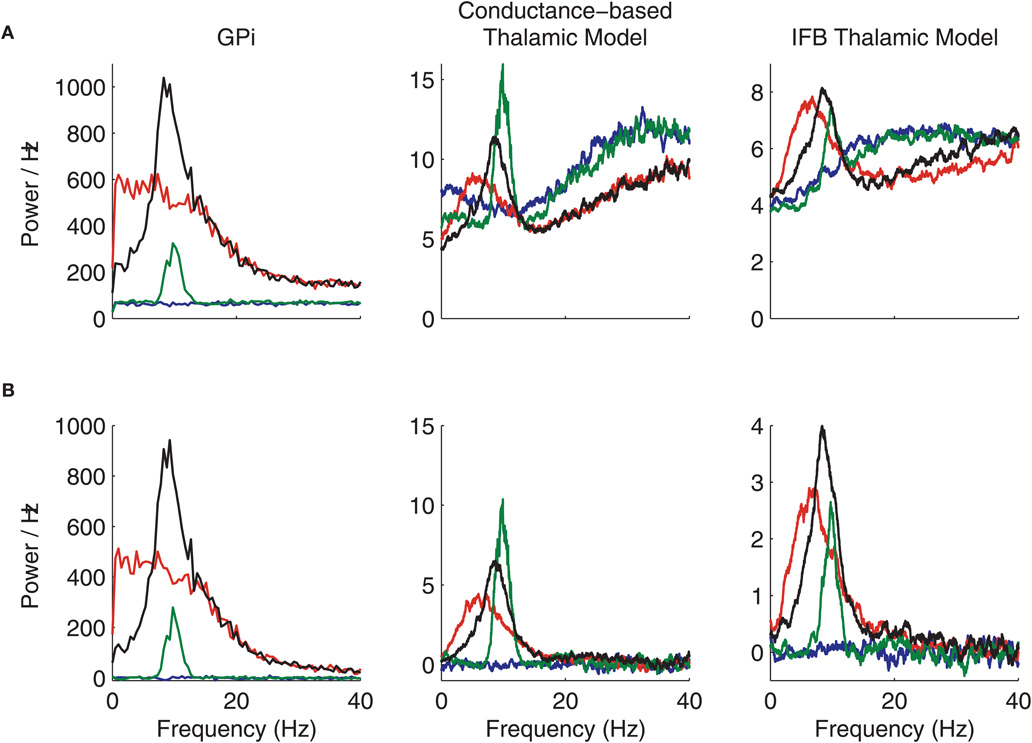
Figure A2. Power spectra and cross-spectra of GPi and thalamic spike trains. (A) Spike train power spectra. (B) Spike train cross-spectra. Normal (blue), oscillatory (green), bursty (red), and oscillatory bursty (black) patterns of GPi inputs are shown.
It is also interesting to notice that the power spectrum of the bursty (red) GPi spike train shows higher power at low frequencies but no distinct peak. However, these inputs do cause the thalamic power spectrum to have a peak around 7 Hz in both the conductance-based model and the IFB model. When the T-current is removed from the models by setting T = 0, this peak in the thalamic neuron power spectrum disappears for both models. This effect indicates that the model neurons are frequency selective, consistent with experimental results (Puil et al., 1994), and that it is the T-current that causes them to have a preferred response frequency.
The cross-spectra for c = 0 are shown in Figure A2B for the GPi spike trains and the corresponding thalamic spike trains. The cross-spectra for the neurons that receive normal input from GPi (blue) are always flat, and the power is zero because the inputs to the neurons are not correlated. For each of the other patterns of GPi firing, the cross-spectra are non-zero even when c = 0 since the temporal inhomogeneity of the inhibitory input rate λ(t) is identical for both neurons and acts to correlate the output spikes. In these cases the cross-spectra are very similar to the power spectra shown in Figure A2A. The main difference is the fact that in the large frequency limit, the cross-spectra always asymptote to zero, while the power spectra limit to the firing rate. Moreover, the conductance-based and IFB models exhibit spectra that are qualitatively very similar across the frequency range considered.
References
Averbeck, B. B., Latham, P. E., and Pouget, A. (2006). Neural correlations, population coding and computation. Nat. Rev. Neurosci. 7, 358–366.
Bar-Gad, I., Morris, G., and Bergman, H. (2003). Information processing, dimensionality reduction and reinforcement learning in the basal ganglia. Prog. Neurobiol. 71 439–473.
Barreiro, A. K., Shea-Brown, E., and Thilo, E. L. (2010). Time scales of spike train correlation for neural oscillators with common drive. Phys. Rev. E Stat. Nonlin. Soft. Matter Phys. 81, 11916.
Bergman, H., Feingold, A., Nini, A., Raz, A., Slovin, H., Abeles, M., and Vaadia, E. (1998). Physiological aspects of information processing in the basal ganglia of normal and parkinsonian primates. Trends Neurosci. 21, 32–38.
Bronfeld, M., and Bar-Gad, E. (2011). Loss of specificity in basal ganglia related movement disorders. Front. Syst. Neurosci. 5:38 doi: 10.3389/fnsys.2011.00038
Cagnan, H., Meijer, H., van Gils, S., Krupa, M., Heida, T., Rudolph, M., Wadman, W., and Martens, E. (2009). Frequency-selectivity of a thalamocortical relay neuron during Parkinson's disease and deep brain stimulation: a computational study. Eur. J. Neurosci. 30, 1306–1317.
Cohen, M. R., and Kohn, E. (2011). Measuring and interpreting neuronal correlations. Nat. Neurosci. 14, 811–819.
de la Rocha, J., Doiron, B., Shea-Brown, E., Josic, K., and Reyes, E. (2007). Correlation between neural spike trains increases with firing rate. Nature 448, 802–806.
Deniau, J., and Chevalier, E. (1985). Disinhibition as a basic process in the expression of striatal functions. II. The striato-nigral influence on thalamocortical cells of the ventromedial thalamic nucleus. Brain Res. 334, 227–233.
DeVito, J., and Anderson, E. (1982). An autoradiographic study of the efferent connections of the globus pallidus in macaca mullata. Brain Res. 46, 107–117.
Doiron, B., Chacron, M. J., Maler, L., Longtin, A., and Bastian, E. (2003). Inhibitory feedback required for network oscillatory responses to communication but not prey stimuli. Nature 421, 539–543.
Doiron, B., Lindner, A., Longtin, B., Maler, L., and Bastian, E. (2004). Oscillatory activity in electrosensory neurons increases with the spatial correlation of the stochastic input stimulus. Phys. Rev. Lett. 93, 048101.
Dorval, A., Kuncel, A., Birdno, M., Turner, D., and Grill, E. (2010). Deep brain stimulation alleviates parkinsonian bradykinesia by regularizing pallidal activity. J. Neurophysiol. 104, 911–921.
Dorval, A., Russo, G., Hashimoto, T., Xu, W., Grill, W., and Vitek, E. (2008). Deep brain stimulation reduced neuronal entropy in the MPTP-primate model of Parkinson's disease. J. Neurophysiol. 100, 2807–2818.
Filion, M., Tremblay, L., and B'edard, P. J. (1988). Abnormal influences of passive limb movement on the activity of globus pallidus neurons in parkinsonian monkeys. Brain Res. 444, 165–176.
Galan, R. F., Fourcaud-Trocme, N., Ermentrout, G. B., and Urban, E. (2006). Correlation-induced synchronization of oscillations in olfactory bulb neurons. J. Neurosci. 26, 3646–3655.
Gale, J. T., Amirnovin, R. Williams, Z. M., Flaherty, A. W., and Eskandar, E. N. (2008). From symphony to cacophony: pathophysiology of the human basal ganglia in Parkinson disease. Neurosci. Biobehav. Rev. 32, 378–387.
Galvan, A., and Wichmann, E. (2008). Pathophysiology of parkinsonism. Clin. Neurophysiol. 119, 1459–1474.
Garcia, L., Alessandro, G., Bioulac, B., and Hammond, E. (2005). High-frequency stimulation in Parkinson's disease: more or less? Trends Neurosci. 28, 209–216.
Grill, W., Snyder, A., and Miocinovic, E. (2004). Deep brain stimulation creates an informational lesion of the stimulated nucleus. Neuroreport 15, 1137–1140.
Guehl, D., Pessiglione, M., Francois, C., Yelnik, J., Hirsch, E. C., Féger, J., and Tremblay, E. (2003). Tremor-related activity of neurons in the “motor” thalamus: changes in firing rate and pattern in the MPTP model of parkinsonism. Eur. J. Neurosci. 17, 2388–2400.
Guo, Y., Rubin, J. E., McIntyre, C. C., Vitek, J. L., and Terman, E. (2008). Thalamocortical relay fidelity varies across subthalamic nucleus deep brain stimulation protocols in a data-driven computational model. J. Neurophysiol. 93, 1477–1492.
Hanggi, P., Talkner, P., and Borkovec, E. (1990). Reaction-rate theory: fifty years after Kramers. Rev. Mod. Phys. 81, 11916–341.
Heimer, G., Rivlin-Etzion, M., Bar-Gad, I., Goldberg, J. A., Haber, S. N., and Bergman, E. (2006). Dopamine replacement therapy does not restore the full spectrum of normal pallidal activity in the 1-methyl-4-phenyl-1,2,3,6-tetra-hydropyridine primate model. J. Neurosci. 26, 8101–8114.
Hodgkin, A. L., and Huxley, A. F. (1952). The dual effect of membrane potential on sodium conductance in the giant axon of Loligo. J. Physiol. 116, 497–506.
Hurtado, J., Gray, C. M., Tamas, L. B., and Sigvardt, K. A. (1999). Dynamics of tremor-related oscillations in the human globus pallidus. Proc. Natl. Acad. Sci. U.S.A. 96, 1674–1679.
Inase, M., Buford, J., and Anderson, E. (1996). Changes in the control of arm position, movement, and thalamic discharge during local inactivation in the globus pallidus of the monkey. J. Neurophysiol. 75, 1087–1104.
Kass, R. E., and Ventura, E. (2006). Spike count correlation increases with length of time interval in the presence of trial-to-trial variation. Neural Comput. 81, 11916–3591.
Kriener, B., Tetzlaff, T., Aertsen, A., Diesmann, M., and Rotter, E. (2008). Correlations and population dynamics in cortical networks. Neural Comput. 20, 2185–2226.
Lindner, B., Doiron, B., and Longtin, E. (2005). Theory of oscillatory firing induced by spatially correlated noise and delayed inhibitory feedback. Phys. Rev. E Stat. Nonlin. Soft. Matter Phys. 72, 061919.
Lindner, B., Garcia-Ojalvo, J., Neiman, A., and Schimansky-Geier, E. (2004). Effects of noise in excitable systems. Phys. Rep. 392, 321–424.
Marella, S., and Ermentrout, G. B. (2008). Class-II neurons display a higher degree of stochastic synchronization than class-I neurons. Phys. Rev. E Stat. Nonlin. Soft. Matter Phys. 77, 41918.
Molnar, G. F., Pilliar, A., Lozano, A. M., and Dostrovsky, J. O. (2004). Differences in neuronal firing rates in pallidal and cerebellar receiving areas of thalamus in patients with parkinson's disease, essential tremor, and pain. J. Neurophysiol. 93, 3094–3101.
Montgomery, E. Jr., and Baker, E. (2000). Mechanism of deep brain stimulation and future technical developments. Neurol. Res. 22, 259–266.
Moreno-Bote, R., and Parga, E. (2006). Auto-and cross correlograms for the spike response of leaky integrate-and-fire neurons with slow synapses. Phys. Rev. Lett. 96, 28101.
Moreno-Bote, R., Renart, A., and Parga, E. (2008). Theory of input spike autoand cross-correlations and their effect on the response of spiking neurons. Neural Comput. 20, 1651–1705.
Nini, A., Feingold, A., Slovin, H., and Bergman, E. (1995). Neurons in the globus pallidus do not show correlated activity in the normal monkey, but phase-locked oscillations appear in the MPTP model of parkinsonism. J. Neurophysiol. 74, 1800–1805.
Ostojic, S., Brunel, N., and Hakim, E. (2009). How connectivity, background activity, and synaptic properties shape the Cross-Correlation between spike trains. J. Neurosci. 29, 10234–10253.
Pessiglione, M., Guehl, D., Rolland, A., François, C. Hirsch, E. C., Feger, J., and Temblay, E. (2005). Thalamic neuronal activity in dopaminedepleted primates: evidence for a loss of functional segregation within basal ganglia circuits. J. Neurosci. 25, 1523–1531.
Pirini, M., Sensi, L. R. M., and Chiari, E. (2009). A computational approach to investigate different targets in deep brain stimulation for Parkinson's disease. J. Comput. Neurosci. 26, 91–107.
Plesser, H. E., and Gerstner, E. (2000). Noise in integrate-and-fire neurons: from stochastic input to escape rates. Neural Comput. 12, 367–384.
Puil, E., Meiri, H., and Yarom, E. (1994). Resonant behavior and frequency preferences of thalamic neurons. J. Neurophysiol. 71, 575–582.
Raz, A., Vaadia, E., and Bergman, E. (2000). Firing patterns and correlations of spontaneous discharge of pallidal neurons in the normal and the tremulous 1-methyl-4-phenyl-1,2,3,6-tetrahydropyridine vervet model of parkinsonism. J. Neurosci. 20, 8559–8571.
Reitsma, E. (2010). The Transfer of Correlations from Basal Ganglia to Thalamus in Parkinson's Disease. Master's thesis, University of Pittsburgh, Pittsburgh, PA.
Renart, A., de la Rocha, J., Bartho, P., Hollender, L., Parga, N., Reyes, A., and Harris, K. D. (2010). The asynchronous state in cortical circuits. Science 327, 587–590.
Rivlin-Etzion, M., Marmor, O., Heimer, G., Raz, A., Nini, A., and Bergman, E. (2006). Basal ganglia oscillations and pathophysiology of movement disorders. Curr. Opinion Neurobiol. 16, 629–637.
Rivlin-Etzion, M., Marmor, O., Saban, G., Rosin, B., Haber, S. N., Vaadia, E., Prut, Y., and Bergman, E. (2008). Low-pass filter properties of basal ganglia-cortical-muscle loops in the normal and MPTP primate model of parkinsonism. J. Neurosci. 28, 633–649.
Rosenbaum, R., and Josic, E. (2011). Mechanisms that modulate the transfer of spiking correlations. Neural Comput. 23, 1261–1305.
Rubin, J. E., and Terman, E. (2004). High frequency stimulation of the subthalamic nucleus eliminates pathological thalamic rhythmicity in a computational model. J. Comput. Neurosci. 16, 211–235.
Shea-Brown, E., Josic, K., de la Rocha, J., and Doiron, E. (2008). Correlation and synchrony transfer in integrate-and-fire neurons: basic properties and consequences for coding. Phys. Rev. Lett. 100, 108102.
Smith, G. D., Cox, C. L., Sherman, S. M., and Rinzel, E. (2000). Fourier analysis of sinusoidally driven thalamocortical relay neurons and a minimal integrate-and-fire-or-burst model. J. Neurophysiol. 83, 588–610.
Stroeve, S., and Gielen, E. (2001). Correlation between uncoupled conductancebased integrate-and-fire neurons due to common and synchronous presynaptic firing. Neural Comput. 13, 2005–2029.
Tchumatchenko, T., Malyshev, A., Geisel, T., Volgushev, M., and Wolf, E. (2010). Correlations and synchrony in threshold neuron models. Phys. Rev. Lett. 104, 58102.
Tetzlaff, T., Rotter, S., Stark, E., Abeles, M., Aertsen, A., and Diesmann, E. (2008). Dependence of neuronal correlations on filter characteristics and marginal spike train statistics. Neural Comput. 20, 2133–2184.
Wichmann, T., Bergman, H., Starr, P. A., Subramanian, T., Watts, R. L., and DeLong, M. R. (1999). Comparison of MPTP-induced changes in spontaneous neuronal discharge in the internal pallidal segment and in the substantia nigra pars reticula in primates. Exp. Brain Res. 125, 397–409.
Wichmann, T., and Soares, E. (2006). Neuronal firing before and after burst discharges in the monkey basal ganglia is predictably patterned in the normal state and altered in parkinsonism. J. Neurophyisol. 95, 2120–2133.
Wiesenfeld, K., Pierson, D., Pantazelou, E., Dames, C., and Moss, E. (1994). Stochastic resonance on a circle. Phys. Rev. Lett. 72, 2125–2129.
Keywords: correlation, basal ganglia, Parkinson's disease, synchrony, thalamus, bursting, oscillations, point process
Citation: Reitsma P, Doiron B and Rubin J (2011) Correlation transfer from basal ganglia to thalamus in Parkinson's disease. Front. Comput. Neurosci. 5:58. doi:10.3389/fncom.2011.00058
Received: 19 August 2011; Accepted: 16 November 2011;
Published online: 13 December 2011.
Edited by:
David Hansel, University of Paris, FranceReviewed by:
Markus Diesmann, RIKEN Brain Science Institute, JapanAndre Longtin, University of Ottawa, Canada
Arthur Leblois, Centre National pour la Recherche Scientifique, France
Copyright: © 2011 Reitsma, Doiron and Rubin. This is an open-access article distributed under the terms of the Creative Commons Attribution Non Commercial License, which permits non-commercial use, distribution, and reproduction in other forums, provided the original authors and source are credited.
*Correspondence: Jonathan Rubin, Department of Mathematics, University of Pittsburgh, 301 Thackeray Hall, Pittsburgh, PA, USA. e-mail:cnViaW5AbWF0aC5waXR0LmVkdQ==