
 Shmuel Zamir2
- 1Department of Industrial Engineering and Management, Jerusalem College of Technology, Jerusalem, Israel
- 2Center for the Study of Rationality, The Hebrew University of Jerusalem, Jerusalem, Israel
- 3Department of Neurobiology, Interdisciplinary Center for Neural Computation (ICNC) and Edmond and Lily Safra Center for Brain Sciences, Institute of Life Sciences, The Hebrew University, Jerusalem, Israel
The fibers in a skeletal muscle are divided into groups called “muscle units” whereby each muscle unit is innervated by a single neuron. It was found that neurons with low activation thresholds have smaller muscle units than neurons with higher activation thresholds. This results in a fixed recruitment order of muscle units, from smallest to largest, called the “size principle.” It is thought that the size principle results from a competitive process—taking place after birth—between the neurons innervating the muscle. The underlying mechanism of the competition was not understood. Moreover, the results in the majority of experiments that manipulated the activity during the competition period seemed to contradict the size principle. Experiments at the isolated muscle fibers showed that the competition is governed by a Hebbian-like rule, whereby neurons with low activation thresholds have a competitive advantage at any single muscle fiber. Thus neurons with low activation thresholds are expected to have larger muscle units in contradiction to what is seen empirically. This state of affairs was termed “paradoxical.” In the present study we developed a new game theoretic framework to analyze such competitive biological processes. In this game, neurons are the players competing to innervate a maximal number of muscle fibers. We showed that in order to innervate more muscle fibers, it is advantageous to win (as the neurons with higher activation thresholds do) later competitions. This both explains the size principle and resolves the seemingly paradoxical experimental data. Our model establishes that the competition at each muscle fiber may indeed be Hebbian and that the size principle still emerges from these competitions as an overall property of the system. Thus, the less active neurons “lose the battle but win the war.” Our model provides experimentally testable predictions. The new game-theoretic approach may be applied to competitions in other biological systems.
Introduction
During the development of the nervous system, neural circuits are being established and their connections are being refined (Kandel et al., 2000). In some neural circuits (e.g., in the mammalian cortex) this process continues throughout the life of the animal (Kandel et al., 2000; Martin et al., 2000), whereas in other systems the final steps of network formation take place a few weeks after birth (van Ooyen, 2001). A well-studied case of this form of plasticity is the withdrawal of synaptic connections that takes place in several parts of the nervous system (Lichtman, 1977; Purves and Lichtman, 1980; van Ooyen and Willshaw, 1999; van Ooyen, 2001). Here we analyze such a withdrawal of synaptic connections, which occurs between motoneurons (MNs) (i.e., motor neurons) and their target muscle during the first couple of weeks after birth in vertebrates (Lichtman and Colman, 2000; Walsh and Lichtman, 2003; Fox et al., 2011).
A typical skeletal muscle is composed of many thousands of fibers. At birth, each muscle fiber is innervated by several MNs; (Figure 1A). But during the first couple of weeks after birth, there is a competitive process at each muscle fiber called “synapse elimination,” which abolishes the connections of all but one of the MNs (Figure 1B). We call this MN “the winner at that muscle fiber.” For example, in Figure 1A, the top muscle fiber is at first innervated by two (yellow and green) MNs. Following synapse elimination (Figure 1B) only the green MN innervates this fiber; thus, this MN is the winner in the competition for this particular fiber.
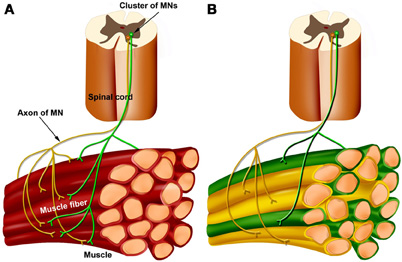
Figure 1. Schematics depicting the development of motor-muscle innervation. The motoneurons (MNs) innervating the muscle are clustered into a nucleus within the ventral spinal cord (top). Two (green and yellow) MNs and a group of muscle fibers are shown. (A) At birth each muscle fiber is innervated by several MNs. (B) When synapse elimination ends, each muscle fiber is innervated by a single MN but each MN innervates a set of several muscle fibers called a muscle unit. Two muscle units are shown—the green muscle fibers and the yellow muscle fibers, each innervated by a corresponding MN.
Because each MN initially innervates many muscle fibers, it is engaged in many competitions simultaneously, and it eventually wins some competitions and loses others. When the competition period ends, each muscle fiber is innervated by a single MN (the winner), but each MN innervates a group of muscle fibers, called a “muscle unit” (Lichtman and Colman, 2000). Thus, in the mature system, the muscle fibers are divided into muscle units whereby each unit is innervated and activated by a single MN. The MN together with its muscle unit is called a “motor unit.” Figure 1B depicts two muscle units (green and yellow) that are innervated by green and yellow “winner” MNs, respectively.
MNs have different thresholds for spike initiation; MNs with higher activation thresholds are less active, as they require stronger input to be activated, hence they are referred to as the “less active MNs.” The most active MNs have smaller size on average and will ultimately innervate slow contracting muscle fibers, whereas the less active MNs have larger size on average and will ultimately innervate fast contracting fibers (see more on that in “The differentiation process” in the Discussion). It was found that when a stimulus arrives at a cluster of MNs, there is a fixed recruitment order of MNs, starting with the most active MNs and ending with the least active ones. This is the original formulation of the “size principle”by Henneman (Henneman, 1957; Mendell, 2005; Cooper and Donald, 2005). Interestingly, by the end of synapse elimination, the less active MNs have larger muscle units (i.e., they innervate more muscle fibers) than the more active MNs (Barber and Lichtman, 1999; Kandel et al., 2000). Thus, we could rephrase the size principle so that it refers to the muscle units rather than to the MNs—namely, that there is a fixed recruitment order of muscle units, from smallest to largest. This ordered relationship between recruitment threshold and muscle unit size is essential to the optimal function of the muscle (Cope and Pinter, 1995; Senn et al., 1997).
The size principle was found to hold in many vertebrates (Cope and Pinter, 1995) and is considered to be one of the most fundamental principles in the organization of motor-muscle systems. It is, therefore, of great importance to understand how this principle emerges. In order to answer this question, we need to understand why the less active MNs have larger muscle units than the more active MNs, yielding the fixed recruitment order of muscle units. This is the focus of the present study. Note that at birth there is no correlation between the activation threshold of an MN and the number of fibers it innervates. This correlation appears only at the end of the competition period and is, therefore, believed to result from the competition. However, prior to the present work there was no theoretical framework that linked the competition among MNs to their final innervation pattern, and thus the emergence of the size principle was not understood. In particular, it was not clear why being less active is advantageous for the MN in this competitive process.
Furthermore, there exists another puzzle. The majority of experiments that have manipulated the activity of MNs during synapse elimination seem to point to the opposite conclusion, namely, that the more active MNs are advantageous in this process (O'Brien et al., 1978; Ribchester and Taxt, 1983; Ridge and Betz, 1984; Connold et al., 1986; Lo and Poo, 1991; Dan and Poo, 1992; Balice-Gordon and Lichtman, 1994; Liu et al., 1994). For example, in an experiment by (Ridge and Betz 1984), the activity of some (but not all) of the MNs was enhanced during the competition period, which resulted in larger muscle units for the stimulated MNs at the expense of the un-stimulated MNs. In a blocking experiment of (Ribchester and Taxt 1983), the activity of some (but not all) of the MNs was blocked, which resulted in smaller muscle units for the blocked MNs. Only the results of one experiment (Callaway et al., 1987) seemed to point to an advantage of the less active MNs (in accordance with the size principle). In this experiment, the blocking period was shorter (four days) and then activity was recovered. In contrast to the blocking experiment of Ribchester and Taxt, the muscle units of the blocked MNs were larger than usual.
In addition, experiments that were executed on isolated muscle fibers have all pointed to an advantage of the more active (i.e., stimulated) MN (O'Brien et al., 1978; Connold et al., 1986; Lo and Poo, 1991; Dan and Poo, 1992; Balice-Gordon and Lichtman, 1994; Liu et al., 1994). This is consistent with a Hebbian model, in which simultaneous pre- and post-synaptic activity strengthens the connection. In the motor-muscle system, all the connections start out strong and each time an MN is active it succeeds, on its own, to activate the muscle fiber, and thus to strengthen the connection between them (Brown et al., 1976). This means that the more active MNs are advantageous over the less active MNs. This conclusion seems to contradict the end result—that the more active MNs have smaller muscle units, as how could the more active MNs that have an advantage at single competitions eventually win in a smaller number of competitions in comparison with the less active MNs, which are disadvantageous at single competitions? In other words: how could those MNs that “win in the battles also lose the war?” Indeed, this contradictory experimental data has been referred to as “paradoxical” by several authors (Barber and Lichtman, 1999). Our study aimed to establish the missing theoretical framework required for both explaining the size principle as well as resolving the apparent paradox.
In analyzing our model we used two approaches: mathematical proofs of the main results and simulations. The mathematical proofs appear in a separate paper (Nowik, 2009). The present paper concentrates on the simulation results, on the biological implications of our model and on the biological features and background of synapse elimination in the neuromuscular system and in other systems in the nervous system as well.
Materials and Methods
Model Assumptions
The assumptions of our model are all based on experimental results. We state our assumptions here and present the experimental results underlying these assumptions in the Discussion. For a mathematical formulation and analysis of the game, see Nowik, 2009.
In our game model the “players” are the MNs. Each player has a “strategy.” A strategy in game theory can be thought of as a book instructing the player how to behave in each and all circumstances. In classic game theory (where the players are considered rational) the player chooses its strategy (i.e., the player writes its instruction book), but in biology, the strategy is usually a behavioral phenotype meaning that the players are programmed (by their genes) to act the way they do (Myerson, 1991).
In the motor system, the activity level of an MN is determined according to its activity threshold, (which in turn is determined according to various anatomical features, such as the MN's soma size). As we wish to explain the effect of the activity level of an MN on the final size of its muscle unit, we defined the “strategy” of an MN as its activity level and its “payoff” as the final size of its muscle unit. The activity level of an MN, is a very simple strategy, as it is fixed, namely, it is the same in all circumstances, and does not change over time (except for the special case when MNs are blocked or stimulated).
In our model, we divided the MNs into two equal-sized groups: the group of the more active MNs, which we named the M-group, containing the MNs with activity levels higher than the median, and the group of the less active MNs, which we named the L-group, containing the MNs with activity levels lower than the median. Although the players in our game are the MNs, the mathematical analysis and the simulations of this game are executed at the level of the groups. This was done for mathematical convenience and does not imply that members of the same group cooperate in some manner.
We assumed that MNs and muscle fibers are initially connected to one another in a completely random fashion (Willshaw, 1981). Namely, that each MN connects to each muscle fiber with a fixed probability, independently of all other connections.
The activity level of a muscle fiber is determined by the MNs innervating it, for example, a muscle fiber that is innervated by relatively active MNs will be more frequently activated. Hence we defined the activity level Xi of muscle fiber i as the sum of activity levels of the MNs innervating it.
We assumed that the more frequently a muscle fiber is activated, the faster its competition ends (O'Brien et al., 1978; Thompson et al., 1979; Ribchester and Taxt, 1984; Vyskocil and Vrbova, 1993). Thus, although all of the competitions at the muscle fibers start at approximately the same time (at birth), they end at different times. A multi-stage game was thus defined: Having N competitions (at N muscle fibers), we have N stages in the game. At stage k, the competition at the k-th most active muscle fiber comes to an end and it is left with only one innervating MN (the winner). If the winner is from the M-group, we say that the M-group won that muscle fiber (and similarly, if the winner belongs to the L-group, we say that the L-group won there).
Finally, we assumed that when an MN wins at a given muscle fiber, this reduces its future winning probabilities at other muscle fibers. This assumption of resource limitation reflects the empirical fact that after winning at a muscle fiber, the MN must allocate resources to maintain its connection with this muscle fiber (Kasthuri and Lichtman, 2003). Obviously, the “winning probability” of a group at a muscle fiber is the sum of winning probabilities of its members connecting to that muscle fiber. Consequently, when an MN wins at a muscle fiber, this does not only reduce its own future winning probabilities (because of its limited resources) but also the future winning probabilities of its group (Nowik, 2009).
Simulations
We proved mathematically that the model predicts that the less active MNs win larger muscle units than the more active MNs thus enabling the emergence of the size principle (Nowik, 2009). In the present study we simulated our game-based model with MatLab. Each simulation had two phases:
- The “initial conditions” in which MNs were assigned activity levels and the connectivity pattern was chosen (namely, which MNs connect to which muscle fibers). These two factors determined the activity level of each muscle fiber and thus determined the stages of the game (i.e., the order by which the competitions were resolved).
- The “course of the game” in which the competitions occurred sequentially, according to the initial conditions and the results of previous competitions.
(a) Initial conditions
In all simulations there were 100 MNs (i.e., players) and N = 10,000 muscle fibers (i.e., stages). The initial probability of a connection between an MN and a muscle fiber was 0.05. The activity levels of the MNs were drawn from the uniform distribution over [0, 1] and accordingly, we divided the MNs into two equal-sized groups: the more active M-group, and the less active L-group. Figure 2 shows an example of this procedure. The activity level of four MNs was drawn from a uniform distribution (circled numbers on top). Accordingly, MNs 1 and 3 have higher activity levels and constitute the M-group whereas MNs 2 and 4 have lower activity levels and form the L-group. Next, the activity level of a muscle fiber was computed as the sum of activity levels of the MNs innervating it. This determined the sequential ending times of the competitions (i.e., the stages) according to a decreasing level of activities of the muscle fibers as explained in the previous section.
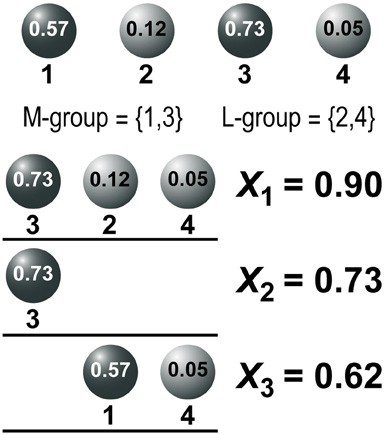
Figure 2. An example of a simulation of the initial conditions. Top. The activity level of four MNs is depicted (numbers in circles): the two most active MNs constitute the M-group whereas the two less active MNs are the L-group. Below, three muscle fibers are presented (thick lines) together with their innervation pattern, selected at random. For each muscle fiber, the activity level of the corresponding MNs is summed up and the muscle fibers are sequenced according to a decreasing level of activity: 0.9 > 0.73 > 0.62.
In Figure 2 three muscle fibers (straight horizontal lines) are shown. The first muscle fiber was innervated by MNs 3, 2, and 4; the second muscle fiber by MN 3; and the third muscle fiber by MNs 1 and 4. The activities X1, X2, and X3 of the three muscle fibers are the sum of activities of the innervating MNs. The muscle fibers were sequenced according to decreasing levels of activity: 0.9 > 0.73 > 0.62. Accordingly, the game had three stages. At the first stage the competition at the most active muscle fiber (with X1 = 0.9) was resolved. At the second stage the competition at the second most active muscle fiber (with X2 = 0.73) was resolved, and at the last stage the competition at the least active muscle fiber (with X3 = 0.62) was resolved. The competitions were mediated as follows:
The prior winning probabilities.
We defined a prior (or basic) winning probability of the M-group at each muscle fiber based on the proportion of connections of the M-group at the muscle fiber. When we chose the prior winning probability to equal the proportion of connections of the M-group, we called the competition “a fair competition.” For example, in the first muscle fiber, in Figure 2, 1/3 of the connections were of M-group. Thus, in a fair competition, we set the M-group prior winning probability there to be P1 = 1/3. Similarly, the prior winning probabilities of the M-group at the two last muscle fibers were P2 = 1, and P3 = 1/2, respectively. These prior winning probabilities were then updated according to the following section.
(b) The course of the game and updated winning probabilities
We defined a sequence of random variables: W1, W2, …, WN, where Wj is the difference between the number of the M-group's victories and the number of the L-group's victories, at the end of stage j. We started by simulating the competition at the first stage (i.e., at the most active muscle fiber) according to the prior winning probability of the M-group there (1/3). If the M-group won, we set W1 = 1 and reduced the winning probability of the M-group at the next stage by μ = 0.005. In this case the updated winning probability of the M-group at the second muscle fiber in Figure 2 would be: P2− μ = 1 − 0.005 = 0.995. However, if the M-group lost the first competition, we set W1 = −1 and increased the winning probability of the M-group at the next stage by μ = 0.005 (but since in our example P2 =1 we cannot increase it). We then simulated the competition at the second muscle fiber, according to the updated winning probability there, and so on. The general formula for the updated winning probability of the M-group at the k-th competition is: Pk − μ Wk−1, where Pk is the prior winning probability of the M-group at the k-th muscle fiber, μ = 0.005 and Wk−1 is the difference between the number of the M-group's victories and the number of the L-group's victories, at the end of stage k−1.
Results
Our work resulted in four main findings: first, our model predicted the emergence of the size principle (namely, that less active MNs win larger muscle units than more active MNs). Second, the size principle does not contradict the notion of a Hebbian competition at the single muscle fibers. Third, our model yielded the experimental results of Callaway et al. (1987, 1989) and (Ribchester and Taxt 1983) that seemed to contradict one another. This means that these experimental results are in fact not contradicting and finally we developed an equation (Nowik, 2009) that may be useful in identifying the factors that influence the expression of the size principle.
Obtaining the Size Principle from Our Model
To show that the size principle emerges from our model we needed to show that WN< 0. Namely, that by the end of the game, the less active MNs (the L-group) win more competitions than the more active MNs (the M-group).
Our first result was that even if the competition at the single muscle fiber was “unfair” (i.e., biased to a large, but limited, extent in favor of the more active MNs) the less active MNs still won the game. By this our model explains the emergence of the size principle from the competition process. At the same time it resolves the seeming contradiction between the size principle and the experimental results from isolated muscle fibers, since it shows that the mechanism for the competition at a muscle fiber may well be Hebbian (biasing the competition in favor of the more active MNs), and still the less active MNs win more competitions than the more active MNs, yielding the size principle. In the Discussion we provide the insights for this result.
Figure 3A depicts possible choices for the prior winning probability function (as the true function is unknown). The dotted line presents a “fair” prior function, namely that the prior winning probability of a group equals the fraction of connections of that group at the muscle fiber. The solid line is the function: ρ (x) = (1−e−3x)(1−e−3), which is an example of a prior winning function that is strongly biased in favor of the M-group. Figure 3A demonstrates the degree of the bias of ρ, that if half of the connections are of the M-group (i.e., x = 0.5), the M-group wins with a probability of about y = 0.8. These two functions (the fair and the biased) are then used as the prior winning functions in the game simulations presented in Figure 3B as follows:
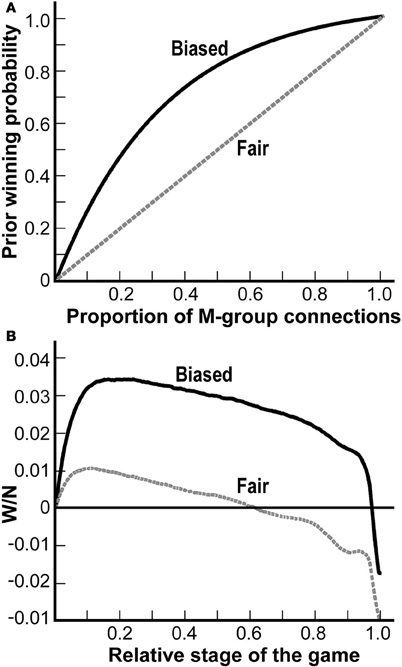
Figure 3. The emergence of the size principle. Even when the game is strongly biased in favor of the more active MNs, the less active MNs still win the game. (A) Two examples of prior winning functions of the M-group at a single muscle fiber are shown: a biased function (solid line) and an unbiased function (dashed line). The x-axis denotes the fraction of M-group connections at a muscle fiber and the y-axis represents the winning probability of the M-group at that muscle fiber. (B) Simulations of the biased and unbiased games implementing the biased (solid line) and the unbiased (dashed line) prior winning functions depicted in A. These prior winning probabilities were updated along the game. The x-axis is the relative stage of the game and the y-axis shows the normalized difference in the number of victories throughout the game. As seen, at the end of both games, the L-group wins over the M-group as the lines are below the zero line.
Denote: qk = the fraction of connections of the M-group at muscle fiber k. If the game is fair, the updated winning probability of the M-group at the kth stage is: qk − μWk−1, whereas if the game is biased in favor of the M-group, the updated winning probability of the M-group at the kth stage is: ρ(qk) − μWk−1. For example, in the biased game, if the M-group holds 0.3 of the connections at the fourth muscle fiber, then its updated winning probability at the fourth competition would be: P4 − μW4−1 = ρ(0.3) − μW3 = 0.6245 − μW3. If, for example, the M-group won the first competition and lost the 2nd and 3rd competitions, then: W3 = −1. Using μ = 0.005 we get that the updated winning probability of the M-group at the 4th muscle fiber is: 0.6245 − μW3 = 0.6245 − 0.005 · (−1) = 0.6295.
The x-axis in Figure 3B denotes the relative stage of the game (e.g., x = 0.5 corresponds to the stage 0.5N = 5000, or halfway through the game). The y-axis shows the difference between the number of victories of the M- and the L-groups. This difference is normalized (i.e., divided by the number of stages N = 10,000) and is averaged over 100 games. The dotted and solid lines describe the results of the two games: the fair game (dotted line) and the biased game (solid line).
As seen in Figure 3B, at the beginning, in both cases, the M-group wins more competitions than the L-group, as the two lines are above zero. Later on, however, this is reversed and finally the L-group wins more than the M-group, as both lines are below zero at the end of the game (p-values< 10−107, one-tailed t-test). Note that the solid line is above the dotted line all along the game. This is not surprising, as the solid line refers to the biased game; thus the M-group does better when the game is biased in its favor, yet it still loses the game. Thus our model predicts the emergence of the size principle from the competitive process of synapse elimination.
Losing the Battle but Winning the War
In his study, referring to his finding that blocked MNs win larger muscle units, Callaway et al. (1987) writes: “We found that inactive motor neurons have a significant advantage compared to active counterparts in control experiments, a finding opposite to that expected if the neuromuscular junction operated by classical ‘Hebbian’ rules of competition.” Thus, the fact that blocked MNs showed an overall advantage (as their muscle units were larger) seemed previously to stand in contradiction to the idea (and experimental results) supporting a Hebbian competitive mechanism at the single muscle fibers.
In contrast to the above view, our model shows that although the less active MNs win in more competitions than the more active MNs, the mechanism of the competition may still be Hebbian. The solid line in Figure 3A presents a biased competition at a muscle fiber. This corresponds to Hebbian competition favoring the more active MNs. Figure 3B shows that even if the competition at any single muscle fiber is Hebbian, biasing the competition against the less active MNs, the less active MNs still win in more competitions (solid line beneath zero at x = 1 in Figure 3B). In other words, according to our model, although the less active MNs are disadvantaged at the single battles, they still win the war.
Explaining the Contradictory Blocking Experiments
We mentioned earlier that there is only one experiment that is consistent with the size principle (but inconsistent with all other experimental data on this matter), by pointing to an advantage to the less active MNs. This experiment (Callaway et al., 1987) was conducted on the neonatal rabbit soleus muscle, which is innervated by the spinal nerves S1, S2, and L7. Activity was selectively blocked only in L7 or S2 but not in S1 during the competition period. The blockage continued for a few days and was then removed to allow for activity recovery. Other rabbit soleus muscles, in which no blocking was implemented, served as a control group. It was found that the muscle units of the blocked MNs were larger than those in the control. This was at the expense of the unblocked MNs, which had smaller muscle units than the control. However, in a similar blocking experiment on the rat lumbrical muscle (Ribchester and Taxt, 1983), in which the blocking period was significantly longer and activity was not resumed, the result was opposite to that of Callaway, namely the muscle units of the blocked MNs were smaller than usual (i.e., smaller than in the control).
In the simulation presented in Figure 4, we introduced the blocking procedure of both experiments into our game. This time, we divided the population of MNs into “blocked” and “unblocked” groups, instead of the former L- and M-groups. Blocking was implemented by setting the activity of the blocked MNs to 0, reducing the prior winning probability of the blocked group to 0 and reordering the muscle fibers according to their new activity levels. In the new order, competitions at muscle fibers innervated by blocked MNs were now postponed as their activity was reduced by the blocking. This delay was also found empirically by Callaway et al. (1989). If activity was resumed, the blocked MNs regain their original activity levels, and the muscle fibers in which the competition was not yet resolved were then reordered according to their updated activity levels. In the simulation of the control group, the MNs were divided randomly into two equal-sized groups and no manipulation was applied to either group.
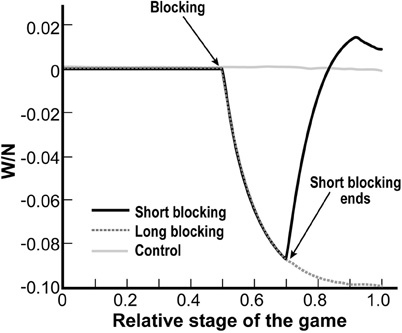
Figure 4. Resolving the paradox in the blocking experiments results. Simulations of the short blocking procedure of Callaway et al. (1987, 1989; black solid line) and the long blocking procedure of Ribchester and Taxt (1983; broken line), against control (gray solid line). Depicted is the normalized difference in the number of victories between the blocked and unblocked groups. Activity is blocked in the middle of the game. In the imitation of Ribchester and Taxt (broken line), the blocked group loses whereas in the imitation of Callaway's experiments, the blocked group wins significantly more than control as the black solid line is higher than the gray solid line at x = 1 (p-value < 10−27).
In Figure 4, the solid black line represents the simulation imitating the conditions of the short blocking experiment (Callaway et al., 1987), the broken line represents the simulation for the conditions of the long blocking experiment (Ribchester and Taxt, 1983), and the solid gray line represents the control experiment. We began and ended the “blocking” in accordance with what was done in the actual experiments. Thus, in both blocking simulations (black solid line and broken line), activity was “blocked” at the middle of the game period (x = 0.5). In the short blocking simulation we stopped the blocking at x = 0.7, whereas in the long blocking simulation we continued the blocking until the end of the game.
Depicted is the normalized (i.e., divided by the number of stages) difference in the number of victories between the blocked and unblocked groups, averaged over 100 games. In the simulation of the control, we expected to see that all along the game the two groups win roughly the same number of competitions (since the MNs in the control were assigned to the groups randomly, independent of their activity levels). Indeed, the gray solid line was close to zero all along the game. By examining the simulations of the blocking procedures (solid and broken lines) we see that the blocked groups lose the competitions that occur during the blocking period (both the solid and broken lines are decreasing during the blocking period).
More importantly, in the long blocking simulation (broken line) in which the blocking continued until the end of the game, the blocked group lost (broken line beneath 0 at x = 1). In particular, it did worse than the control (broken line in comparison with gray solid line at x = 1). Thus, our model indeed predicts the experimental results of the long blocking of Ribchester and Taxt. At the same time, resuming the activity, as was done in the short blocking experiment (black solid line at x = 0.7), caused the previously-blocked group to start winning so that in the end they won even more than if they had not been blocked at all (black solid line in comparison with gray solid line at x = 1). This prediction is again in accordance with the short blocking results of Callaway. Thus, our model produces the experimental results of both experiments, implying that there is no contradiction between the results of the different blocking experiments.
Note that the black solid line in Figure 4 illustrates one of the puzzles of this process. Even though blocking the activity of a group of MNs dramatically reduces their victories during the blocking period, eventually they win more than if they had not been blocked at all. This phenomenon, seen in Callaway's experiments and also predicted by our model, will be further elaborated upon in the Discussion.
Discussion
The process of synapse elimination in the motor-muscle system is competitive in the sense that the fate of a connection by one MN depends on the presence or absence of connections by other MNs. There are two main experimental results that imply that synapse elimination is indeed competitive. The first is that when synapse elimination ends, each muscle fiber is innervated by a single MN. If the elimination processes of different MNs were independent, one would also expect multiply innervated muscle fibers or muscle fibers with no connections at all. The second is that if some of the axons are cut during the competition period, then at the end of the period the remaining intact MNs innervate more muscle fibers than usual (Thompson and Jansen, 1977; Fladby and Jansen, 1987).
The New Game Theoretic Approach
Game theory has traditionally been applied to biology through evolutionary games (Maynard Smith, 1982). Evolutionary game theory provides a dynamic framework for analyzing repeated interaction between players, which are typically animals, plants or even genes. Strategy selection, in evolutionary games, is driven by natural selection, hence the competition spans over generations and we thus refer to it as a “macro-level competition.”
Although evolutionary game theory successfully explains various phenomena (Maynard Smith and Harper, 2003), there are many interactive competitive processes that should additionally be analyzed on a much shorter time-scale than that considered in evolutionary dynamics. We refer to such competitions as “micro-level competitions.” As the two-week competition between the MNs is competitive, it can benefit from a game theoretic analysis, as we have shown.
The novelty of our approach is to apply game theory not only to the macro-level evolutionary competition but to the micro-level competition as well. Practically, instead of defining the “payoffs” to the players as the change in their fitness (as done in evolutionary games), one should define the payoffs in relation to the specific questions addressed. This method addresses different questions than the ones addressed by evolutionary games. An evolutionary game would have been the appropriate model had our question been: what is the evolutionary advantage of the size principle? However, the importance of the size principle to the functioning of the motor system is well understood (Senn et al., 1997; Kandel et al., 2000). Our question is on a different level: How does the size principle emerge from the two-week competition between the MNs? To answer this we needed to apply a game theoretic approach to this “micro-level” competition to understand what are the rules governing it that eventually yield the size principle. We have, therefore, defined the “players” (MNs), “strategies” (activity levels) and “payoffs” (final size of muscle units) tailored to this specific question.
The evolutionary advantage of properties such as the size principle, which emerge as a consequence of competition rather than being genetically hardwired, is that it endows the system with plasticity (or adaptation capabilities), such that the outcome may be fine-tuned to fit the environment. In accordance with this idea, our model provides an equation (Nowik, 2009) that can be used for predictions regarding the magnitude of the size principle in different environments (i.e., different muscles). This presents another advantage of our novel approach over evolutionary game theory, in that it may provide testable predictions (e.g., in the present case, the predictions refer to results which are observed after two weeks).
We believe that the necessity of applying such a game-theoretic approach is shown in the present work. When analyzing a biological competitive process one must identify not only the biological or chemical factors that govern the competition, but also the mathematical characteristics of the competition. In this work we proved a mathematical principle: that when resources are limited and are needed for the maintenance of previous victories, then in order to win more competitions one should aim to win later competitions rather than earlier ones. This mathematical principle enabled us to provide the missing theoretical link between the competition among MNs and their final innervation pattern. Although the effect of activity on the speed of synapse elimination (i.e., the larger the activity, the faster the competition ends) was known for over 20 years, it was never identified as the source of the size principle. The reason is that it was not recognized that this effect has a competitive value, as it gives an advantage to the less active MNs.
Our mathematical formulation of the game (Nowik, 2009) is much more general than the equation producing the simulations above. This generality endows our model with robustness, as it allows a broad range of possible biological behaviors. It is especially important in light of the uncertainties regarding the mechanism underlying synapse elimination. Thus, despite not knowing both the specific rule by which resource limitation is implemented and the specific competitive rule that mediates the competition at the isolated muscle fiber, the model was still able to explain the emergence of the size principle.
Although the assumptions of the game are tailored to the specific biological system, the results are easily generalized to a much wider variety of situations. For example, in an economical system, when facing a multi-stage competitive situation in which resources are limited and are needed for the maintenance of previous victories, winning later is advantageous. Hence the strategic implication is that if one needs to allocate his resources in advance, one should invest more in later competitions rather than in earlier ones.
Competitive Processes in the Central Nervous System and Synapse Elimination
In many parts of the developing nervous system, the formation of functional neural networks is influenced by early network electrical activity (Katz and Shatz, 1996; Zhang and Poo, 2001). In particular, the importance of synapse elimination was shown in the development of several systems (e.g., the visual system, the cerebellum) in the central nervous system. In these systems, the refinement of afferent projections to a target population segregated these afferents into functionally-appropriate domains.
In the visual system, Hubel and colleagues discovered a developmental competition between the eyes for the control of cortical space (Hubel et al., 1977b; Wiesel, 1982; Lein and Shatz, 2000; Syken et al., 2006). In the mature visual cortex there is an orderly arrangement of alternating columns of cells, in which each column receives input from only one eye. These ocular dominance columns are important for binocular interaction (Lein and Shatz, 2000; Syken et al., 2006). Similarly to the motor-muscle system, the difference in the activity level of the source neurons in the LGN (lateral geniculate nucleus) during the development of ocular dominance columns seems to be central in the segregation of the target neurons in the visual cortex into ocular dominance columns. Changing the balance of activity in the fibers of the two eyes may dramatically disrupt the establishment of ocular dominance columns. In the motor-muscle system we asked: what are the rules of the competition that eventually yield the size principle? Similarly, it is interesting to ask: what are the rules of the competition in the visual system that leads to the formation of the ocular dominance columns? Unlike the motor-muscle system, the connection between an LGN neuron and its target cell in layer 4 of the visual cortex is not strong enough as to singly activate the target cell but rather the recruitment of several LGN neurons is required in order to activate the target cell (Bruno and Sakmann, 2006). This introduces the idea of “cooperation” between neurons as a factor that may be important in the process.
One possibility is that neighboring axons from the same eye cooperate in the excitation of a target cell through synchronization of their firing. In this view, cooperative action might strengthen the synaptic contacts of the cooperating neurons on the expense of the non-cooperating neurons (Kandel et al., 2000). In this sense, fibers from the two eyes compete for a target cell, and together, cooperation and competition may be able to explain the emergence of ocular dominance columns. In terms of a game theoretic model, it may be helpful to look at models of games between teams. A team is a group of players, which cooperate among themselves. In contrast, in the motor-muscle model we presented here we assumed the MNs do not cooperate (as each connection was strong enough to singly activate the muscle fiber).
Synaptic elimination also occurs in the cerebellum, where climbing fibers disconnect from Purkinje cells (Crepel et al., 1976; Lohof et al., 1996), and in the autonomic ganglia, where preganglionic inputs disconnect from ganglion cells (Hubel et al., 1977a). Each of these competitive processes has its unique characterizations and models have been developed to understand the rules of the competitions (e.g., Hua et al., 2005).
In the mature cerebellum, afferents in the climbing fiber pathway are organized into precise sagittal bands and subdivided into microzones, which are considered to be the functional data processing units in the cerebellum (Oscarsson, 1979). In the adult, the cerebellar Purkinje cells (PCs) receive two classes of excitatory synapse: one of which is by a single axon of the inferior olivary neurons, the climbing fibers (CFs). However, at birth, the PC is contacted by several CFs and during the second postnatal week the elimination of all CFs but one occurs. This indeed resembles the motor-muscle system in which there is only one winner at each target. Synapse elimination in the cerebellum is thought to be involved in both the formation of the microzones and in the segregation of inputs to ipsilateral and contralateral inputs (Lohof et al., 1997). However, the effect of the total amount of activity on the paste of the competitions (i.e., competitions end fast at relatively active targets), found in the motor-muscle system, is not known to exist in the CF-PC system. This feature was central in our model for the motor-muscle system as it was shown to be the source of a bias in favor of the less active MN. An appropriate modeling of the cerebellar game may be as a continuous game (i.e., the strategy set is continuous), in which each player (i.e., each CF cell) “chooses” where to send its axon initially (Stein et al., 2008).
Our work suggests that applying a game theoretic approach for studying such competitive neural processes may provide a deeper understanding of the factors that influence the competition.
Why do the Less Active MNs Win in More Competitions? An Intuitive Explanation
The key factor in understanding why the less active MNs win in more competitions is realizing that the time (i.e., stage in the game) of winning at a muscle fiber plays a critical role in the final result (i.e., total number of victories).
According to our model, the time in which a competition ends is determined by the activity level of the hosting muscle fiber, but this in turn is determined by the aggregated activity levels of the MNs operating it. Therefore, a muscle fiber in which the majority of connections are by the more active MNs (e.g., 10 connections by the M-group and only 2 connections by the L-group) will be relatively active and thus its competition will end at an early stage of the game. In addition we expect the winner to be from the M-group, as the “balance of power” is 10:2 in its favor. But just as well, looking at a muscle fiber with the opposite balance of power 2:10, (2 by the M-group and 10 by the L-group), the winner there is most likely to be from L-group and the competition there would end later (as this muscle fiber is less active). It is important to note that both of these muscle fibers (the original one and its “mirror case”) are equally likely to exist, since both have the same number of connections. The conclusion of this argument is that an M-group victory at a muscle fiber where the balance of power is in its favor is expected to be matched by a later victory of the L-group (at a muscle fiber with the same number of connections but an opposite balance of power). In this sense, the L-group wins at later stages than the M-group. This difference in the expected times of winning between the M- and L-groups was clearly seen in our simulations (see Figure 3B), where in the early stages the M-group lead the game (as the lines were above zero) but this advantage was reversed later, when the L-group started winning (the lines are decreasing).
Why does this difference in the times of winning causes the L-group to win in more competitions than the M-group? As a result of its limited resources, when an MN wins at a muscle fiber its winning probabilities at future competitions are reduced. In such circumstances it is advantageous to win in later stages of the process rather than in earlier ones, because winning at a late stage will negatively affect only the few competitions that are not yet resolved (i.e., the MN will perform poorly only in the few remaining competitions) whereas winning at an earlier stage will negatively affect more competitions. Thus, winning at later competitions means handling one's resources more efficiently, and thus enabling it to win in more competitions. Therefore, as the L-group typically wins later than the M-group, it wins in more competitions in total, in accordance with the size principle.
It is now clear why we defined the strategy of an MN to be its level of activity, because when an MN “chooses” at the beginning of the game to be less active, it actually chooses to “invest” more in later (rather than in earlier) stages and this, as explained, causes it to win in more competitions.
Note that in the above argument there was a tacit assumption that at a single muscle fiber any MN is equally likely to win, regardless of its activity level, and thus it is likely that the winner is from the majority group at that muscle fiber. In contrast, as mentioned earlier, experimental results at isolated muscle fibers suggest some advantage for the more active MN at the single muscle fiber. To accommodate these experimental data, we have shown earlier (Figure 3) that even if the competition at the single muscle fiber is Hebbian, and thus biased against the less active MNs, then (as long as the bias is not too extreme) the less active MNs still win in more competitions.
Resolving the Paradoxical Data from the Blocking Experiments: An Intuitive Explanation
On the one hand, according to our model, the blocked MNs are expected to lose almost all the competitions that are resolved during the blocking period, as these competitions are extremely biased against them. This explains the experimental results of Ribchester and Taxt, in which the blocking period continued until the end of the competition period and the blocked MNs lost the game. On the other hand, the blocking specifically delays the competitions at the muscle fibers that are innervated by some blocked MNs. This delay does not only follow from our model, as the overall level of activity of these muscle fibers was reduced by the blocking, but had also been found empirically by Callaway et al. (1989). According to our model, this delay works in favor of the blocked group when activity is resumed, since, as we have explained, winning later is advantageous. This explains the experimental results of Callaway, in which activity was recovered, allowing the blocked MNs to benefit from the delay in their victories.
The Experimental Results Underlying the Assumptions of Our Model
The amount of activity of a muscle fiber affects the speed of the competition
Many experiments show that enhancing the activity of a muscle during synapse elimination accelerates synapse elimination (O'Brien et al., 1978; Vyskocil and Vrbova, 1993), whereas reducing this activity delays or prevents it (Thompson et al., 1979; Ribchester and Taxt, 1984). We, therefore, assumed that the competitions end at different times. Specifically, the competition at a muscle fiber that is activated frequently ends earlier than the competition at a muscle fiber that is less frequently activated.
Resource limitation
During the competition period, the strengths of the connections between the MNs and the muscle fiber are constantly changing. Lichtman and Colman (2000) showed that at the end of the competition, the connection between the winning MN and the muscle fiber was stronger than the total strengths of all the connections to that muscle fiber at the beginning of the competition. This is not a temporary state, and so from that time on, the MN must devote resources for maintaining this connection and thus it has less available resources for competing effectively at future competitions (i.e., at future muscle fibers). This reduction in effectiveness was nicely demonstrated in an experiment by Lichtman and Kasthuri (2003), in which at late stages of the process, MNs with a smaller number of connections showed a clear advantage over MNs with a larger number of connections. Thus, we assume in our model that when an MN wins at a muscle fiber, its future winning probabilities are reduced. Indirectly, the future winning probabilities of its group are also reduced (as the winning probability of a group equals the sum of the winning probabilities of its members).
The Differentiation Process
Although at birth, the muscle fibers are still similar to one another in their contractile properties and membrane characteristics (Gordon et al., 1977), during the period of synapse elimination, the muscle fibers differentiate to different types. When synapse elimination ends, muscle fibers of type I (which are also called “slow”) are usually innervated by relatively more active MNs, whereas muscle fibers of type II (“fast”) are usually innervated by less active MNs (for review see Vrbova et al., 1978). The different muscle units are usually homogeneous in muscle fiber type. Since both the processes of synapse elimination and the differentiation of muscle fibers occur at the same time, it is not clear which process influences the other (or whether there is a mutual influence between the two). Namely, does the innervating MN determine the type of the muscle fiber, or is a muscle fiber of a certain type more easily innervated by a more active MN than by a less active one?
One finding that clearly supports the view that the winning MN determines (or at least influences) the type that the muscle fiber will evolve to, is the following: If a muscle fiber is denervated and then re-innervated by a different MN, then the muscle fiber changes it's type so as to match the rest of it's new muscle unit (Summerbell and Stirling, 1981; Gordon et al., 1981). Still, there might also be an influence in the opposite direction. In this work we assume that the type of the muscle fiber does not bias the competition, but rather that each muscle fiber has the same probability of initially being innervated by a more active MN as by a less active one. Our analysis shows that the emergence of the size principle can be explained solely on the basis of resource limitations and the differences in the levels of activity of the competing MNs, and there is no need to additionally assume that the differentiation process biases the outcome of the competitions. (For further discussion see Vrbova et al., 1985 and Thompson et al., 1984).
Other Models for Competition at the Motor-Muscle System
Several models have previously been proposed to explain the competitive process at hand (van Ooyen, 2001). However, only two models (Stollberg, 1995; Barber and Lichtman, 1999) have aimed to both explain the emergence of the size principle and reconcile the paradoxical experimental data. A crucial assumption in the model suggested by Stollberg is that initially the connections between MNs and muscle fibers are weak. However, it has been experimentally shown (Brown et al., 1976) that from the start, the connection of each MN alone is strong enough to cause the activation of the muscle fiber. The model of Barber and Lichtman (1999) is a descriptive model, successfully reproducing several features of synapse elimination. They defined two parameters: α, which “rewards” activity, and β, which “punishes” it. The parameter β was chosen to be 10 times larger than α. As a result, less active MNs won more competitions, reproducing the size principle. Additionally, Barber and Lichtman reproduced the results from the short blocking experiments of Callaway et al. (1987, 1989), but did not relate to the long blocking experiment of Ribchester and Taxt (1983), which, as mentioned above, paradoxically yield opposite results to those of Callaway.
Previously, researchers disagreed on the importance of the activity levels of the MNs in synapse elimination (van Ooyen, 2001). We believe that this disagreement was mainly a result of the seemingly contradictory experimental data. By resolving the paradox, we believe that the present study has paved a new way for both experimentalists and theoreticians to assess the role of activity and unravel the physiological mechanisms underlying the central process of synapse elimination (Favero et al., 2010).
Conflict of Interest Statement
The authors declare that the research was conducted in the absence of any commercial or financial relationships that could be construed as a potential conflict of interest.
Acknowledgments
This work was supported by a grant from the Gatsby Charitable Foundation.
References
Balice-Gordon, R. J., and Lichtman, J. W. (1994). Long-term synapse loss induced by focal blockade of post-synaptic receptors. Nature 372, 519–524.
Barber, M. J., and Lichtman, J. W. (1999). Activity-driven synapse elimination leads paradoxically to domination by inactive neurons. J. Neurosci. 19, 9975–9985.
Brown, M. C., Jansen, J. K., and van Essen, D. (1976). Polyneuronal innervation of skeletal muscle in newborn rats and its elimination during maturation. J. Physiol. 261, 387–422.
Bruno, R. M., and Sakmann, B. (2006). Cortex is driven by weak but synchronously active thalamocortical synapses. Science 312, 1622–1627.
Callaway, E. M., Soha, J. M., and van Essen, D. C. (1987). Competition favouring inactive over active motor neurons during synapse elimination. Nature 328, 422–426.
Callaway, E. M., Soha, J. M., and van Essen, D. C. (1989). Differential loss of neuromuscular connections according to activity level and spinal position of neonatal rabbit soleus motor neurons. J. Neurosci. 9, 1806–1824.
Connold, A. L., Evers, J. V., and Vrbova, G. (1986). Effect of low calcium and protease inhibitors on synapse elimination during postnatal development in the rat soleus muscle. Brain Res. 393, 99–107.
Cooper, S. J., and Donald, O. (2005). Hebb's synapse and learning rule: a history and commentary. Neurosci. Biobehav. Rev. 28, 851–874.
Cope, T. C., and Pinter, M. J. (1995). The size principle: still working after all these years. NIPS 10, 280–285.
Crepel, F., Mariani, J., and Delhaye-Bouchaud, N. (1976). Evidence for a multiple innervation of purkinje cells by climbing fibers in the immature rat cerebellum. J. Neurobiol. 7, 567–578.
Dan, Y., and Poo, M. M. (1992). Hebbian depression of isolated neuromuscular synapses in vitro. Science 256, 1570–1573.
Favero, M., Buffelli, M., Cangiano, A., and Busetto, G. (2010). The timing of impulse activity shapes the process of synaptic competition at the neuromuscular junction. Neuroscience 167, 343–353.
Fladby, T., and Jansen, J. K. (1987). Postnatal loss of synaptic terminals in the partially denervated mouse soleus muscle. Acta Physiol. Scand. 129, 239–246.
Fox, M. A., Tapia, J. C., Kasthuri, N., and Lichtman, J. W. (2011). Delayed synapse elimination in mouse levator palpebrae superioris muscle. J. Comp. Neurol. 519, 2907–2921.
Gordon, T., Purves, R. D., and Vrbova, G. (1977). Differentiation of electrical and contractile properties of slow and fast muscle fibers. J. Physiol. (Lond.) 269, 535–547.
Gordon, T., Vrbova, G., and Willcock, G. (1981). The influence of innervation on differentiating tonic and twitch muscle fibers of the chicken. J. Physiol. (Lond.) 319, 261–269.
Henneman, E. (1957). Relation between size of neurons and their susceptibility to discharge. Science 126, 1345–1347.
Hua, J. Y., Smear, M. C., Baier, H., and Smith, S. J. (2005). Regulation of axon growth in vivo by activity-based competition. Nature 434, 1022–1026.
Hubel, D. H., Wiesel, T. N., and LeVay, S. (1977a). Plasticity of ocular dominance columns in the monkey striate cortex. Philos. Trans. R. Soc. Lond. B Biol. Sci. 278, 377–409.
Hubel, D. H., Wiesel, T. N., and Stryker, M. P. (1977b). Orientation columns in macaque monkey visual cortex demonstrated by the 2-deoxyglucose autoradiographic technique. Nature 269, 328–330.
Kandel, E. R., Schwartz, J. H., and Jessel, T. M. (2000). Principles of Neural Science, Fourth edn. New York, NY: McGraw-Hill.
Kasthuri, N., and Lichtman, J. W. (2003). The role of neuronal identity in synaptic competition. Nature 424, 426–430.
Katz, L. C., and Shatz, C. J. (1996). Synaptic activity and the construction of cortical circuits. Science 274, 1133–1138.
Lein, E. S., and Shatz, C. J. (2000). Rapid regulation of BDNF mRNA within eye-specific circuits during ocular dominance column formation. J. Neurosci. 20, 1470–1483.
Lichtman, J. W. (1977). The reorganization of synaptic connexions in the rat submandibular ganglion during post-natal development. J. Physiol. (Lond.) 273, 155–177.
Lichtman, J. W., and Colman, H. (2000). Synapse elimination and indelible memory. Neuron 25, 269–278.
Liu, Y., Fields, R. D., Festoff, B. W., and Nelson, P. G. (1994). Proteolytic action of thrombin is required for electrical activity-dependent synapse reduction. Proc. Natl. Acad. Sci. U.S.A. 91, 10300–10304.
Lo, Y. J., and Poo, M. M. (1991). Activity-dependent synaptic competition in vitro: heterosynaptic suppression of developing synapses. Science 254, 1019–1022.
Lohof, A. M., Bailly, Y., Delhaye-Bouchaud, N., and Mariani, J. (1997). A model of developmental synapse elimination in the central nervous system: possible mechanisms and functional consequences. Adv. Organ Biol. 2, 67–97.
Lohof, A. M., Delhaye-Bouchaud, N., and Mariani, J. (1996). Synapse elimination in the central nervous system: functional significance and cellular mechanisms. Rev. Neurosci. 7, 85–101.
Martin, S. J., Grimwood, P. D., and Morris, R. G. (2000). Synaptic plasticity and memory: an evaluation of the hypothesis. Annu. Rev. Neurosci. 23, 649–711.
Maynard Smith, J. (1982). Evolution and the Theory of Games. University of Sussex: Cambridge University Press.
Mendell, M. (2005). The size principle: a rule describing the recruitment of motoneurons. J. Neurophysiol. 93, 3024–3026.
O'Brien, R. A., Ostberg, A. J., and Vrbova, G. (1978). Observations on the elimination of polyneuronal innervation in developing mammalian skeletal muscle. J. Physiol. 282, 571–582.
Oscarsson, O. (1979). Functional units of the cerebellum-sagittal zones and microzones. TINS 2, 143–145.
Purves, D., and Lichtman, J. W. (1980). Elimination of synapses in the developing nervous system. Science 210, 153–157.
Ribchester, R. R., and Taxt, T. (1983). Motor unit size and synaptic competition in rat lumbrical muscles reinnervated by active and inactive motor axons. J. Physiol. 344, 89–111.
Ribchester, R. R., and Taxt, T. (1984). Repression of inactive motor nerve terminals in partially denervated rat muscle after regeneration of active motor axons. J. Physiol. 347, 497–511.
Ridge, R. M., and Betz, W. J. (1984). The effect of selective, chronic stimulation on motor unit size in developing rat muscle. J. Neurosci. 4, 2614–2620.
Senn, W., Wyler, K., Clamann, H. P., Kleinle, J., Lüscher, H. R., and Muller, L. (1997). Size principle and information theory. Biol. Cyber. 76, 11–22.
Stein, N., Ozdaglar, A., and Parrilo, P. A. (2008). Separable and low-rank continuous games. Int. J. Game Theory, 37, 475–504.
Stollberg, J. (1995). Synapse elimination, the size principle, and Hebbian synapses. J. Neurobiol. 26, 273–282.
Summerbell, D., and Stirling, K. V. (1981). The innervation of dorsoventrally reversed chick wings: evidence that motor axons do not actively seek out their appropriate targets. J. Embryol. Exp. Morph. 61, 233–247.
Syken, J., GrandPe, T., Kanold, P. O., and Shatz, C. J. (2006). PirB restricts ocular-dominance plasticity in visual cortex. Science 313, 1795–1800.
Thompson, W., and Jansen, J. K. (1977). The extent of sprouting of remaining motor units in partly denervated immature and adult rat soleus muscle. Neuroscience 2, 523–535.
Thompson, W., Kuffler, D. P., and Jansen, J. K. (1979). The effect of prolonged, reversible block of nerve impulses on the elimination of polyneuronal innervation of newborn rat skeletal muscle fibers. Neuroscience 4, 271–281.
Thompson, W. J., Sutton, L. A., and Riley, D. A. (1984). Fibre type composition of single motor units during synapse elimination in neonatal rat soleus muscle. Nature 309, 709–711.
van Ooyen, A. (2001). Competition in the development of nerve connections: a review of models. Network 12, R1–R47.
van Ooyen, A., and Willshaw, D. J. (1999). Competition for neurotrophic factor in the development of nerve connections. Proc. Biol. Sci. 266, 883–892.
Vrbova, G., Navarrete, R., and Lowrie, M. (1985). Matching of muscle properties and motoneuron firing patterns during early stages of development. J. Exp. Biol. 115, 113–123.
Vyskocil, F., and Vrbova, G. (1993). Non-quantal release of acetylcholine affects polyneuronal innervation on developing rat muscle fibres. Eur. J. Neurosci. 5, 1677–1683.
Walsh, M. K., and Lichtman, J. W. (2003). In vivo time-lapse imaging of synaptic takeover associated with naturally occurring synapse elimination. Neuron 37, 67–73.
Wiesel, T. N. (1982). Postnatal development of the visual cortex and the influence of environment. Nature 299, 583–591.
Willshaw, D. J. (1981). The establishment and the subsequent elimination of polyneuronal innervation of developing muscle: theoretical considerations. Proc. R. Soc. Lond. Ser. B Biol. Sci. 212, 233–252.
Keywords: synapse elimination, size principle, Hebbian rule, game theory, neuromuscular junction
Citation: Nowik I, Zamir S and Segev I (2012) Losing the battle but winning the war: game theoretic analysis of the competition between motoneurons innervating a skeletal muscle. Front. Comput. Neurosci. 6:16. doi: 10.3389/fncom.2012.00016
Received: 25 November 2011; Accepted: 13 March 2012;
Published online: 30 March 2012.
Edited by:
David Hansel, University of Paris, FranceCopyright: © 2012 Nowik, Zamir and Segev. This is an open-access article distributed under the terms of the Creative Commons Attribution Non Commercial License, which permits non-commercial use, distribution, and reproduction in other forums, provided the original authors and source are credited.
*Correspondence: Irit Nowik, Department of Industrial Engineering and Management, Jerusalem College of Technology, 21 Havaad Haleumi, P.O.B. 16031, Jerusalem 91160, Israel. e-mail:bm93aWtAamN0LmFjLmls