 Sang-Woo Park1
 Marcos Intaglietta
 Daniel M. Tartakovsky
- 1Department of Mechanical and Aerospace Engineering, University of California, San Diego, La Jolla, CA, USA
- 2Bioengineering Department, University of California, San Diego, La Jolla, CA, USA
A plasma stratum (cell free layer or CFL) generated by flowing blood interposed between the red blood cell (RBC) core and the endothelium affects generation, consumption, and transport of nitric oxide (NO) in the microcirculation. CFL width is a principal factor modulating NO diffusion and vessel wall shears stress development, thus significantly affecting NO bioavailability. Since the CFL is bounded by the surface formed by the chaotically moving RBCs and the stationary but spatially non-uniform endothelial surface, its width fluctuates randomly in time and space. We analyze how these stochastic fluctuations affect NO transport in the CFL and NO bioavailability. We show that effects due to random boundaries do not average to zero and lead to an increase of NO bioavailability. Since endothelial production of NO is significantly enhanced by temporal variability of wall shear stress, we posit that stochastic shear stress stimulation of the endothelium yields the baseline continual production of NO by the endothelium. The proposed stochastic formulation captures the natural continuous and microscopic variability, whose amplitude is measurable and is of the scale of cellular dimensions. It provides a realistic model of NO generation and regulation.
1. Introduction
Nitric oxide (NO) plays a critical role in the local control of smooth muscle tone and the regulation of blood flow at the microvascular level. Its distribution in the microcirculation is determined by the balance between NO production and consumption in the blood and tissue compartments. The local concentration of NO in blood results from the competition between NO diffusing from the endothelium and NO scavenging by hemoglobin in red blood cells (RBCs) or at times dissolved in plasma. Mathematical modeling was used (Vaughn et al., 1998a,b; Condorelli and George, 2002; Kavdia and Popel, 2003; Lamkin-Kennard et al., 2004; Chen et al., 2006; Ong et al., 2011b; Sriram et al., 2011) to determine the NO distribution in blood vessels simulated by cylindrical and parallel-plate compartments, as a function of local transport parameters such as NO production rate, scavenging reaction rate and diffusion coefficients in blood and tissue. All these analyses assume deterministic boundary conditions.
Mechanotransduction generates a significant portion of the NO involved in the regulation of blood flow (Condorelli and George, 2002; Chen et al., 2006). This mechanical effector links the biochemistry of NO production by the endothelium with shear stress induced by blood flow on the vascular wall (WSS). This coupling is tight because NO bioavailability in the vascular wall determines vessel diameter, the anatomical component of vascular flow resistance. WSS is generated at the vascular wall by tangential stresses caused by flowing blood whose RBC concentration (hematocrit or Hct) diminishes from maximal at the blood flow core to zero in the cell free layer (CFL) adjacent to the vessel wall.
Blood in microcirculation can be modeled as a two-layer system consisting of two immiscible fluids. Flow velocity profiles are parabolic within the CFL and plug-like in the RBC core region (Sharan et al., 1997; Martini et al., 2005; Sriram et al., 2011) where the fluid exhibits non-Newtonian behavior. Such models provide a coarse-grained description of more detailed simulations of variations of the WSS induced by a passing column of RBCs (e.g., Dupin et al., 2007). Changes of NO production due to changes in WSS caused by the variation of blood flow and plasma viscosity (Tsai et al., 1998) appear to dominate other factors, such as changes in hemoglobin concentration or Hct (Kavdia and Popel, 2003; Lamkin-Kennard et al., 2004; Chen et al., 2006; Namgung et al., 2011; Sriram et al., 2011). Experimental evidence (e.g., Kanai et al., 1995) suggests that NO production rate by the endothelium varies linearly with WSS (see also Andrews et al., 2010; Ong et al., 2011b).
However, there is a fundamental difference in the rate of NO production between steady and time-varying WSS (Frangos et al., 1996; Ong et al., 2011b), the latter being significantly greater. Temporal variability arises from action of the heart and the respiratory cycle which although attenuated is present in the microcirculation, or vasomotion which is rooted in the microcirculation.
Endothelial response to shear stress is mostly studied in parallel plate flow chambers, where endothelial cells grow to confluent layers. However, it is generally recognized that this experimental setup differs from in vivo conditions, since it relies on perfusion with cell culture media fluid instead of blood. (We are aware of a study by Yalcin et al., 2008 that did use RBC suspension, but it did not compare results with incubation medium). Blood perfusion introduces other, hitherto not considered, sources of temporal variability due to the microscopic spatial fluctuations of the CFL width. Spatial variability is generated by blood flowing over the spatially non-uniform endothelial surface (Barbee et al., 1994; Sato et al., 2000). Spatial and temporal variability is generated at the blood boundary of the CFL due to the changes in motion, position and shape of RBCs in the outer layer of the flowing blood column. As a consequence of these phenomena fluid in the CFL flows between a spatially variable endothelial boundary and spatially and temporally highly irregular RBC surface (Kim et al., 2006, 2007), both of which randomly affect WSS. These effects are non-existent in the absence of RBCs. Furthermore, as a consequence of their stochastic nature they potentially include all forms of variability. The frequency of stochastic fluctuations of the WSS due to spatio-temporal variability of the CFL may significantly increase the bioavailability of NO. Evidence for this hypothesis is provided by an observation that exposing the tissue damaged by ischemia reperfusion to diagnostic ultrasound improves microvascular functionality, an effect that is significantly reduced by administration of L-NAME (Hightower and Intaglietta, 2008).
These unpredictable fluctuations can be analyzed by treating the CFL width at any given location as a random field that determines the distance between the NO source and its sink. The stochasticity of the CFL width also affects NO concentration due to its repercussion on the local, microscopic variability of the flow field, and therefore on shear rates and shear stresses. While the random spatio-temporal fluctuations of CFL width and its bounding surfaces clearly affect NO bioavailability and production rate, most studies (including those mentioned above) treat the interface between the RBC column and plasma as a smooth deterministic surface. In the present study, we adopt a more realistic approach by treating the surface between flowing RBCs and the CFL as a random field whose statistics are obtained from experimental studies (Ong et al., 2011a,b). Within this conceptual framework, we formulate a model that determines the distribution of NO concentration in the region of the interface between blood and tissue at the blood vessel wall (RBC-rich core, cell free layer, and tissue layer) (Vaughn et al., 1998a).
2. Mathematical Model of NO Transport
2.1. Model Formulation
Our analysis deals with NO transport in the geometrical configuration associated with the standard Krogh tissue cylinder model. We consider an arteriolar cross-section that consists of the RBC-rich core (), the CFL (), the endothelial-cell region (), and the smooth-muscle region (). Stochastic fluctuations of the interface formed by flowing RBCs, r1(θ, t), are modeled by treating it as a random function of both angular coordinate θ and time t, i.e., r1 = r1(θ, t; ω) with ω ∈ Ω indicating a realization (“coordinate”) in the probability space Ω. This renders the CFL width w = r2 − r1 random, i.e., w = w(θ, t; ω). Our goal is to capture the effects of stochastic fluctuations of the RBC-CFL interface r1(θ, t; ω) on distribution of NO concentration, CNO, in the Krogh tissue cylinder = {(r, θ):0 ≤ r ≤ r4, 0 ≤ θ ≤ 2π}.
In each region of the computational domain, Ei (i = 1, …, 4), the concentration CNO satisfies a reaction-diffusion equation
where Di and ki are the diffusion coefficient and degradation (reaction) rate in the i-th region, respectively. These four equations are coupled by the continuity conditions at the interfaces ri (i = 1…, 3),
Here the superscripts − and + indicate the left and right limits of the corresponding quantities at the i-th interface, Fn = Fi · ni is the normal component of Fick's flux Fi = −Di∇CNO at the i-th interface whose outward unit normal is ni, and denotes the NO production rates at the interface r = ri. Since only endothelium cells are involved in NO production, . We assume that no nitric oxide leaves the outer boundary of the smooth-muscle region, r = r4, so that
The coupling of the reaction-diffusion Equations (1) at the interfaces r = ri (i = 1, 2, 3) propagates uncertainty (randomness) in the topology of the RBC-CFL interface r1(θ, t; ω) through the modeling process, leading to randomly varying NO concentration CNO(r, θ, t; ω) throughout the Krogh tissue cylinder.
The problem formulation given by Equations (1)–(3) implicitly assumes that blood flow is laminar, fully-developed, and incompressible, vessel walls are impermeable to blood flow, NO concentration at the vessel inlet equals that at the vessel outlet, and all the reaction rates are spatially uniform. In the deterministic setting with a uniform CFL width, these assumptions imply that the radial (ur) and angular (uθ) components of flow velocity are ur = uθ ≡ 0, its longitudinal component is V = V(r), and NO concentration CNO = CNO(r). This results in advective flux of NO in the blood vessel, u · ∇CNO, that is identically zero. In the stochastic setting with randomly fluctuating CFL width, advective flux u·∇CNO is zero in the mean (Tartakovsky and Xiu, 2006; Park et al., 2012).
2.2. Model Parameterization
While the reaction rates ki in the endothelium (i = 3) and tissue (i = 4) can be considered constant, the reaction rate in the RBC-rich core (k1) is related to hemoglobin levels. The latter depends on hematocrit H(r) and radial component of blood flow velocity V(r, θ, t). Let ks denote a reference rate of NO scavenging by RBCs at a reference level of hematocrit Hs. Then, the NO scavenging rate k1 corresponding to a given hematocrit level Hc is given by Ong et al. (2011b) and Chen et al. (2006)
The hematocrit ratio Hc/Hs is determined by mass conservation,
In the general stochastic framework we advocate here, blood is a two-phase fluid that exhibits non-Newtonian behavior in the RBC-rich core and Newtonian one in the CFL, with the random surface r1(θ, t; ω) separating the two regions. This implies that flow velocity V(r, θ, t; ω) is random as well, being given by a solution of corresponding flow equations in random domains (Park et al., 2012). To focus on NO transport, we simplify the flow calculations by adopting two alternative approximations.
The first is based on a lubrication approximation in which random geometry parameterizes an otherwise deterministic velocity profile (Tartakovsky and Xiu, 2006). This approach yields a random velocity profile V(r, θ, t; ω),
where is the (maximum) centerline velocity, J is the externally imposed pressure gradient, and μp and μc are the viscosities of the plasma and RBC-rich core. In this formulation, the only source of the non-Newtonian behavior of the RBC-rich core is the dependence of the core viscosity μc on the (random) CFL width. Following Martini et al. (2005) and many others, we assume a linear relationship μc = 0.1678Hc − 4.348 between a hematocrit level Hc and the viscosity of the RBC core μc. Specifying a (random) radial distribution of hematocrit, H = H(r, t; ω), as a step function
enables one to compute the randomly fluctuating NO scavenging rate k1(t; ω) by combining Equations (4)–(7). First, the system of Equations (5)–(7) was solved using Matlab function “solve” to compute Hc for μp = 1.2 cP and two values of Hs. Then k1(t; ω) was obtained from Equation (4).
The second alternative for obtaining k1(t; ω) treats blood as a single-phase fluid with a parabolic velocity profile
This formulation replaces the CFL and the random RBC-CFL interface r1(θ, t; ω) with a radial distribution of hematocrit,
Substituting Equations (8) and (9) into Equations (4) and (5) yields an alternative expression for the NO scavenging rate k1(t; ω). This approach was used by Ong et al. (2011a) in the deterministic context that treated r1(θ, t) as constant.
Finally, we allow the NO production rates by the endothelium, i.e., and in Equation (2), to vary with the wall shear stress τw exerted on the endothelium walls by blood flow. Following Ong et al. (2011a,b), Vaughn et al. (1998a) and others, we assume a linear relation
where is the reference wall shear stress, is the control NO production rate, and Ve is the mean velocity at the outer edge of the RBC core. These production rates fluctuate randomly, i.e., and , due to their dependence on the random flow velocity V and the CFL width w(θ, t; ω) = r2 − r1(θ, t; ω).
In the numerical results reported below we assume the diffusion coefficients Di in Equation (1) to be the same and equal to D. Its value and the values of the remaining parameters used in our are model are reported in Table 1.
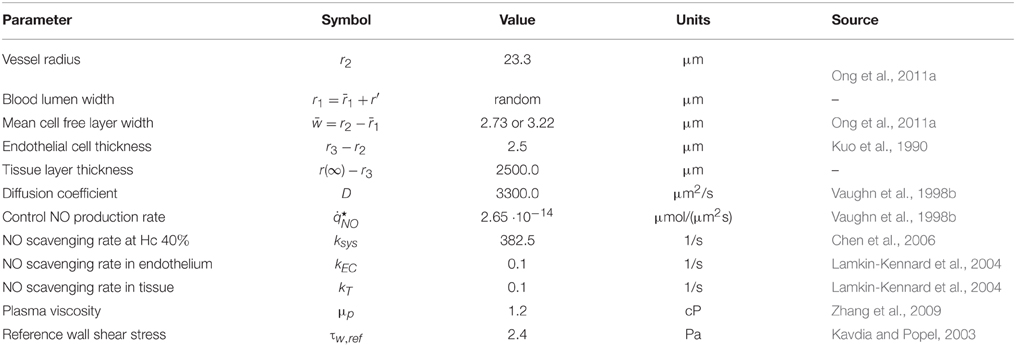
Table 1. Model parameters and their values.
We represent spatio-temporal variations of the RBC-CFL interface,
as the product of mutually uncorrelated temporal and angular fluctuations rt(t; ω) and rθ(θ; ω), respectively. A Reynolds decomposition is used to represent each of these fields, , as the sum of its ensemble mean and zero-mean fluctuations r′. Setting yields the mean and variance of the RBC-CFL interface: and . The coefficient of variation of the CFL width, , is given by
where is the mean CFL width and σw is its standard deviation.
Since the random field is periodic, a truncated Fourier-type expansion
provides its natural representation. Here the eigenvalues νn(ω) are complex zero-mean random variables, whose real and imaginary parts are mutually independent for all n. Each has zero mean and variance , where
are coefficients of the Fourier cosine expansion of a 2π-periodic covariance function of the random field . It is constructed as follows. First, we note that statistics of are rotationally invariant on the circle, such that a covariance function Cθ is
Then is constructed by extending the covariance function Cθ of the random field to a 2π-periodic periodic domain. We employ a Gaussian covariance function with the correlation length lθ. The decay of the Fourier cosine coefficients Cn determines the number of terms Nθ in the expansion in Equation (13) that is required to achieve a given truncation error. As the correlation length lθ decreases, Nθ increases.
We represent the random field via a truncated Karhunen-Loéve expansion,
where Ym(ω) (m ≥ 1) are independent random variables, and λm and fm(t) are, respectively, the eigenvalues and eigenfunctions of Fredholm equations,
For an exponential correlation function with the correlation length lt > 0, the eigenvalue problems in Equation (17) admit an analytical solution (Lin et al., 2010),
where γm are solutions of and m ≥ 1. The truncation error of the Karhunen-Loéve expansion in Equation (16) depends on the correlation length lt. The smaller the correlation length, the more terms Nt are necessary to represent the random field r′(t, ω) with a given degree of accuracy.
Within the statistical framework adopted here, the random RBC-CFL interface is characterized by four parameters: variances and , and correlation lengths lθ and lt. Experimental data, such as those reported by Kim et al. (2007), can be used to estimate these statistics. Table 2 contains the values of these parameters used in our simulations.
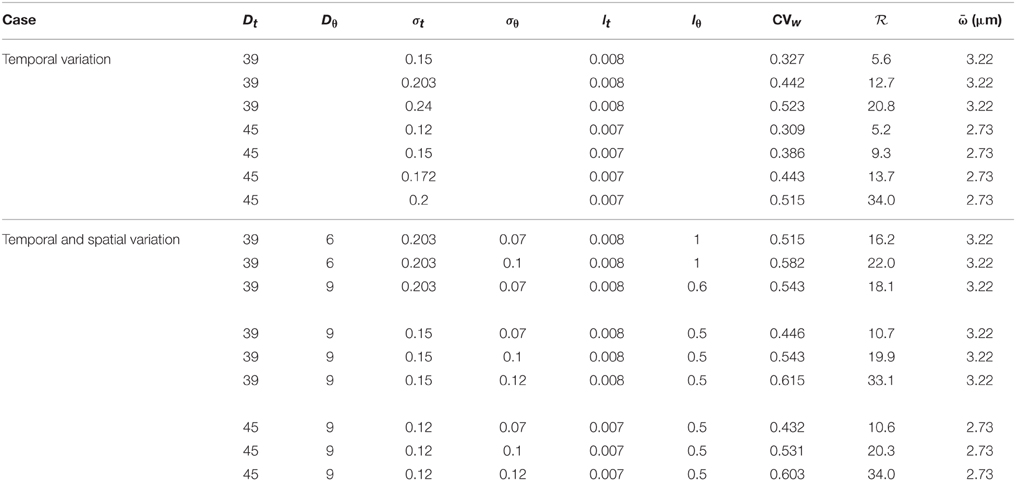
Table 2. Statistical parameters and summary of simulation results.
2.3. Numerical Solution
2.3.1. Mapping onto Deterministic Domain
We introduce a new coordinate system (ξ1, ξ2), which maps the original stochastic domain onto a rectangle B = {(ξ1, ξ2):−1 ≤ ξ1 ≤ 1, 0 ≤ ξ2 ≤ 2π}. A mapping is accomplished analytically by the coordinate transformation
where i = 1, …, 4 and r0 = 0. The random RBC-CFL interface r1(θ, t; ω) is represented by the expansions described above.
2.3.2. Transformed Stochastic Equations
The mapping defined by Equation (19) renders the transformation Jacobian
and other related metrics stochastic, i.e., dependent on a set of K = 2Nθ + Nt independent random variables . The first Nt variables Y1, …, YNt coincide with those introduced in Equation (16) and the remaining 2Nθ variables represent their counterparts in Equation (13), such that YNt + 1 = ν−Nθ, …, YK = νNθ. Consequently, the deterministic reaction-diffusion Equations (1) are transformed into stochastic equations of the form (Appendix)
where the random coefficients A11, A12 = A21, and A22 are given by Equation (A2) in the Appendix.
These stochastic differential equations on the deterministic domain B can be solved with a variety of well-established techniques, including perturbation-based moment equations (Tartakovsky and Winter, 2001), stochastic finite elements (Ghanem and Spanos, 1991), and stochastic collocation on sparse grids (Lin et al., 2010, and the references therein). In the subsequent numerical simulations we employ the latter approach (Appendix).
3. Results
Solutions of the stochastic system of transport Equations (1)–(3) are given in terms of their statistical moments. Ensemble means, e.g., mean NO concentration , serve as unbiased predictors of the system behavior; variances, e.g., NO concentration variance , act as a measure of predictive uncertainty.
3.1. Data-driven Model Parameterization
The CFL width measurements (Ong et al., 2011a) are used to construct a probabilistic model for the random input parameter w(θ, t; ω) = r2 − r1 in which the random RBC-CFL interface r1(θ, t; ω) is given by Equation (11). These data, which represent temporal fluctuations of w at a single spatial location (say, θ = 0), give rise to the histogram and auto-correlation reported in Figures 1 and 2, respectively. This histogram (and the obvious fact that the CFL width is both non-negative and smaller than the vessel radius r2) indicates that the random field w(θ, t; ω) is non-Gaussian. We fit the histogram in Figure 1 with a beta distribution , where B(α, β) = Γ(α + β)∕[Γ(α)Γ(β)] is the beta function, Γ(·) is the complete gamma function, 0 ≤ W ≤ r2, and α > 0 and β > 0 are shape parameters. Setting α = 4.358 and β = 32.9 provides the best data fit, resulting in the mean CFL width μm. The auto-correlation data in Figure 2 were fitted with an exponential correlation function , yielding the correlation length lt = 0.007 s.
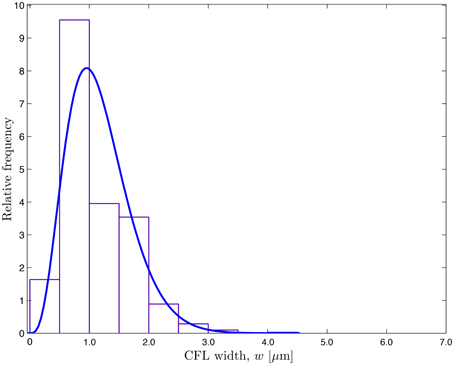
Figure 1. Frequency distribution of the temporally fluctuating CFL width w reported by Ong et al. (2011a) and the fitted β-distribution.
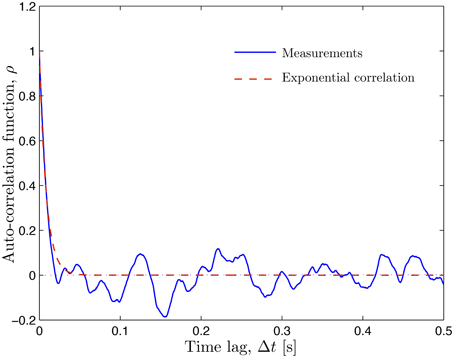
Figure 2. Auto-correlation of the temporally fluctuating CFL width w reported by Ong et al. (2011a) (solid line) and the fitted exponential correlation function ρ(Δt) = exp(−Δt∕lt) with the correlation length lt = 0.007 s (dashed line).
Experimental limitations preclude data acquisition at multiple azimuths θ, which requires us to postulate a probabilistic model for rθ(θ; ω). In analogy with its temporal counterpart rt(t; ω), we chose rθ(θ; ω) to have the beta distribution with unit mean and variance and the exponential correlation function with correlation length lθ. In the formulation provided by Equation (12), the amplitude of spatio-temporal (in the angular coordinate θ and time t) fluctuations of both the RBC-CFL interface r1(θ, t; ω) and CFL width w(θ, t; ω) = r2 − r1 increases with the variances and , while the smoothness of these fluctuations increases with the correlation lengths lθ and lt. This behavior, which reflects chaotic motion of RBCs in the blood core, is demonstrated by two representative realizations of the random CFL width shown in Figure 3.
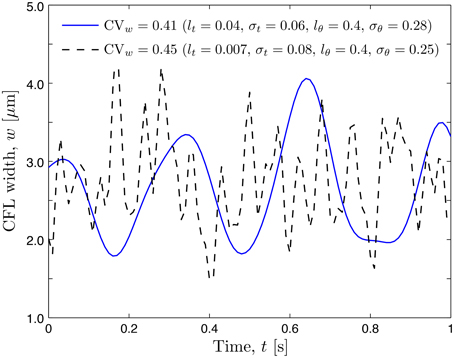
Figure 3. Realizations of temporal fluctuations of the CFL width w at angular coordinate θ = 0.0 corresponding to two sets of statistical parameters.
3.2. Random Fluctuations of Wall Shear Stress
The CFL width w in Equation (10) is inversely proportional to the wall shear stress (WSS) τw. Hence the random spatio-temporal fluctuations in w induce corresponding fluctuations in τw. In the computations of the WSS we use the values of the edge velocity Ve = 0.54 mm/s and the corresponding pressure gradient J = 2.15 × 10⁴ computed by fitting the smooth-wall model to the experimentally observed peak NO concentration of 11.2 nM.
The statistic commonly available from experimental studies similar to Kim et al. (2006, 2007) and Ong et al. (2011a) is the coefficient of variation of the CFL width, . Figure 4 shows how the mean WSS , normalized with the smooth-vessel smooth-vessel WSS , increases with CVw. (Recall that the fixed/smooth boundaries of the CFL correspond to CVw = 0 and ). The rate of growth of the mean WSS depends on the model's statistical parameters, some of which, especially lθ, are not found in the experiments (Kim et al., 2006, 2007; Ong et al., 2011a). Fortunately, Figure 4 reveals that the mean WSS is nearly insensitive to lθ, being dominated by the temporal fluctuations statistics that are more readily measurable.
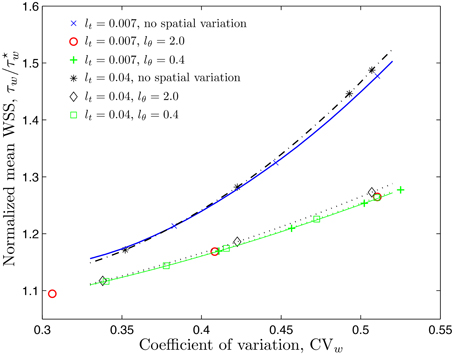
Figure 4. Mean WSS, normalized with the smooth-vessel WSS , (and mean NO production rate, normalized with the control production rate ) as a function of the coefficient of variation () of the CFL width for several combinations of constitutive statistical parameters.
3.3. NO Production Rate
It follows from Equation (10) that the rate of NO production by the endothelium, , is directly proportional to the WSS. When normalized by the control production rate , it is equal to the ratio . In other words, the statistics of the ratios and coincide. Therefore, Figure 4 also demonstrates how the mean NO production rate by the endothelium, , increases with the coefficient of variation of the CFL width, CVw.
3.4. Mean Profiles of NO Concentration
Unless specified otherwise, the results reported below correspond to the hematocrit-dependent reaction rate k1 in Equation (4) given by the constitutive model in Equations (8) and (9). We start by computing a (deterministic) reference NO concentration as a solution of Equations (1)–(3) with smooth (constant) interfaces r1 and r2. It serves as an initial condition for transient stochastic simulations.
The mean concentration profiles computed with these simulations, , are exhibited in Figure 5. While the NO production rates ( and ) on both sides of the endothelium (r = r2 and r3) are the same, the NO scavenging rate in the RBC core (0 ≤ r ≤ r1) is higher than that in the muscle tissue (r > r3). That is why the peak NO concentration is at the endothelium surface facing the tissue (r = r3).
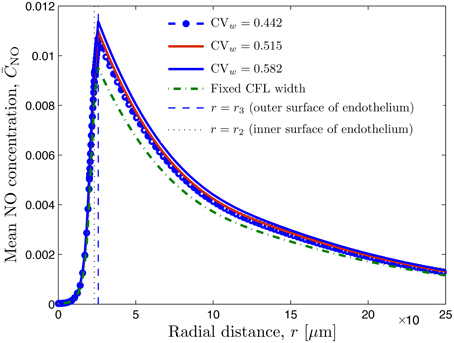
Figure 5. Radial profile of mean NO concentration for several degrees of spatio-temporal variability of CFL quantified by CVw = 0.442 (lθ = 0.0 and σθ = 0.0), CVw = 0.515 (lθ = 1.0 and σθ = 0.07), and CVw = 0.582 (lθ = 1.0 and σθ = 0.1); in all three cases, lt = 0.008 and σt = 2.03. Also shown is NO concentration corresponding to constant uniform CFL width. The vertical lines indicate the inner and outer surfaces of the endothelium.
Figure 5 also reveals that random fluctuations of the CFL width increase the NO availability relative to that predicted by the model that ignores them. This is to be expected, since these fluctuations enhance the NO production by the endothelium (Figure 4). NO production and availability increase with the the degree of roughness of the random RBC-CFL interface r1(θ, t; ω): the higher CVw and/or the smaller the correlation lengths lt and lθ, the rougher the interface is.
The simulation results reported in Table 2 demonstrate the relative importance of temporal and angular fluctuations of the CFL width on NO availability. The latter is reported in terms of the ratio of the peak NO concentrations, , where and . Larger values of indicate stronger impact of the CFL width fluctuations.
3.5. Effect of Constitutive Models
The above-made estimates of NO production and availability rely on the NO scavenging rate k1(t; ω) given by the constitutive law in Equations (8), (9), which treats blood as a single-phase fluid. The alternative constitutive model for k1(t; ω), which explicitly accounts for the CFL presence, is given by Equations (6) and (7). Our simulations demonstrate that the difference between the mean peak NO concentrations predicted with the two models is less than 1% (Table 2). This provides a confirmation of the robustness of our predictions of expected NO production and availability with respect to model selection for the scavenging rate.
3.6. Effect of Dextran Infusion
In the experiments reported by Ong et al. (2011a), infusion of a plasma expander dextran increases the average CFL width from to 3.22 μm. It also enhances fluctuations of the CFL width, increasing CVw from 0.443 to 0.509 while leaving the correlation length lt practically unchanged (it increases from 0.007 s before the dextran infusion to 0.008 s after). To match the decrease in the reported peak NO concentration from 11.2 to 9.5 nM, we recalculated the value of the pressure gradient J = 2.15 × 10⁴ and 1.72 × 10⁴.
Figure 6 demonstrates that changing the mean CFL width (from 2.73 to 3.22 μm) does not significantly change the mean WSS, but has a more pronounced effect on the mean peak NO concentrations. The peak NO concentration ratio reported in Table 2 further emphasizes this effect.
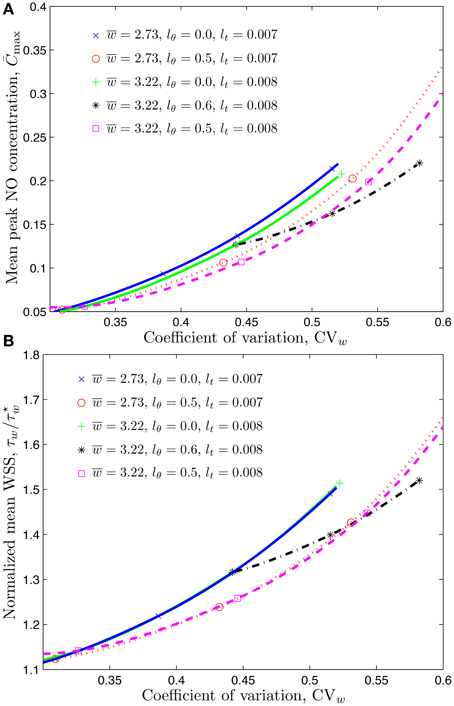
Figure 6. Mean peak NO concentration (A) and mean WSS ratio (B) corresponding to temporal and spatial variations of CFL whose mean value is μm or 3.22 μm.
4. Discussion
We developed a computational framework to quantify the impact of spatio-temporal fluctuations in the CFL width on the production and transport of NO. This is accomplished by treating the RBC-CFL interface (and the corresponding CFL width) as a space-time correlated random field. This surface is represented via Karhunen-Loéve and Fourier expansions. The differential equations describing blood flow and NO production and transport, defined on random simulation domains, were solved by using a stochastic collocation method.
Our analysis demonstrates that the two-phase nature of microcirculatory flow, partitioned between a central blood column and a peripheral cell free plasma layer, causes stochastic flow variability in the CFL that influences NO bioavailability. Our findings are qualitatively comparable to those obtained with the deterministic analysis conducted by Ong et al. (2011a). However, they differ in an important way since the statical parameters on which they are based can be used to predict NO production, as well as other effects related to the variability of the CFL, with data from other experiments where the same statistical properties can be assessed.
Flow variability has a homeostatic role in the microcirculation where it is a factor in the control of blood flow and inflammation through biochemical mechanotransduction modulation of the production of NO and prostaglandins. Large Reynolds numbers and flow variability in the central circulation can cause the up-regulation of virtually all atherogenic or pro-inflammatory genes ultimately promoting the development of atherosclerotic plaques (Cabrales et al., 2011). Experimentally it is shown that a principal effect of flow (and shear stress) variability is the up and down regulation of the expression of a multitude of genes in endothelial cell cultures (Yee et al., 2008).
The rate of production of NO by mechanotransduction differs between steady and time-dependent flows, the latter resulting in a significantly higher production of NO. This phenomenon has been evidenced in studies using horizontal parallel plates flow chambers in which endothelial cells grow to a confluent layer (Ruel et al., 1995). Continuous changes of flow or “ramp” flow (Frangos et al., 1996) and step changes (Andrews et al., 2010) yielded significantly greater NO production than constant steady flow. Experimental studies also show that the rate of NO production is higher for sinusoidal flow vs. steady flow with the same mean (Noris et al., 1995; Li et al., 2005). There is evidence that flow variation frequency of about 1 Hz, independent of shear, is a determinant of the endothelial responses to pulsatile flow (Balcells et al., 2005).
Although vessel wall shear rates and shear stress (WSS) are similar throughout the circulation, as proposed by the “uniform shear stress hypothesis” (Kassab and Fung, 1995), flow variability is quite different. The main source of flow variability is the periodic action of the heart, which can also cause flow instabilities in locations with large Reynolds numbers. This variability decreases from the systemic blood vessels to the microcirculation where it is attenuated to an amplitude of 1–2% of mean flow (Intaglietta et al., 1971) in the arterioles.
Blood flow in microvessels also undergoes periodic flow changes whose amplitude can reach 100% of mean flow due to the phenomenon of vasomotion. This activity has fundamental frequency of the order of minutes for the larger arterioles, increasing as vessel size decreases (Colantuoni et al., 1984). This phenomenon has received many interpretations since it has been found in some normal conditions but not all, and is elicited by ischemic and low pressure states (Schmidt et al., 1992).
Our analysis and results show the importance of a microscopic random flow variability, whose primary effect is to increase the bioavailability of NO at the vessel/CFL interface. This variability has two components: a vessel wall component due to the unevenness of the endothelium (Barbee et al., 1994; Barbee, 2002) and the blood/CFL interface component. The latter is absent in experimental studies of cell culture flow chambers perfused with culture media, i.e., in the majority of studies.
There is presently no specific evidence of the effect on mediator production rate by stochastically induced mechanotransduction. However, since random excitation contains all the spectral components of sinusoidal, ramp and step flow variability it is likely that random excitation increases the rate of mediator production. These effects are largely unexplored, since endothelial mechanotransduction has been primarily studied with non-blood, steady or varying flow conditions on a scale that is macroscopic relative to the dimensions of endothelial cells (Chien, 2007). Yet, cell-scale variations of shear stress can cause large shear stress gradients (Davies et al., 2003; Leiderman et al., 2008). Experimental studies to determine the physiological role of this variability are not available.
Stochastic variability of WSS is fundamentally distinct from the temporal variability studied in cell cultures. The latter is macroscopic and has primarily a local effect in that it is absent in the microcirculation, where temporal flow changes occur in a time frame of minutes to hours, a condition of quasi steady state. The stochastic fluctuations of the CFL width generate a persistent time-dependent microscopic component of WSS, which is not tested by current experimental methods. Our results and these considerations suggest that endothelial flow chamber experiments aimed at understating the consequences of mechanotransduction on cardiovascular regulation should include the conditions that preserve the stochastic nature of the blood flow/microvessel wall interaction, i.e., use blood as the flow medium. This appears to be the only significant source of time-dependent variability of shear stress in the microcirculation. It may be significantly affected by changes in the composition of either blood (due to hemorrhage and anemia) or plasma (possibly due to diabetes and hypertension).
Author Contributions
SP carried out numerical implementation of the proposed algorithms, participated in the design of the study and drafted the manuscript; MI formulated the physiological problem, participated in the design of the study, and helped draft the manuscript; DT designed and coordinated the study, and helped draft the manuscript. All authors gave final approval for publication.
Funding
This research was supported in part by NIH under award numbers R01-HL064395 and R24-HL64395, Air Force Office of Scientific Research under award number DE-FG02-07ER25815, and by National Science Foundation under award number DMS-1522799.
Conflict of Interest Statement
The authors declare that the research was conducted in the absence of any commercial or financial relationships that could be construed as a potential conflict of interest.
References
Andrews, A. M., Jaron, D., Buerk, D. G., Kirby, P. L., and Barbee, K. A. (2010). Direct, real-time measurement of shear stress-induced nitric oxide produced from endothelial cells in vitro. Nitric Oxide 23, 335–342. doi: 10.1016/j.niox.2010.08.003
Balcells, M., Fernández Suárez, M., Vázquez, M., and Edelman, E. R. (2005). Cells in fluidic environments are sensitive to flow frequency. J. Cell Physiol. 204, 329–335. doi: 10.1002/jcp.20281
Barbee, K. A. (2002). Role of subcellular shear-stress distributions in endothelial cell mechanotransduction. Ann. Biomed. Eng. 30, 472–482. doi: 10.1114/1.1467678
Barbee, K. A., Davies, P. F.,and Lal R. (1994). Shear stress-induced reorganization of the surface topography of living endothelial cells imaged by atomic force microscopy. Circ. Res. 74, 163–171. doi: 10.1161/01.RES.74.1.163
Cabrales, P., Zanini, G. M., Meays, D., Frangos, J. A., and Carvalho, L. J. (2011). Nitric oxide protection against murine cerebral malaria is associated with improved cerebral microcirculatory physiology. J. Infect. Dis. 203, 1454–1463. doi: 10.1093/infdis/jir058
Chen, X., Jaron, D., Barbee, K. A., and Buerk, D. G. (2006). The influence of radial RBC distribution, blood velocity profiles, and glycocalyx on coupled NO/O2 transport. J. Appl. Physiol. 100, 482–492. doi: 10.1152/japplphysiol.00633.2005
Chien, S. (2007). Mechanotransduction and endothelial cell homeostasis: the wisdom of the cell. Am. J. Physiol. Heart Circ. Physiol. 292, H1209–H1224. doi: 10.1152/ajpheart.01047.2006
Colantuoni, A., Bertuglia, S.,and Intaglietta M. (1984). Quantitation of rhythmic diameter changes in arterial microcirculation. Am. J. Physiol. 246, H508–H517.
Condorelli, P., and George, S. C. (2002). Free nitric oxide diffusion in the bronchial microcirculation. Am. J. Physiol. Heart. Circ. Physiol. 283, 2660–2670. doi: 10.1152/ajpheart.00003.2002
Davies, P. F., Zilberberg, J., and Helmke, B. P. (2003). Spatial microstimuli in endothelial mechanosignaling. Circ. Res. 92, 359–370. doi: 10.1161/01.RES.0000060201.41923.88
Dupin, M. M., Halliday, I., Care, C. M., Alboul, L., and Munn, L. L. (2007). Modeling the flow of dense suspensions of deformable particles in three dimensions. Phys. Rev. E 75:066707. doi: 10.1103/PhysRevE.75.066707
Frangos, J. A., Huang, T. Y., and Clark, C. B. (1996). Steady shear and step changes in shear stimulate endothelium via independent mechanisms – superposition of transient and sustained nitric oxide production. Biochem. Biophys. Res. Commun. 224, 660–665. doi: 10.1006/bbrc.1996.1081
Ghanem, R., and Spanos, P. (1991). Stochastic Finite Elements: A Spectral Approach (New York, NY: Springer-Verlag).
Hightower, C. M. Intaglietta M. (2008). Diagnostic frequency continuous ultrasonography directly mitigates venular ischemia reperfusion damage. J. Am. Coll. Surg. 206, 540–547. doi: 10.1016/j.jamcollsurg.2007.09.010
Intaglietta, M., Richardson, D. R., and Tompkins, W. R. (1971). Blood pressure, flow, and elastic properties in microvessels of cat omentum. Am. J. Physiol. 221, H922–H928.
Kanai, A. J., Strauss, H. C., Truskey, G. A., Crews, A. L., Grunfeld, S.,and Malinski T. (1995). Shear stress induces ATP-independent transient nitric oxide release from vascular endothelial cells, measured directly with a porphyrinic microsensor. Circ. Res. 77, 284–293. doi: 10.1161/01.RES.77.2.284
Kassab, G. S., and Fung, Y. C. (1995). The pattern of coronary arteriolar bifurcations and the uniform shear hypothesis. Ann. Biomed. Eng. 23, 13–20. doi: 10.1007/BF02368296
Kavdia, M., and Popel, A. S. (2003). Wall shear stress differentially affects NO level in arterioles for volume expanders and Hb-based O2 carriers. Microvasc. Res. 66, 49–58. doi: 10.1016/S0026-2862(03)00008-6
Kim, S., Kong, R. L., Popel, A. S., Intaglietta, M., and Johnson, P. C. (2006). A computer-based method for determination of the cell-free layer width in microcirculation. Microcirculation 13, 199–207. doi: 10.1080/10739680600556878
Kim, S., Kong, R. L., Popel, A. S., Intaglietta, M., and Johnson, P. C. (2007). Temporal and spatial variations of cell-free layer width in arterioles. Am. J. Physiol. Heart Circ. Physiol. 293, H1526–H1535. doi: 10.1152/ajpheart.01090.2006
Kuo, L., Chilian, W. M., and Davis, M. J. (1990). Coronary arteriolar myogenic response is independent of endothelium. Circ. Res. 66 860–866. doi: 10.1161/01.RES.66.3.860
Lamkin-Kennard, K. A., Jaron, D., and Buerk, D. G. (2004). Impact of the Fahraeus effect on NO and O2 biotransport: a computer model. Microcirculation 11, 337–349. doi: 10.1080/10739680490437496
Leiderman, K. M., Miller, L. A., and Fogelson, A. L. (2008). The effects of spatial inhomogeneities on flow through the endothelial surface layer. J. Theor. Biol. 252, 313–325. doi: 10.1016/j.jtbi.2008.01.013
Li, Y., Zheng, J., Bird, I. M., and Magness, R. R. (2005). Effects of pulsatile shear stress on signaling mechanisms controlling nitric oxide production, endothelial nitric oxide synthase phosphorylation, and expression in ovine fetoplacental artery endothelial cells. Endothelium 12, 21–39. doi: 10.1080/10623320590933743
Lin, G., Tartakovsky, A. M., and Tartakovsky, D. M. (2010). Uncertainty quantification via random domain decomposition and probabilistic collocation on sparse grids. J. Comput. Phys. 229, 6995–7012. doi: 10.1016/j.jcp.2010.05.036
Martini, J., Carpentier, B., Negrete, A. C., Frangos, J. A.,and Intaglietta M. (2005). Paradoxical hypotension following increased hematocrit and blood viscosity. Am. J. Physiol. Heart Circ. Physiol. 289, 2136–2143. doi: 10.1152/ajpheart.00490.2005
Namgung, B., Ong, P. K., Johnson, P. C., and Kim, S. (2011). Effect of cell-free layer variation on arteriolar wall shear stress. Ann. Biomed. Eng. 39, 359–366. doi: 10.1007/s10439-010-0130-3
Noris, M., Morigi, M., Donadelli, R., Aiello, S., Foppolo, M., Todeschini, M., et al. (1995). Nitric oxide synthesis by cultured endothelial cells is modulated by flow conditions. Circ. Res. 76, 536–543. doi: 10.1161/01.RES.76.4.536
Ong, P. K., Jain, S.,and Kim S. (2011a). Temporal variations of the cell-free layer width may enhance NO bioavailability in small arterioles: effects of erythrocyte aggregation. Microvasc. Res. 81, 303–312. doi: 10.1016/j.mvr.2011.02.002
Ong, P. K., Jain, S., and Kim, S. (2011b). Modulation of NO bioavailability by temporal variation of the cell-free layer width in small arterioles. Ann. Biomed. Eng. 39, 1012–1023. doi: 10.1007/s10439-010-0216-y
Park, S. W., Intaglietta, M., and Tartakovsky, D. M. (2012). Impact of endothelium roughness on blood flow. J. Theor. Biol. 300, 152–160. doi: 10.1016/j.jtbi.2012.01.017
Ruel, J., Lemay, J., Dumas, G., Doillon, C.,and Charara J. (1995). Development of a parallel plate flow chamber for studying cell behavior under pulsatile flow. ASAIO J. 41, 876–883. doi: 10.1097/00002480-199541040-00011
Sato, M., Nagayama, K., Kataoka, N., Sasaki, M.,and Hane K. (2000). Local mechanical properties measured by atomic force microscopy for cultured bovine endothelial cells exposed to shear stress. J. Biomech. 33, 127–135. doi: 10.1016/S0021-9290(99)00178-5
Schmidt, J. A., Intaglietta, M., and Borgström, P. (1992). Periodic hemodynamics in skeletal muscle during local arterial pressure reduction. J. Appl. Physiol. 73, 1077–1083.
Sharan, M., Singh, B.,and Kumar P. (1997). A two-layer model for studying the effect of plasma layer on the delivery of oxygen to tissue using a finite element method. Appl. Math. Modell. 21, 419–426. doi: 10.1016/S0307-904X(97)00035-8
Sriram, K., Vázquez, B. Y. S, Yalcin, O., Johnson, P. C., Intaglietta, M., and Tartakovsky, D. M. (2011). The effect of small changes in hematocrit on nitric oxide transport in arterioles. Antioxid. Redox Signal. 14, 175–185. doi: 10.1089/ars.2010.3266
Tartakovsky, D. M., and Winter, C. L. (2001). Dynamics of free surfaces in random porous media. SIAM J. Appl. Math. 61, 1857–1876. doi: 10.1137/S0036139999358180
Tartakovsky, D. M. Xiu D. (2006). Stochastic analysis of transport in tubes with rough walls. J. Comput. Phys. 217, 248–259. doi: 10.1016/j.jcp.2006.02.029
Tsai, A. G., Friesenecker, B., McCarthy, M., Sakai, H.,and Intaglietta M. (1998). Plasma viscosity regulates capillary perfusion during extreme hemodilution in hamster skin fold model. Am. J. Physiol. Heart. Circ. Physiol. 275, H2170–H2180.
Vaughn, M. W., Kuo, L., and Liao, J. C. (1998b). Effective diffusion distance of nitric oxide in the microcirculation. Am. J. Physiol. Heart Circ. Physiol. 274, 1705–1714.
Vaughn, M. W., Kuo, L., and Liao, J. C. (1998a). Estimation of nitric oxide production and reaction rates in tissue by use of a mathematical model. Am. J. Physiol. Heart Circ. Physiol. 274, 2163–2176.
Yalcin, O., Ulker, P., Yavuzer, U., Meiselman, H. J., and Baskurt, O. K. (2008). Nitric oxide generation by endothelial cells exposed to shear stress in glass tubes perfused with red blood cell suspensions: role of aggregation. Am. J. Physiol. Heart Circ. Physiol. 294, H2098–H2105. doi: 10.1152/ajpheart.00015.2008
Yee, A., Bosworth, K. A., Conway, D. E., Eskin, S. G., and McIntire, L. V. (2008). Gene expression of endothelial cells under pulsatile non-reversing vs. steady shear stress: comparison of nitric oxide production. Ann. Biomed. Eng. 36, 571–579. doi: 10.1007/s10439-008-9452-9
Zhang, J., Johnson, P. C., and Popel, A. S. (2009). Effects of erythrocyte deformability and aggregation on the cell free layer and apparent viscosity of microscopic blood flows. Microvas. Res. 77, 265–272. doi: 10.1016/j.mvr.2009.01.010
Appendix A
Transformed Transport Equations
A general transformation of coordinates ξi(x1, x2) transforms the Fickian flux F(x) = −D∇xCNO into a vector F(ξ) whose contravariant components F1 and F2 are given by
where J is the transformation Jacobian in Equation 20 and
Furthermore,
Substituting Equations (A1)–(A3) into Equation (1) leads to Equation (21).
Appendix B
Numerical Implementation
Let denote a set of multidimensional orthogonal polynomials of the random vector . The polynomials are chosen to have the ensemble means and (k ≥ 1) and to satisfy the orthogonality condition , where the 〈·〉 operator is defined by
δij is the Kronecker delta, and W(Y) is a weight function corresponding to a given polynomial type. The size of the polynomial set, M, is determined by the “stochastic dimension” K and the order P of polynomials Ψk, according to
Polynomial chaos expansions represent a system state, e.g., u(ξ, ω), a random field whose ensemble statistics are to be determined, as a series
Instead of stochastic Galerkin method, we adopt a stochastic collocation method to solve the random boundary problem. This method is described below.
Appendix C
Stochastic Collocation Method
Consider a stochastic partial differential equation
Its solution is approximated by using a Lagrange formula
where is the solution at the set of collocation points , Lk is the Lagrange polynomial of order Nq + 1, and Li(ξj) = δij. Next, Equation (A8) is substituted into the inner product formula given by Equation (A4) with the basis functions chosen to be Dirac delta functions δ(ξ − ξk). Then Nq + 1 uncoupled deterministic problems are solved at the collocation points,
Once the solutions at a set of collocation points are obtained, their statistics are computed by using the corresponding quadrature rule,
and
where is a set of weights corresponding to the set of quadrature points .
Keywords: microcirculation, wall shear stress, stochastic, nitric oxide, endothelium
Citation: Park S-W, Intaglietta M and Tartakovsky DM (2015) Impact of stochastic fluctuations in the cell free layer on nitric oxide bioavailability. Front. Comput. Neurosci. 9:131. doi: 10.3389/fncom.2015.00131
Received: 06 June 2015; Accepted: 08 October 2015;
Published: 27 October 2015.
Edited by:
Franck Plouraboué, Centre National de la Recherche Scientifique, FranceReviewed by:
Oliver E. Jensen, University of Manchester, UKMahendra Kavdia, Wayne State University, USA
Lance L. Munn, Harvard Medical School, USA
Copyright © 2015 Park, Intaglietta and Tartakovsky. This is an open-access article distributed under the terms of the Creative Commons Attribution License (CC BY). The use, distribution or reproduction in other forums is permitted, provided the original author(s) or licensor are credited and that the original publication in this journal is cited, in accordance with accepted academic practice. No use, distribution or reproduction is permitted which does not comply with these terms.
*Correspondence: Daniel M. Tartakovsky, ZG10QHVjc2QuZWR1