 Leiv Øyehaug
- Faculty of Technology, Arts and Design, Oslo Metropolitan University, Oslo, Norway
When potassium in the extracellular space separating neurons and glia reaches sufficient levels, neurons may fire spontaneous action potentials or even become inactivated due to membrane depolarisation, which, in turn, may lead to increased extracellular potassium levels. Under certain circumstances, this chain of events may trigger periodic bursts of neuronal activity. In the present study, reduced neuron–glia models are applied to explore the relationship between bursting behaviour and ion concentration dynamics. These reduced models are built based on a previously developed neuron–glia model, in which channel-mediated neuronal sodium and potassium currents are replaced by a function of neuronal sodium and extracellular potassium concentrations. Simulated dynamics of the resulting two reduced models display features that are qualitatively similar to those of the existing neuron–glia model. Bifurcation analyses of the reduced models show rich and interesting dynamics that include the existence of Hopf bifurcations between which the models exhibit slow ion concentration oscillations for a wide range of parameter values. The study demonstrates that even very simple models can provide insights of possible relevance to complex phenomena.
1 Introduction
Neurons are the main carriers of signals and information in the brain. When a neuron fires an action potential, K+ ions are discharged from and Na+ ions are taken up by the neuron, causing elevated levels of K+ in the extracellular space (ECS) and of Na+ in neurons. This affects neuronal excitability and thus ion flux magnitudes, which may further enhance ECS K+ levels (Frankenhaeuser and Hodgkin, 1956; Fertziger and Ranck, 1970; Zuckermann and Glaser, 1970; Kager et al., 2000; Kager et al., 2007). During high action potential frequency, K+ accumulates in the ECS and excess ECS K+ is absorbed by surrounding glial tissue (Lux et al., 1986; Somjen, 2004), which, at low neuronal activity could have been removed by the neuronal sodium–potassium pump. Glia, which are at least as abundant as neurons in the brain, modulate neurons by K+ uptake, e.g., through the 3Na+/2K+ ATP-driven sodium–potassium pump, the inwardly rectifying K+ channel Kir4.1, the Na+/K+/2Cl–cotransporter (NKCC1) (see Østby et al. (2009) for references), and through potassium spatial buffering (Orkand et al., 1966; Halnes et al., 2013; Witthoft et al., 2013). Alterations in corresponding glial transmembrane ion fluxes will affect the dynamics of
With the increased recognition of glial cells as highly significant modulators of neuronal activity, the past decades have witnessed a growing interest in mathematical neuron–glia models (reviewed by Volman et al., 2012). Many of these models are characterised by highly detailed neuron models and glial models of much lower biophysical detail (Kager et al., 2000; Kager et al., 2002; Kager et al., 2007; Fröhlich et al., 2006; Cressman et al., 2009; Florence et al., 2009; Ullah and Schiff, 2010), such that the models can assess qualitative effects of glial potassium buffering but cannot provide insights into how individual glial actors operate during potassium clearance. Recent scientific and technological advances have stimulated the emergence of more complex neuron–glia models (e.g., Sibille et al., 2015; Du et al., 2016; Depannemaecker et al., 2022; Du et al., 2022; Liu et al., 2023), which are capable of reproducing and predicting quantitatively a wide range of phenomena. However, their complexity makes it challenging to pinpoint which part of the model is responsible for a certain type of behaviour. This is easier to do with low-complexity models.
Classical neuroscience models derived from the Hodgkin and Huxley formalism (e.g., Hodgkin and Huxley, 1952) mostly neglect the variation in ion concentrations due to the short time scales of action potential dynamics. On longer time scales, ion concentration variability and its effect on neuronal excitability cannot be neglected. Mathematical neuron–glia models are thus generally composed of a fast neuron model and a slow glia model, in which the latter typically describes ion concentration dynamics in which time is measured in seconds. Therefore, when studying phenomena on this time scale, it may be beneficial to create models that facilitate the analysis of the slow ion concentration dynamics by developing alternative representations of the fast time scale dynamics (e.g., Cressman et al., 2009). Derivation of such reduced models and application of these models to describe and explain phenomena that are impacted by the neuron–glia interaction represent one of the outputs of the present study.
Previously, a combination of a glia model (Østby et al., 2009) with the neuron–ECS model of Kager et al. (2000) was developed and applied (Øyehaug et al., 2012) to investigate ECS K+
2 Materials and methods
The system under study comprises the neuron, the glial cell surrounding the neuron, and the ECS separating the two cells. This neuron–ECS–glia system (also sometimes referred to as the tripartite synapse) is depicted with its actors in the neuronal and glial membranes in Figure 1A. In the scenario in which an active neuron increases its own activity by releasing large quantities of K+ into the ECS, potentially causing harmful seizure activity, the key question of the present study is to which extent the sodium–potassium pump and the NKCC1 cotransporter in the glial membrane can clear ECS K+ and thereby contribute to maintaining a sound microenvironment in the surroundings of the neuron. This question is addressed using the reduced neuron–glia models that are derived from the neuron–glia model developed by Øyehaug et al. (2012).
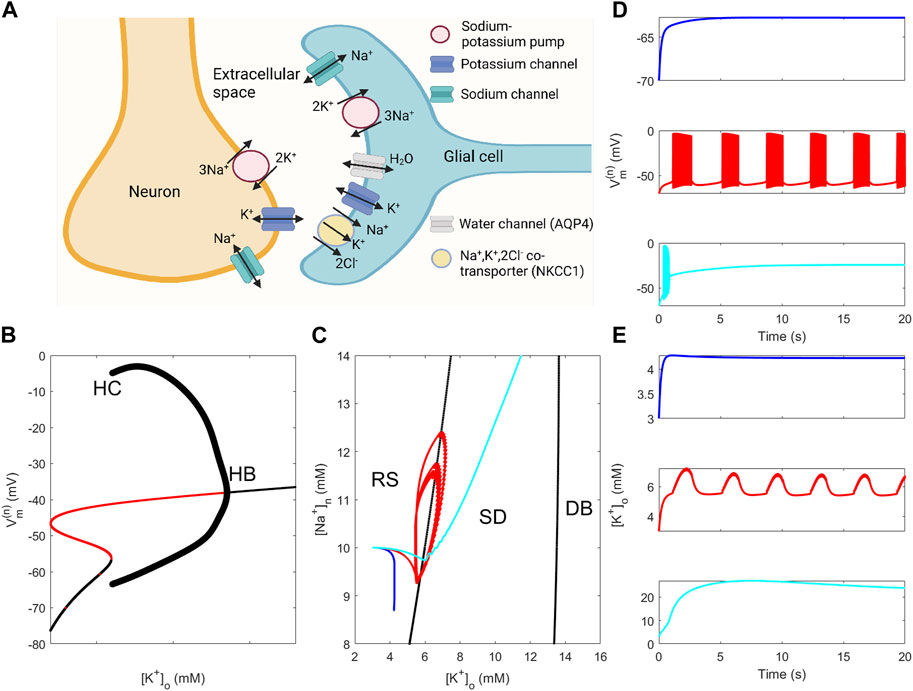
FIGURE 1. Properties of the neuron–ECS–glia system and of neuron and neuron–glia models. (A) Schematic representation of the neuron–glia system with channels, pumps, and cotransporters in the neuron and glia membranes (depicted sodium and potassium channels in the neuron membrane comprise several channels). (B) Bifurcation diagram of the model of Kager et al. (2000) using [K+]o as the bifurcation parameter [(Na+)n is fixed at 10 mM, and model parameter values are given in Supplementary Material]. “HB” and “HC” indicate locations of a Hopf bifurcation and a heteroclinic bifurcation, respectively. (C) Two-parameter bifurcation diagram of the model of Kager et al. (2000) using [K+]o and [Na+]n as bifurcation parameters showing how curves that correspond to the HB and HC bifurcations in (B) separate the parameter plane into regions corresponding to the resting state (RS), spontaneous discharge (SD), and depolarisation block (DB) behaviour. Curves displayed are solution orbits corresponding to the dynamics displayed in (D) and (E) using the same colour coding. (D)–(E): Dynamics of neuronal membrane potential (D) and of [K+]o (E) obtained from simulations using the full neuron–glia model (parameter values are given in Supplementary Material). The glial sodium–potassium pump rate
2.1 The neuron–glia model
The neuron–glia model is an ordinary differential equation (ODE) model that describes ion and water transport through the membranes separating the neuron, the ECS, and the glial cell. The model is, crudely speaking, composed of the glia model developed by Østby et al. (2009) and the neuron model by Kager et al. (2000). Examples of simulated neuronal membrane potential and [K+]o dynamics using the neuron–glia model defined by Eqs 1a–6 are shown in Figures 1D, E. The model exhibits resting state (RS) behaviour when the glial sodium–potassium pump rate is slightly reduced (top panels), shows behaviour alternating between RS and spontaneous discharges (SDs), i.e., spontaneous bursting (SB), when the pump rate is moderately reduced (middle panels), and depolarisation block (DB) behaviour when the pump rate is severely reduced (bottom panels). In the DB case, the neuron membrane is highly depolarised and [K+]o shows extreme levels. RS, SB, and DB represent the three modes of behaviour in the dynamical repertoire of the neuron–glia model.
To assess the significance of ion concentration dynamics on mode selection, the neuron model was subjected to bifurcation analysis with [K+]o and [Na+]n as bifurcation parameters. Fixing [Na+]n to 10 mM, the neuron model exhibits RS behaviour for low-to-moderate [K+]o levels, SD behaviour for [K+]o approximately in the range 6–13 mM, and DB behaviour for [K+]o beyond 13 mM (Figure 1B). Extending the bifurcation analysis to allow variation also in [Na+]n resulted in a two-dimensional bifurcation plot where the locations of the Hopf and heteroclinic bifurcations are tracked throughout the
The neuron dynamics is described by a modified version of the neuron model of Kager et al. (2000) that describes the membrane potential dynamics that result from K+ and Na+ transmembrane currents and the kinetics of channel gates. The associated ODEs of the neuron model read
where Cm = 1 μF cm−2 is the neuron membrane specific capacitance,
The glia model describes the time rate of change of the number of ions S (denoted NS,g for the number of ions within glia or NS,o in the ECS, where S can be sodium, potassium, and chloride), the time rate of change of the glial volume by ODEs, and the change of the glial membrane potential as a function of time by an algebraic equation. The number of each ion species S (Na+, K+, and Cl−) per unit of glial area in the glia compartment is given by the product NS,j = wj[S]j, where j is either g or o and wg represents the ratio between the glial cell volume and glial membrane area. Provided the ECS and glial volumes are modelled by glial membrane processes, a precise geometrical specification of the region of interest is not required (Chen and Nicholson, 2000; Østby et al., 2009); it suffices to specify the ratio between the ECS volume and the associated glial volume and the ratio between the glial membrane area and glial volume. The model describes sodium, potassium, and chloride channels, as well as the sodium–potassium pump, the NKCC1 cotransporter, and water channels in the glial membrane (depicted in Figure 1A). Compared to the model used by Øyehaug et al. (2012), the model implemented in this study neglects bicarbonate ions and the electrogenic sodium bicarbonate cotransporter (NBC).
The neuron–glia model (hereafter referred to as the full model) is composed of the aforementioned Eqs 1a, 1b and the following ODEs for the number of ions in the neuronal, ECS, and glia compartments;
where
where NS is constant. Furthermore, the sum of the ECS and glia volumes and the neuron volume are assumed constant such that wo + wg = wtot and wn are constants. The fact that the expression
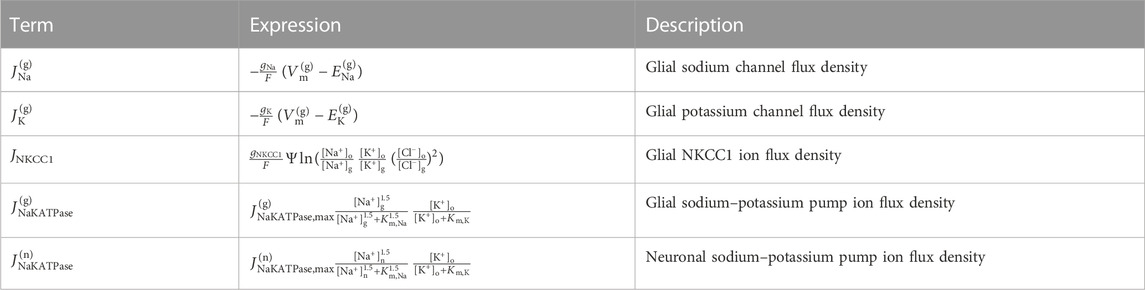
TABLE 1. Ion flux densities in the glia model and the sodium–potassium pump ion flux density in the neuron model. The glial Nernst potential of ion species S is
2.2 Electroneutrality
The requirement of charge neutrality (Johnston and Wu, 1994) is enforced within each compartment. Glial electroneutrality is ensured by assuming the glial chloride concentration to be given by the following equation:
Here, ρ is the average charge of the negatively charged impermeable ions relative to the elementary charge. Multiplication of Eq. 4 by wg followed by differentiation gives an algebraic equation that translates to the assumption that the total glial transmembrane electric current is at every instant zero, giving for the glial membrane potential
where the glial Nernst potentials of the ion species S (
Since the total glial transmembrane current is zero and the total neuronal transmembrane current is generally non-zero, the additional assumption that the neuronal chloride flux can be neglected is imposed to ensure ECS electroneutrality. Then, the ECS chloride level is
Finally, neglecting Cl−neuronal currents and assuming that neuronal K+ and Na+ currents are equal in magnitude but oppositely directed (which explains the identical terms in Eqs 2a, 2b) together ensure that the neuron is electroneutral.
2.3 Model reduction
The model reduction process that leads to the creation of the two reduced models involves i) replacing neuronal ion fluxes at given [Na+]n and [K+]o by the expression obtained when fitting a suitable function to the ion fluxes computed using the neuron model and ii) assuming that the sum of ECS K+ and Na+ levels is constant. Step i) is used to create the first reduced model (RM1). When additionally invoking step ii), the second reduced model (RM2) is derived.
2.3.1 Approximation of neuronal currents
In the first step of the model reduction process, the neuronal transmembrane sodium flux is replaced by a function of [K+]o and
The parameter M is set to 50 such that F and G are step-like in the vicinity of u = 0 and v = 0, respectively, F is approximately zero when
which is in agreement with the computed ion flux (Figures 2A, C). The function J is fitted to the simulation data by minimising a cost function defined as the sum of squared deviations between data and the function J using the MATLAB function fminsearch. The estimated parameter values are given in the caption to Figure 2.
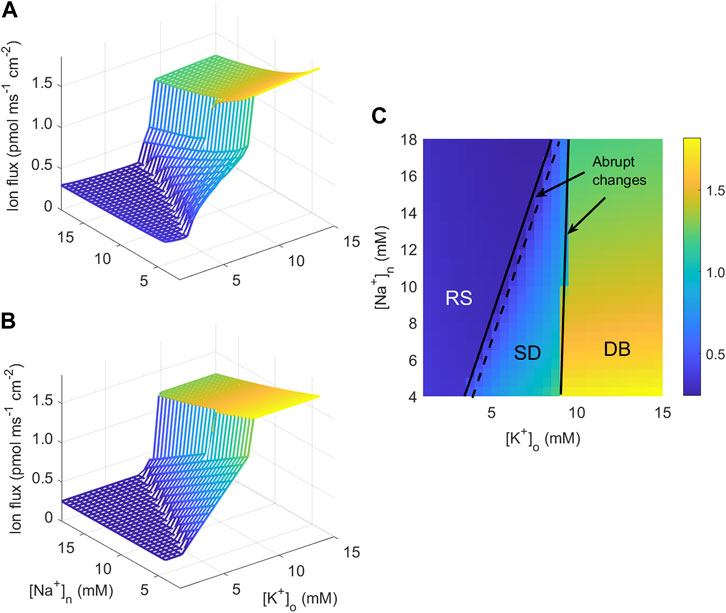
FIGURE 2. Calculated and fitted sodium transmembrane neuronal current. (A) Magnitude of the sodium current into the neuron as a function of [K+]o and [Na+]n computed from the neuronal model of Kager et al. (2000). (B) Best fit to the current plotted in (A) to the function given in Eq. 7a obtained by the parameters y1 = 0.367, y2 = 25.52, y3 = 6.39, y4 = 35.38, y5 = 1.10, y6 = 2.51, y7 = 3.33, y8 = 16.38, and y9 = 137.9 (the unit for y1 and y3 is pmol ms−1 cm−2, for y2: pmol ms−1 cm−2 mM−1, for y4, y5, y7, and y9: mM. y6 and y8 are unit-free). (C) Contour plot of the current in (A) as a function of [K+]o and [Na+]n with indications of the expected behaviour in three regions of the ([K+]o,[Na+]n)-plane.
2.3.2 Development of reduced models
In order to derive the first reduced model RM1, the aforementioned fitting procedure was invoked to replace the neuronal channel-mediated sodium current JNa in Eqs 2a, 2b by the function in Eqs 7a, 7c. Then, the ODEs Eqs 1a, 1b describing action potential dynamics are not needed, such that the model equations for RM1 are
For a range of parameter values in the full model and in RM1, [K+]o + [Na+]o shows limited variation (Supplementary Figure S1). In the second step of the model reduction process, it is thus additionally assumed that the sum of K+ and Na+ ECS concentrations, [K+]o + [Na+]o, is constant. This allows the omission of the variable
In RM2, ion number variables could have been replaced by ion concentrations but were kept to maintain consistency between all models.
3 Results
In Øyehaug et al. (2012), it was observed that the neuron–glia model exhibited slow ion concentration oscillations when the glial sodium–potassium pump rate was sufficiently weakened. In the present study, in addition to studying the effect of the pump rate, the dependence of slow oscillations on NKCC1-mediated ion uptake and on glial K+ levels will be examined in RM1 and RM2 using bifurcation analysis, phase plane analysis, and numerical simulations. Bifurcation analyses and numerical simulations were performed using XPPAUT software (Ermentrout, 2012) and the MATLAB ODE solver ode113, respectively.
3.1 Comparison of simulated model dynamics
To assess whether the full and reduced models show similar behaviour, model simulations were performed for a range of values for the glial sodium–potassium reduction factor fNaK, which is multiplied by the rate
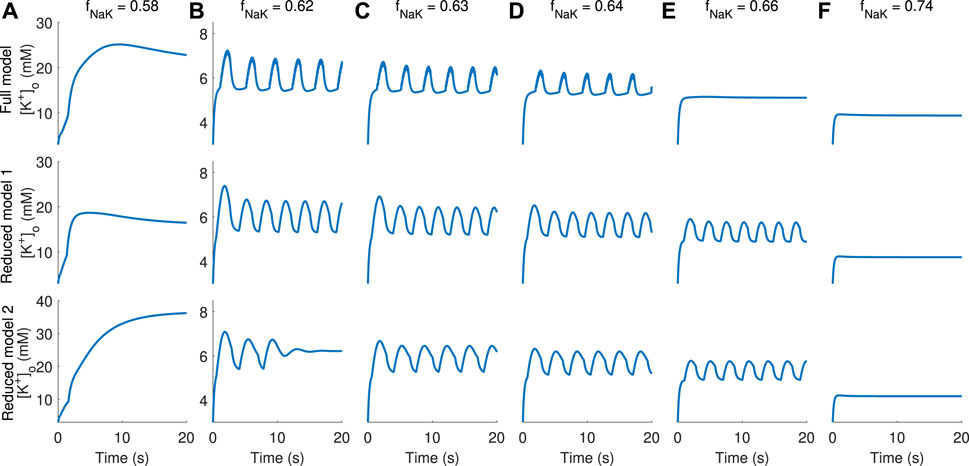
FIGURE 3. Comparison of [K+]o dynamics obtained in simulations using the full and reduced models. Columns (A–F) display [K+]o dynamics for increasing values of the sodium–potassium pump rate obtained by multiplication by a factor fNaK in the range 0.58–0.74, indicated at the top of each column. Full model dynamics are displayed in the top panel, RM1 in the middle, and RM2 in the bottom panel.
3.2 Dependence on the glial sodium–potassium pump rate
Spontaneous bursting was observed in the full model when the glial sodium–potassium pump rate was significantly reduced (Øyehaug et al., 2012); see also Figures 1C, D. In order to assess the propensity of the reduced models to show the same kind of behaviour, bifurcation analyses with the glial sodium–potassium pump rate reduction factor fNaK as the bifurcation parameter were performed for RM1 and RM2. This analysis shows that both models possess a rich dynamical repertoire (Figures 4A1, A2, B1, B2).
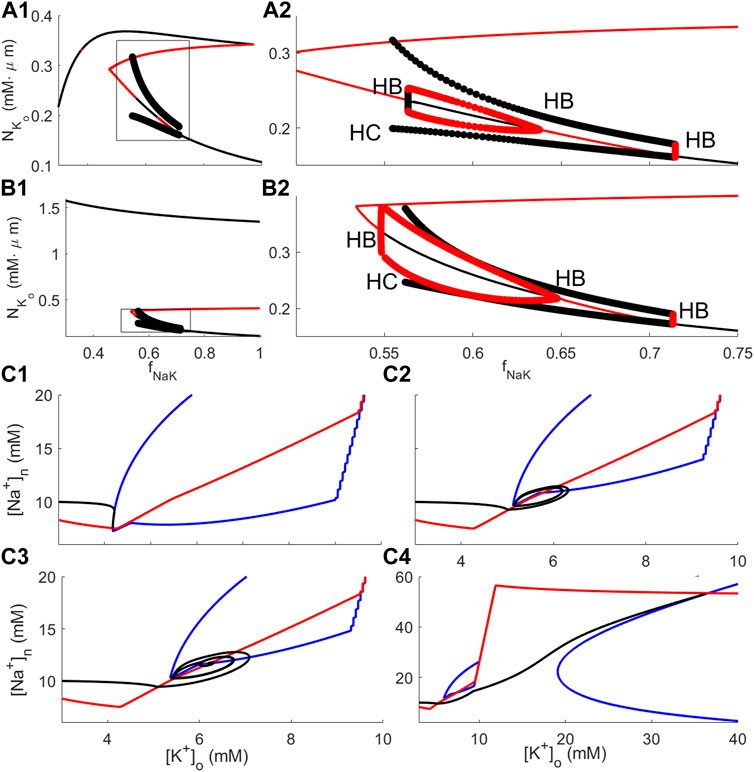
FIGURE 4. Bifurcation and phase plane analysis for RM1 and RM2. (A1-A2): Bifurcation diagram of RM1 with the sodium–potassium pump rate reduction factor fNaK as the bifurcation parameter. (A1) shows the full diagram, and (A2) shows details of the diagram within the rectangle depicted in (A1). The black curve indicates stable steady states; red curve, unstable steady states; black filled circles, stable oscillatory solutions; and red filled circles, unstable oscillatory solutions. “HB” and “HC” indicate locations of Hopf and heteroclinic bifurcations, respectively. (B1–B2): Same as (A1–A2) for RM2. (C1–C4): Solution orbits and phase plane analysis for RM2 in the
3.2.1 Bifurcation analysis of reduced models
The full bifurcation diagrams for RM1 and RM2 (Figures 4A1, B1, respectively) show the same qualitative behaviour; for modest pump rate reductions, i.e., for fNaK near 1, [K+]o is at moderate levels (corresponding to resting state–RS–solutions), and for smaller fNaK, there is a regime of values in which solutions are oscillating (spontaneous bursting–SB). For all values of fNaK, there is an elevated K+ state with very high K+ levels, especially in RM2 (depolarisation block–DB). Thus, the DB state coexists with the RS and with the SB state. Enlarging the areas within the rectangles in Figures 4A1, B1, further details of the bifurcation analysis for RM1 and RM2 are revealed (Figures 4A2, B2, respectively). The bifurcation diagrams of RM1 and RM2 are qualitatively similar; both show RS behaviour for fNaK just below 1, SB behaviour in an intermediate range for fNaK, and no stable steady state below some threshold values for fNaK. The values which separate different modes of dynamical behaviour are Hopf bifurcations (indicated by “HB”) where, as stable steady states go unstable, stable limit cycle solutions emerge (or the opposite; as unstable steady states go stable, unstable limit cycle solutions emerge). Surprisingly, in both diagrams, in addition to the Hopf bifurcation separating the stable RS and stable bursting oscillations (approximately at fNaK = 0.72 in both diagrams), there is one Hopf bifurcation where the unstable steady state that coexists with stable limit cycle solutions goes stable when fNaK is decreasing and unstable limit cycle solutions emerge (roughly at fNaK = 0.64 in both diagrams) and one where the stable steady state goes unstable again when fNaK is decreasing (roughly at fNaK = 0.54 in RM1 and at fNaK = 0.56 in RM2). In this case, three stable states coexist, the DB state, the SB state, and the semi-elevated [K+]o state, i.e., tristability. Figure 3B, bottom, shows [K+]o dynamics using RM2 with fNaK = 0.62, i.e. in the parameter regime of tristability. Solutions exhibit vanishing oscillations and subsequent convergence to a stable steady state, consistent with the bifurcation diagram at this value of fNaK which predicts the existence of unstable oscillatory solutions in coexistence with a stable semi-elevated state for [K+]o. The tristability phenomenon will further be elaborated in the Discussion. Finally, the points where the periodic limit cycle solutions vanish (approximately at fNaK = 0.55 in RM1 and at fNaK = 0.56 in RM2) are heteroclinic bifurcations (indicated by “HC” in the diagrams).
3.2.2 Phase plane analysis of RM2
The dependence of the RM2 dynamics on fNaK was examined by solving the RM2 model Eqs 10a, 10b for fNaK = 0.74, 0.64, 0.62, and 0.58. Consistent with the bifurcation analysis, in the first and last of these cases, the model solution orbit approaches, respectively, a low [K+]o (approximately 4 mM) and a high [K+]o (approximately 35 mM) steady state asymptotically (black curves in Figures 4C1, C4, respectively), and, in the two intermediate cases, the solution orbit is oscillating and converges to a limit cycle (Figure 4C2, black curve) or spirals toward a steady state (Figure 4C3, black curve, corresponding to the dynamics of Figure 3B, bottom). The nullclines of
3.3 Dependence on the NKCC1 cotransporter
In order to assess how the sodium potassium chloride (NKCC1) cotransporter affects the neuron–glia system’s propensity to show bursting behaviour, a two-parameter bifurcation analysis was performed where the NKCC1 factor fNKCC1 (the factor multiplied by the NKCC1 ion flux JNKCC1) is the second bifurcation parameter in addition to fNaK. The two-parameter analysis starts with the one-parameter bifurcation diagrams for fNaK and then keeps track of the location of the lower and upper Hopf bifurcations in Figures 4A2, B2 (The location of the lower Hopf bifurcation is used instead of the location of the heteroclinic bifurcation since XPPAUT has difficulties tracking the location of the latter). This results in two curves that approximately separate the (fNaK, fNKCC1)-plane into regions corresponding to RS, SB, and DB behaviour. Figures 5A, B display these regions for RM1 and RM2, respectively. The steepness of these curves suggests that the sensitivity of neuronal excitability to variation in the NKCC1 ion flux rate is much smaller than sensitivity to variation in fNaK.
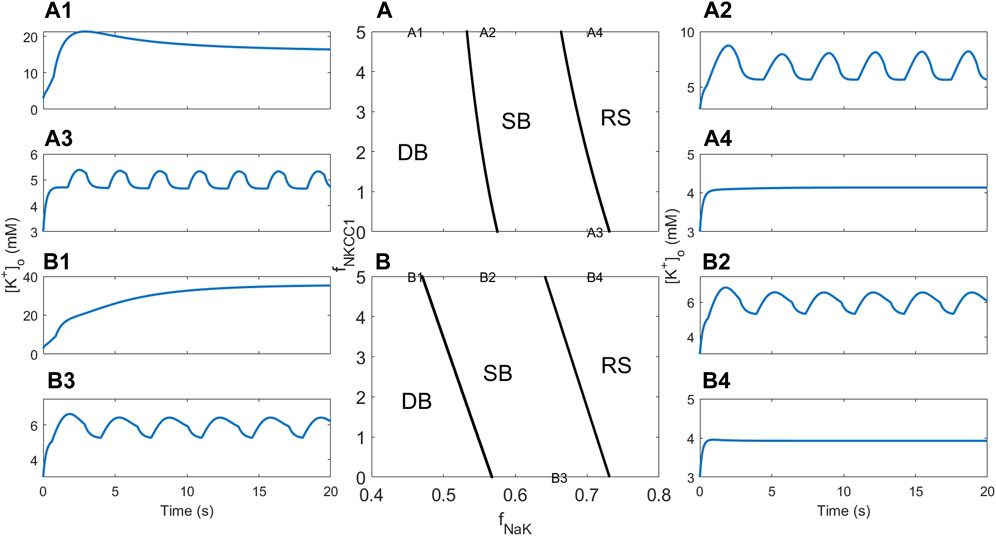
FIGURE 5. Bifurcation analysis and [K+]o dynamics showing the effect of pump rate and NKCC1. (A) Two-parameter bifurcation diagram showing how dynamics of the RM1 depends on fNaK and fNKCC1. The three regions indicated by RS, SD, and DB correspond to regions of the (fNaK, fNKCC1)–plane where the resting state, spontaneous discharge, and depolarisation block behaviour are observed, respectively. “A1”–“A4” in the figure indicate the locations in the parameter plane associated with simulations whose results are shown in (A1–A4). (B) Same as (A) for RM2. “B1”–“B4” in the figure indicate the locations in the parameter plane associated with simulations whose results are shown in (B1–B4).
For RM1, four simulations were subsequently performed in which parameter combinations were selected from each of the three regions; simulation A1 displays DB behaviour (Figure 5A1), simulations A2 and A3 display SB behaviour (Figures 5A2, A3), and simulation A4 displays RS behaviour (Figure 5A4), as expected from the associated location of the parameters in the (fNaK, fNKCC1)-plane in Figure 5A. Similarly for RM2, four simulations were subsequently performed in which parameter combinations were selected from each of the three regions; simulation B1 displays DB behaviour (Figure 5B1), simulations B2 and B3 display SB behaviour (Figures 5B2, B3), and simulation B4 displays RS behaviour (Figure 5B4), as expected from the associated location of the parameters in the (fNaK, fNKCC1)-plane in Figure 5B. The results for RM2 are almost identical to RM1; the only major difference is the DB value of [K+]o, which is much higher in RM2 than in RM1 (compare Figures 5A1, B1).
3.4 Dependence on [K+]g
Increased levels of K+ generally increase neuronal excitability. To investigate the models’ response to variable K+ total levels without changing the structure of the models, the initial glial K+ concentration
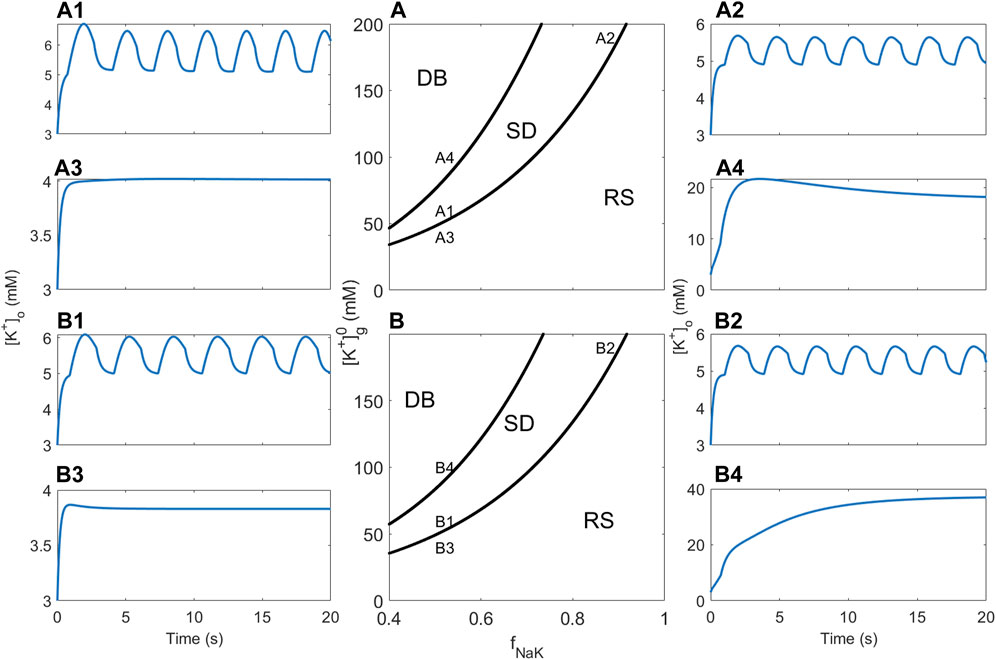
FIGURE 6. Bifurcation analysis and [K+]o dynamics showing the effect of pump rate and [K+]g. (A) Two-parameter bifurcation diagram showing how dynamics of the RM1 depends on fNaK and [K+]g. The three regions indicated by RS, SD, and DB correspond to regions of the
4 Discussion
The present study demonstrates how various actors in the glial membrane can potentially influence neuronal excitability. This is achieved by developing two highly simplified mathematical models that describe ion concentration dynamics in the neuron–ECS–glia system. Central to the derivation of the reduced models from the full neuron–glia model of Øyehaug et al. (2012) is the replacement of action potential-induced neuronal currents by expressions that depend on neuronal Na+ and ECS K+ concentrations. The dynamics of the reduced models mimics that of the full model, and bifurcation analyses show that the dynamical repertoire of these models is similar to that of the full model and to previously published models (e.g., Cressman et al., 2009; Barreto and Cressman, 2011) and consistent with experimental observations (McBain, 1994; Jensen and Yaari, 1997; Feng and Durand, 2006; Ziburkus et al., 2006).
The results of the bifurcation analyses provide evidence that the mechanism responsible for bursting is a Hopf bifurcation. Mathematically, this is clearly correct, but since the concept of a bifurcation is difficult to interpret directly into the physiological context, a clarification of the circumstances that enable periodic bursting is required. The bursting phenomenon is primarily caused by interaction between [K+]o and [Na+]n, suggesting that RM2 is an appropriate venue for explaining how bursting behaviour is maintained. For solutions of RM2, where the selected parameter values are consistent with bursting, one cycle of the solution is considered (Figures 7A–C). At the time labelled “1,” the solution orbit enters the SD region (Figure 7C), which triggers a rapid switch in the neuronal ion flux from negative to positive. This causes [K+]o and [Na+]n to abruptly go from declining to increasing (Figures 7A, B). Once the solution orbit has entered the SD region, for a while, transmembrane sodium and potassium currents increase in magnitude such that [K+]o and [Na+]n increase. However, rising levels of [Na+]n cause a decrease in the K+ neuronal efflux, which, in turn, leads to reduced [K+]o and, ultimately, the solution orbit exits from the SD region and re-enters the RS region (Figure 7, “2”). In this region, both K+ and Na+ fluxes are substantially reduced compared to in SD, causing a decrease in both concentrations. This lasts until [Na+]n becomes sufficiently small to allow the neuronal efflux of K+ to increase, permitting the orbit to re-enter the SD region (Figure 7, “1”), causing the initiation of another bursting episode.
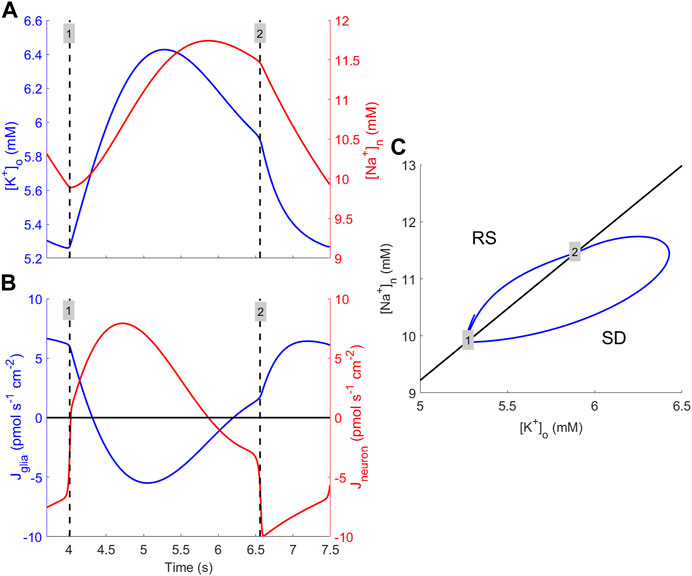
FIGURE 7. Explanation for how burst cycles are maintained. (A) [K+]o (blue) and [Na+]n (red) dynamics during one cycle of bursting obtained by numerically solving the RM2 model Eqs 10a, 10b using the default parameter set except the sodium–potassium pump rate, which is multiplied by 0.70 to generate periodic bursting solutions. The times of entering and exiting from the SD region are indicated (black dashed vertical lines) and labelled “1” and “2,” respectively. (B) Magnitude of glial transmembrane K+ flux (blue) and of neuronal transmembrane K+ and Na+ fluxes (red) during one cycle. The black vertical dashed lines and the numbering have the same meaning as in (A). (C) Solution orbit during one cycle (blue) in the
The bifurcation analysis shows that the reduced models possess interesting properties, including the coexistence of two modes (bistability) and even three modes (tristability) of dynamics. Theoretical explorations into the dynamics of the mathematically tractable RM2 should be made to gain an improved understanding of this model and, if possible, pinpoint the mechanisms in the model that are responsible for the bistability and tristability phenomena. One specific question that should be addressed in this respect is why the model ends up in one of the stable states rather than the others, as seen in the simulation (Figure 3B, bottom), where, in the parameter regime of tristability, the model converges to the semi-elevated K+ state. The long-time behaviour of the model orbit depends on the location of the orbit in state space, i.e., which basin of attraction the initial state belongs to. Determining the boundaries between the various basins of attraction is non-trivial in complex high-dimensional systems but should be feasible in simpler models, such as RM1 and RM2, and thus represents a possible topic for future investigation. The aforementioned efforts will most likely reveal whether or not bi and tristability are artefacts of the choice of expressions in the model or of the simplifying assumptions that lead to the creation of the reduced models. Furthermore, similar investigations into the full model could be made to examine its potential for displaying tristability. If it has such a potential, one could argue that the coexistence of three types of dynamical behaviour could be of biological significance.
Without modifying the present models, in future studies, the significance of the neuronal sodium–potassium pump and neuronal sodium and potassium channels can be assessed using the methods employed in the present study. Furthermore, applying slight modifications and extensions of the models, future prospects for applying the reduced models to assess the roles of more glial actors and processes include, but are not limited to, the sodium-bicarbonate cotransporter NBC, the inwardly rectifying K+ (Kir) 4.1 channel (Sibille et al., 2015), the potassium–chloride cotransporter KCC1, and calcium-dependent channels. It is known that ECS and glia volumes are variable even under quite normal circumstances (Østby et al., 2009; Ullah et al., 2015). The impact of ECS and glia volume variation on model dynamics can be assessed using RM1. However, since RM1 and RM2 dynamics are qualitatively similar despite constant volumes in RM2 (compare Figures 4A2, B2), altering the parameters that govern volume change in RM1 will most likely not substantially affect the dynamics of this model.
Epilepsy has been linked to weakened handling of ECS K+ levels (Fröhlich et al., 2008a), astroglia dysfunction (Binder and Steinhäuser, 2006), and reduced overall activity of the sodium–potassium pump (Grisar et al., 1992), consistent with the increased propensity of the models of the present study to exhibit oscillatory ion concentration dynamics when glial uptake mechanisms are impaired. In the elevated [K+]o model of epilepsy, local perturbations in ECS K+ levels spontaneously trigger neurons, which, in turn, lead to epileptic seizure activity (e.g., Bazhenov et al., 2004; Fröhlich et al., 2008a; Fröhlich et al., 2008b; Florence et al., 2012), which may be propagated throughout the brain tissue (Lebovitz, 1996; Park and Durand, 2006; Naze et al., 2015; Chizhov and Sanin, 2020). To describe mathematical conditions for the spreading of neuronal activity and for the termination of seizures, a spatial model is required where neuron–glia systems interact with other neuron–glia systems through the diffusion of ions and other agents or the propagation of electrical properties, i.e., neuron–ECS–glia network models (Park and Durand, 2006; Durand et al., 2010; Ullah and Schiff, 2010; Oschmann et al., 2018; Manninen et al., 2023). The simplicity of the reduced models makes them suitable as nodes in complex network models, in particular models that describe the spread of seizure activity. One specific question to be addressed by such models is how high [K+]o-induced neuronal activity (i.e., seizures) may spread in a multicellular neuron–glia network and how activity propagation and termination depend on parameters of individual neuron–ECS–glia systems and on properties of the interaction between these systems.
Potentially, network models may also be applied to describe spreading depression (Ayata and Lauritzen, 2015), which is characterised by a wave of intense but transient regional depolarisation of neurons and glia, and associated with high [K+]o due to overload of ECS K+ clearance mechanisms. When neuronal activity is non-uniform across the neuron–ECS–glia system, spatial models on a cellular or sub-cellular spatial scale are required to describe phenomena such as spatial K+ buffering (Orkand et al., 1966; Halnes et al., 2013; Witthoft et al., 2013), where glia absorb excess K+ at glial sites facing the synapse and release it at distant locations. A theoretical investigation of spatial potassium buffering and its putative role in ECS K+ clearance and the promotion or suppression of associated phenomena, such as SB and DB behaviour, represents an interesting avenue for future research.
Blood supply and thus the provision of oxygen and nutrients to neural tissue increase with enhanced neural activity, suggesting the existence of a complex interplay between neurons, glia, epithelial cells of the blood-brain-barrier, and non-cellular elements such as the ECS and the extracellular matrix, the elements of the so-called neurovascular unit (Attwell et al., 2010; Iadecola, 2017). In addition to its role as the most prominent signalling ion in the neuron-ECS-glia system, K+ contributes to signalling across the neurovascular unit (Paulson and Newman, 1987; Farr and David, 2011). A theoretical investigation of the intricate interaction between ion concentrations in the neuron-ECS-glia subsystem and blood flow regulation could combine the reduced models of the present study with models that account for migration of K+ ions through glia from perisynaptic to perivascular regions where K+ and other agents are assumed to contribute to dilation and constriction of blood vessels (as e.g. Farr and David, 2011; Witthoft et al., 2013). This kind of approach, where no subsystems are considered as isolated entities, but rather as interacting components, is very much aligned with the brain active milieu research initiative (Semyanov and Verkhratsky, 2021; 2022).
Reduced models, although expected to be less realistic than the more detailed full neuron–glia model, nevertheless reproduce qualitatively essential features of the full model. In addition, owing to the low complexity and relatively small number of tunable parameters, mechanisms responsible for certain phenomena are easily identified using simple models, demonstrated in this study in which analyses show that bursting behaviour in the neuron–glia system can be attributed to variability in the glial sodium–potassium pump rate, the NKCC1 cotransporter uptake rate, and glial K+ levels.
Data availability statement
The original contributions presented in the study are included in the article/Supplementary Material; further inquiries can be directed to the corresponding author.
Author contributions
LØ conceived the idea of the study, developed the reduced models, performed simulations and bifurcation analysis, and wrote the manuscript. The author confirms being the sole contributor of this work and has approved it for publication.
Conflict of interest
The author declares that the research was conducted in the absence of any commercial or financial relationships that could be construed as a potential conflict of interest.
Publisher’s note
All claims expressed in this article are solely those of the authors and do not necessarily represent those of their affiliated organizations, or those of the publisher, the editors, and the reviewers. Any product that may be evaluated in this article, or claim that may be made by its manufacturer, is not guaranteed or endorsed by the publisher.
Supplementary material
The Supplementary Material for this article can be found online at: https://www.frontiersin.org/articles/10.3389/fnetp.2023.1189118/full#supplementary-material
References
Attwell, D., Buchan, A. M., Charpak, S., Lauritzen, M., MacVicar, B. A., and Newman, E. A. (2010). Glial and neuronal control of brain blood flow. Nature 468, 232–243. doi:10.1038/nature09613
Ayata, C., and Lauritzen, M. (2015). Spreading depression, spreading depolarizations, and the cerebral vasculature. Physiol. Rev. 95, 953–993. doi:10.1152/physrev.00027.2014
Barreto, E., and Cressman, J. R. (2011). Ion concentration dynamics as a mechanism for neuronal bursting. J. Biol. Phys. 37, 361–373. doi:10.1007/s10867-010-9212-6
Bazhenov, M., Timofeev, I., Steriade, M., and Sejnowski, T. J. (2004). Potassium model for slow (2-3 Hz) in vivo neocortical paroxysmal oscillations. J. Neurophysiol. 92, 1116–1132. doi:10.1152/jn.00529.2003
Binder, D. K., and Steinhäuser, C. (2006). Functional changes in astroglial cells in epilepsy. Glia 54, 358–368. doi:10.1002/glia.20394
Chen, K. C., and Nicholson, C. (2000). Spatial buffering of potassium ions in brain extracellular space. Biophys. J. 78, 2776–2797. doi:10.1016/S0006-3495(00)76822-6
Chizhov, A. V., and Sanin, A. E. (2020). A simple model of epileptic seizure propagation: Potassium diffusion versus axo-dendritic spread. PLoS One 15, e0230787. doi:10.1371/journal.pone.0230787
Cressman, J. R., Ullah, G., Ziburkus, J., Schiff, S. J., and Barreto, E. (2009). The influence of sodium and potassium dynamics on excitability, seizures, and the stability of persistent states: I. Single neuron dynamics. J. Comput. Neurosci. 26, 159–170. doi:10.1007/s10827-008-0132-4
Depannemaecker, D., Ivanov, A., Lillo, D., Spek, L., Bernard, C., and Jirsa, V. (2022). A unified physiological framework of transitions between seizures, sustained ictal activity and depolarization block at the single neuron level. J. Comput. Neurosci. 50, 33–49. doi:10.1007/s10827-022-00811-1
Dronne, M.-A., Boissel, J.-P., and Grenier, E. (2006). A mathematical model of ion movements in grey matter during a stroke. J. Theor. Biol. 240, 599–615. doi:10.1016/j.jtbi.2005.10.023
Dronne, M.-A., Grenier, E., Dumont, T., Hommel, M., and Boissel, J.-P. (2007). Role of astrocytes in grey matter during stroke: A modelling approach. Brain Res. 1138, 231–242. doi:10.1016/j.brainres.2006.12.062
Du, M., Li, J., Wang, R., and Wu, Y. (2016). The influence of potassium concentration on epileptic seizures in a coupled neuronal model in the hippocampus. Cogn. Neurodyn. 10, 405–414. doi:10.1007/s11571-016-9390-4
Du, M., Li, J., Ying, W., and Yu, Y. (2022). A dynamics model of neuron-astrocyte network accounting for febrile seizures. Cogn. Neurodyn. 16, 411–423. doi:10.1007/s11571-021-09706-w
Durand, D. M., Park, E.-H., and Jensen, A. L. (2010). Potassium diffusive coupling in neural networks. Philos. Trans. R. Soc. Lond. B Biol. Sci. 365, 2347–2362. doi:10.1098/rstb.2010.0050
Ermentrout, B. (2012). “XPPAUT,” in Computational systems neurobiology. Editor N. Le Novère (Dordrecht: Springer Netherlands), 519–531. doi:10.1007/978-94-007-3858-4_17
Farr, H., and David, T. (2011). Models of neurovascular coupling via potassium and EET signalling. J. Theor. Biol. 286, 13–23. doi:10.1016/j.jtbi.2011.07.006
Feng, Z., and Durand, D. M. (2006). Effects of potassium concentration on firing patterns of low-calcium epileptiform activity in anesthetized rat Hippocampus: Inducing of persistent spike activity. Epilepsia 47, 727–736. doi:10.1111/j.1528-1167.2006.00499.x
Fertziger, A. P., and Ranck, J. B. (1970). Potassium accumulation in interstitial space during epileptiform seizures. Exp. Neurol. 26, 571–585. doi:10.1016/0014-4886(70)90150-0
Florence, G., Dahlem, M. A., Almeida, A.-C. G., Bassani, J. W. M., and Kurths, J. (2009). The role of extracellular potassium dynamics in the different stages of ictal bursting and spreading depression: A computational study. J. Theor. Biol. 258, 219–228. doi:10.1016/j.jtbi.2009.01.032
Florence, G., Pereira, T., and Kurths, J. (2012). Extracellular potassium dynamics in the hyperexcitable state of the neuronal ictal activity. Commun. Nonlinear Sci. Numer. Simul. 17, 4700–4706. doi:10.1016/j.cnsns.2011.06.023
Frankenhaeuser, B., and Hodgkin, A. L. (1956). The after-effects of impulses in the giant nerve fibres of Loligo. J. Physiol. 131, 341–376. doi:10.1113/jphysiol.1956.sp005467
Fröhlich, F., Bazhenov, M., Iragui-Madoz, V., and Sejnowski, T. J. (2008a). Potassium dynamics in the epileptic cortex: New insights on an old topic. Neuroscientist 14, 422–433. doi:10.1177/1073858408317955
Fröhlich, F., Bazhenov, M., Timofeev, I., Steriade, M., and Sejnowski, T. J. (2006). Slow state transitions of sustained neural oscillations by activity-dependent modulation of intrinsic excitability. J. Neurosci. 26, 6153–6162. doi:10.1523/JNEUROSCI.5509-05.2006
Fröhlich, F., Timofeev, I., Sejnowski, T. J., and Bazhenov, M. (2008b). “26 - extracellular potassium dynamics and epileptogenesis,” in Computational neuroscience in epilepsy. Editors I. Soltesz, and K. Staley (San Diego: Academic Press), 419–439. doi:10.1016/B978-012373649-9.50029-6
Grisar, T., Guillaume, D., and Delgado-Escueta, A. V. (1992). Contribution of Na+,K(+)-ATPase to focal epilepsy: A brief review. Epilepsy Res. 12, 141–149. doi:10.1016/0920-1211(92)90034-q
Halnes, G., Østby, I., Pettersen, K. H., Omholt, S. W., and Einevoll, G. T. (2013). Electrodiffusive model for astrocytic and neuronal ion concentration dynamics. PLoS Comp. Biol. 9, e1003386. doi:10.1371/journal.pcbi.1003386
Hodgkin, A. L., and Huxley, A. F. (1952). A quantitative description of membrane current and its application to conduction and excitation in nerve. J. Physiol. 117, 500–544. doi:10.1113/jphysiol.1952.sp004764
Iadecola, C. (2017). The neurovascular unit coming of age. Neuron 180, 17–42. doi:10.1016/j.neuron.2017.07.030
Jensen, M. S., and Yaari, Y. (1997). Role of intrinsic burst firing, potassium accumulation, and electrical coupling in the elevated potassium model of hippocampal epilepsy. J. Neurophysiol. 77, 1224–1233. doi:10.1152/jn.1997.77.3.1224
Johnston, D., and Wu, S. M.-S. (1994). Foundations of cellular neurophysiology. 1st edn. Cambridge, Mass: A Bradford Book.
Kager, H., Wadman, W. J., and Somjen, G. G. (2002). Conditions for the triggering of spreading depression studied with computer simulations. J. Neurophysiol. 88, 2700–2712. doi:10.1152/jn.00237.2002
Kager, H., Wadman, W. J., and Somjen, G. G. (2007). Seizure-like afterdischarges simulated in a model neuron. J. Comput. Neurosci. 22, 105–128. doi:10.1007/s10827-006-0001-y
Kager, H., Wadman, W. J., and Somjen, G. G. (2000). Simulated seizures and spreading depression in a neuron model incorporating interstitial space and ion concentrations. J. Neurophysiol. 84, 495–512. doi:10.1152/jn.2000.84.1.495
Lauf, P. K., and Adragna, N. C. (2000). K-Cl cotransport: Properties and molecular mechanism. Cell. Physiol. Biochem. 10, 341–354. doi:10.1159/000016357
Lebovitz, R. M. (1996). Quantitative examination of dynamic interneuronal coupling via single-spike extracellular potassium ion transients. J. Theor. Biol. 180, 11–25. doi:10.1006/jtbi.1996.0074
Liu, L., Gao, H., Li, J., and Chen, S. (2023). Probing microdomain Ca2+ activity and synaptic transmission with a node-based tripartite synapse model. Front. Netw. Physiol. 3, 1111306. doi:10.3389/fnetp.2023.1111306
Lux, H. D., Heinemann, U., and Dietzel, I. (1986). Ionic changes and alterations in the size of the extracellular space during epileptic activity. Adv. Neurol. 44, 619–639.
Manninen, T., Acimovic, J., and Linne, M. L. (2023). Analysis of network models with neuron-astrocyte interactions. Neuroinformatics 21, 375–406. doi:10.1007/s12021-023-09622-w
McBain, C. J. (1994). Hippocampal inhibitory neuron activity in the elevated potassium model of epilepsy. J. Neurophysiol. 72, 2853–2863. doi:10.1152/jn.1994.72.6.2853
Naze, S., Bernard, C., and Jirsa, V. (2015). Computational modeling of seizure dynamics using coupled neuronal networks: Factors shaping epileptiform activity. PLoS Comp. Biol. 11, e1004209. doi:10.1371/journal.pcbi.1004209
Orkand, R. K., Nicholls, J. G., and Kuffler, S. W. (1966). Effect of nerve impulses on the membrane potential of glial cells in the central nervous system of amphibia. J. Neurophysiol. 29, 788–806. doi:10.1152/jn.1966.29.4.788
Oschmann, F., Berry, H., Obermayer, K., and Lenk, K. (2018). From in silico astrocyte cell models to neuron-astrocyte network models: A review. Brain Res. Bull. 136, 76–84. doi:10.1016/j.brainresbull.2017.01.027
Østby, I., Øyehaug, L., Einevoll, G. T., Nagelhus, E. A., Plahte, E., Zeuthen, T., et al. (2009). Astrocytic mechanisms explaining neural-activity-induced shrinkage of extraneuronal space. PLoS Comp. Biol. 5, e1000272. doi:10.1371/journal.pcbi.1000272
Øyehaug, L., Østby, I., Lloyd, C. M., Omholt, S. W., and Einevoll, G. T. (2012). Dependence of spontaneous neuronal firing and depolarisation block on astroglial membrane transport mechanisms. J. Comput. Neurosci. 32, 147–165. doi:10.1007/s10827-011-0345-9
Park, E.-H., and Durand, D. M. (2006). Role of potassium lateral diffusion in non-synaptic epilepsy: A computational study. J. Theor. Biol. 238, 666–682. doi:10.1016/j.jtbi.2005.06.015
Paulson, O. B., and Newman, E. A. (1987). Does the release of potassium from astrocyte endfeet regulate cerebral blood flow? Science 237, 896–898. doi:10.1126/science.3616619
Semyanov, A., and Verkhratsky, A. (2021). Astrocytic processes from tripartite synapses to the active milieu. Trends Neurosci. 44, 781–792. doi:10.1016/j.496tins.2021.07.006
Semyanov, A., and Verkhratsky, A. (2022). Inclusive brain from neuronal doctrine to the active milieu. Function (Oxf) 3 (2), zqab069. doi:10.1093/function/zqab069
Sibille, J., Dao Duc, K., Holcman, D., and Rouach, N. (2015). The neuroglial potassium cycle during neurotransmission: Role of Kir4.1 channels. PLoS Comp. Biol. 11, e1004137. doi:10.1371/journal.pcbi.1004137
Somjen, G. G. (2004). Ions in the brain: Normal function, seizures, and stroke. 1 edn. USA: Oxford University Press.
Ullah, G., and Schiff, S. J. (2010). Assimilating seizure dynamics. PLoS Comp. Biol. 6, e1000776. doi:10.1371/journal.pcbi.1000776
Ullah, G., Wei, Y., Dahlem, M. A., Wechselberger, M., and Schiff, S. J. (2015). The role of cell volume in the dynamics of seizure, spreading depression, and anoxic depolarization. PLoS Comp. Biol. 11, e1004414. doi:10.1371/journal.pcbi.1004414
Volman, V., Bazhenov, M., and Sejnowski, T. J. (2012). Computational models of neuron-astrocyte interaction in epilepsy. Front. Comput. Neurosci. 6, 58. doi:10.3389/fncom.2012.00058
Witthoft, A., Filosa, J. A., and Karniadakis, G. E. (2013). Potassium buffering in the neurovascular unit: Models and sensitivity analysis. Biophys. J. 105, 2046–2054. doi:10.1016/j.bpj.2013.09.012
Ziburkus, J., Cressman, J. R., Barreto, E., and Schiff, S. J. (2006). Interneuron and pyramidal cell interplay during in vitro seizure-like events. J. Neurophysiol. 95, 3948–3954. doi:10.1152/jn.01378.2005
Keywords: neuron–glia interplay, mathematical model, bursting, ion concentration dynamics, bifurcation analysis
Citation: Øyehaug L (2023) Slow ion concentration oscillations and multiple states in neuron–glia interaction—insights gained from reduced mathematical models. Front. Netw. Physiol. 3:1189118. doi: 10.3389/fnetp.2023.1189118
Received: 18 March 2023; Accepted: 28 April 2023;
Published: 22 May 2023.
Edited by:
Susanna Gordleeva, Lobachevsky State University of Nizhny Novgorod, RussiaReviewed by:
Dmitry E. Postnov, Saratov State University, RussiaMarko Gosak, University of Maribor, Slovenia
Copyright © 2023 Øyehaug. This is an open-access article distributed under the terms of the Creative Commons Attribution License (CC BY). The use, distribution or reproduction in other forums is permitted, provided the original author(s) and the copyright owner(s) are credited and that the original publication in this journal is cited, in accordance with accepted academic practice. No use, distribution or reproduction is permitted which does not comply with these terms.
*Correspondence: Leiv Øyehaug, bGVpdi5veWVoYXVnQG9zbG9tZXQubm8=