 Ioannis Schizas1†
 Sabrina Sullivan1†
 Scott Kerick1
 Korosh Mahmoodi1*
 J. Cortney Bradford1
 David L. Boothe1
 Piotr J. Franaszczuk1,2
 Paolo Grigolini3
 Bruce J. West3,4
- 1US Army Combat Capabilities Development Command, Army Research Laboratory, Adelphi, MD, United States
- 2Department of Neurology, Johns Hopkins University School of Medicine, Baltimore, MD, United States
- 3Center for Nonlinear Science, University of North Texas, Denton, TX, United States
- 4Office of Research and Innovation, North Carolina State University, Raleigh, NC, United States
Introduction: We present a theoretical foundation based on the spontaneous self-organized temporal criticality (SOTC) and multifractal dimensionality
Methods: We apply modified diffusion entropy analysis (MDEA) to assess multifractal dimensions of ON time series (ONTS), and complexity synchronization (CS) analysis to infer information transfer among ONs that are part of a network-of-organ-networks (NoONs). An automated parameter selection process is proposed that relies on the Kolmogorov-Smirnov statistic to properly choose stripe sizes which are crucial in the MDEA analysis using synthetic duration times derived from the Mittag-Leffler map, shows the strength of KS-based stripe size selection to track changes in the IPL parameter
Results: Results from processing these datasets show that the complexity of brain, heart, and lung ONTS co-vary over time during cognitive task performance in 44% of subjects, while complexity of brain-heart interactions significantly co-vary in 85% of subjects.
Discussion: We conclude that certain principles, guidelines, and strategies for the application of MDEA analysis need further consideration. We conclude with a summary of the MDEA’s limitations and future research directions.
1 Introduction
Dynamic interactions among brain, heart and lung organ-networks (ONs) may be considered a co-evolution of information exchange among multilayer, multifractal integrated ONs Bashan et al. (2012); Bartsch et al. (2015); Ivanov (2021); Mahmoodi et al. (2023a); Marzbanrad et al. (2020); West et al. (2023b); West (2024). Bashan et al. Bashan et al. (2012) introduced the concept of Network Physiology as a new integrative, system-wide approach to study the topology and dynamics of multiple physiological networks interacting simultaneously. Their seminal research showed dynamic changes in coupling strengths and topologies among multiple interacting networks as a function of state changes across sleep stages. Along these lines, we have been advancing the concept of complexity synchronization (CS), which enables flexibility and adaptability of the human organism as well as robustness at the interface of ever changing internal and external environment demands and contexts. Advancing theories and data processing methods are needed to better understand interactions among complex networks-of-organ-networks (NoONs) and to advance human-human and human-machine interaction technologies and interventions [e.g., see West et al. (2023a)]. Here, we base our analysis of neurophysiological ON-interactions on the theory of multifractal dimensionality and crucial events (CEs) emerging from spontaneous self-organized temporal criticality (SOTC) Mahmoodi et al. (2017), Mahmoodi et al. (2018). SOTC is a bottom-up process of cooperative interaction of components of a complex system (a NoON in the present context) by which spontaneous behavior of the whole emerges, and this research provides a conceptual/analytical framework for investigating such principles within complex systems (NoONs). CS is characterized by high-order synchrony among the varying inverse power law (IPL) scaling indices
The study of neurophysiological data has advanced significantly in recent years using Network Science in Medicine Ivanov et al. (2016), Ivanov and Bartsch (2014), West (2014) providing new insights into the complexity of information flow in physiological time series (PTS). Complexity synchronization analysis (CSA) Mahmoodi et al. (2023a), Mahmoodi et al. (2023b), West et al. (2023b) has become an important tool for understanding the detailed intercommunication within networks of organ-networks (ONs).
The present article examines the theoretical foundations and methodological approaches to CSA, offering a framework for understanding how different regions of the brain interact and coordinate with such ONs as the heart and lungs. By using sophisticated mathematical models of the statistics of crucial events (CE) through the technique of modified diffusion entropy analysis (MDEA), the authors aim to shed light on the dynamic processes that underpin CS, enhancing understanding of brain connectivity and its influence on PTS generated by ONs such as the heart and lungs.
West and Mudaliar (2025) have noted that the source of a PTS is the nested multiscale anatomical structure of the human body, suggesting that an ideal signal processing paradigm for a PTS should capture information flow among the body’s nested networks. The distinct material realities of information processing across the body’s ONs imply that even though the heart, brain, and lungs (HBL-triad) communicate with each other, their cells function differently, necessitating coordination among these diverse ONs.
One hypothesis proposed by John von Neumann, in an unfinished manuscript his wife published as a book a year after his death in 1957 von Neumann (1958), is that the information flow among the body’s physical networks occurs via two distinct languages supporting brain operation, sharing a primary language comprehensible across all scales. This primary language must have a preserved mathematical structure that governs information flow. Logically following through on this hypothesis ultimately reveals - from substantial empirical investigations - that the mathematical structure of this information flow is fundamentally fractal. A key result in support of the universal role of fractals in the body is that PTS corresponding to the individual ON signals from the HBL-triad have very distinct signal morphology, but their respective fractal properties converge to a shared signal morphology Mahmoodi et al. (2023a); West et al. (2023b).
Herein we use the HBL-triad of simultaneously generated and recorded datasets to support the hypothesis: All PTS are fractal unless signal analysis is used to explicitly prove otherwise. This hypothesis entails that the empirical statistics scale; they are given by CE time series and the scaling indices (
Recently, we applied MDEA to electroencephalographic (EEG), electrocardiographic (ECG), and respiratory (RESP) time series data simultaneously recorded during cognitive task performance Mahmoodi et al. (2023a); West et al. (2023b). Preliminary results showed that using this approach we observed synchronization of complexity scaling indices
For example, consideration must be given to experimental design, individual differences of subjects, task type and structure, recording duration, sampling rates of diverse time series data (biological, neural, physiological, behavioral), types and levels of preprocessing or decompositions of the different data types, artifact considerations, and missing data or discontinuities in recordings. Further, theoretical development and systematic testing of the MDEA algorithm (e.g., parameter tuning for the number of stripes, IPL fit region, and fit method) are required so that common principles and practical guidelines can be implemented to enable repeatability and generalizability of CS analyses.
Herein, we present principles and guidelines for CS analysis and report systematic testing and further development of the analyses based on MDEA combined with automated parameter selection applied to simulated as well as to empirical data (EEG, ECG, and RESP). Thus, the stated purpose of this paper is to advance the validation, standardization, and repeatability of MDEA for CS analysis. We also provide data and Matlab code to facilitate further refinements and to promote future research progress Github (2024).
1.1 Experiment design and task
Experiments are designed and specific tasks or paradigms are implemented to address specific research questions and hypotheses. Often, when testing new theories and analytical approaches, experiments have yet to be designed and conducted, while analyses can be applied to existing and simulated data in a preliminary stage to gain new insights and help better formulate there yet-to-be-done experiments. However, because the use of existing data comes with the limitation that the data do not originate from an experiment designed for the purposes of testing the current theories and analyses, there will invariably be challenges and limitations that must be taken into consideration. For example, in the present work, we are interested in communication among neural, physiological, and behavioral processes that interact in complex dynamic ways during cognitive task performance. We selected data from a recent neurofeedback study Kerick et al. (2023) because multiple sources of data (EEG, ECG, RESP, behavior) were simultaneously recorded from multiple subjects
1.2 Data considerations
Neurophysiological and behavioral data manifest stochastic and deterministic properties with varying degrees of stationary, quasi-stationary, and non-stationary segments and often exhibit periodic, aperiodic, and intermittent dynamics (see Figures 1, 2). It would seem that MDEA processed signals with recurring (ECG) or highly periodic (RESP) patterns that would identify differing sequences of independent events than with more stochastic signals (EEG). Events are defined as the transition of the time series across amplitude thresholds (see section MDEA below for more details). Events detected from such signals as ECG and RESP would likely result in highly correlated inter-event intervals generated from the analysis, whereas those from EEG would likely exhibit less correlation among events. This has yet to be empirically determined with real and simulated data, which we investigate here. Such features of heterogeneous time series present challenges for most methods of coupling or synchronization for signals of the same type (e.g., multi-channel EEG data) or of different types (e.g., brain-heart).
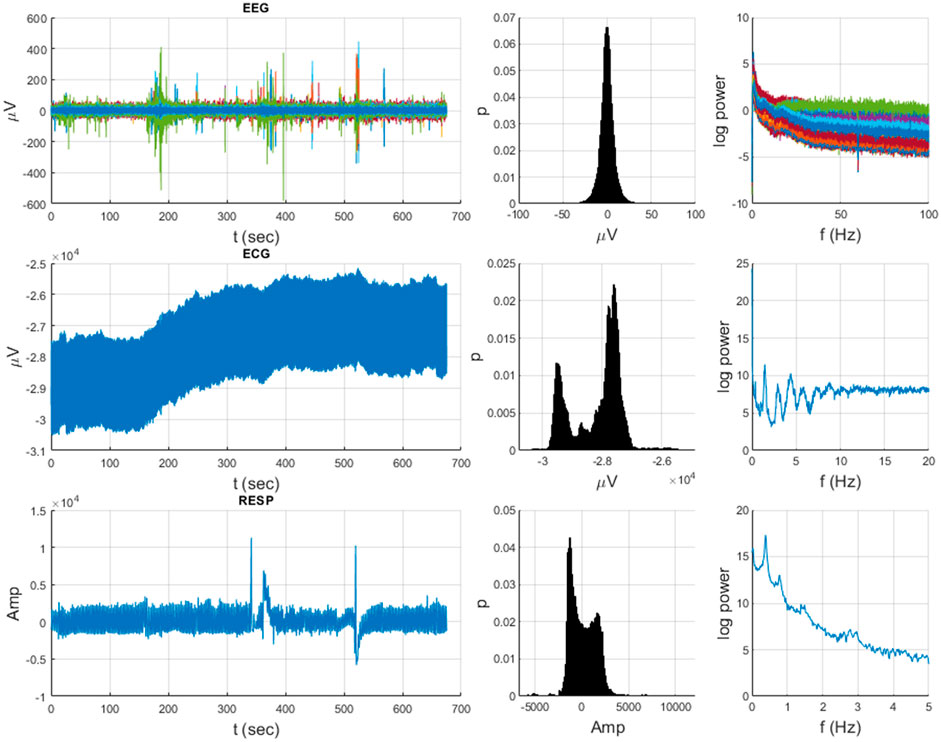
Figure 1. Heterogeneous neurophysiological data from an example subject over the 675-s duration of a Go-NoGo task (64-chan EEG, ECG, RESP) illustrating diverse temporal dynamics, distributions, and spectra.
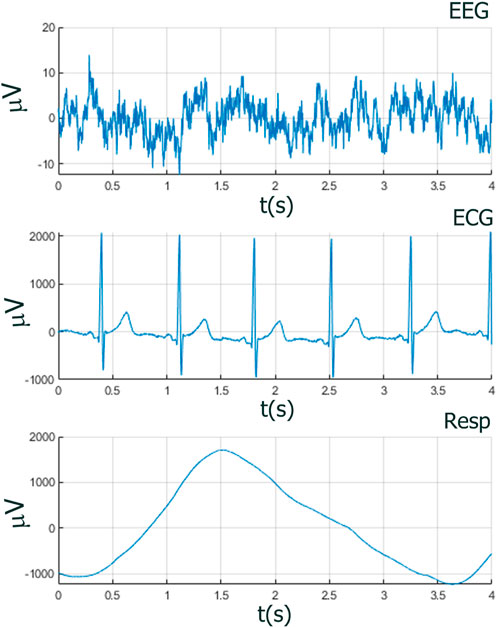
Figure 2. Amplitudes and temporal dynamics of EEG, ECG, and RESP within one breath cycle (4 s), showing the need of having a method to capture the different relevant features of each time series. In MDEA analysis, amplitudes of all time series are normalized to the interval [0,1], but the original amplitude and frequency scales are shown here to illustrate the different orders of magnitude scales of EEG with respect to ECG and RESP.
1.3 Sampling rates, data length, recording/window duration, and pre-processing
Sampling rates of time series data are governed by the Nyquist theorem Nyquist (1928), which states that periodic data must be sampled at twice the rate of the highest frequency component of the signal. Because we may not know the precise highest frequency, in practice, we use low pass filters to limit the frequency band, and we use a sampling rate four or more times the cutoff frequency of the filter to prevent any aliasing. Higher sampling rates may be beneficial for some analyses where time resolution is important but also may be detrimental for other analyses (e.g., auto-regressive) due to longer intervals of correlated samples. Depending on the particular signal and recording method there might be different optimal sampling rates. This is especially true for EEG data because higher frequencies (e.g.,
Table 1 records some of the interesting and more advanced approaches implemented in the literature for the investigation of coupling between the brain and the heart and/or the heart and lungs. We do not go into an in-depth review of these methods here, only to say that we believe our novel theory-driven approach based on CS derived from MDEA adds a significant contribution to this area of research. Future research would profit greatly by focusing on comparisons of various methods aimed at better understanding interactions among two or more complex systems (NoONs).
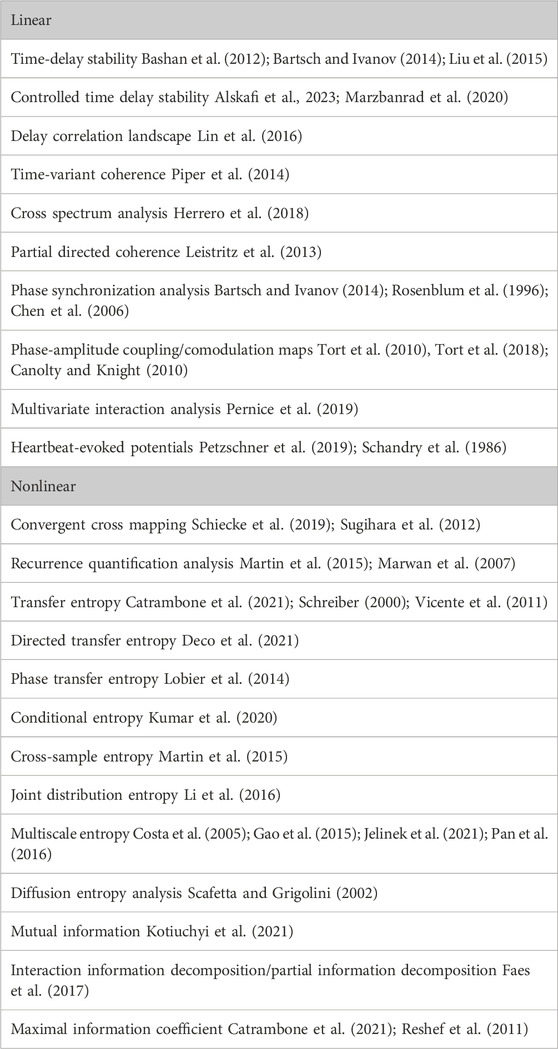
Table 1. Methods for Neurophysiological time series coupling analyses.
1.4 Filtering/resampling
Many strategies exist to decompose neurophysiological time series data into frequency bands, empirical modes, independent components, principal components, time-frequency atoms, power modes, etc., especially in EEG analysis. For ECG analysis, researchers predominantly study the RR time interval series or heart rate variability (HRV). As such, when asking the question of how complex time series of various origins interact, considerations as to what, if any, transformations or decompositions of the data may be appropriate, and if so, why. Further, various data transformations may render interpretation of the results more difficult and/or more extensive (e.g., analyses conducted across multiple frequency bands or signal components). For these reasons, we opt to preserve the original time series data with minimal pre-processing or decomposing (i.e., high-dimensionality is preserved, avoiding issues associated with decompositions or transformations) for our analyses of CS among EEG, ECG, and RESP. MDEA does not rely on particular oscillatory components, however, prominent oscillatory components may distort measurements of scaling of underlying IPL processes. Here, all data were originally sampled at 2048 Hz, which we then down-sampled to 512 Hz in our previous work Mahmoodi et al. (2023a); West et al. (2023b). EEG data were high-pass filtered at 1 Hz, while ECG and RESP were initially left unfiltered. Independent component analysis (ICA) was also applied to the EEG data to remove eye blinks and saccades, for further details see Kerick et al. (2023); artifacts of various types exist to various extents in most datasets, e.g., transient movement and muscle artifacts. In addition to the above considerations, it is important to also test window lengths used in the MDEA processing and window overlaps on the different time-series data.
1.5 Artifact-reduction/removal
Various types and levels of non-brain and non-physiological artifacts are common in studies during recordings while subjects perform various cognitive and behavioral tasks. These various artifacts can be of biological (eye movements and saccades, muscle activity, motion artifacts) or non-biological origin (e.g., 60 Hz line noise, loose electrodes or sensors) and may persist for extended time periods (seconds to minutes) or may be transient (milliseconds to seconds), and they may be localized or global (e.g., a few EEG recording electrodes or all recording electrodes). In event-related paradigms, where data are time-locked to stimuli or responses in short epochs (e.g., milliseconds to seconds), individual trial epochs contaminated by artifacts can be deleted, and then ensemble averaged over trials for analysis. However, for analyses applied to continuous recordings of long duration (minutes to hours), one must decide whether the available signal processing methods are suitable to minimize the artifacts, or whether data need to be cropped or cut from the continuous recordings, thus leaving discontinuities in the remaining dataset. In these cases, appropriate data simulations are necessary to incorporate so that known signals can be superimposed with known perturbations that simulate various types and levels of artifacts and discontinuities observed in empirical data. Future research is needed to test the effects of various EEG artifacts and mitigation strategies on MDEA and CS analysis.
1.6 Missing data/discontinuities
Because we are interested in the interactions among multiple NoONs over multiple time scales, missing data or data streams interrupted by task breaks or multiple recording sessions that limits the time scales across which the data can be analyzed [see Mahmoodi et al. (2023b) for such application to reaction time series data recorded over multiple sessions separated by several days]. In the datasets we analyze herein, we only consider continuous data over approximately 10–12 min task duration in a single session, and missing data and data discontinuities are not encountered.
2 Methods
2.1 Modified diffusion entropy analysis (MDEA)
Diffusion Entropy Analysis (DEA) is a processing method devised to detect temporal complexity in time series data Scafetta and Grigolini (2002). The method converts the time series into a diffusion trajectory based on the detection of events, defined as the transition of the time series from an amplitude threshold (0 if the time series is centered around the origin). The diffusion trajectory is the cumulative summation of the events assigned as 1. The scaling exponent
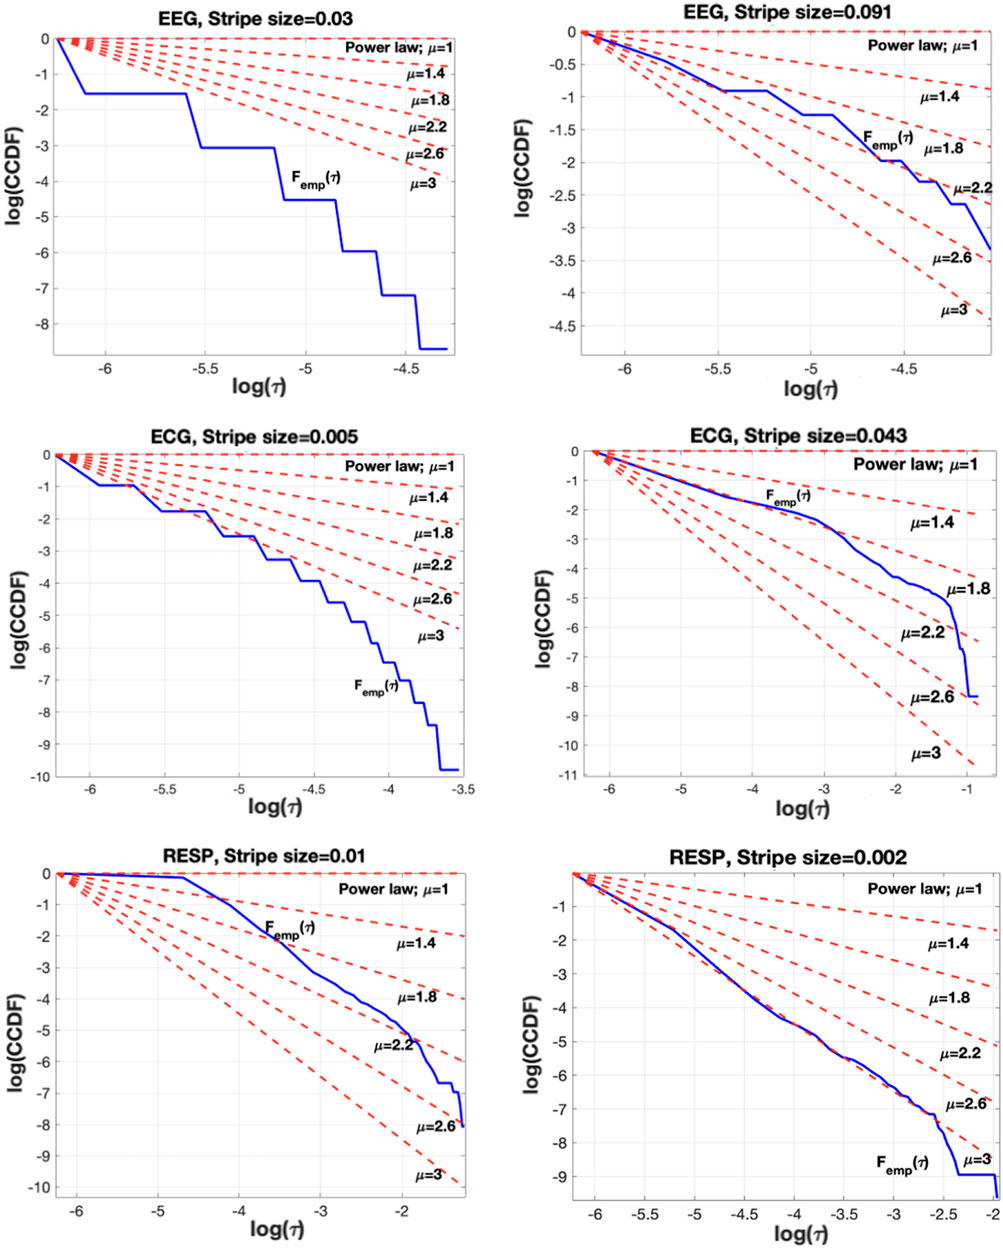
Figure 3. The impact of stripe size selection in the CE waiting-time PDF. Left column shows the no-IPL shape of the empirical waiting times PDF (blue curve) when the stripe size is not properly selected. Clearly, the blue curve corresponding to
2.2 Why does MDEA matter?
For most physiological and behavioral data, the distribution of parameters representing system dynamics is not Gaussian; instead, these distributions often follow an inverse power law (IPL) pattern with long tails. As a result, traditional measures such as mean or variance can misrepresent the characteristics of the system. For instance, in a given population, a small number of billionaires can dramatically inflate the average wealth, creating a misleading impression of a typical person’s wealth. Consequently, it is important to approach average- or variance-based metrics (e.g., detrended fluctuation analysis, DFA) with caution when analyzing complex data in medicine or other fields. Specifically, when analyzing the temporal behavior of a time series, if the IPL index of the CE waiting-time distribution lies within
2.3 How are parameters selected for MDEA?
As mentioned above, setting stripe sizes is akin to coarse graining, where broad stripe sizes capture large amplitude variations but may miss smaller fluctuations, and narrow stripe sizes detect smaller fluctuations but may also capture physiologically irrelevant noise. In selecting an optimal stripe size, it is necessary to balance the detection of crucial events against minimizing the capture of irrelevant noise. Related to this issue is determining sampling rates and window lengths of the different time series. For example, down-sampling RESP from 512 Hz to 4 Hz still accurately represents the oscillatory frequencies of respiration, but it presents an issue for MDEA analysis as it decreases the number of samples in any given window length, thereby negatively affecting the statistics underlying the analysis (e.g., a 30-s window of data sampled at 512 Hz yields 15,360 samples, while the same data sampled over the same duration at 4 Hz yields 120 samples). Hence, a pertinent question is what the optimal data length, sampling rate, and stripe size for MDEA analysis of vastly different time series should be and how do we determine optimal parameter values? How should data comprising orders of magnitude differences in time and frequency scales be analyzed with respect to how they interact over different time and frequency scales (e.g., EEG vs. RESP)?
Two crucial issues in the application of MDEA, particularly over large-scale datasets, are: 1) developing a rigorous method for determining how many stripes to implement and 2) determining the linear fitting interval of the diffusion entropy from which the slope of the plot of the SW entropy at a time denoted by window length
2.3.1 Automated stripe size parameter selection for physiological time-series
To address the aforementioned questions regarding how to optimize the choice of empirical parameters, we introduce an automated stripe-size selection method building on the property that CE time-intervals should follow an IPL PDF according to the physical model utilized by Mahmoodi et al. (2023a) according to Equation 1.
where
where
The stripe size selection can affect the PDF of the time-intervals between CEs. Figure 3 shows that if the stripe size is not properly selected, then the empirical distribution may not follow an IPL [Figure 3 (left)], while when properly set (details follow), it results in an empirical distribution closely fitted to an IPL PDF for a physiologically reasonable IPL index
We utilize the Kolmogorov-Smirnov (KS) statistic (Corder and Foreman, 2014) to quantify how well the CE time-intervals follow an IPL PDF for a given stripe size [see function Kolm
where
providing an estimate of the probability that the inter-arrival time variable
The minimization is performed by conducting a grid search for the optimal IPL parameter
To demonstrate the effectiveness of the proposed KS-based stripe size and
There are different well-known maps, such as the logistic map De Oliveira et al. (2013), the Manneville map Zumofen and Klafter (1993); Mahmoodi et al. (2020), and the Mittag-Leffler map Fulger et al. (2008), which generate a power-law distribution of duration times (or waiting times,
where
Figure 4 shows the mean (blue) and variance (red), averaged over 100 Monte Carlo independent trials of the KS-based (solid curves) and MDEA-based
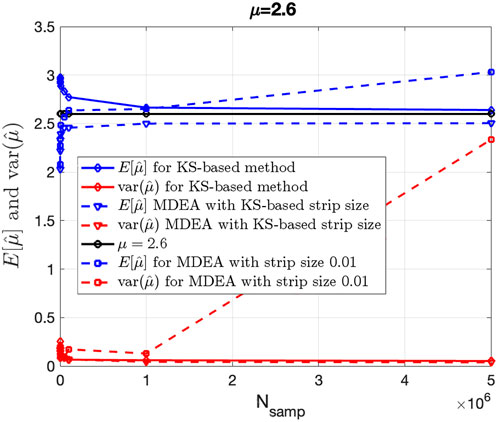
Figure 4. Bias and variance of KS-based and MDEA-based estimation of IPL parameter
Figure 5, using synthetic duration times derived from the Mittag-Leffler map, shows the strength of KS-based stripe size selection to track changes in the IPL parameter
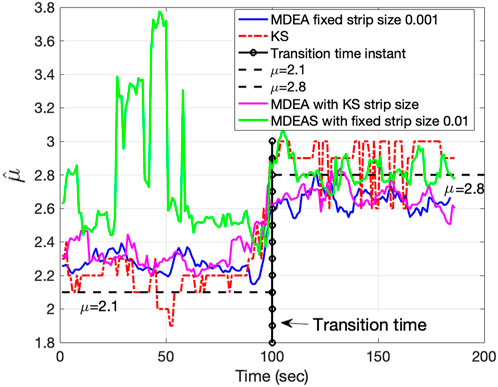
Figure 5. Tracking ability of IPL parameter
We estimated stripe sizes using the stripe-size search function Stripe
Figure 6 shows the distributions of stripe sizes obtained for each EEG channel and the ECG and RESP ONs (raw and filtered). Note the relatively narrow distribution of stripe sizes for the EEG and ECG data but sparse and highly variable stripe sizes for the raw RESP data. We chose to use the median stripe size derived for each subject (i.e., individualized parameter estimates), which worked well for EEG and ECG but not for the RESP data. Table 2 summarizes descriptive statistics of stripe size estimates over all subjects, task conditions, and moving windows.
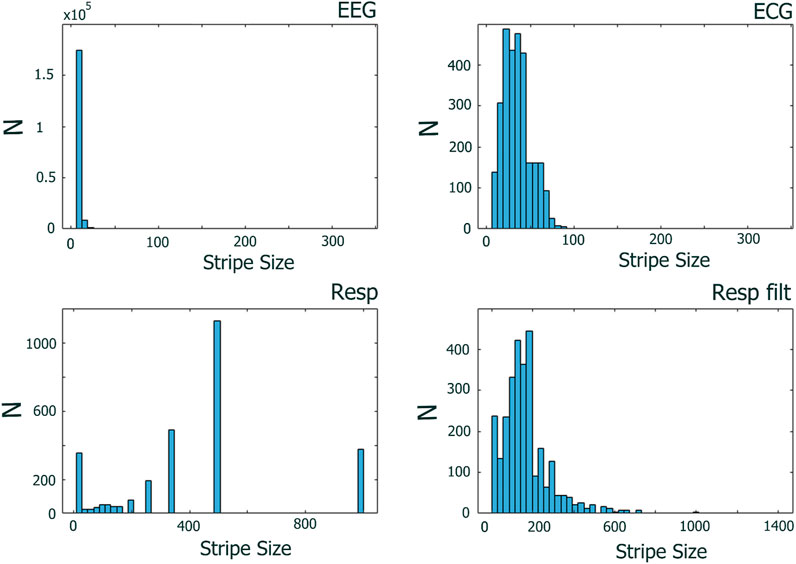
Figure 6. Distributions of stripe sizes determined across 30
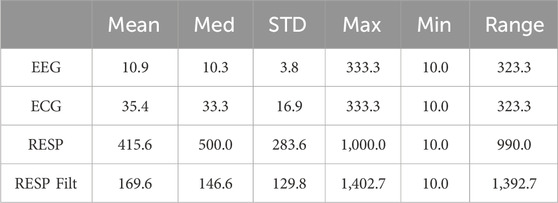
Table 2. Descriptive statistics of stripe size estimations across 190,938 distinct
For RESP data, we encounter a different issue affecting the MDEA analysis, namely, its highly periodic, deterministic characteristics. In extending our analyses to subjects beyond our original work (Mahmoodi et al., 2023a), we discovered contradictory results. Originally, we observed significant scaling synchronization among EEG, ECG, and RESP. However, in subsequent analyses while testing the generalizability of these findings to other subjects in the experiment, we observed that the scaling of the RESP time series does not systematically synchronize with the EEG and ECG scaling when stripe size and linear fit parameters are chosen algorithmically as described above. The highly oscillatory nature of the RESP time series consists of more deterministic characteristics and may pose an issue for MDEA as events detected are not randomly distributed, which is an assumption of the theory.
To address this situation, we reasoned that removing the highly periodic component of the RESP time series may improve the analysis. Consequently, we high-pass filtered the RESP signal at 2 Hz between approximately 0.25 and 0.75 Hz) (see Figure 7). The filter used was a Kaiser high-pass zero-phase finite impulse response filter of order 8192 whose frequency response is almost ideal, i.e., flat frequency response in the higher frequency range. The almost ideal high-pass behavior of the filter used allows the IPL spectra to be preserved above the filtered frequencies while suppressing the non-IPL components in the lower frequencies. Analyzing the filtered RESP time series improved the analysis since the IPL spectra was preserved (see Figures 9, 10 in the Results section), and the distributions of stripe sizes was more narrowly distributed (see Figure 6). Figure 8 shows a comparison of the
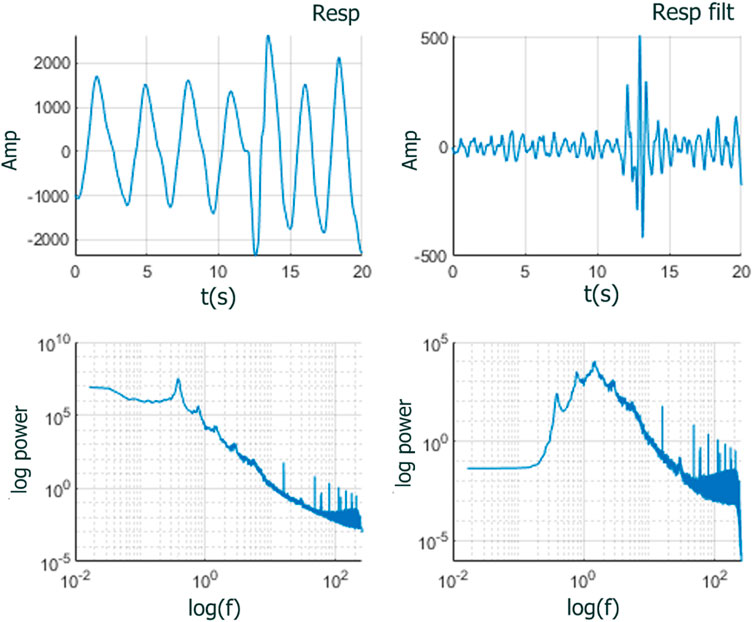
Figure 7. RESP time series zoomed to 20
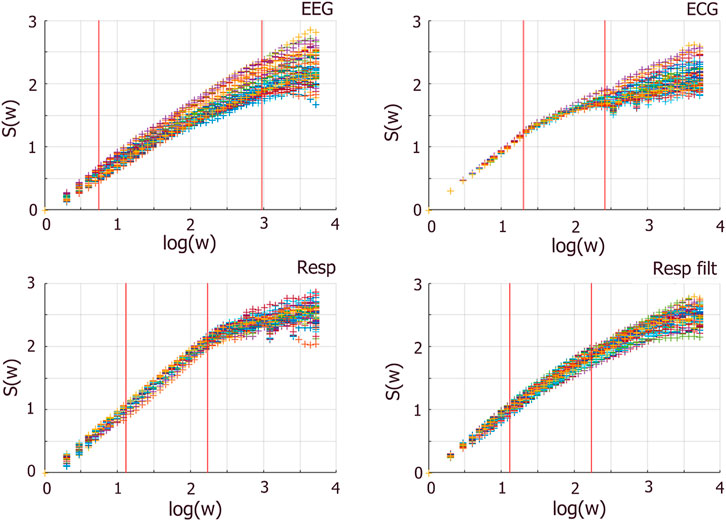
Figure 8. Entropy
2.3.2 Automated fit parameter region for estimating
To address the issue of automatically determining the linear fit region of the
A critical aspect is the adaptive adjustment of the threshold parameter, which originates from the ischange() function and determines the sensitivity of detecting these discontinuities. The adjustment is done in small increments to account for data variability and aims to detect the longest linear region that complies with and exceeds the minimum length requirement to calculate valid scaling indices. The
In some instances, distortions can manifest as nonlinear behavior at the onset of the
For ECG data, this methodology changes slightly. ECG data, characterized by its repetitive pattern, affects the linearity of entropy calculations, resulting in the identification of multiple scaling indices (short, intermediate, and long time scales). Specifically, in linear cases, there is typically one scaling index, while in nonlinear cases, two or three scaling indices are identified due to short-, intermediate-, and long-term correlations between the events. In Figure 8 (top right)
Just as with the stripe size selection parameter, the linear fit parameters are also determined as the median start and end points for the regression across all moving windows, so that all estimates for a given subject are constant across windows, although may be different across data types (EEG, ECG, RESP) within each subject.
3 Results
In Figure 9 we plot the complexity scaling indices
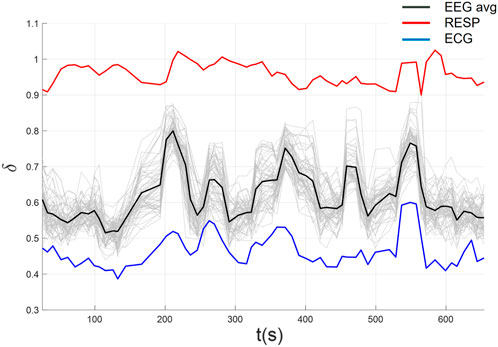
Figure 9. Complexity synchronization among EEG, ECG, and RESP using automated parameters selection.

Table 3. Correlations among scaling indices of the mean of 64 EEG channels, ECG, and unfiltered RESP (*p
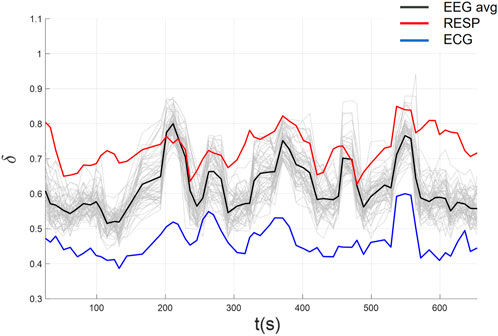
Figure 10. CS among EEG, ECG, and filtered RESP using automated parameters selection following high-pass filtering of the RESP time series.

Table 4. Correlations among scaling indices of the mean of 64 EEG channels, ECG, and high-pass filtered RESP (*p
Across all 54 datasets (27 subjects in each of 2 conditions), we found significant CS among EEG, ECG, and filtered Resp in 24 datasets (each pairwise correlation
For significant CS between the EEG and ECG, we found 46 of 54 datasets (23 in each Low and High time stress conditions) and only 8 which lacked significant CS between EEG and ECG (4 in Low and 4 in High time stress conditions). Further, 26 of 27 unique subjects exhibited significant CS in at least one condition, while 20 subjects exhibited significant CS in both Low and High time stress conditions.
For the CS between the EEG and filtered RESP, we found 32 of 54 datasets (17 in Low and 15 in High time stress conditions) with significant and 22 that lacked significant CS between EEG and filtered RESP. Further, 20 of 27 unique subjects exhibited significant CS in at least one condition, while 12 subjects exhibited significant CS in both Low and High time stress conditions.
For significant CS between the ECG and filtered RESP, we found 31 of 54 datasets (14 in Low and 17 in High time stress conditions) and 23 which lacked significant CS between ECG and filtered RESP. Further, 21 of 27 unique subjects exhibited significant CS in at least one condition, while 10 subjects exhibited significant CS in both Low and High time stress conditions.
Overall, these results indicate relatively higher CS between EEG and ECG (brain-heart coupling) than either EEG and RESP or ECG and RESP. In the (Supplementary Figures S2–S7), we provide representative examples from three additional subjects in each low and high time stress conditions. We plan to further investigate these differences across subjects and tasks to determine whether task performance is related to these outcomes or perhaps some other behavior (e.g., movement kinematics). We did conduct paired t-tests of the CS between EEG and ECG and observed no differences between Low and High time stress conditions (t = 1.1687, p = 0.2531). Two concerns that we have regarding reporting these results is (1) using a statistical measure (correlation coefficients) to run in another statistical test is not straightforward to interpret and (2) statistical power is limited with only 27 subjects. However, in Mahmoodi et al. (2023b), we showed that, using a novel modified DFA analysis, scaling of RT time series was significantly negatively correlated with errors of commission using the same data. As stated in the Introduction, the purpose of this paper was to advance the validation, standardization, and repeatability of MDEA for CS analysis; future research will need to be conducted on larger samples to investigate relations between CS and behavioral performance or cognitive states. Further, we are investigating the extent to which signal quality, pre-processing, or various decomposition approaches affect these results. We also intend to further investigate CS among all pairwise channels (64 EEG, ECG, and RESP) to determine whether certain channels or sub-networks of EEG deltas are specifically coupling more strongly amongst EEG channels, as well as with the ECG and RESP, beyond just the average of all EEG channels. We also intend to investigate other measures of coupling in CS beyond correlation, e.g., whether distance or topological differences influence CS within the brain.
4 Discussion and conclusion
The fractal nature of heterogeneous neurophysiological time series suggests the lack of any one frequency or scale dominating the dynamics of any physiologic process West (2006). Therefore, holistic theories and methods invoking multifractal dimensionality of vastly different neurophysiological and behavioral processes interacting in nonlinear dynamic ways offer new promising alternatives for better understanding communication among NoONs (complex systems). Herein we have attempted to advance the state of the art in objectifying and automating parameter selection for MDEA and its application to CS analysis. Two here-to-fore outstanding issues have been addressed and advanced in this work. objectively determining: 1) the stripe sizes and 2) the linear fit regions of the different ON time series in MDEA. This progress facilitates both our research and that of others in replicating and further testing as well as testing the theories and methods presented herein and enables the analyses to be conducted on large-scale datasets.
Communication among NoONs coexist via several forms of coupling simultaneously Bashan et al. (2012); Bartsch et al. (2015); Ivanov (2021). The form of coupling observed through CS is a new phenomenon which requires further advances in theory, modeling, and empirical research-analyses. Comparisons with other theories and methods is also needed (e.g., see Table 1) to better understand the principles and mechanisms through which heterogeneous but integrated ONs within NoONs interact to optimize human health and performance.
The nonlinear mutual interactions between human ONs and NoONs give rise to complex dynamics operating by the information gradient among them. This rather benign observation is, in fact, a profound result in that it is a statement of the physiologic system being driven by an information force and not a mechanical force. Social organization and physiological function are both driven by dynamic interactions among complex ONs, where ONs can mean organ-networks or organization-networks. In both contexts what is of importance is the manner in which information is shuttled back and forth between such non-physical networks and whether there exists a general principle that guides that flow of information in the same way that energy flow determines forces in physical networks. Such a principle has been identified and is discussed in a number of places, see e.g., West (2016). One consequence of the existence of this principle is a new kind of force; a force based on the relative complexity of the interacting networks producing an information gradient. This information force reduces to the entropic force in physical networks but in non-physical ONs results from gradients in the complexity of the phenomenon being studied. We think that this novel method will enable the study of the brain’s self-organization in real-time.
Findings observed herein need to be generalized to additional subjects in the experiment leveraged here, as well as to data from other diverse datasets, including those featuring simultaneously recorded time series and point processes from neural, physiological, behavioral, environmental, social, and biological systems. New experiments must also be designed to more specifically test theories and hypotheses and address outstanding research questions.
As we outlined in the Introduction, several factors, including experiment design, subjects, task and conditions, data features and characteristics, signal processing and analysis approaches, and missing and artifact-contaminated data considerations need to be further systematically tested and validated within the CS analysis framework. Future research is required to test the effects of various types and levels of EEG artifacts on MDEA scaling and CS analysis, as well as the effectiveness of various stages and levels of artifact reduction, including mitigation strategies. Additionally, further study of CS among multi-modal data of diverse nature and types, such as heart rate variability, gate cycles, kinematic, kinetic, and metabolic measurements, neuromuscular and ocular activity, and several behavioral measures that may be continuous or intermittent is also needed to better understand how CS relates to changes in task performance and cognitive-affect-state changes. Future research is also needed to test some of the assumptions of CE theory, such as the independence of
Data availability statement
The original contributions presented in the study are included in the article/Supplementary Material, further inquiries can be directed to the corresponding author.
Ethics statement
Ethical approval was not required for the study involving humans in accordance with the local legislation and institutional requirements. Written informed consent to participate in this study was not required from the participants or the participants’; legal guardians/next of kin in accordance with the national legislation and the institutional requirements. The data used for analysis in this manuscript were re-analyzed from a previous study which was granted approval by the ARL IRB (ARL 17-176).
Author contributions
IS: Formal Analysis, Investigation, Methodology, Software, Validation, Visualization, Writing – original draft, Writing – review and editing, Conceptualization. SS: Formal Analysis, Investigation, Methodology, Software, Validation, Writing – review and editing, Writing – original draft. SK: Conceptualization, Data curation, Formal Analysis, Investigation, Methodology, Project administration, Software, Supervision, Validation, Visualization, Writing – original draft, Writing – review and editing. KM: Conceptualization, Formal Analysis, Investigation, Methodology, Software, Supervision, Validation, Writing – original draft, Writing – review and editing, Visualization. JC: Investigation, Validation, Writing – review and editing. DB: Funding acquisition, Project administration, Resources, Writing – review and editing. PF: Supervision, Writing – review and editing, Conceptualization, Validation. PG: Supervision, Writing – review and editing, Conceptualization. BW: Supervision, Writing – review and editing, Conceptualization.
Funding
The author(s) declare that financial support was received for the research and/or publication of this article. This research was sponsored by the Army Research Laboratory and was accomplished under Cooperative Agreement Number W911NF-23-2-0162. The views and conclusions contained in this document are those of the authors and should not be interpreted as representing the official policies; either expressed or implied, of the Army Research Laboratory or the U.S. Government. The U.S. Government is authorized to reproduce and distribute reprints for Government purposes notwithstanding any copyright notation herein.
Acknowledgments
We acknowledge Herbert F. Jelinek, Sara A. Nasrat, Yawer Shah, Hamid Khajoei, and Jace Singh for their contributions in conceptual discussions, algorithm testing and development, and editorial comments on this manuscript.
Conflict of interest
The authors declare that the research was conducted in the absence of any commercial or financial relationships that could be construed as a potential conflict of interest.
Generative AI statement
The author(s) declare that no Generative AI was used in the creation of this manuscript.
Publisher’s note
All claims expressed in this article are solely those of the authors and do not necessarily represent those of their affiliated organizations, or those of the publisher, the editors and the reviewers. Any product that may be evaluated in this article, or claim that may be made by its manufacturer, is not guaranteed or endorsed by the publisher.
Supplementary material
The Supplementary Material for this article can be found online at: https://www.frontiersin.org/articles/10.3389/fnetp.2025.1570530/full#supplementary-material
References
Allegrini, P., Grigolini, P., Hamilton, P., Palatella, L., and Raffaelli, G. (2002). Memory beyond memory in heart beating, a sign of a healthy physiological condition. Phys. Rev. E 65, 041926. doi:10.1103/PhysRevE.65.041926
Alskafi, F. A., Khandoker, A. H., Marzbanrad, F., and Jelinek, H. F. (2023). “Eeg-based emotion recognition using sub-band time-delay correlations,” in 2023 45th annual international conference of the IEEE engineering in medicine and biology society (EMBC) (IEEE), 1–4.
Bartsch, R. P., and Ivanov, P. C. (2014). “Coexisting forms of coupling and phase-transitions in physiological networks,” in Nonlinear dynamics of electronic systems: 22nd international conference, NDES 2014, albena, Bulgaria, july 4-6, 2014. Proceedings 22 (Springer), 270–287.
Bartsch, R. P., Liu, K. K., Bashan, A., and Ivanov, P. C. (2015). Network physiology: how organ systems dynamically interact. PloS one 10, e0142143. doi:10.1371/journal.pone.0142143
Bashan, A., Bartsch, R. P., Kantelhardt, J. W., Havlin, S., and Ivanov, P. C. (2012). Network physiology reveals relations between network topology and physiological function. Nat. Commun. 3, 702. doi:10.1038/ncomms1705
Buongiorno Nardelli, M., Culbreth, G., and Fuentes, M. (2022). Towards a measure of harmonic complexity in western classical music. Adv. Complex Syst. 25, 2240008. doi:10.1142/s0219525922400082
Canolty, R. T., and Knight, R. T. (2010). The functional role of cross-frequency coupling. Trends cognitive Sci. 14, 506–515. doi:10.1016/j.tics.2010.09.001
Catrambone, V., Barbieri, R., Wendt, H., Abry, P., and Valenza, G. (2021). Functional brain–heart interplay extends to the multifractal domain. Philosophical Trans. R. Soc. A 379, 20200260. doi:10.1098/rsta.2020.0260
Chen, Z., Hu, K., Stanley, H. E., Novak, V., and Ivanov, P. C. (2006). Cross-correlation of instantaneous phase increments in pressure-flow fluctuations: applications to cerebral autoregulation. Phys. Rev. E—Statistical, Nonlinear, Soft Matter Phys. 73, 031915. doi:10.1103/PhysRevE.73.031915
Corder, G. W., and Foreman, D. I. (2014). Nonparametric statistics: a step-by-step approach. The city. Wiley.
Costa, M., Goldberger, A. L., and Peng, C.-K. (2005). Multiscale entropy analysis of biological signals. Phys. Rev. E—Statistical, Nonlinear, Soft Matter Phys. 71, 021906. doi:10.1103/PhysRevE.71.021906
Culbreth, G. (2021). Information and self-organization in complex networks. University of North Texas. Doctoral dissertation. Available online at: https://digital.library.unt.edu/explore/collections/UNTETD/
Deco, G., Vidaurre, D., and Kringelbach, M. (2021). Revisiting the global workspace orchestrating the hierarchical organization of the human brain. Nat. Hum. Behav. 5 (4), 497–511. doi:10.1038/s41562-020-01003-6
De Oliveira, J. A., Papesso, E. R., and Leonel, E. D. (2013). Relaxation to fixed points in the logistic and cubic maps: analytical and numerical investigation. Entropy 15, 4310–4318. doi:10.3390/e15104310
Faes, L., Marinazzo, D., and Stramaglia, S. (2017). Multiscale information decomposition: exact computation for multivariate Gaussian processes. Entropy 19, 408. doi:10.3390/e19080408
Fulger, D., Scalas, E., and Germano, G. (2008). Monte Carlo simulation of uncoupled continuous-time random walks yielding a stochastic solution of the space-time fractional diffusion equation. Phys. Rev. E—Statistical, Nonlinear, Soft Matter Phys. 77, 021122. doi:10.1103/PhysRevE.77.021122
Gao, J., Hu, J., Liu, F., and Cao, Y. (2015). Multiscale entropy analysis of biological signals: a fundamental bi-scaling law. Front. Comput. Neurosci. 9, 64. doi:10.3389/fncom.2015.00064
Github (2024). Available online at: https://github.com/yanniml/kolmogorov-smirnov-mdea.
Hardstone, R., Poil, S.-S., Schiavone, G., Jansen, R., Nikulin, V. V., Mansvelder, H. D., et al. (2012). Detrended fluctuation analysis: a scale-free view on neuronal oscillations. Front. physiology 3, 450. doi:10.3389/fphys.2012.00450
Herrero, J. L., Khuvis, S., Yeagle, E., Cerf, M., and Mehta, A. D. (2018). Breathing above the brain stem: volitional control and attentional modulation in humans. J. neurophysiology 119, 145–159. doi:10.1152/jn.00551.2017
[Dataset] Ivanov, P. C. (2021). The new field of network physiology: building the human physiolome. Front. Netw. Physiol. 1, 711778. doi:10.3389/fnetp.2021.711778
Ivanov, P. C., and Bartsch, R. P. (2014). “Network physiology: mapping interactions between networks of physiologic networks,” in Networks of Networks: the last Frontier of Complexity (Springer). 203–222.
Ivanov, P. C., Liu, K. K., and Bartsch, R. P. (2016). Focus on the emerging new fields of network physiology and network medicine. New J. Phys. 18, 100201. doi:10.1088/1367-2630/18/10/100201
Jelinek, H. F., Tuladhar, R., Culbreth, G., Bohara, G., Cornforth, D., West, B. J., et al. (2021). Diffusion entropy vs. Multiscale and rényi entropy to detect progression of autonomic neuropathy. Front. Physiology 11, 607324. doi:10.3389/fphys.2020.607324
Kerick, S. E., Asbee, J., Spangler, D. P., Brooks, J. B., Garcia, J. O., Parsons, T. D., et al. (2023). Neural and behavioral adaptations to frontal theta neurofeedback training: a proof of concept study. Plos one 18, e0283418. doi:10.1371/journal.pone.0283418
Kotiuchyi, I., Pernice, R., Popov, A., Kharytonov, V., and Faes, L. (2021). “Mutual information analysis of brain-heart interactions in epileptic children,” in 2021 signal processing symposium (SPSympo) (IEEE), 133–137.
Kozubowski, T. J., and Rachev, S. T. (1999). Univariate geometric stable laws. J. Comput. Analysis Appl. 1, 177–217. doi:10.1023/a:1022629726024
Kumar, M., Singh, D., and Deepak, K. (2020). Identifying heart-brain interactions during internally and externally operative attention using conditional entropy. Biomed. Signal Process. Control 57, 101826. doi:10.1016/j.bspc.2019.101826
Leistritz, L., Pester, B., Doering, A., Schiecke, K., Babiloni, F., Astolfi, L., et al. (2013). Time-variant partial directed coherence for analysing connectivity: a methodological study. Philosophical Trans. R. Soc. A Math. Phys. Eng. Sci. 371, 20110616. doi:10.1098/rsta.2011.0616
Li, P., Li, K., Liu, C., Zheng, D., Li, Z.-M., and Liu, C. (2016). Detection of coupling in short physiological series by a joint distribution entropy method. IEEE Trans. Biomed. Eng. 63, 2231–2242. doi:10.1109/TBME.2016.2515543
Lin, A., Liu, K. K., Bartsch, R. P., and Ivanov, P. C. (2016). Delay-correlation landscape reveals characteristic time delays of brain rhythms and heart interactions. Philosophical Trans. R. Soc. A Math. Phys. Eng. Sci. 374, 20150182. doi:10.1098/rsta.2015.0182
Liu, K. K., Bartsch, R. P., Ma, Q. D., and Ivanov, P. C. (2015). Major component analysis of dynamic networks of physiologic organ interactions. J. Phys. Conf. Ser. 640, 012013. doi:10.1088/1742-6596/640/1/012013
Lobier, M., Siebenhühner, F., Palva, S., and Palva, J. M. (2014). Phase transfer entropy: a novel phase-based measure for directed connectivity in networks coupled by oscillatory interactions. Neuroimage 85, 853–872. doi:10.1016/j.neuroimage.2013.08.056
Mahmoodi, K., Kerick, S. E., Grigolini, P., Franaszczuk, P. J., and West, B. J. (2023a). Complexity synchronization: a measure of interaction between the brain, heart and lungs. Sci. Rep. 13, 11433. doi:10.1038/s41598-023-38622-8
Mahmoodi, K., Kerick, S. E., Grigolini, P., Franaszczuk, P. J., and West, B. J. (2023b). Temporal complexity measure of reaction time series: operational versus event time. Brain Behav. 2023, e3069. doi:10.1002/brb3.3069
Mahmoodi, K., West, B. J., and Grigolini, P. (2017). Self-organizing complex networks: individual versus global rules. Front. physiology 8, 478. doi:10.3389/fphys.2017.00478
Mahmoodi, K., West, B. J., and Grigolini, P. (2018). Self-organized temporal criticality: bottom-up resilience versus top-down vulnerability. Complexity 2018, 8139058. doi:10.1155/2018/8139058
Mahmoodi, K., West, B. J., and Grigolini, P. (2020). Complex periodicity and synchronization. Front. Physiology 11, 563068. doi:10.3389/fphys.2020.563068
Martin, A., Guerrero-Mora, G., Dorantes-Méndez, G., Alba, A., Méndez, M. O., and Chouvarda, I. (2015). “Non-linear analysis of eeg and hrv signals during sleep,” in 2015 37th annual international conference of the IEEE engineering in medicine and biology society (EMBC) (IEEE), 4174–4177.
Marwan, N., Romano, M. C., Thiel, M., and Kurths, J. (2007). Recurrence plots for the analysis of complex systems. Phys. Rep. 438, 237–329. doi:10.1016/j.physrep.2006.11.001
Marzbanrad, F., Yaghmaie, N., and Jelinek, H. F. (2020). A framework to quantify controlled directed interactions in network physiology applied to cognitive function assessment. Sci. Rep. 10, 18505. doi:10.1038/s41598-020-75466-y
Nyquist, H. (1928). Certain topics in telegraph transmission theory. Trans. Am. Inst. Electr. Eng. 47, 617–644. doi:10.1109/t-aiee.1928.5055024
Pan, S., Han, T., Tan, A. C., and Lin, T. R. (2016). Fault diagnosis system of induction motors based on multiscale entropy and support vector machine with mutual information algorithm. Shock Vib. 2016, 1–12. doi:10.1155/2016/5836717
Pernice, R., Zanetti, M., Nollo, G., De Cecco, M., Busacca, A., and Faes, L. (2019). “Mutual information analysis of brain-body interactions during different levels of mental stress,” in 2019 41st annual international conference of the IEEE engineering in medicine and biology society (EMBC) (IEEE), 6176–6179.
Petzschner, F. H., Weber, L. A., Wellstein, K. V., Paolini, G., Do, C. T., and Stephan, K. E. (2019). Focus of attention modulates the heartbeat evoked potential. NeuroImage 186, 595–606. doi:10.1016/j.neuroimage.2018.11.037
Piper, D., Schiecke, K., Pester, B., Benninger, F., Feucht, M., and Witte, H. (2014). Time-variant coherence between heart rate variability and eeg activity in epileptic patients: an advanced coupling analysis between physiological networks. New J. Phys. 16, 115012. doi:10.1088/1367-2630/16/11/115012
Reshef, D. N., Reshef, Y. A., Finucane, H. K., Grossman, S. R., McVean, G., Turnbaugh, P. J., et al. (2011). Detecting novel associations in large data sets. science 334, 1518–1524. doi:10.1126/science.1205438
Rosenblum, M. G., Pikovsky, A. S., and Kurths, J. (1996). Phase synchronization of chaotic oscillators. Phys. Rev. Lett. 76, 1804–1807. doi:10.1103/PhysRevLett.76.1804
Scafetta, N., and Grigolini, P. (2002). Scaling detection in time series: diffusion entropy analysis. Phys. Rev. E 66, 036130. doi:10.1103/PhysRevE.66.036130
Schandry, R., Sparrer, B., and Weitkunat, R. (1986). From the heart to the brain: a study of heartbeat contingent scalp potentials. Int. J. Neurosci. 30, 261–275. doi:10.3109/00207458608985677
Schiecke, K., Schumann, A., Benninger, F., Feucht, M., Baer, K.-J., and Schlattmann, P. (2019). Brain–heart interactions considering complex physiological data: processing schemes for time-variant, frequency-dependent, topographical and statistical examination of directed interactions by convergent cross mapping. Physiol. Meas. 40, 114001. doi:10.1088/1361-6579/ab5050
Schreiber, T. (2000). Measuring information transfer. Phys. Rev. Lett. 85, 461–464. doi:10.1103/PhysRevLett.85.461
Sugihara, G., May, R., Ye, H., Hsieh, C.-h., Deyle, E., Fogarty, M., et al. (2012). Detecting causality in complex ecosystems. science 338, 496–500. doi:10.1126/science.1227079
Tort, A. B., Brankačk, J., and Draguhn, A. (2018). Respiration-entrained brain rhythms are global but often overlooked. Trends Neurosci. 41, 186–197. doi:10.1016/j.tins.2018.01.007
Tort, A. B., Komorowski, R., Eichenbaum, H., and Kopell, N. (2010). Measuring phase-amplitude coupling between neuronal oscillations of different frequencies. J. neurophysiology 104, 1195–1210. doi:10.1152/jn.00106.2010
Vicente, R., Wibral, M., Lindner, M., and Pipa, G. (2011). Transfer entropy—a model-free measure of effective connectivity for the neurosciences. J. Comput. Neurosci. 30, 45–67. doi:10.1007/s10827-010-0262-3
West, B. J. (2006). Where medicine went wrong: rediscovering the path to complexity, 11. World Scientific.
West, B. J. (2014). A mathematics for medicine: the network effect. Front. Physiology 5, 456. doi:10.3389/fphys.2014.00456
West, B. J. (2024). Complexity synchronization in living matter: a mini review. Front. Netw. Physiology 4, 1379892. doi:10.3389/fnetp.2024.1379892
West, B. J., Grigolini, P., and Bologna, M. (2023a). Crucial event rehabilitation therapy. Springer.
West, B. J., Grigolini, P., Kerick, S. E., Franaszczuk, P. J., and Mahmoodi, K. (2023b). Complexity synchronization of organ networks. Entropy 25, 1393. doi:10.3390/e25101393
West, B. J., and Mudaliar, S. (2025). Principles entailed by complexity, crucial events, and multifractal dimensionality. Entropy 27, 241. doi:10.3390/e27030241
Xiong, W., Faes, L., and Ivanov, P. C. (2017). Entropy measures, entropy estimators, and their performance in quantifying complex dynamics: effects of artifacts, nonstationarity, and long-range correlations. Phys. Rev. E 95, 062114. doi:10.1103/PhysRevE.95.062114
Keywords: network physiology, complexity synchronization, multifractality, EEG, ECG, respiration, modified diffusion entropy analysis
Citation: Schizas I, Sullivan S, Kerick S, Mahmoodi K, Cortney Bradford J, Boothe DL, Franaszczuk PJ, Grigolini P and West BJ (2025) Complexity synchronization analysis of neurophysiological data: Theory and methods. Front. Netw. Physiol. 5:1570530. doi: 10.3389/fnetp.2025.1570530
Received: 06 February 2025; Accepted: 22 April 2025;
Published: 14 May 2025.
Edited by:
Steffen Schulz, Charité – Universitätsmedizin Berlin, GermanyReviewed by:
Guadalupe Dorantes-Méndez, Autonomous University of San Luis Potosí, MexicoUlrich Parlitz, Max Planck Institute for Dynamics and Self-Organization, Germany
Stanislaw Drozdz, Polish Academy of Sciences, Poland
Copyright © 2025 Schizas, Sullivan, Kerick, Mahmoodi, Cortney Bradford, Boothe, Franaszczuk, Grigolini and West. This is an open-access article distributed under the terms of the Creative Commons Attribution License (CC BY). The use, distribution or reproduction in other forums is permitted, provided the original author(s) and the copyright owner(s) are credited and that the original publication in this journal is cited, in accordance with accepted academic practice. No use, distribution or reproduction is permitted which does not comply with these terms.
*Correspondence: Korosh Mahmoodi, a29yb3NobWFobW9vZGlAZ21haWwuY29t
†These authors have contributed equally to this work and share first authorship