 Kamil Taneja1
 Peiying Liu1Cuimei Xu1Monroe Turner2Yuguang Zhao2Dema Abdelkarim2
 Binu P. Thomas3
 Bart Rypma2,4
 Hanzhang Lu1,5,6*
- 1The Russel H. Morgan Department of Radiology, Johns Hopkins University School of Medicine, Baltimore, MD, United States
- 2School of Behavioral and Brain Sciences, University of Texas at Dallas, Richardson, TX, United States
- 3Advanced Imaging Research Center, University of Texas Southwestern Medical Center, Dallas, TX, United States
- 4Department of Psychiatry, University of Texas Southwestern Medical Center, Dallas, TX, United States
- 5F.M. Kirby Research Center for Functional Brain Imaging, Kennedy Krieger Institute, Baltimore, MD, United States
- 6Department of Biomedical Engineering, Johns Hopkins University School of Medicine, Baltimore, MD, United States
Purpose: Cerebrovascular reactivity (CVR) is an index of the dilatory function of cerebral blood vessels and has shown great promise in the diagnosis of risk factors in cerebrovascular disease. Aging is one such risk factor; thus, it is important to characterize age-related differences in CVR. CVR can be measured by BOLD MRI but few studies have measured quantitative cerebral blood flow (CBF)-based CVR in the context of aging. This study aims to determine the age effect on CVR using two quantitative CBF techniques, phase-contrast (PC), and arterial spin labeling (ASL) MRI.
Methods: In 49 participants (32 younger and 17 older), CVR was measured with PC, ASL, and BOLD MRI. These CVR methods were compared across young and older groups to determine their dependence on age. PC and ASL CVR were also studied for inter-correlation and mean differences. Gray and white matter CVR values were also studied.
Results: PC CVR was higher in younger participants than older participants (by 17%, p = 0.046). However, there were no age differences in ASL or BOLD CVR. ASL CVR was significantly correlated with PC CVR (p = 0.042) and BOLD CVR (p = 0.016), but its values were underestimated compared to PC CVR (p = 0.045). ASL CVR map revealed no difference between gray matter and white matter tissue types, whereas gray matter was significantly higher than white matter in the BOLD CVR map.
Conclusion: This study compared two quantitative CVR techniques in the context of brain aging and revealed that PC CVR is a more sensitive method for detection of age differences, despite the absence of spatial information. The ASL method showed a significant correlation with PC and BOLD, but it tends to underestimate CVR due to confounding factors associated with this technique. Importantly, our data suggest that there is not a difference in CBF-based CVR between the gray and white matter, in contrast to previous observation using BOLD MRI.
Introduction
Cerebrovascular reactivity (CVR) is an index of the dilatory function of cerebral blood vessels. This index has potential utility in arterial stenosis (1–3), stroke (4–6), neurodegenerative diseases (7–9), and normal aging (10–12). CVR can be measured by applying a vasodilatory challenge, such as CO2 (13), while recording hemodynamic parameters of the brain, and the change in the hemodynamic parameter per unit dilatory stimulus is quantified as CVR.
The vast majority of prior CVR studies have been based on the Blood-Oxygenation-Level-Dependent (BOLD) MRI signal (2, 10, 12–14), due to its straightforward pulse sequence, high sensitivity, high spatial, and temporal resolution (13). However, BOLD signal reflects a complex interplay between many physiological parameters such as cerebral blood flow (CBF), venous cerebral blood volume (vCBV), cerebral metabolic rate of oxygen (CMRO2), and hematocrit (Hct) (14), thus this signal is often considered as a semi-quantitative measure of brain hemodynamics and its interpretation is sometimes difficult (15–17).
CBF-based CVR is generally considered a more quantitative measure. This technique has a direct physiological meaning, thus is not dependent on magnetic field strength. Furthermore, such a measure can be compared across imaging modalities such as MRI (18), Positron Emission Tomography (PET) (19), Single Photon Emission Computed Tomography (SPECT) (20), ultrasound (21), and optical imaging (22). Two commonly used MRI approaches to measure CBF are arterial spin labeling (ASL) and phase-contrast (PC) MRI. ASL measures voxel-wise CBF by using labeled water protons as an endogenous tracer (18, 23, 24) and subtraction of label and control images yields a perfusion-weighted image, which can be used for quantification of CBF maps (25, 26). Two major limitations of ASL are that it suffers from low signal-to-noise ratio (SNR) and that there exist several confounding factors in its quantification such as bolus arrival time and labeling efficiency (27). These factors are known to vary with CO2 levels (28, 29).
PC MRI is a technique to measure blood flow via imaging of flow velocity in blood vessels (28, 30). This method can be used to measure global CBF through arterial vessels (e.g., internal carotid arteries) or venous vessels (e.g., superior sagittal sinus, SSS). PC MRI does not suffer from variables such as bolus arrival time or labeling efficiency, although it does not provide regional CBF information. CBF measurements from PC and ASL MRI under basal states have been compared previously (13, 27, 28).
The purpose of this study was to compare PC and ASL-based CVR in the context of normal aging. For completeness, BOLD-based CVR data were also collected. CVR was measured in younger (N = 32) and older (N = 17) participants with all three techniques to determine their sensitivity to age-related cerebrovascular decline. The correlation and magnitude between these CVR techniques were also studied. Basal CBF differences between the younger and older groups were examined using the normocapnic PC data.
Materials and Methods
Study Participants
Forty-nine participants (27 females, 22 males) were recruited at the University of Texas at Dallas (UTD) and Johns Hopkins University (JHU). The demographic and cognitive information of participants from both institutions is summarized in Table 1. The study was approved by the Institutional Review Boards of both institutions. Written informed consent in accordance with the Declaration of Helsinki was obtained before participants were enrolled in the study.
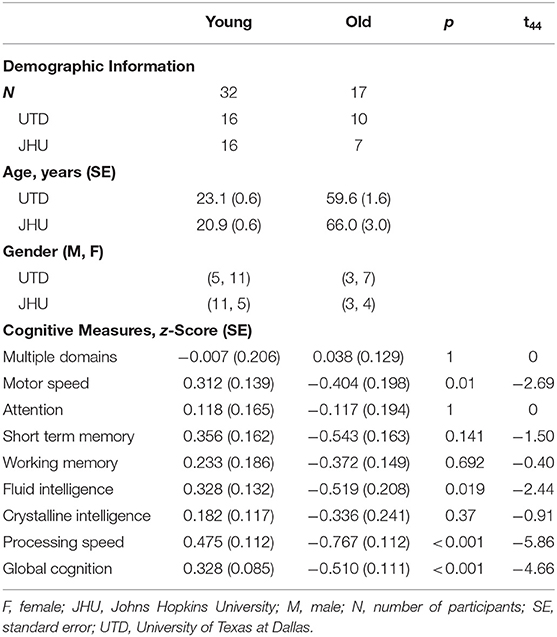
Table 1. Demographic and cognitive information for study participants.
Experimental Procedures
The MRI scans were performed on two 3T systems (Philips Healthcare, Best, The Netherlands). The two systems have the identical model number (Achieva with QUASAR gradient) and hardware configurations. A body coil was used for transmission and a 32-channel head coil was used for receiving. Before the subject entered the scanner, a nose clip and a mouth piece was attached on the subject to allow for control of inspired air, as detailed previously (31). Once the subject was inside the scanner, we performed MRI scans illustrated in Figure 1A. The scan session began with room air breathing. A PC-MRI was performed first followed by a dual-echo ASL/BOLD sequence for 10 min. At 4 min into the ASL/BOLD sequence (green line in Figure 1A), the inspired gas was switched to CO2-enriched gas mixture (5% CO2, 21% O2, and 74% N2) and the scan continued for another 6 min. The CO2 gas mixture was stored in a Douglas bag and delivered through a two-way non-rebreathing valve (Hans Rudolph, 2600 series, Shawnee, KS). A research assistant was in the MRI room to change the valve from room-air to 5% CO2 gas at the appropriate time. After the dual-echo ASL/BOLD sequence, a PC-MRI was performed in the hypercapnic state. End-tidal CO2 (EtCO2) was continuously measured through the duration of the experiment using a capnograph device (NM3 Respiratory Profile Monitor, Model 7900, Philips Healthcare, Wallingford, CT).
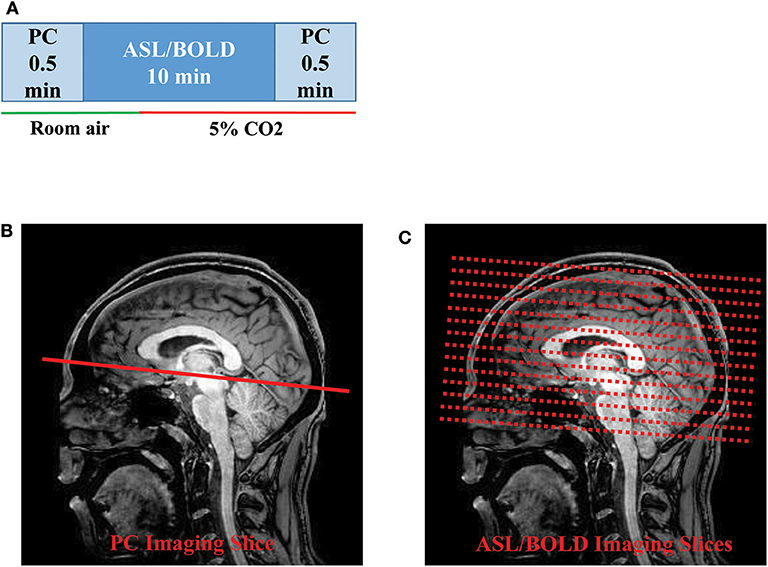
Figure 1. Illustration of the MRI scan procedures: (A) Timing of the PC and ASL/BOLD MRI scans during normocapnic and hypercapnic states. The timing of the gas switch is shown by the colored bars. The gas switch occurred 4 min into the ASL/BOLD scan. (B) Slice positioning of PC and (C) ASL/BOLD MRI. ASL, arterial spin labeling; BOLD, blood-oxygenation-level-dependent; PC, phase-contrast.
PC-MRI used the following parameters: field-of-view (FOV) = 230 × 230 mm2, matrix size = 320 × 192, slice thickness = 5 mm, repetition time (TR)/echo time (TE)/flip angle (FA) = 20 ms/7 ms/15°, velocity encoding (Venc) = 80 cm/s, scan duration= 30 s. The 2D PC imaging slice was positioned at 20 mm above sinus confluence with the imaging slice parallel to AC-PC line to measure flow through the SSS (Figure 1B). The dual-echo ASL sequence used the following parameters: pseudo-continuous ASL (pCASL) labeling, FOV = 220 × 220 × 126 mm3, matrix size = 64 × 64 × 22, slice thickness = 6 mm, TR/TE1/TE2/FA = 4,006 ms/13 ms/30 ms/90°, scan duration = 10 min (Figure 1C). The sequence was used to obtain simultaneous ASL (the TE1 data) and BOLD (the TE2 data) signals. Note, however, that these BOLD data are slightly different from the traditional BOLD-CVR data which are typically acquired in several CO2 breathing cycles with a shorter breathing period (13).
A T1-weighted magnetization-prepared rapid acquisition with gradient echo (MPRAGE) scan was performed for tissue segmentation. The MPRAGE sequence had the following parameters: TR of 8.1 ms, TE of 3.7 ms, a flip angle of 12°, a shot interval of 2,100 ms, an inversion time (TI) of 1,100 ms, with a voxel size of 1 × 1 × 1 mm3, 160 slices with a sagittal slice orientation.
Data Processing
Data analysis was performed using Statistical Parameter Mapping (SPM) (University College London, UK) and in-house MATLAB scripts (MathWorks, Natick, MA).
The dual-echo ASL scan yielded both ASL and BOLD data. The ASL (first echo) and BOLD (second echo) images were first preprocessed using a standard pipeline: motion correction by realignment (to the first dynamic) and spatial smoothing with a Gaussian filter with a full-width-at-half-maximum of 4 mm. A whole-brain (WB) mask was obtained by segmentation of the raw image and used to obtain a WB raw ASL and BOLD time course. The ASL label and control values were subtracted using a surround subtraction algorithm (32, 33) to obtain CBF-weighted time course (Figure 2A). The BOLD label and control values were averaged to cancel out the labeling effect (34), yielding a final BOLD time course (Figure 2A). Note that the dual-echo ASL scan lasted for 10 min with the switch from room air to CO2 gas taking place at 4 min into the scan. We averaged the data in the first 4 min as the room air values (ASLRA and BOLDRA) and the last 4 min as the hypercapnic values (ASLHC and BOLDHC) (Figure 2A). Data during the middle 2 min were not used for CVR calculation as physiology was not in a steady-state.
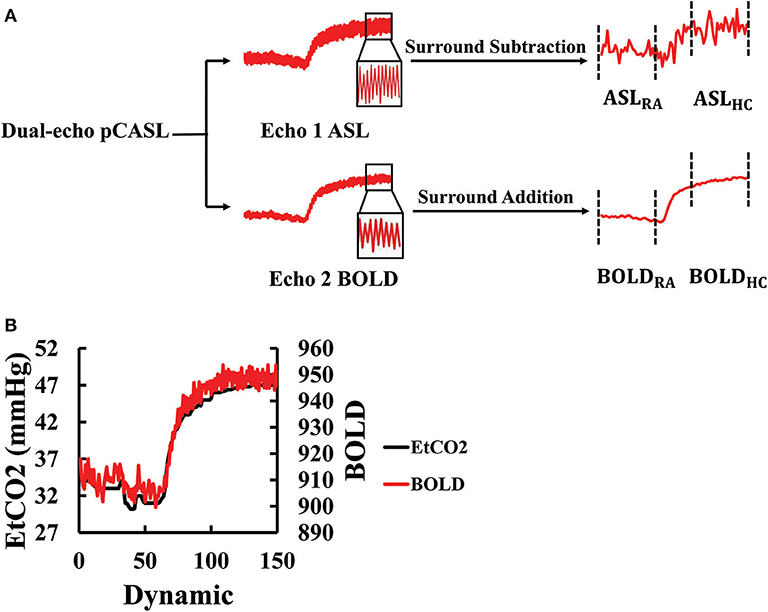
Figure 2. Processing of the dual-echo ASL/BOLD MRI data: (A) Flowchart of the ASL/BOLD data processing. The dual-echo data were first split into two echoes, the first corresponding to ASL and the second BOLD. The time courses of these raw data reveal high-frequency signal fluctuations in accordance with the control-label alternations. Subtraction and addition of the time courses result in the final ASL and BOLD time courses, respectively. The corresponding time periods were averaged to obtain room-air (RA) and hypercapnic (HC) signal values. (B) Illustration of the maximal alignment between EtCO2 and WB BOLD signal from a representative subject. The EtCO2 time course was shifted to find the best temporal match with the BOLD. ASL, arterial spin labeling; BOLD, blood-oxygen-level-dependent; EtCO2, end-tidal CO2; HC, hypercapnia; pCASL, pseudo-continuous arterial spin labeling; RA, room air; WB, whole-brain.
ASL and BOLD based CVR were then calculated with:
where EtCO2HC and EtCO2RA represent end-tidal CO2 values during the hypercapnia and room air MRI acquisition, respectively.
The EtCO2 values were extracted from the CO2 recording. To obtain EtCO2HC and EtCO2RA that are time-matched to the MRI data acquisitions, the EtCO2 time course was temporally aligned to the BOLD signal time course by computing cross-correlation (CC) between them at various time-shifts and finding the shift yielding the highest CC (Figure 2B). This process allows the correction of the time it takes for the CO2 to travel from the lungs to the brain (13). Once temporally aligned, the EtCO2 data points during the corresponding MRI scan were averaged to yield EtCO2 values room air and hypercapnia, which was used for the calculation of CVR in Equations (1) and (2).
In addition to WB CVR values, which include both gray matter (GM) and white matter (WM), we also separately examined GM and WM CVR. To create GM and WM masks, the T1-weighted MPRAGE image was skull-stripped and segmented using SPM12.
To calculate PC CVR, the flux at room air (FluxRA) and hypercapnia (FluxHC) were measured. Region-of-interests (ROIs) encompassing the SSS were manually drawn on complex difference images for both the room air and hypercapnia PC scans (Figure 3A). These ROIs were then overlaid onto the respective velocity maps, and flux was calculated by the multiplying the ROI area by the mean velocity in the ROI. PC CVR could then be calculated as:
where EtCO2PC, HC and EtCO2PC, RA represent averaged end-tidal CO2 values during hypercapnic and room air PC scan, respectively.
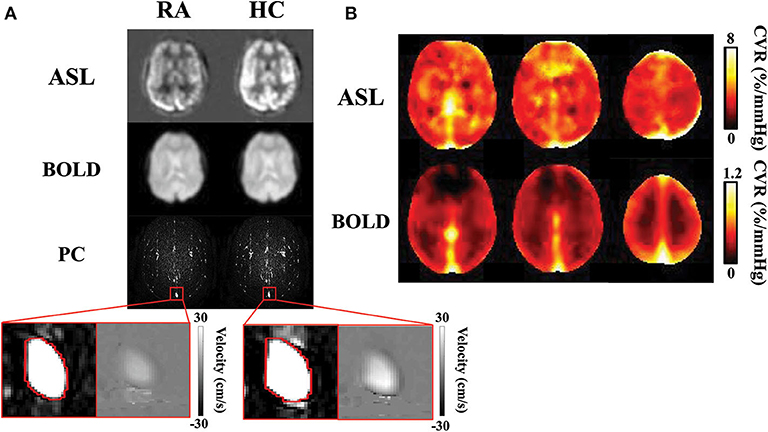
Figure 3. CVR results obtained with ASL, BOLD, and PC MRI data: (A) Normocapnic and hypercapnic ASL, BOLD, and PC images from a representative subject. For PC MRI, the complex difference images are shown, with a zoom-in version showing the complex difference and velocity map in the superior sagittal sinus. (B) Group-average ASL and BOLD CVR maps. Note that the ASL and BOLD CVR values have different ranges. ASL, arterial spin labeling; BOLD, blood-oxygen-level-dependent; CVR, cerebrovascular reactivity; HC, hypercapnia; PC, phase-contrast; RA, room air.
The PC MRI scan during room air breathing was also used to calculate basal CBF (ml/100 g/min):
where 0.46 represents the ratio between flow in the SSS and that in the whole-brain (35), brain volume was estimated by segmentation of the T1-MPRAGE image using MRIcloud (36). 1.06 is the mass density of brain tissue (37), and the number “100” allows the expression of CBF in “per 100 g tissue.”
Statistical Analysis
All CVR values are reported as mean ± standard error. CVR was compared across young and older groups with a linear regression analysis, after adjusting for sex and site. For comparison of CVR across MRI techniques, a Pearson correlation was computed. For within-subject comparison of tissue type effect and imaging method effect, a paired t-test was used. A p-value of 0.05 or less was considered significant.
Results
Figure 3A illustrates images of PC, ASL, and BOLD MR images during room air and hypercapnia breathing from a representative subject. Group-averaged ASL and BOLD-based CVR maps are shown in Figure 3B. Note that the ASL CVR map is noisier compared to the BOLD CVR map, consistent with a lower SNR of the ASL data. Importantly, the ASL CVR map shows an absence of GM-WM contrast. This is confirmed by region-of-interest analysis which showed that GM and WM CVR were not different in the ASL data (GM ASL CVR = 5.6 ± 0.3% /mmHg, WM ASL CVR = 5.1 ± 0.4 %/mmHg, p > 0.05, t48 = 1.9). This observation suggests that, even though GM contains more blood vessels (thereby higher basal perfusion) than WM, their vascular reactivities in terms of fractional changes in CBF are comparable. On the other hand, the BOLD CVR map shows a higher CVR in the GM than WM, due to the confounding factors (e.g., vCBV) in the BOLD signal (38). Accordingly, GM BOLD CVR was found to be significantly higher than WM BOLD CVR (GM = 0.33 ± 0.01 %/mmHg, WM = 0.19 ± 0.01 %/mmHg, p < 0.001, t48 = 15.1). Note that PC CVR is a global measure and does not produce a map.
Table 2 summarizes the age effect on the three CVR modalities. Only PC CVR demonstrates an age effect, where older participants (5.46 ± 0.32 %/mmHg) have a significantly lower PC CVR than younger participants (6.59 ± 0.41 %/mmHg, p = 0.046, t45 = −2.06). On the other hand, WB ASL CVR (young = 5.53 ± 0.37 %/mmHg, old = 5.03 ± 0.55 %/mmHg, p = 0.31, t45 = −1.03), GM ASL CVR (young = 5.74 ± 0.35 %/mmHg, old = 5.31± 0.6 %/mmHg, p = 0.35, t45 = −0.95), and WM ASL CVR (young = 5.27 ± 0.53 %/mmHg, old = 4.86 ± 0.58 %/mmHg, p = 0.52, t45 = −0.65) did not display a significant age effect. Similarly, WB BOLD CVR (young = 0.27 ± 0.01 %/mmHg, old= 0.28 ± 0.01 %/mmHg, p = 0.72, t45 = 0.37), GM BOLD CVR (young = 0.33 ± 0.01 %/mmHg, old = 0.33 ± 0.01 %/mmHg, p = 0.95, t45 = 0.07 ), and WM BOLD CVR (young = 0.19 ± 0.01 %/mmHg, old = 0.21 ± 0.02 %/mmHg, p = 0.29, t45 = 1.07) did not demonstrate a significant age effect.
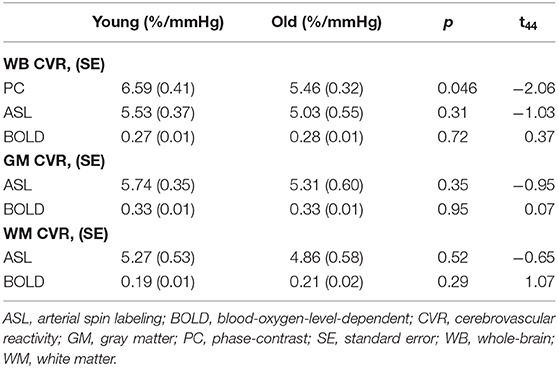
Table 2. CVR age differences.
Since both PC and ASL MRI measures CBF-based CVR, we compared whole-brain values between these two imaging methods. It was found that WB ASL CVR (5.37 ± 0.32 %/mmHg) was significantly lower than PC CVR (6.15 ± 0.30 %/mmHg, p = 0.045, t48 = 2.06), consistent with previous suggestions that confounding factors in ASL quantification (e.g., reduced labeling efficiency during hypercapnia) may result in a bias in CVR values when measured with ASL MRI.
We further studied the correlation between different CVR methods across participants. Figure 4 shows correlations between the different CVR measures. Despite different pulse sequences and different underlying physiological mechanisms, all three CVR methods showed a significant correlation (p < 0.05).
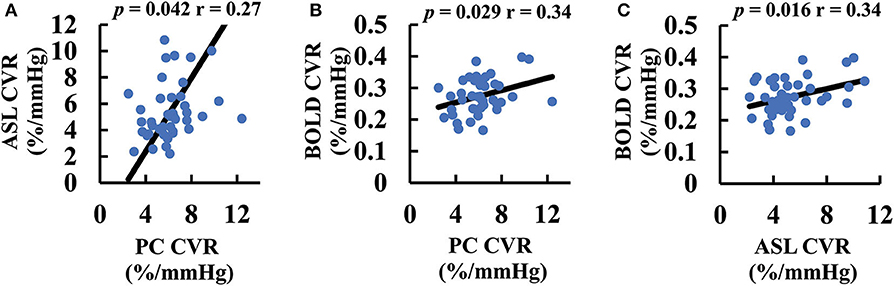
Figure 4. Scatter plots between CVR values measured with different MRI techniques: (A) ASL and PC CVR. (B) BOLD and PC CVR. (C) BOLD and ASL CVR. The black lines are the fitting curves. The p-values associated with their correlations are also shown. ASL, arterial spin labeling; BOLD, blood-oxygen-level-dependent; CVR, cerebrovascular reactivity; GM, gray matter; PC, phase-contrast; WB, whole-brain; WM, white-matter.
We also examined basal CBF, (i.e., CBF without hypercapnia challenge). We found that older subjects revealed a significantly lower CBF compared to the younger group (young = 68.2 ± 3.9 ml/100 g/min, old = 51.5 ± 3.5 ml/100 g/min, p = 0.0028, t44 = 3.17, Figure 5), consistent with previous reports (10, 38–40).
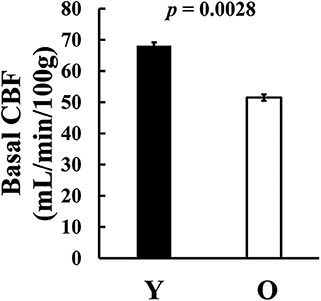
Figure 5. Basal CBF difference between age groups. CBF, cerebral blood flow; O, old; Y, young.
Discussion
CVR is known to be a sensitive marker in large vessel diseases, such as Moyamoya disease and stroke (1, 6, 41, 42), and small vessel diseases, such as vascular cognitive impairment (43, 44) and dementia (7, 45) and diabetes (46, 47). Because aging is a risk factor for many of these diseases, it is important to characterize age-related changes in CVR. Several studies have investigated this topic using BOLD signal as the readout for hemodynamic responses (10–12, 48). However, BOLD signal reflects a complex interplay between vCBV, CBF, and CMRO2, thus its quantitative interpretation is not trivial, both in terms of brain physiology (13, 14) and age-related physiological changes [e.g., (34)]. Furthermore, there is a non-linear relationship between blood CO2 content and BOLD signal change (49, 50). Therefore, a more direct and less complex measurement of brain hemodynamics is desirable to deliver more quantitative measurements of CVR. PC MRI and ASL MRI represent two of the most commonly used CBF techniques, both of which require no contrast agent and are suitable for dynamic measurements. ASL measures microscopic perfusion in a region-specific manner. However, ASL has a few disadvantages including lower SNR and its susceptibility to several confounding factors such as bolus arrival time (51) and labeling efficiency (28), which are known to change during hypercapnia. On the other hand, PC MRI measures macroscopic flow velocity in large vessels (e.g., superior sagittal sinus, internal carotid artery) and the pulse sequence is relatively straightforward with few confounding factors. However, this technique provides only a global measure and does not provide spatial information. Data from the present study suggested that, although lacking regional information, PC CVR was able to detect age-related decreases in CVR, which may be attributed to changes such as higher vessel stiffness, increased basement membrane thickness, reduced smooth muscle volume, and impaired astrocyte, or endothelial function (52, 53). It is worth noting that ASL CVR significantly underestimated CVR, presumably due to reduced labeling efficiency during the hypercapnic state (28, 54), and was unable to identify a significant age reduction. Therefore, for global assessment, PC CVR provides a sensitive and reliable measurement of cerebrovascular function. It should also be noted that PC MRI scan only takes 0.5 min for each state, thus is a rapid pulse sequence compared to ASL or BOLD MRI.
An interesting observation of the present study is that we showed, for the first time, a voxel-wise ASL CVR map, which revealed that GM and WM evince similar CVR. It is known that WM has substantially lower vessel density compared to the GM (55), often yielding substantially lower WM hemodynamic parameters than those in GM. This includes vCBV, CBF, and CMRO2 (39, 56–59). Previous studies of BOLD CVR have also shown a clear gray-white contrast, with GM having a higher CVR than WM (2, 10, 12–14). Our results suggest the hypothesis that this gray-white matter difference might be artifactual, due to the complexity of the physiology from which the BOLD signal arises. The results of the present study suggest that there is not a clear gray-white matter difference in ASL-CVR. Indeed, ROI results confirmed this finding, revealing equivalent CVR values in these two tissue types. This is physiologically plausible in that, although CO2 induced CBF change is lower in WM, its basal CBF is also lower. Thus, CVR based on fractional changes in CBF is actually similar between GM and WM.
Our conclusions are tempered by some limitations in this study. First, a step-breathing paradigm was used in the BOLD CVR scan instead of the more common block-cycle breathing paradigm. Step-breathing was used because the BOLD CVR data were collected simultaneously with the ASL CVR data. A potential problem with the step breathing paradigm is that it is not possible to correct any BOLD signal drifts due to gradient heating or electronic instabilities (60, 61). Thus, the lack of age effect might be partly attributed to the non-traditional BOLD paradigm used. Another possible reason for the lack of age difference in BOLD CVR is that, due to the nature of the pCASL sequence (e.g., long labeling duration, long post-labeling delay, and the need for one control and one labeled image), the BOLD data in the present study had a temporal resolution of 8 s, which is considerably longer than typical BOLD acquisition of <2 s. This may have reduced the sensitivity of the BOLD data and resulted in an absence of age effect. Another limitation is that the pCASL sequence used a multi-slice 2D EPI, rather than 3D GRASE or stack-of-spiral, acquisition. This is to allow T2* contrast to be preserved in the signal which is important for the BOLD signal. However, 3D acquisition would have yielded a higher SNR. A final limitation is that the data presented in this work were collected at two different sites, due to our study design. However, we note that the MRI scanners used at the two sites were identical in terms of hardware and software configurations and that the gas-inhalation apparatus was also identical (31).
Conclusion
This study compared two quantitative CVR techniques in the context of brain aging and revealed that PC CVR is a more sensitive method to detect age differences, despite a lack of spatial information. The ASL method showed a significant correlation with PC and BOLD, but it tends to underestimate CVR due to confounding factors associated with this technique. Importantly, our data suggest that there is not a difference in CBF-based CVR between GM and WM, in contrast to previous observation using BOLD MRI.
Data Availability Statement
The raw data supporting the conclusions of this article will be made available by the authors, without undue reservation.
Ethics Statement
The studies involving human participants were reviewed and approved by Johns Hopkins University IRB; UT Southwestern IRB. The patients/participants provided their written informed consent to participate in this study.
Author Contributions
BT and BR were involved with study design. CX, DA, and YZ were involved with data collection. HL was involved with study design and manuscript writing. KT was involved with data collection, data analysis, and manuscript writing. PL and MT were involved with study design and data collection. All authors commented on the manuscript, read, and approved the final version.
Funding
This work was supported by National Institutes of Health: R01 AG047972, R01 MH084021, R01 NS106711, R01 NS106702, P41 EB015909, and S10 OD021648.
Conflict of Interest
The authors declare that the research was conducted in the absence of any commercial or financial relationships that could be construed as a potential conflict of interest.
Acknowledgments
The authors are grateful to the MR technologists in the imaging centers for their assistance.
Abbreviations
ASL, arterial spin labeling; ASLRA, room air arterial spin labeling; ASLHC, room air arterial spin labeling; BOLD, blood-oxygen-level-dependent; BOLDRA, room air blood-oxygen-level-dependent; BOLDHC, hypercapnia blood-oxygen-level-dependent; CBF, cerebral blood flow; CC, cross correlation; CVR, cerebrovascular reactivity; EtCO2, end-tidal CO2; EtCO2ASL, RA, end-tidal CO2 during arterial spin labeling at room air; EtCO2ASL, HC, end-tidal CO2 during arterial spin labeling at hypercapnia; EtCO2PC, RA, end-tidal CO2 during phase-contrast at room air; EtCO2PC, HC, end-tidal CO2 during phase-contrast at hypercapnia; FA, flip angle; FluxRA, flux at room air; FluxHC, flux at hypercapnia; FOV, field-of-view; GM, gray matter; HC, hypercapnia; Hct, hematocrit; JHU, Johns Hopkins University; MPRAGE, magnetization-prepared rapid acquisition with gradient echo; PC, phase-contrast; pCASL, pseudo-continuous arterial spin labeling; PET, positron emission tomography; RA, room air; ROI, region-of-interest; SNR, signal-to-noise ratio; SPECT, single positron emission computed tomography; SPM, Statistical Parameter Mapping; SSS, superior sagittal sinus; TE, echo time; TI, inversion time; TR, repetition time; UTD, University of Texas at Dallas; vCBV, venous cerebral blood volume; Venc, velocity encoding; WB, whole-brain; WM, white matter.
References
1. Donahue MJ, Ayad M, Moore R, Van Osch M, Singer R, Clemmons P, et al. Relationships between hypercarbic reactivity, cerebral blood flow, and arterial circulation times in patients with moyamoya disease. J Magn Reson Imaging. (2013) 38:1129–39. doi: 10.1002/jmri.24070
2. Gupta A, Chazen JL, Hartman M, Delgado D, Anumula N, Shao H, et al. Cerebrovascular reserve and stroke risk in patients with carotid stenosis or occlusion: a systematic review and meta-analysis. Stroke. (2012) 43:2884–91. doi: 10.1161/STROKEAHA.112.663716
3. De Vis JB, Petersen ET, Bhogal A, Hartkamp NS, Klijn CJM, Kappelle LJ, et al. Calibrated MRI to evaluate cerebral hemodynamics in patients with an internal carotid artery occlusion. J Cereb Blood Flow Metab. (2015) 35:1015–23. doi: 10.1038/jcbfm.2015.14
4. Krainik A, Hund-Georgiadis M, Zysset S, Von Cramon DY. Regional impairment of cerebrovascular reactivity and BOLD signal in adults after stroke. Stroke. (2005) 36:1146–52. doi: 10.1161/01.STR.0000166178.40973.a7
5. Geranmayeh F, Wise RJS, Leech R, Murphy K. Measuring vascular reactivity with breath-holds after stroke: a method to aid interpretation of group-level BOLD signal changes in longitudinal fMRI studies. Hum Brain Mapp. (2015) 36:1755–71. doi: 10.1002/hbm.22735
6. Taneja K, Lu H, Welch BG, Thomas BP, Pinho M, Lin D, et al. Evaluation of cerebrovascular reserve in patients with cerebrovascular diseases using resting-state MRI: a feasibility study. Magn Reson Imaging. (2019) 59:46–52. doi: 10.1016/j.mri.2019.03.003
7. Yezhuvath US, Uh J, Cheng Y, Martin-Cook K, Weiner M, Diaz-Arrastia R, et al. Forebrain-dominant deficit in cerebrovascular reactivity in Alzheimer's disease. Neurobiol Aging. (2012) 33:75–82. doi: 10.1016/j.neurobiolaging.2010.02.005
8. Glodzik L, Randall C, Rusinek H, De Leon MJ. Cerebrovascular reactivity to carbon dioxide in Alzheimer's disease. J Alzheimer's Dis. (2013) 35:427–40. doi: 10.3233/JAD-122011
9. Marshall O, Lu H, Brisset JC, Xu F, Liu P, Herbert J, et al. Impaired cerebrovascular reactivity in multiple sclerosis. JAMA Neurol. (2014) 71:1275–81. doi: 10.1001/jamaneurol.2014.1668
10. Lu H, Xu F, Rodrigue KM, Kennedy KM, Cheng Y, Flicker B, et al. Alterations in cerebral metabolic rate and blood supply across the adult lifespan. Cereb Cortex. (2011) 21:1426–34. doi: 10.1093/cercor/bhq224
11. Gauthier CJ, Madjar C, Desjardins-Crépeau L, Bellec P, Bherer L, Hoge RD. Age dependence of hemodynamic response characteristics in human functional magnetic resonance imaging. Neurobiol Aging. (2013) 34:1469–85. doi: 10.1016/j.neurobiolaging.2012.11.002
12. De Vis JB, Hendrikse J, Bhogal A, Adams A, Kappelle LJ, Petersen ET. Age-related changes in brain hemodynamics; A calibrated MRI study. Hum Brain Mapp. (2015) 36:3973–87. doi: 10.1002/hbm.22891
13. Liu P, De Vis JB, Lu H. Cerebrovascular reactivity (CVR) MRI with CO2 challenge: a technical review. Neuroimage. (2019) 187:104–15. doi: 10.1016/j.neuroimage.2018.03.047
14. Chen JJ. Functional MRI of brain physiology in aging and neurodegenerative diseases. Neuroimage. (2019) 187:209–25. doi: 10.1016/j.neuroimage.2018.05.050
15. Lythgoe DJ, Williams SCR, Cullinane M, Markus HS. Mapping of cerebrovascular reactivity using bold magnetic resonance imaging. Magn Reson Imaging. (1999) 17:495–502. doi: 10.1016/S0730-725X(98)00211-2
16. Blockley NP, Driver ID, Francis ST, Fisher JA, Gowland PA. An improved method for acquiring cerebrovascular reactivity maps. Magn Reson Med. (2011) 65:1278–86. doi: 10.1002/mrm.22719
17. Thomas BP, Liu P, Aslan S, King KS, van Osch MJP, Lu H. Physiologic underpinnings of negative BOLD cerebrovascular reactivity in brain ventricles. Neuroimage. (2013) 83:505–12. doi: 10.1016/j.neuroimage.2013.07.005
18. Williams DS, Detre JA, Leigh JS, Koretsky AP. Magnetic resonance imaging of perfusion using spin inversion of arterial water. Proc Natl Acad Sci USA. (1992) 89:212–6. doi: 10.1073/pnas.89.1.212
19. Ye FQ, Berman KF, Ellmore T, Esposito G, Van Horn JD, Yang Y, et al. H215O PET validation of steady-state arterial spin tagging cerebral blood flow measurements in humans. Magn Reson Med. (2000) 44:450–6. doi: 10.1002/1522-2594(200009)44:3<450::AID-MRM16>3.0.CO;2-0
20. Knutsson L, Börjesson S, Larsson EM, Risberg J, Gustafson L, Passant U, et al. Absolute quantification of cerebral blood flow in normal volunteers: correlation between Xe-133 SPECT and dynamic susceptibility contrast MRI. J Magn Reson Imaging. (2007) 26:913–20. doi: 10.1002/jmri.21093
21. Sorond FAS, Hollenberg NK, Panych LP, Fisher NDL. Brain blood flow and velocity; Correlations between magnetic resonance imaging and transcranial doppler sonography. J Ultrasound Med. (2010) 29:1017–22. doi: 10.7863/jum.2010.29.7.1017
22. Devor A, SakadŽić S, Srinivasan VJ, Yaseen MA, Nizar K, Saisan PA, et al. Frontiers in optical imaging of cerebral blood flow and metabolism. J Cereb Blood Flow Metab. (2012) 32:1259–76. doi: 10.1038/jcbfm.2011.195
23. Detre JA, Leigh JS, Williams DS, Koretsky AP. Perfusion imaging. Magn Reson Med. (1992) 23:37–45. doi: 10.1002/mrm.1910230106
24. Zhang W, Williams DS, Detre JA, Koretsky AP. Measurement of brain perfusion by volume-localized NMR spectroscopy using inversion of arterial water spins: accounting for transit time and cross-relaxation. Magn Reson Med. (1992) 25:362–71. doi: 10.1002/mrm.1910250216
25. Alsop DC, Detre JA. Reduced transit-time sensitivity in noninvasive magnetic resonance imaging of human cerebral blood flow. J Cereb Blood Flow Metab. (1996) 16:1236–49. doi: 10.1097/00004647-199611000-00019
26. Detre JA, Zhang W, Roberts DA, Silva AC, Williams DS, Grandis DJ, et al. Tissue specific perfusion imaging using arterial spin labeling. NMR Biomed. (1994) 7:75–82. doi: 10.1002/nbm.1940070112
27. Dolui S, Wang Z, Wang DJJ, Mattay R, Finkel M, Elliott M, et al. Comparison of non-invasive MRI measurements of cerebral blood flow in a large multisite cohort. J Cereb Blood Flow Metab. (2016) 36:1244–56. doi: 10.1177/0271678X16646124
28. Aslan S, Xu F, Wang PL, Uh J, Yezhuvath US, Van Osch M, et al. Estimation of labeling efficiency in pseudocontinuous arterial spin labeling. Magn Reson Med. (2010) 63:765–71. doi: 10.1002/mrm.22245
29. Ho YCL, Petersen ET, Zimine I, Golay X. Similarities and differences in arterial responses to hypercapnia and visual stimulation. J Cereb Blood Flow Metab. (2011) 31:560–71. doi: 10.1038/jcbfm.2010.126
30. Spilt A, Frieke MA, Van Der Geest RJ, Reiber JHC, Kunz P, Kamper AM, et al. Reproducibility of total cerebral blood flow measurements using phase contrast magnetic resonance imaging. J Magn Reson Imaging. (2002) 16:1–5. doi: 10.1002/jmri.10133
31. Lu H, Liu P, Yezhuvath U, Cheng Y, Marshall O, Ge Y. MRI mapping of cerebrovascular reactivity via gas inhalation challenges. J Vis Exp. (2014) 52306. doi: 10.3791/52306
32. Liu TT, Wong EC. A signal processing model for arterial spin labeling functional MRI. Neuroimage. (2005) 24:207–15. doi: 10.1016/j.neuroimage.2004.09.047
33. Lu H, Donahue MJ, Van Zijl PCM. Detrimental effects of BOLD signal in arterial spin labeling fMRI at high field strength. Magn Reson Med. (2006) 56:546–52. doi: 10.1002/mrm.20976
34. Hutchison JL, Lu H, Rypma B. Neural mechanisms of age-related slowing: the ΔCBF/ΔCMRO 2 ratio mediates age-differences in BOLD signal and human performance. Cereb Cortex. (2013) 23:2337–46. doi: 10.1093/cercor/bhs233
35. De Vis JB, Lu H, Ravi H, Hendrikse J, Liu P. Spatial distribution of flow and oxygenation in the cerebral venous drainage system. J Magn Reson Imaging. (2018) 47:1091–6. doi: 10.1002/jmri.25833
36. Mori S, Wu D, Ceritoglu C, Li Y, Kolasny A, Vaillant MA, et al. MRICloud: delivering high-throughput MRI neuroinformatics as cloud-based software as a service. Comput Sci Eng. (2016) 18:21–35. doi: 10.1109/MCSE.2016.93
37. Herscovitch P, Raichle ME. What is the correct value for the brain-blood partition coefficient for water? J Cereb Blood Flow Metab. (1985) 5:65–9. doi: 10.1038/jcbfm.1985.9
38. Thomas BP, Liu P, Park DC, Van Osch MJP, Lu H. Cerebrovascular reactivity in the brain white matter: magnitude, temporal characteristics, and age effects. J Cereb Blood Flow Metab. (2014) 34:242–7. doi: 10.1038/jcbfm.2013.194
39. Leenders KL, Perani D, Lammertsma AA, Heather JD, Buckingham P, Jones T, et al. Cerebral blood flow, blood volume and oxygen utilization: normal values and effect of age. Brain. (1990) 113:27–47. doi: 10.1093/brain/113.1.27
40. Iadecola C, Park L, Capone C. Threats to the mind: aging, amyloid, and hypertension. Stroke. (2009) 40:S40–4. doi: 10.1161/STROKEAHA.108.533638
41. Liu P, Li Y, Pinho M, Park DC, Welch BG, Lu H. Cerebrovascular reactivity mapping without gas challenges. Neuroimage. (2017) 146:320–6. doi: 10.1016/j.neuroimage.2016.11.054
42. Mandell DM, Matouk CC, Farb RI, Krings T, Agid R, Terbrugge K, et al. Vessel wall MRI to differentiate between reversible cerebral vasoconstriction syndrome and central nervous system vasculitis: preliminary results. Stroke. (2012) 43:860–2. doi: 10.1161/STROKEAHA.111.626184
43. Sorond FA, Galica A, Serrador JM, Kiely DK, Iloputaife I, Cupples LA, et al. Cerebrovascular hemodynamics, gait, and falls in an elderly population: MOBILIZE Boston study. Neurology. (2010) 74:1627–33. doi: 10.1212/WNL.0b013e3181df0982
44. Glodzik L, Rusinek H, Brys M, Tsui WH, Switalski R, Mosconi L, et al. Framingham cardiovascular risk profile correlates with impaired hippocampal and cortical vasoreactivity to hypercapnia. J Cereb Blood Flow Metab. (2011) 31:671–9. doi: 10.1038/jcbfm.2010.145
45. Cantin S, Villien M, Moreaud O, Tropres I, Keignart S, Chipon E, et al. Impaired cerebral vasoreactivity to CO 2 in Alzheimer's disease using BOLD fMRI. Neuroimage. (2011) 58:579–87. doi: 10.1016/j.neuroimage.2011.06.070
46. Jor'dan AJ, Manor B, Novak V. Slow gait speed–an indicator of lower cerebral vasoreactivity in type 2 diabetes mellitus. Front Aging Neurosci. (2014) 6:135. doi: 10.3389/fnagi.2014.00135
47. Chung CC, Pimentel Maldonado DA, Jor'dan AJ, Alfaro FJ, Lioutas VA, Núñez MZ, et al. Lower cerebral vasoreactivity as a predictor of gait speed decline in type 2 diabetes mellitus. J Neurol. (2018) 265:2267–76. doi: 10.1007/s00415-018-8981-x
48. Peng SL, Chen X, Li Y, Rodrigue KM, Park DC, Lu H. Age-related changes in cerebrovascular reactivity and their relationship to cognition: a 4-years longitudinal study. Neuroimage. (2018) 174:257–62. doi: 10.1016/j.neuroimage.2018.03.033
49. Bhogal AA, Siero JCW, Fisher JA, Froeling M, Luijten P, Philippens M, et al. Investigating the non-linearity of the BOLD cerebrovascular reactivity response to targeted hypo/hypercapnia at 7T. Neuroimage. (2014) 96:296–305. doi: 10.1016/j.neuroimage.2014.05.006
50. Sobczyk O, Battisti-Charbonney A, Fierstra J, Mandell DM, Poublanc J, Crawley AP, et al. A conceptual model for CO2-induced redistribution of cerebral blood flow with experimental confirmation using BOLD MRI. Neuroimage. (2014) 92:56–68. doi: 10.1016/j.neuroimage.2014.01.051
51. Donahue MJ, Faraco CC, Strother MK, Chappell MA, Rane S, Dethrage LM, et al. Bolus arrival time and cerebral blood flow responses to hypercarbia. J Cereb Blood Flow Metab. (2014) 34:1243–52. doi: 10.1038/jcbfm.2014.81
52. D'Esposito M, Deouell LY, Gazzaley A. Alterations in the BOLD fMRI signal with ageing and disease: a challenge for neuroimaging. Nat Rev Neurosci. (2003) 4:863–72. doi: 10.1038/nrn1246
53. Abdelkarim D, Zhao Y, Turner MP, Sivakolundu DK, Lu H, Rypma B. A neural-vascular complex of age-related changes in the human brain: anatomy, physiology, and implications for neurocognitive aging. Neurosci Biobehav Rev. (2019) 107:927–44. doi: 10.1016/j.neubiorev.2019.09.005
54. Heijtel DFR, Mutsaerts HJMM, Bakker E, Schober P, Stevens MF, Petersen ET, et al. Accuracy and precision of pseudo-continuous arterial spin labeling perfusion during baseline and hypercapnia: a head-to-head comparison with 15O H2O positron emission tomography. Neuroimage. (2014) 92:182–92. doi: 10.1016/j.neuroimage.2014.02.011
55. Kubíková T, Kochová P, Tomášek P, Witter K, Tonar Z. Numerical and length densities of microvessels in the human brain: correlation with preferential orientation of microvessels in the cerebral cortex, subcortical grey matter and white matter, pons and cerebellum. J Chem Neuroanat. (2018) 66:22–32. doi: 10.1016/j.jchemneu.2017.11.005
56. Rostrup E, Law I, Blinkenberg M, Larsson HBW, Born AP, Holm S, et al. Regional differences in the CBF and BOLD responses to hypercapnia: a combined PET and fMRI study. Neuroimage. (2000) 11:87–97. doi: 10.1006/nimg.1999.0526
57. An H, Lin W, Celik A, Lee YZ. Quantitative measurements of cerebral metabolic rate of oxygen utilization using MRI: a volunteer study. NMR Biomed. (2001) 14:441–7. doi: 10.1002/nbm.717
58. Preibisch C, Haase A. Perfusion imaging using spin-labeling methods: contrast-to-noise comparison in functional MRI applications. Magn Reson Med. (2001) 46:172–82. doi: 10.1002/mrm.1173
59. Helenius J, Perkiö J, Soinne L, Østeroaard L, Carano RAD, Salonen O, et al. Cerebral hemodynamics in a healthy population measured by dynamic susceptibility contrast MR imaging. Acta Radiol. (2003) 44:538–46. doi: 10.1034/j.1600-0455.2003.00104.x
60. Bandettini PA, Jesmanowicz A, Wong EC, Hyde JS. Processing strategies for time-course data sets in functional mri of the human brain. Magn Reson Med. (1993) 30:161–73. doi: 10.1002/mrm.1910300204
Keywords: phase-contrast, arterial spin labeling, MRI, cerebrovascular reactivity, aging
Citation: Taneja K, Liu P, Xu C, Turner M, Zhao Y, Abdelkarim D, Thomas BP, Rypma B and Lu H (2020) Quantitative Cerebrovascular Reactivity in Normal Aging: Comparison Between Phase-Contrast and Arterial Spin Labeling MRI. Front. Neurol. 11:758. doi: 10.3389/fneur.2020.00758
Received: 06 April 2020; Accepted: 19 June 2020;
Published: 31 July 2020.
Edited by:
Yulin Ge, New York University, United StatesReviewed by:
Zhongliang Zu, Vanderbilt University, United StatesBo Gao, Affiliated Hospital of Guizhou Medical University, China
Lirong Yan, University of Southern California, Los Angeles, United States
Copyright © 2020 Taneja, Liu, Xu, Turner, Zhao, Abdelkarim, Thomas, Rypma and Lu. This is an open-access article distributed under the terms of the Creative Commons Attribution License (CC BY). The use, distribution or reproduction in other forums is permitted, provided the original author(s) and the copyright owner(s) are credited and that the original publication in this journal is cited, in accordance with accepted academic practice. No use, distribution or reproduction is permitted which does not comply with these terms.
*Correspondence: Hanzhang Lu, hlu3@jhmi.edu