 Mayu Tahara1,2
 Norimichi Higurashi1*Junichi Hata2,3
 Masako Nishikawa4Ken Ito1,2
 Shinichi Hirose5Takehito Kaneko6
 Tomoji Mashimo7
 Tetsushi Sakuma8
 Takashi Yamamoto8
 Hirotaka James Okano2*
- 1Department of Pediatrics, The Jikei University School of Medicine, Minato-ku, Tokyo, Japan
- 2Division of Regenerative Medicine, The Jikei University School of Medicine, Minato-ku, Tokyo, Japan
- 3Graduate School of Human Health Sciences, Tokyo Metropolitan University, Arakawa-ku, Tokyo, Japan
- 4Clinical Research Support Center, The Jikei University School of Medicine, Minato-ku, Tokyo, Japan
- 5General Medical Research Center, School of Medicine, Fukuoka University, Fukuoka, Japan
- 6Division of Fundamental and Applied Sciences, Graduate School of Science and Engineering, Iwate University, Morioka, Japan
- 7Division of Animal Genetics, Laboratory Animal Research Center, Institute of Medical Science, University of Tokyo, Minato-ku, Tokyo, Japan
- 8Division of Integrated Sciences for Life, Graduate School of Integrated Sciences for Life, Hiroshima University, Hiroshima, Japan
Introduction: Dravet syndrome (DS) is an infantile-onset developmental and epileptic encephalopathy characterized by an age-dependent evolution of drug-resistant seizures and poor developmental outcomes. Functional impairment of gamma-aminobutyric acid (GABA)ergic interneurons due to loss-of-function mutation of SCN1A is currently considered the main pathogenesis. In this study, to better understand the age-dependent changes in the pathogenesis of DS, we characterized the activity of different brain regions in Scn1a knockout rats at each developmental stage.
Methods: We established an Scn1a knockout rat model and examined brain activity from postnatal day (P) 15 to 38 using a manganese-enhanced magnetic resonance imaging technique (MEMRI).
Results: Scn1a heterozygous knockout (Scn1a+/−) rats showed a reduced expression of voltage-gated sodium channel alpha subunit 1 protein in the brain and heat-induced seizures. Neural activity was significantly higher in widespread brain regions of Scn1a+/− rats than in wild-type rats from P19 to P22, but this difference did not persist thereafter. Bumetanide, a Na+-K+-2Cl− cotransporter 1 inhibitor, mitigated hyperactivity to the wild-type level, although no change was observed in the fourth postnatal week. Bumetanide also increased heat-induced seizure thresholds of Scn1a+/− rats at P21.
Conclusions: In Scn1a+/− rats, neural activity in widespread brain regions increased during the third postnatal week, corresponding to approximately 6 months of age in humans, when seizures most commonly develop in DS. In addition to impairment of GABAergic interneurons, the effects of bumetanide suggest a possible contribution of immature type A gamma-aminobutyric acid receptor signaling to transient hyperactivity and seizure susceptibility during the early stage of DS. This hypothesis should be addressed in the future. MEMRI is a potential technique for visualizing changes in basal brain activity in developmental and epileptic encephalopathies.
1. Introduction
Dravet syndrome (DS) is an infantile-onset developmental and epileptic encephalopathy characterized by pharmacoresistant seizures, seizure susceptibility at high temperatures, cognitive and behavioral impairments after the first year of life, and motor disorders including ataxia and crouch gait (1–3). High premature mortality (4–20%) has been reported, and the main causes of death include sudden unexpected death, status epilepticus, and acute encephalopathy (3, 4).
DS is characterized by a cluster of age-related electroclinical features.
Unilateral/generalized convulsive status epilepticus (CSE) frequently occurs in the early stage of the disease. Thereafter, multiple seizure types, including focal, myoclonic, absence, and atonic seizures, appear. At later stages, interictal electroencephalography (EEG) shows diffuse and/or focal epileptic discharges, which are usually not observed during infancy (5). After 5 years of age, the occurrence of CSE and other seizure types decreases, whereas brief nocturnal generalized tonic-clonic seizures exhibit life-long occurrence (2, 3).
Heterozygous loss-of-function mutations in the SCN1A gene have been identified in over 80% of patients with DS (2, 6). SCN1A encodes voltage-gated sodium channel alpha subunit 1 (NaV1.1) and is predominantly expressed in the parvalbumin-positive gamma-aminobutyric acid (GABA)ergic interneurons (7, 8). These interneurons are the main source of phasic inhibition in the brain, and hence, impaired cerebral inhibition due to NaV1.1 haploinsufficiency in these neurons is considered the major mechanism underlying DS epilepsy (7, 9, 10). However, to establish better treatment strategies and improve the disease outcome, it is essential to comprehensively understand the pathogenesis of the age-dependent phenotypic changes that occur in DS.
To address this issue, we employed manganese-enhanced magnetic resonance imaging (MEMRI) in newly established Scn1a knockout rats, a technique used to visualize in vivo brain activity by using properties of manganese ions (Mn2+). Mn2+ ions shorten the T1 relaxation time in tissues where they accumulate and act as a calcium ions analog in neuronal tissue. They could also enter the firing neurons via voltage-gated calcium channels, and get transported to the adjacent neurons (11). Accordingly, Mn2+ accumulate in areas with higher neuronal activity, resulting in hyperintensity on T1-weighted images. Therefore, MEMRI has been widely applied as an in vivo method to understand the brain activity in various neurological diseases (12). The kinetic properties of Mn2+, which are slowly distributed in the brain over a 24-h period after systemic administration (11, 13, 14) suggest that MEMRI is more suitable for evaluating basal brain activity than for transient epileptic activity like seizures. Previous reports have also reported difficulty in detecting brain activity in status epilepticus using MEMRI (15–17), suggesting the usefulness of MEMRI as a tool for detecting developmental changes in the brain activity of different regions in epilepsy and analyzing the underlying pathogenesis.
Here, we evaluated the age-dependent alteration in the brain activity of different regions in the Scn1a knockout rats using MEMRI. Previous studies on the pathogenesis of DS have mainly used mouse models of Scn1a knockout (18–20). We used rats because they have larger brains than mice, allowing for more accurate evaluation of brain activity by MRI, even in pups. In addition, when using mice, longer imaging times are required to perform high-resolution MRI experiments, and there are concerns about the effects of prolonged anesthesia and the imaging environment on the images. Coil fitting is also an important factor affecting the results of the analysis when targeting small brains. Furthermore, as compared to mice, the developmental patterns in rats, including developmental changes in the Na+-K+-2Cl− cotransporter 1 (NKCC1) and K+-Cl− cotransporter 2 (KCC2), have been reported to have more similar to those in humans (21).
Although we established the rat model for DS, the phenotype was milder than that of Scn1a knockout mice, in terms of lower frequency of spontaneous seizures and mortality rate. However, we hypothesized these rat models may be better suited to evaluate the pathogenic alterations directly caused by Scn1a defects, while minimizing the influences of spontaneous seizures and malnutrition.
2. Materials and methods
2.1. Transcription activator-like effector nuclease -mediated genome editing in rats
A pair of TALENs targeting exon 1 of rat Scn1a (Ensembl: ENSRNOG00000053122) was designed and constructed using a two-step assembly method with a Platinum Gate kit as previously reported (22). Assembled sequence was 5′-TGCAGGATGACAAGATGgagcaaacagtgcttGTACCACCAGGACCTGA-3′, where uppercase and lowercase letters indicate TALEN target sequences and spacer sequence, respectively. TALENs were microinjected into fertilized eggs of Fisher 344 (F344) rats and transferred into the oviducts of pseudopregnant female Wistar rats, as previously described (23). Genomic DNA was extracted from the tail using the GENEXTRACTOR TA-100 automatic DNA purification system (Takara Bio) and amplified with specific primer sets (forward 5′-TCCTCACTTGTTGGGTCTCA-3′, reverse 5′-TCAGGGTGACTTCAGCATTTC-3′). The polymerase chain reaction (PCR) products were directly sequenced using the BigDye terminator v3.1 cycle sequencing mix and the standard protocol for an Applied Biosystems 3130 DNA Sequencer (Life Technologies). Rats from the fifth generation or later were used in all experiments. Genotypes were assessed by running the PCR products from ear DNA on a Caliper electrophoresis system at postnatal day (P9). Only male rats were used in experiments to eliminate sex differences.
2.2. F344-Scn1aem1kyo rats
This study was approved by the Animal Research Committee of Kyoto University and the Institutional Animal Care and Use Committee of the Jikei University School of Medicine (protocol number: 2015-125C7). All procedures were conducted according to the Guidelines of the Proper Conduct of Animal Experiments of the Science Council of Japan (2006). The principles outlined in the ARRIVE guidelines, including the 3R concept, were followed when planning the experiments. P15 to 38 rats were used in this study (n =162, body weight range 21–124 g). Rats were weaned on P22 and housed in polycarbonate cages under temperature-controlled conditions (temperature: 24–25°C; relative humidity: 50–60%) with a 12/12-h light–dark cycle. They had free access to water and pelleted food (CE-2, CLEA Japan, Inc.).
2.3. Western blot analysis
Protein extraction from rat brains was performed at P13 using an ULTRARIPA kit for lipid rafts (F015; BioDynamics Laboratory Inc.); the reagent solution contained 50 mM Tris-HCl (pH 8.0), 150 mM NaCl, 1% NP-40 alternative, 0.1% SDS, and 0.5% sodium deoxycholate. Proteins were separated using SDS-PAGE and transferred to polyvinylidene difluoride membranes (Millipore). The membranes were blocked with 5% nonfat skim milk overnight at 4°C and incubated in primary antibody solution containing rabbit anti- voltage-gated sodium channel alpha subunit 1 (NaV1.1) (ASC-001, 1:200; Alomone Labs) and mouse anti-β-actin (A1978, 1:1000; Sigma-Aldrich) for 1 h at room temperature and sequentially incubated with secondary antibodies containing anti-Rb IgG HRP (AP307P, 1:2000; Millipore) and anti-mouse IgG HRP (AP308P, 1:2000; Millipore) for 1 h at room temperature. The signal was detected using Chemiluminescence HRP Substrate (Takara Bio) on the LAS3000 Mini apparatus (FUJI FILM). Semiquantitative analysis of the signal was performed using ImageJ software (National Institute of Health).
2.4. EEG recordings
All surgical procedures were performed under isoflurane anesthesia (4–1.5%) at P14. Epidural screw electrodes for EEG were mounted on the skull bilaterally over the somatosensory cortex (2.0 mm lateral to midline, 2.0 mm posterior to bregma) and the cerebellum (1.0 mm lateral to midline, 2.0 mm posterior to lambda) as reference electrodes. Electromyography (EMG) electrodes were inserted into the suprascapular area. Heat-induced seizures were triggered in rats as described below, and behavioral seizures, video–EEG, and EMG were recorded using a PowerLab system (AD Instruments) at P21. Data analysis was performed with LabChart software (AD Instruments).
2.5. Animal preparation for MRI
Rats were initially anesthetized with 3% isoflurane in 30/70% O2/N2 in a closed chamber. Rats were laid in the prone position on a dedicated animal bed heated with warm circulating water. Anesthesia with 1.5–2.5% isoflurane in 30/70% O2/N2 was delivered to the spontaneously breathing animals through a snout mask, and the respiratory rate was maintained at 50–60 breaths/min. The rectal temperature was carefully monitored and maintained at 36.5 ± 0.5°C by circulating warm water under the bed.
2.6. MRI measurements and image analysis
Imaging was performed using a 9.4 T MRI 94/20 system (Bruker BioSpin GmbH) with a mouse head surface coil and a 72-mm transmit coil. We acquired T1 maps for the MRI study. The scanning parameters were as follows: T1WI for T1 map: echo time, 6.5 ms; repetition times, 525, 1050, 2100, 4200, and 8400 ms; averages, 2; scan time, 1 h 3 min 28 s 350 ms; rapid acquisition with relaxation enhancement factor, 1; slices, 24; slice thickness, 0.8 mm; image matrix, 140 × 140; field of view, 16.0 × 16.0 mm; resolution, 0.114 × 0.114 mm; and slice gap, 0.2 mm. T1 value for each ROI was calculated for each T1 map using ImageJ software (National Institutes of Health).
2.7. MEMRI
An isotonic solution of MnCl2·4H2O (203734; Sigma-Aldrich) was prepared at a concentration of 100 mM in 100 mM bicine solution, as previously described (24). Then, the MnCl2 solution was diluted to 50 mM with saline, and the pH was adjusted to 7.4.
We intraperitoneally administered a 50 mM solution of MnCl2 immediately after the initial MRI acquisition, twice at 1-h intervals, to get a total dose of 66 mg/kg. MEMRI acquisition was performed 24 h after the first administration of MnCl2 based on the kinetics of intracerebral Mn2+ concentration (11). The imaging area was adjusted to the same position as in the initial MRI to facilitate comparison of T1 values at the same ROI.
2.8. Systemic bumetanide or saline administration
The effective systemic dose of bumetanide on neonatal seizures in rats is 0.1–0.5 mg/kg (21, 25). We administered 0.2 mg/kg of bumetanide twice a day in repeated doses as previously described (26). Bumetanide (B3023; Sigma-Aldrich) was dissolved in 100% ethyl alcohol and then diluted with 0.9% saline to a final concentration of 0.05 mg/mL. Bumetanide solution (0.2 mg/kg) or equal volumes of 0.9% saline (4 mL/kg) was injected twice daily from P12 to P20 or P26. MEMRI was performed on P21 or P27 for each rat.
2.9. Induction of heat-induced seizures
Scn1a+/− rats were subjected to heat-induced seizures on P21 or P27 after daily administration of bumetanide or 0.9% saline from P12 to P20 or P26. Hyperthermia was induced by placing the rats in a bath filled 10 cm deep with 45°C water, as previously described (27), for a maximum of 5 min or until a seizure occurred. When a seizure occurred, the rats were removed immediately from the bath and monitored until recovery. For each rat, we recorded the latency from water contact to seizure onset, the seizure duration, and a score based on the most severe seizure observed. Seizure severity was scored based on Racine stages (28): 0, no response; 1, oral and facial movement; 2, head nodding; 3, forelimb clonus; 4, forelimb clonus with rearing; and 5, generalized tonic-clonic seizures and falling. All procedures were recorded using a video camera. We did not measure body temperature because it was difficult and would be inaccurate to measure body temperature in a water bath.
2.10. Statistical analyses
Statistical analysis was performed using SAS 9.4 software (SAS Institute Inc.) and GraphPad Prism 8 software (GraphPad Software Inc.). We used ANCOVA to compare T1post (T1 values resulting from MEMRI T1 mapping) and adjusted for native T1 values (T1pre), applying a split-split-plot design under different genotypes, developmental stages, and regions (29). Genotypes and developmental stages were applied to whole plots (animals), and regions were applied to split-split-plots (regions in an animal) in the MEMRI experiment at each stage of development. In the MEMRI experiment with and without bumetanide, genotype and drug (bumetanide or saline) were applied to whole plots (animals), and regions were applied to split-split-plots (regions in an animal). The replicate effect was combined into whole-plot error, including Error(A) and Error(B) (29), and Type III Sum of Squares in SAS was used as the main result. The Scheffé or Tukey multiple-comparison test was performed with split-split-plot error to compare genotypes in each region at each developmental stage or to compare bumetanide and normal saline at each region in each genotype. Differences in seizure phenotypes were assessed using the Mann–Whitney U-test. The p-values were two-sided, and p < 0.05 was considered statistically significant.
3. Results
3.1. Generation of Scn1a knockout rats
In this study, we developed a global Scn1a knockout rat model using the TALEN-mediated genome editing technique by generating a frameshift in exon 1 of the Scn1a gene (Figure 1A). TALEN mRNAs targeting Scn1a exon 1 were microinjected into fertilized eggs of F344 rats, and a 94-base-pair deletion in exon 1 was identified in a resulting founder mutant rat (F344-Scn1aem1Kyo). Reduced NaV1.1 protein expression was confirmed in the brains of heterozygous (Scn1a+/−) and homozygous (Scn1a−/−) knockout rat offspring (Figures 1B, C and Supplementary Figure 1).
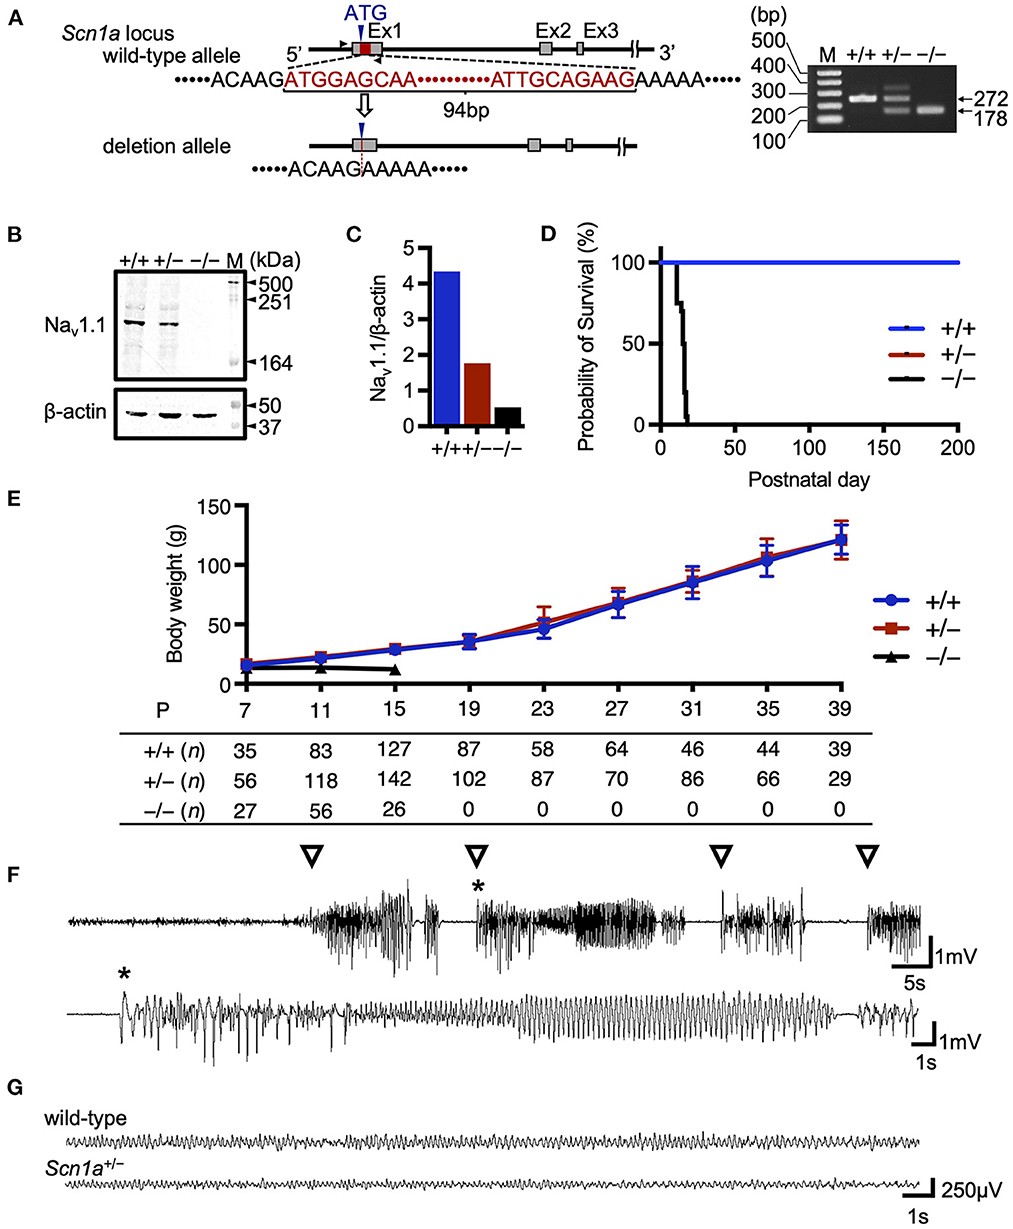
Figure 1. Targeting construct and generation of global Scn1a knockout rats. (A) The arrows show the position of the genotyping primer set (forward 5′-TAATAACTTTTAATGCTATC-3′, reverse 5′-CTTCCCAGCTTCCAAGTCAC-3′). Genotype analysis shows a 272 bp band in the wild-type allele and a 178 bp band in the Scn1aem1kyo mutant. The upper band of the Scn1aem1kyo mutant is nonspecific. Genotypes are indicated by +/+ for wild-type, +/– for heterozygous, and –/– for homozygous animals. (B) Western blotting of brain membrane proteins from wild-type (+/+), heterozygous (+/–), and homozygous (–/–) Scn1a rats at P13 using an anti- voltage-gated sodium channel alpha subunit 1 (NaV1.1) antibody. β-actin was used as the internal control. Original blots/gels are presented in Supplementary Figure 1. (C) Relative NaV1.1 protein levels normalized to β-actin. (D) Survival curves of wild-type (n = 15), Scn1a+/− (n =15), and Scn1a−/− (n = 20) rats. Scn1a−/− rats exhibited ataxia and seizures from postnatal day (P) 10, gradually progressing to weight loss and complete loss of postural control. They became inactive and did not survive beyond P18. In wild-type and Scn1a+/− rats, there were no spontaneous deaths. (E) Body weight curves of wild-type (blue circle), Scn1a+/− (red square), and Scn1a−/− (black triangle) rats. The sample size is shown below the graph. Scn1a+/− rats showed no difference in body weight compared to wild-type rats. Data are presented as mean ± standard deviation. (F) Ictal electroencephalography (EEG) recording of heat-induced seizures from Scn1a+/− rats at P21. Spiking activity was recorded, and generalized tonic-clonic seizures were observed. Open triangle indicates seizure onset. Asterisk indicates the expanded EEG trace of spiking activity. (G) Representative interictal EEG recordings from wild-type and Scn1a+/− rats at P21. No interictal epileptic discharge was found.
3.2. Scn1a knockout rats exhibited key phenotypic features of Scn1a-related epilepsies, but were milder than those of DS
As previously reported in Scn1a knockout mice (9, 18–20), Scn1a−/− rats died at approximately the second postnatal week, but no spontaneous deaths were observed in Scn1a+/− rats until at least P200 (Figure 1D). The mean body weight of Scn1a+/− rats was not significantly different from that of wild-type rats during the experimental period (Figure 1E). Heat-induced seizures were observed in all investigated Scn1a+/− rats (n = 26) at 45°C water, a temperature that did not induce seizures in wild-type rats (Figure 1F, Supplementary Video 1). Up to the third postnatal week, spontaneous convulsive seizures were rarely observed and EEG recordings showed no interictal epileptiform discharges or ictal activities during recording in the Scn1a+/− rats (Figure 1G). Notably, in older Scn1a+/− rats, some seizures were provoked by acoustic or vibrational stimuli. These findings indicate that Scn1a+/− rats have milder symptoms than those reported in Scn1a+/− mice, suggesting their phenotype may be closer to the genetic epilepsy with febrile seizures plus phenotype.
3.3. MEMRI revealed increased neural activity in widespread brain regions of Scn1a+/− rats from P19 to P22
To identify disease-specific alterations in regional brain activities of developing Scn1a+/− rats, we employed T1 mapping in a MEMRI experiment. This technique represents the T1 relaxation time as the T1 value for each pixel; decrease in the T1 value in MEMRI indicates increase in neural activity. Several MEMRI studies have used T1 mapping to quantitatively compare brain activity as T1 value or R1(1/T1) and successfully identified regions that show disease-specific changes in brain activity (30, 31). Therefore, we applied this technique to quantitatively compare the regional activity of wild-type and Scn1a+/− rats. As T1 values might be influenced by myelination (32, 33), we first investigated T1pre before performing MEMRI in wild-type (n = 44, body weight range 21–118 g) and Scn1a+/− rats (n = 44, 25–124 g) from P15 to P38 (Supplementary Figure 2). MnCl2 was intraperitoneally administered immediately afterwards, and MEMRI T1 mapping was performed on the same rats to investigate T1post (Figure 2A). We compared T1post values, adjusted for T1pre, under different genotypes, developmental stages, and regions. Region of interests (ROIs) were defined in 17 areas in the cortex, subcortex, and cerebellum (Figure 2D). The developmental stages of rats were defined according to a previous report (34): P15–18 (neonatal period), P19–22 (infancy), P23–26 (weaning period), P27–30 (early juvenile period), P31–34 (juvenile period), and P35–38 (prepuberty). If T1post or T1pre could not be measured in a region, both values were excluded from the analysis. The sample size for each postnatal day and each ROI is shown in Table 1. Analysis of covariance (ANCOVA) for T1post showed neither a significant main effect of genotype [F(1, 76) = 3.19, p = 0.08] nor an interaction among the developmental stages, genotypes, and ROIs [F(80, 1194) = 1.28, p = 0.05]. In Scn1a+/− rats, however, a significant decrease in T1post was observed compared to wild-type rats at P19–22 in all ROIs, except the cerebellar vermis, by the Tukey multiple-comparison test with respect to the interaction (p < 0.001; cerebellar vermis, p = 0.11), while the decrease was not significant at P15–18 or P23–34 (Figures 3A, B). At P35–38, a significant decrease reappeared in the hippocampal CA3, lateral habenular nucleus, and basal ganglia (CA3, p < 0.001; lateral habenular nucleus, p = 0.007; globus pallidus, p = 0.05; caudate-putamen, p < 0.001). These results demonstrate that neural activity across widespread brain regions is significantly increased in Scn1a+/− rats at P19–22, which corresponds to the peak onset age of DS in humans (1, 4, 35).
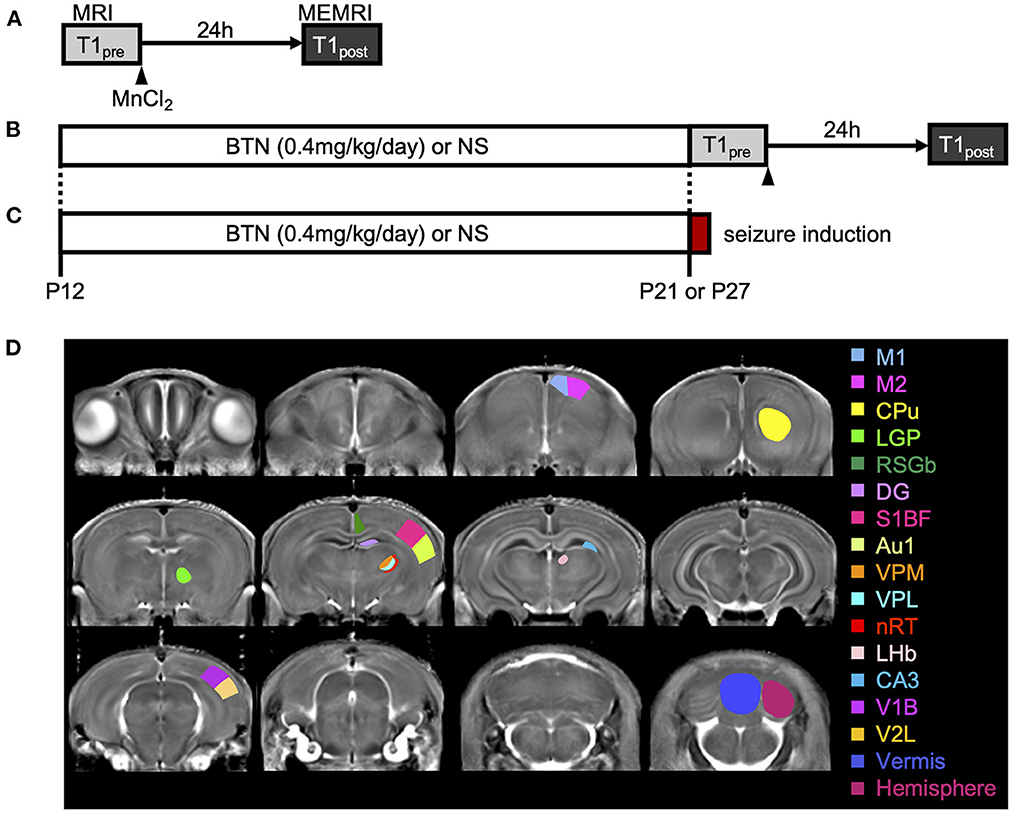
Figure 2. Schematic diagram of the experiments. (A) Manganese-enhanced magnetic resonance imaging (MEMRI) experiment. Manganese chloride was intraperitoneally administered immediately after the first T1 mapping, which was reconfirmed 24 h later. (B) MEMRI experiment in rats treated with bumetanide (BTN) or normal saline (NS). BTN solution (0.2 mg/kg) or an equal volume of NS (4 mL/kg) was injected intraperitoneally twice a day beginning at postnatal day (P) 12, and MEMRI was performed for each rat on P21 or P27. (C) Heat-induced seizure experiment in rats treated with BTN or NS. After daily injections of BTN or NS, seizures were induced in rats by a warm bath at P21 or P27. (D) Representative coronal T1 map and regions of interest. Regions were manually obtained using the Paxinos and Watson atlas. The image shows the average of T1 maps. Colors indicate 17 different brain regions, which are overlaid on averaged images of the MEMRI T1 map. M1, primary motor cortex; M2, secondary motor cortex; CPu, caudate-putamen (striatum); LGP, lateral globus pallidus; RSGb, retrosplenial granular b cortex; DG, dentate gyrus; S1BF, primary somatosensory cortex, barrel field; Au1, primary auditory cortex; VPM, ventral posteromedial thalamic nucleus; VPL, ventral posterolateral thalamic nucleus; nRT, reticular thalamic nucleus; LHb, lateral habenular nucleus; CA3, CA3 field of the hippocampus; V1B, primary visual cortex, binocular area; V2L, secondary visual cortex, lateral area; Vermis, cerebellar vermis; Hemisphere, cerebellar hemisphere.
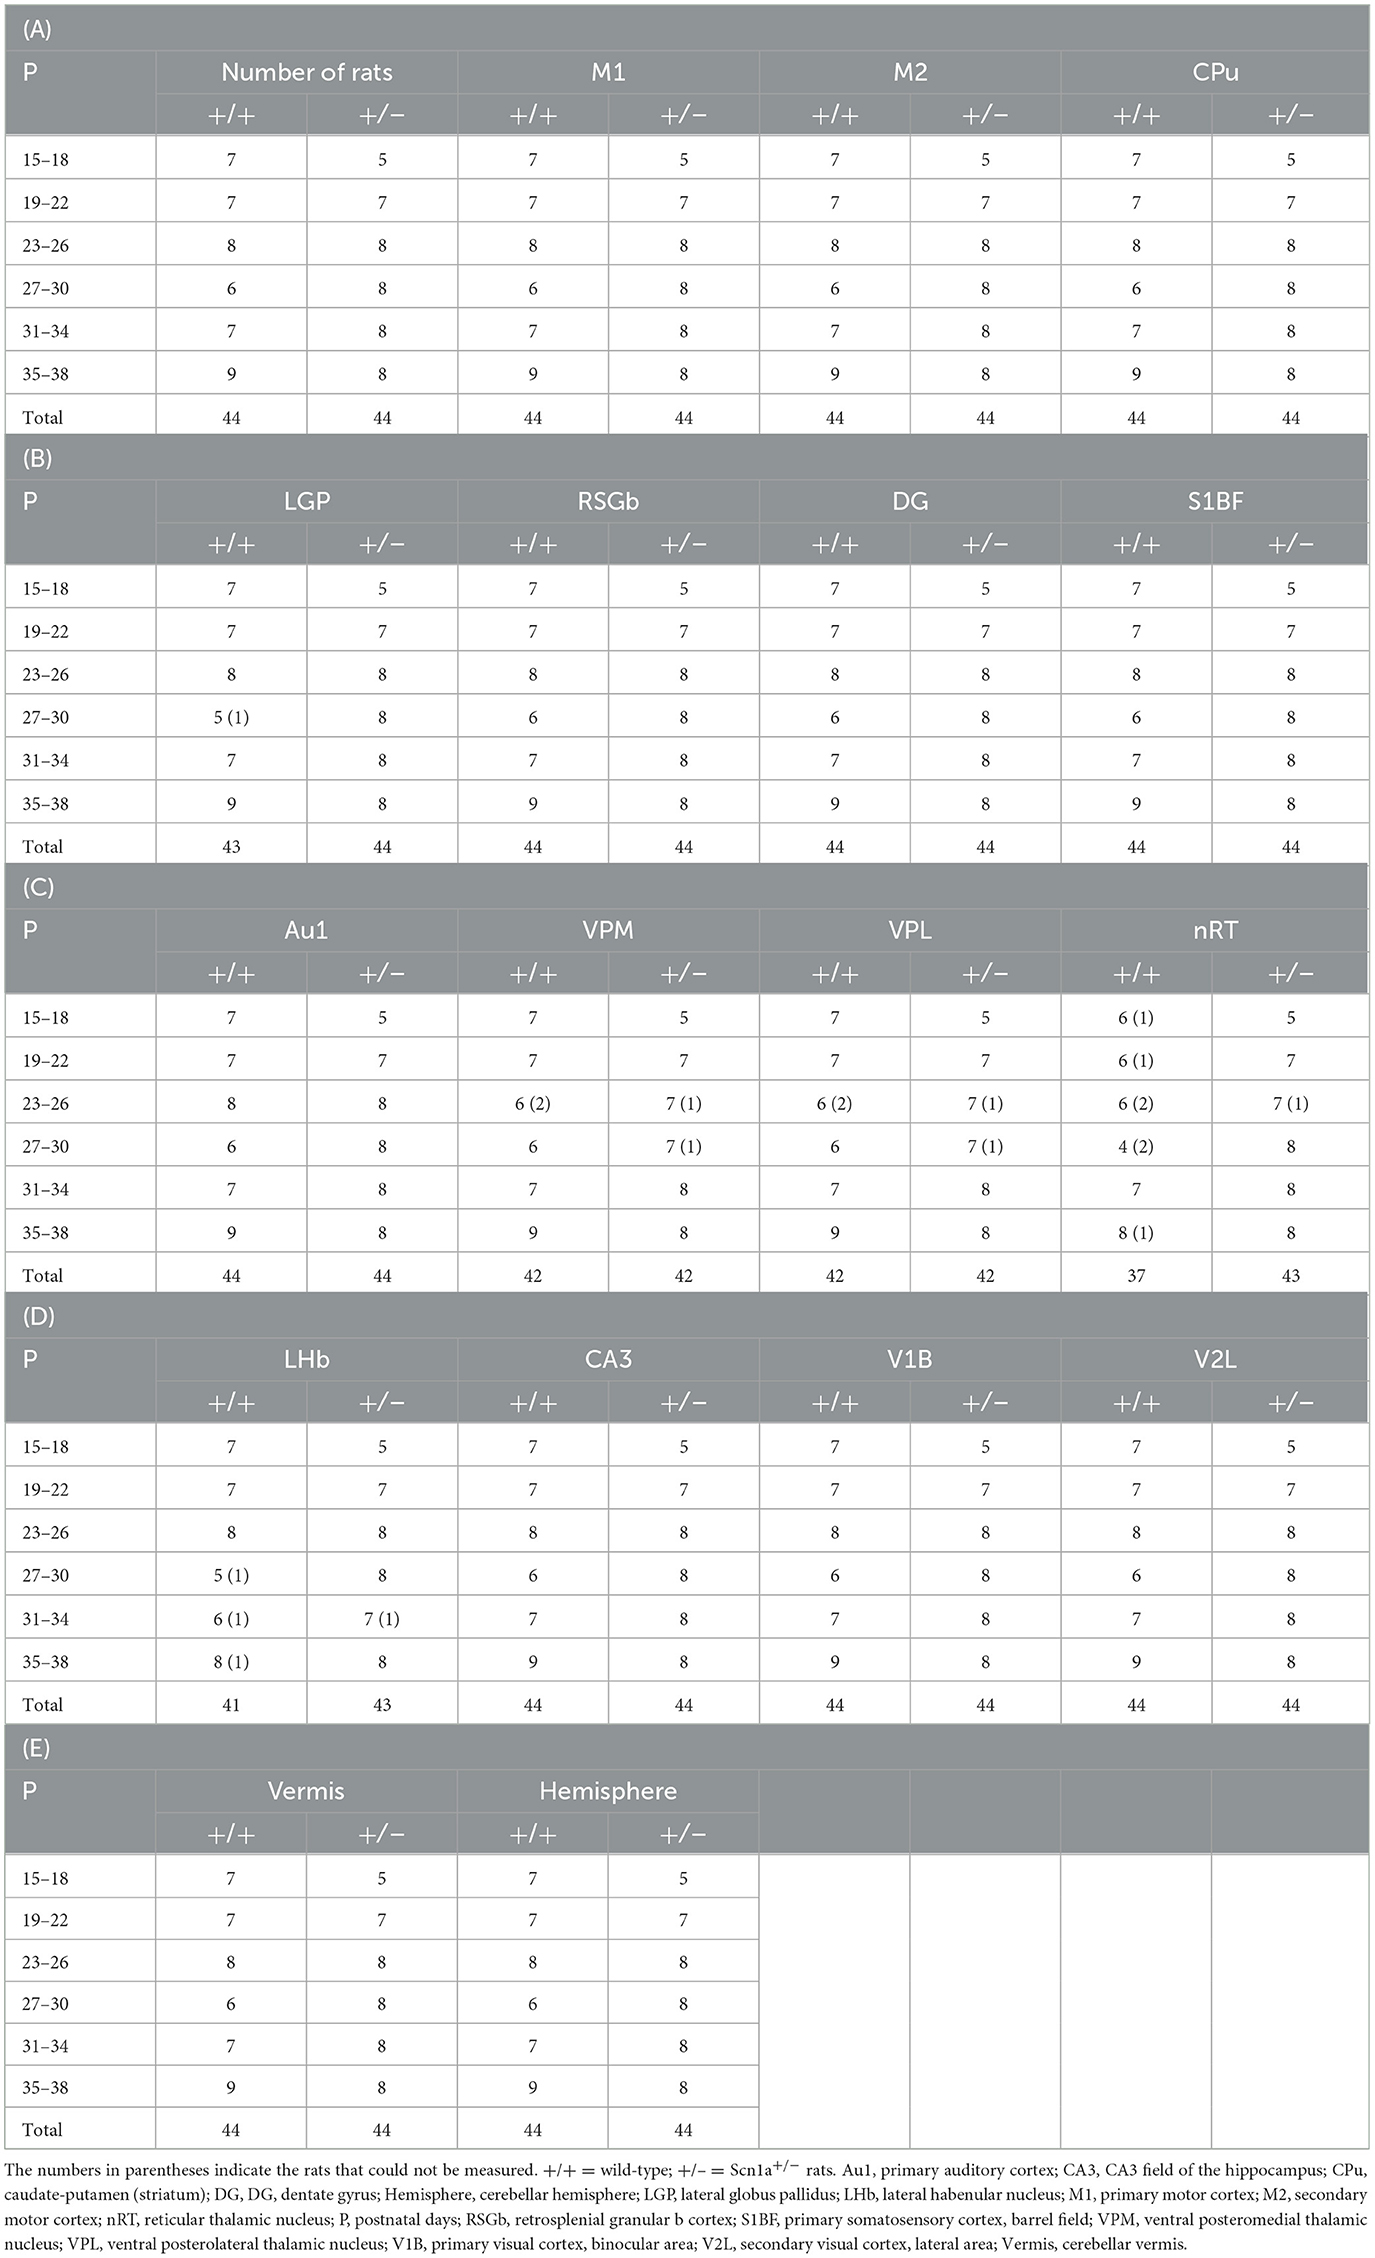
Table 1. Sample size for each postnatal day and each region of interest.
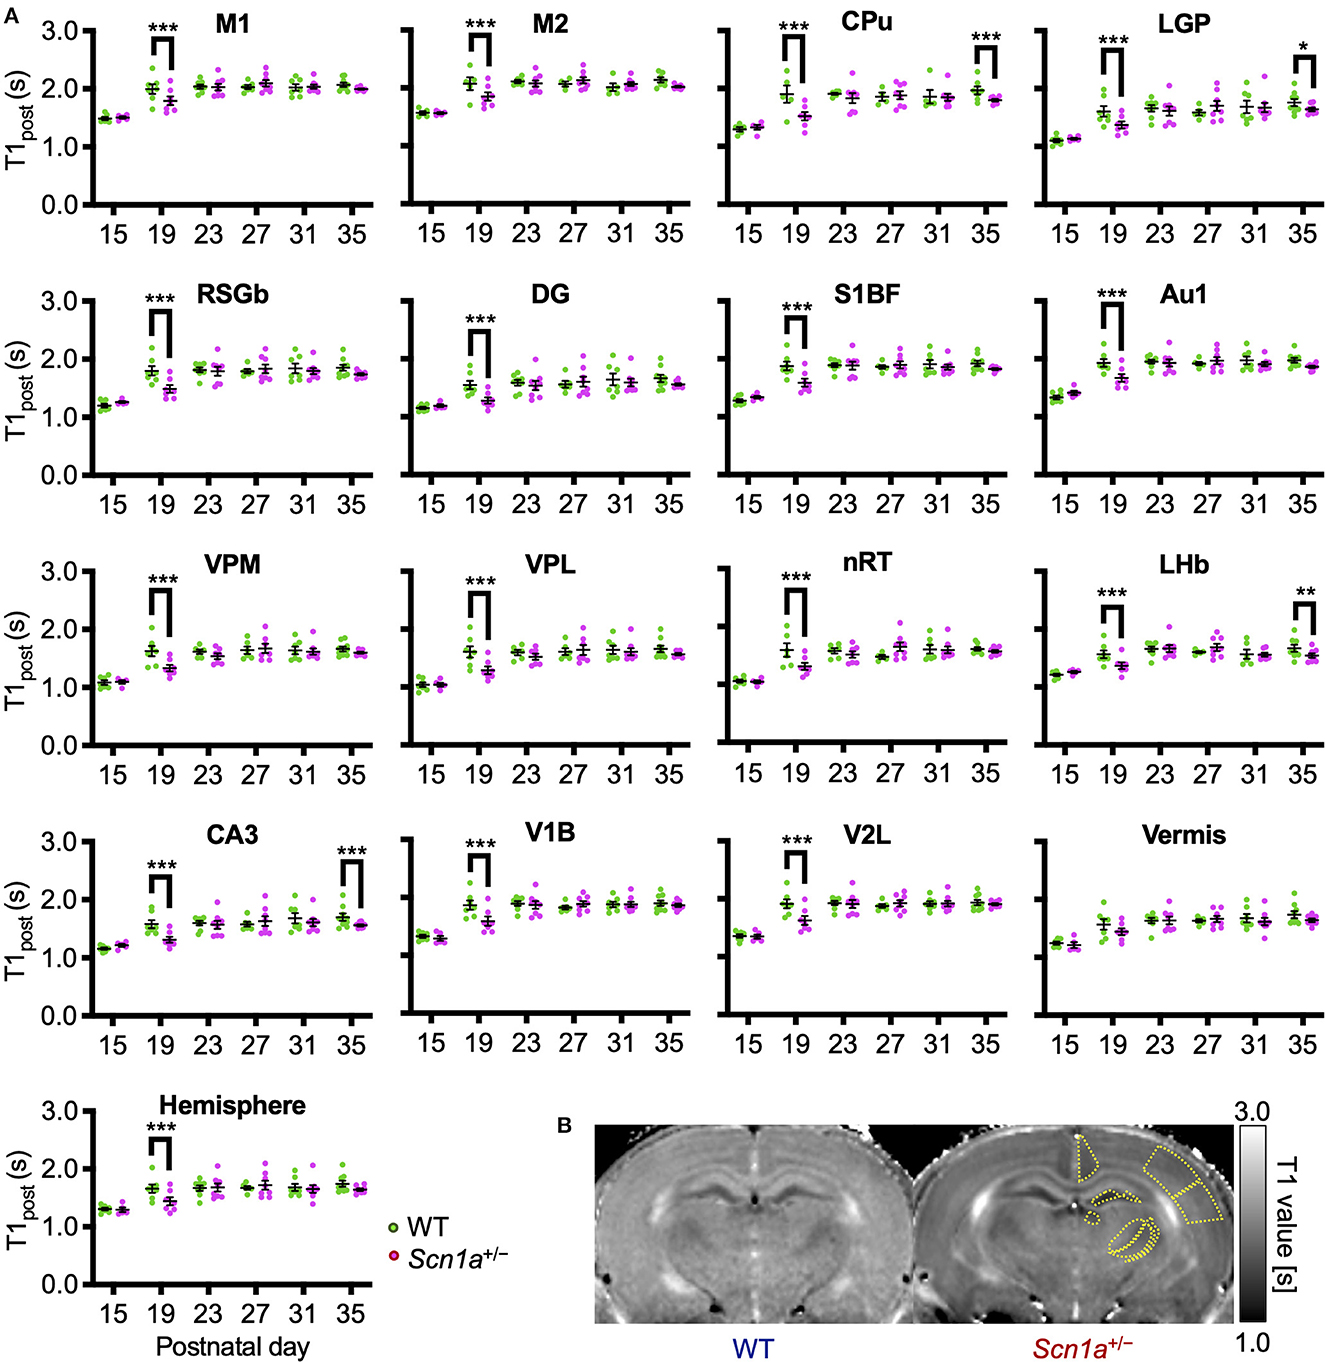
Figure 3. Age-dependent changes in T1post in each brain region of wild-type and Scn1a+/− rats. (A) T1post showed age-dependent changes in each region of wild-type (WT, green circle) and Scn1a+/− rats (Scn1a+/−, magenta circle). Tukey multiple-comparison test showed a significant decrease in T1post of Scn1a+/− rats during P19–22: M1(mean difference 0.205s; 95% CI 0.073–0.337s), M2 (0.198s; 0.066–0.330s), CPu (0.355s;−0.203–0.467s), LGP (0.247s; 0.115–0.380s), RSGb (0.318s; 0.203–0.467s), DG (-0.272s; 0.140–0.404s), S1BF (0.299s; 0.167–0.431s), Au1 (0.269s; 0.137–0.401s), VPM (0.286s; 0.154–0.419s), VPL (0.316s; 0.184–0.448s), nRT (0.280s; 0.142–0.418s), LHb (0.202s; 0.070–0.334s), CA3 (0.277s; 0.145–0.409s), V1B (0.278s; 0.147–0.410s), V2L (0.291s; 0.159–0.423s), Vermis (0.126s;−0.006–0.258s), and Hemisphere (0.229s; 0.097–0.361s). These differences disappeared after P23, but are significantly decreased during P35–38: CPu (0.148s; 0.028–0.268s), LGP (0.120s; 0.000–0.240s), LHb (0.136s; 0.012–0.260s), and CA3 (0.143s; 0.023–0.263s). Tukey's multiple-comparison test; *p < 0.05, ** p < 0.01, *** p < 0.001. Data are presented as mean ± standard error of the mean (SEM). Dots represent individual data points. (B) Representative MEMRI T1 map at P21. Yellow lines show part of regions of interest. MEMRI, manganese-enhanced magnetic resonance imaging; M1, primary motor cortex; CI, confidence interval; M2, secondary motor cortex; CPu, caudate-putamen (striatum); LGP, lateral globus pallidus; RSGb, retrosplenial granular b cortex; DG, dentate gyrus; S1BF, primary somatosensory cortex, barrel field; Au1, primary auditory cortex; VPM, ventral posteromedial thalamic nucleus; VPL, ventral posterolateral thalamic nucleus; nRT, reticular thalamic nucleus; LHb, lateral habenular nucleus; CA3, CA3 field of the hippocampus; V1B, primary visual cortex, binocular area; V2L, secondary visual cortex, lateral area; Vermis, cerebellar vermis; Hemisphere, cerebellar hemisphere; P, postnatal day.
3.4. NKCC1 inhibitor rescued the increased brain activity in Scn1a+/− rats at P21
The decrease in T1post in Scn1a+/− rats occurred transiently at P19–22, and later reached the same level as wild-type rats. Thus, we speculated that the impairment of a brain developmental process that occurs at this age might contribute to this phenomenon. We focused on the maturation process of inhibitory neural circuits, which is influenced by developmental changes in intracellular chloride concentration ([Cl−]i). A decrease in [Cl−]i promotes depolarizing to hyperpolarizing (D-H) switching and further enhances the inhibitory effect of type A gamma-aminobutyric acid (GABAA) receptor signaling (36, 37). On the other hand, elevated [Cl−]i causes depolarizing GABAA receptor signaling, which is observed in immature neurons primarily as a result of higher expression of the chloride importer NKCC1 (32, 36). Conversely, mature neurons express higher levels of the chloride exporter KCC2, which results in decreased [Cl−]i, leading to hyperpolarizing GABAA receptor signaling (32, 36). In rodents, [Cl−]i generally decreases by P20 (38). As a result, the D-H switch is completed by P14 (36, 37, 39), and especially by P17 in males (40, 41). Therefore, we hypothesized that the transient increase in brain activity is associated with delayed [Cl−]i decrease. We performed a rescue experiment by administering bumetanide, an NKCC1 inhibitor (32), to Scn1a+/− rats which would decrease [Cl−]i and promote the maturation of inhibitory neural network. Bumetanide or normal saline (control) was administered intraperitoneally every day from P12–20 in wild-type rats (bumetanide-treated: n = 6, body weight range 31–39 g; saline-treated: n = 6, 31–38 g) and Scn1a+/− rats (bumetanide-treated: n = 6, 32–40 g; saline-treated: n = 6, 33–37 g), and MEMRI was performed on P21 (Figure 2B). ANCOVA for T1post showed no significant interaction among genotypes, ROIs, and drug administration [F(16, 319) = 1.58, p = 0.07]. However, Scheffé multiple-comparison test with respect to the interaction showed that T1post significantly increased in all ROIs, except the lateral habenular nucleus, in bumetanide-treated Scn1a+/− rats compared to those in saline-treated Scn1a+/− rats (p < 0.05; lateral habenular nucleus, p = 0.06), while no significant difference was observed between bumetanide- and saline-treated wild-type rats (Figure 4A). The caudate-putamen, lateral globus pallidus, retrosplenial granular b cortex, dentate gyrus, primary somatosensory cortex, reticular thalamic nucleus, and cerebellar hemisphere of Scn1a+/− rats had remarkable increases in T1post (p < 0.001). Based on these results, we speculated that the immature inhibitory neural network due to delayed decrease in [Cl−]i is involved in the increased brain activity in Scn1a+/− rats at P19–22.
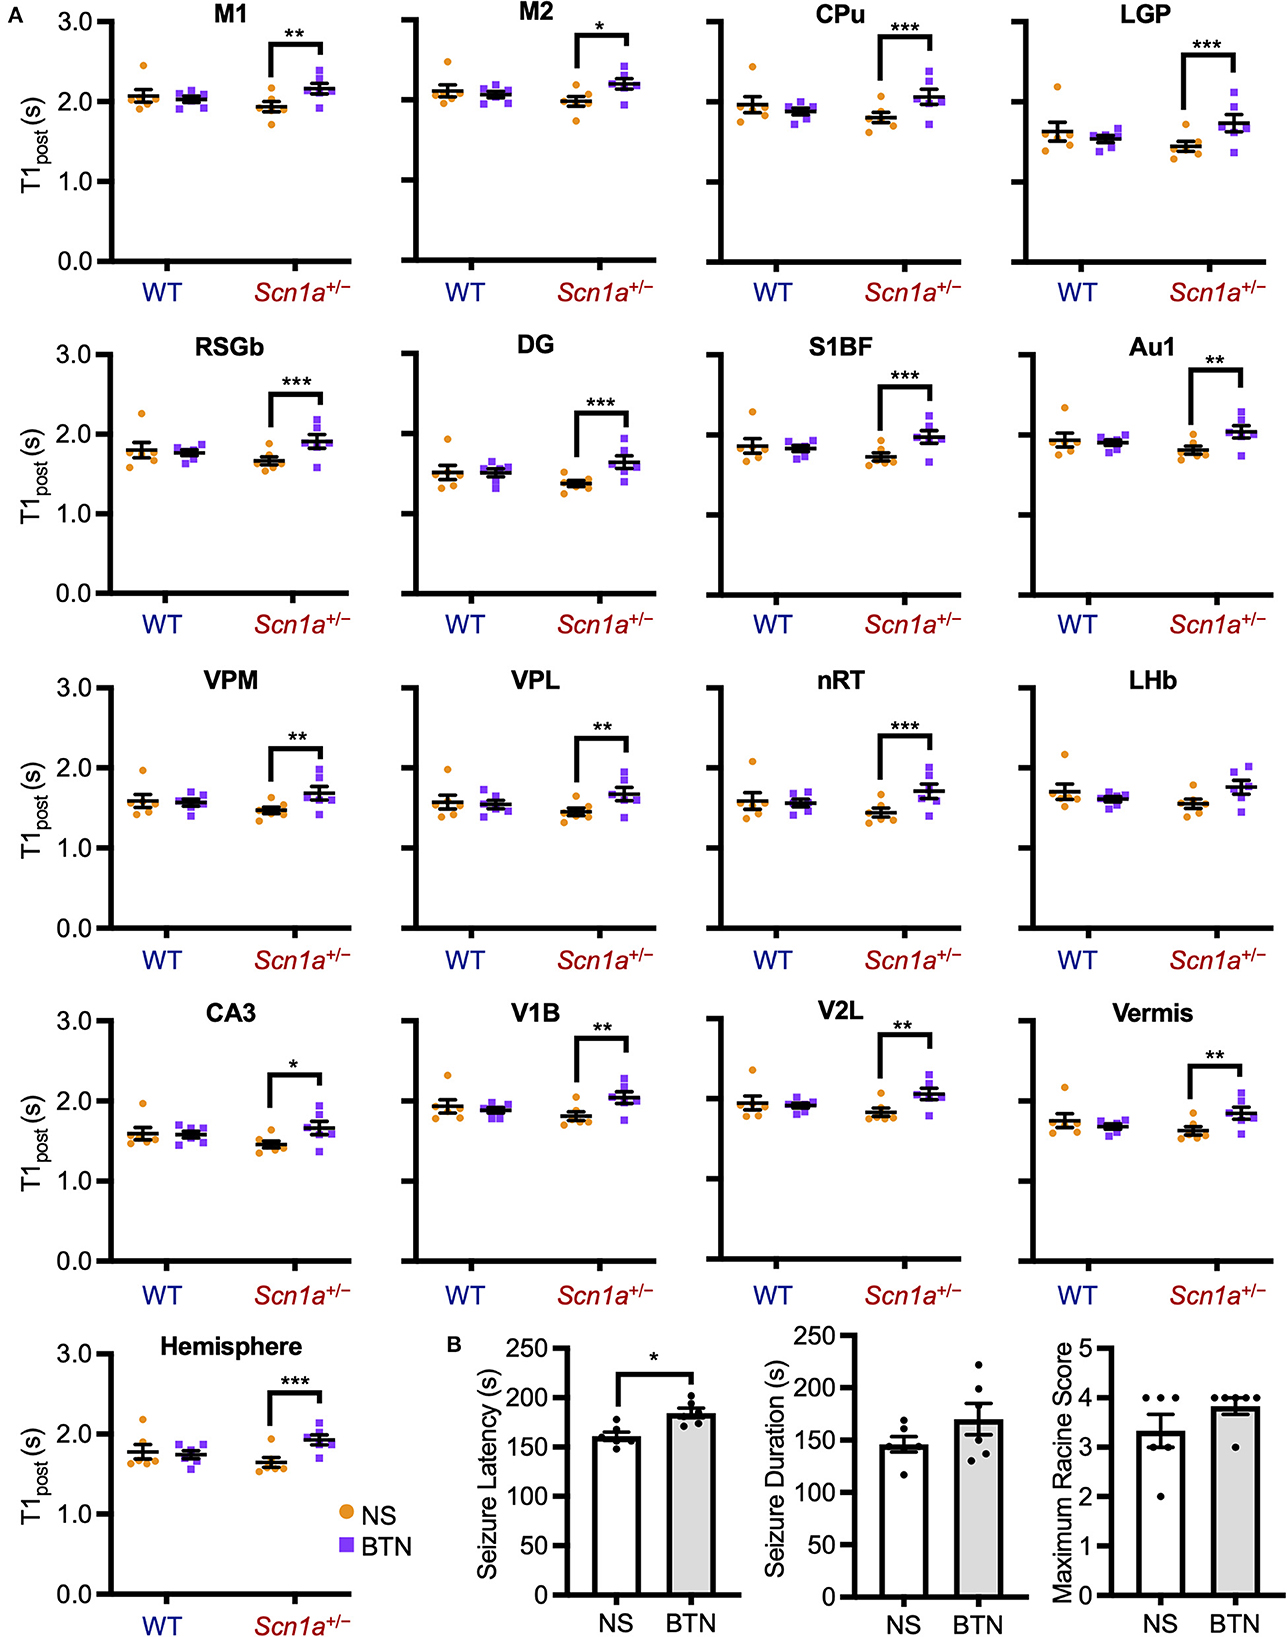
Figure 4. T1post and seizure characteristics after administration of BTN or NS. (A) Scheffé multiple-comparison test of T1post in rats at P21 after the administration of BTN (orange circle) or NS (purple square). Scn1a+/− rats showed a significant increase in the T1post of widespread brain regions in the BTN-treated group compared to the NS-treated group: M1 (mean difference−0.225s; 95% CI−0.423-−0.027s), M2 (-0.210s;−0.408−0.011s), CPu (-0.260s;−0.458−0.062s), LGP (-0.288s;−0.486−0.090s), RSGb (-0.236s;−0.435−0.037s), DG (-0.265s;−0.463−0.067s), S1BF (-0.235s;−0.435−0.035s), Au1 (-0.222s;−0.421−0.024s), VPM (-0.216s;−0.414−0.018s), VPL (-0.223s;−0.420−0.025s), nRT (-0.272s;−0.470−0.074s), LHb (-0.197s;−0.396−0.002s), CA3 (-0.200s;−0.397−0.002s), V1B (-0.222s;−0.420−0.023s), V2L (-0.223s;−0.422−0.024s), Vermis (-0.213s;−0.412−0.015s), and Hemisphere (-0.272s;−0.471−0.073s). There was no difference between the T1post of NS-treated and BTN-treated WT rats. n = 6 per group, Scheffé multiple-comparison test; *p < 0.05, **p < 0.01, ***p < 0.001. Data are presented as mean ± SEM. (B) Comparison of seizure latency, seizure duration, and seizure score between BTN-treated and NS-treated Scn1a+/− rats at P21. BTN significantly increased seizure latency of Scn1a+/− rats at P21. n = 6 per group, Mann–Whitney U test; *p < 0.05. Data are presented as mean ± SEM. BTN, bumetanide; NS, normal saline; P, postnatal day; M1, primary motor cortex; CI, confidence interval; M2, secondary motor cortex; CPu, caudate-putamen (striatum); LGP, lateral globus pallidus; RSGb, retrosplenial granular b cortex; DG, dentate gyrus; S1BF, primary somatosensory cortex, barrel field; Au1, primary auditory cortex; VPM, ventral posteromedial thalamic nucleus; VPL, ventral posterolateral thalamic nucleus; nRT, reticular thalamic nucleus; LHb, lateral habenular nucleus; CA3, CA3 field of the hippocampus; V1B, primary visual cortex, binocular area; V2L, secondary visual cortex, lateral area; Vermis, cerebellar vermis; Hemisphere, cerebellar hemisphere; SEM, standard error of the mean.
3.5. NKCC1 inhibitor increased the threshold for heat-induced seizures in Scn1a+/− rats at P21
To investigate whether bumetanide also relieves seizures in Scn1a+/− rats, we examined changes in seizure characteristics in bumetanide-treated Scn1a+/− rats. After the administration of bumetanide (n = 6, body weight range 36–39 g) or normal saline (n = 6, 32–41 g) to Scn1a+/− rats as previously described, seizures were induced on P21 by a 45°C-hot water bath (Figure 2C). Seizure latency, seizure duration, and Racine's seizure score were compared between bumetanide- and saline-treated Scn1a+/− rats. Although there was no significant difference in seizure duration (166.5 s [135.3–204.8] vs. 144.0 s [135.8–163.0], Mann–Whitney U test, U = 12.0, Z = −0.962, p = 0.34) or seizure score (4.0 [3.8–4.0] vs. 3.5 [2.8–4.0], Mann–Whitney U test, U = 11.5, Z = −1.251, p = 0.21), the seizure latency was significantly prolonged in bumetanide-treated rats (183.0 s [173.3–196.0] vs. 158.0 s [154.0–170.0], Mann–Whitney U test, U = 2.0, Z = −2.567, p = 0.01) (median [interquartile range]) (Figure 4B). These results indicate that bumetanide increased the seizure threshold but did not mitigate seizure severity in Scn1a+/− rats.
3.6. NKCC1 inhibitor did not affect brain activity or heat-induced seizures in Scn1a+/− rats at P27
We conducted a similar experiment in Scn1a+/− rats at P27 to confirm whether the transiently observed decrease in T1post meant that [Cl−]i decrease was completed after P21. After daily bumetanide or normal saline administration from P12 to P26, we compared T1post between wild-type (bumetanide-treated: n = 6, 44–58 g; saline-treated: n = 6, 44–63 g) and Scn1a+/− (bumetanide-treated: n = 6, 62–64 g; saline-treated: n = 6, 60–64 g) rats using MEMRI at P27 (Figure 2B). ANCOVA for T1post showed no significant interaction among genotypes, ROIs, and drug administration [F(16, 319) = 0.43, p = 0.97]. Tukey multiple-comparison test with respect to the interaction showed no significant difference in T1post between bumetanide- and saline-treated Scn1a+/− rats in any ROI (Figure 5A). We also compared heat-induced seizure characteristics of bumetanide-treated (n = 7, 56–66 g) and saline-treated (n = 7, 58–69 g) Scn1a+/− rats on P27 (Figure 2C). There were no significant differences in seizure latency (113.0 s [106.0–130.0] vs. 120.0 s [113.0–148.0], Mann–Whitney U-test, U = 16.5, Z = −1.027, p = 0.31), seizure duration (157.0 s [122.0–182.0] vs. 168.0 s [124.0–209.0], Mann–Whitney U test, U = 21.0, Z = −0.447, p = 0.66), or Racine's seizure score (5.0 [5.0–5.0] vs. 5.0 [5.0–5.0], Mann–Whitney U-test, U = 24.5, Z = 0.000, p = 1.00) (Figure 5B). These results support the hypothesis that in Scn1a+/− rats, the [Cl−]i decreased in widespread brain regions during the fourth postnatal week contributing to an overall improvement in seizure threshold.
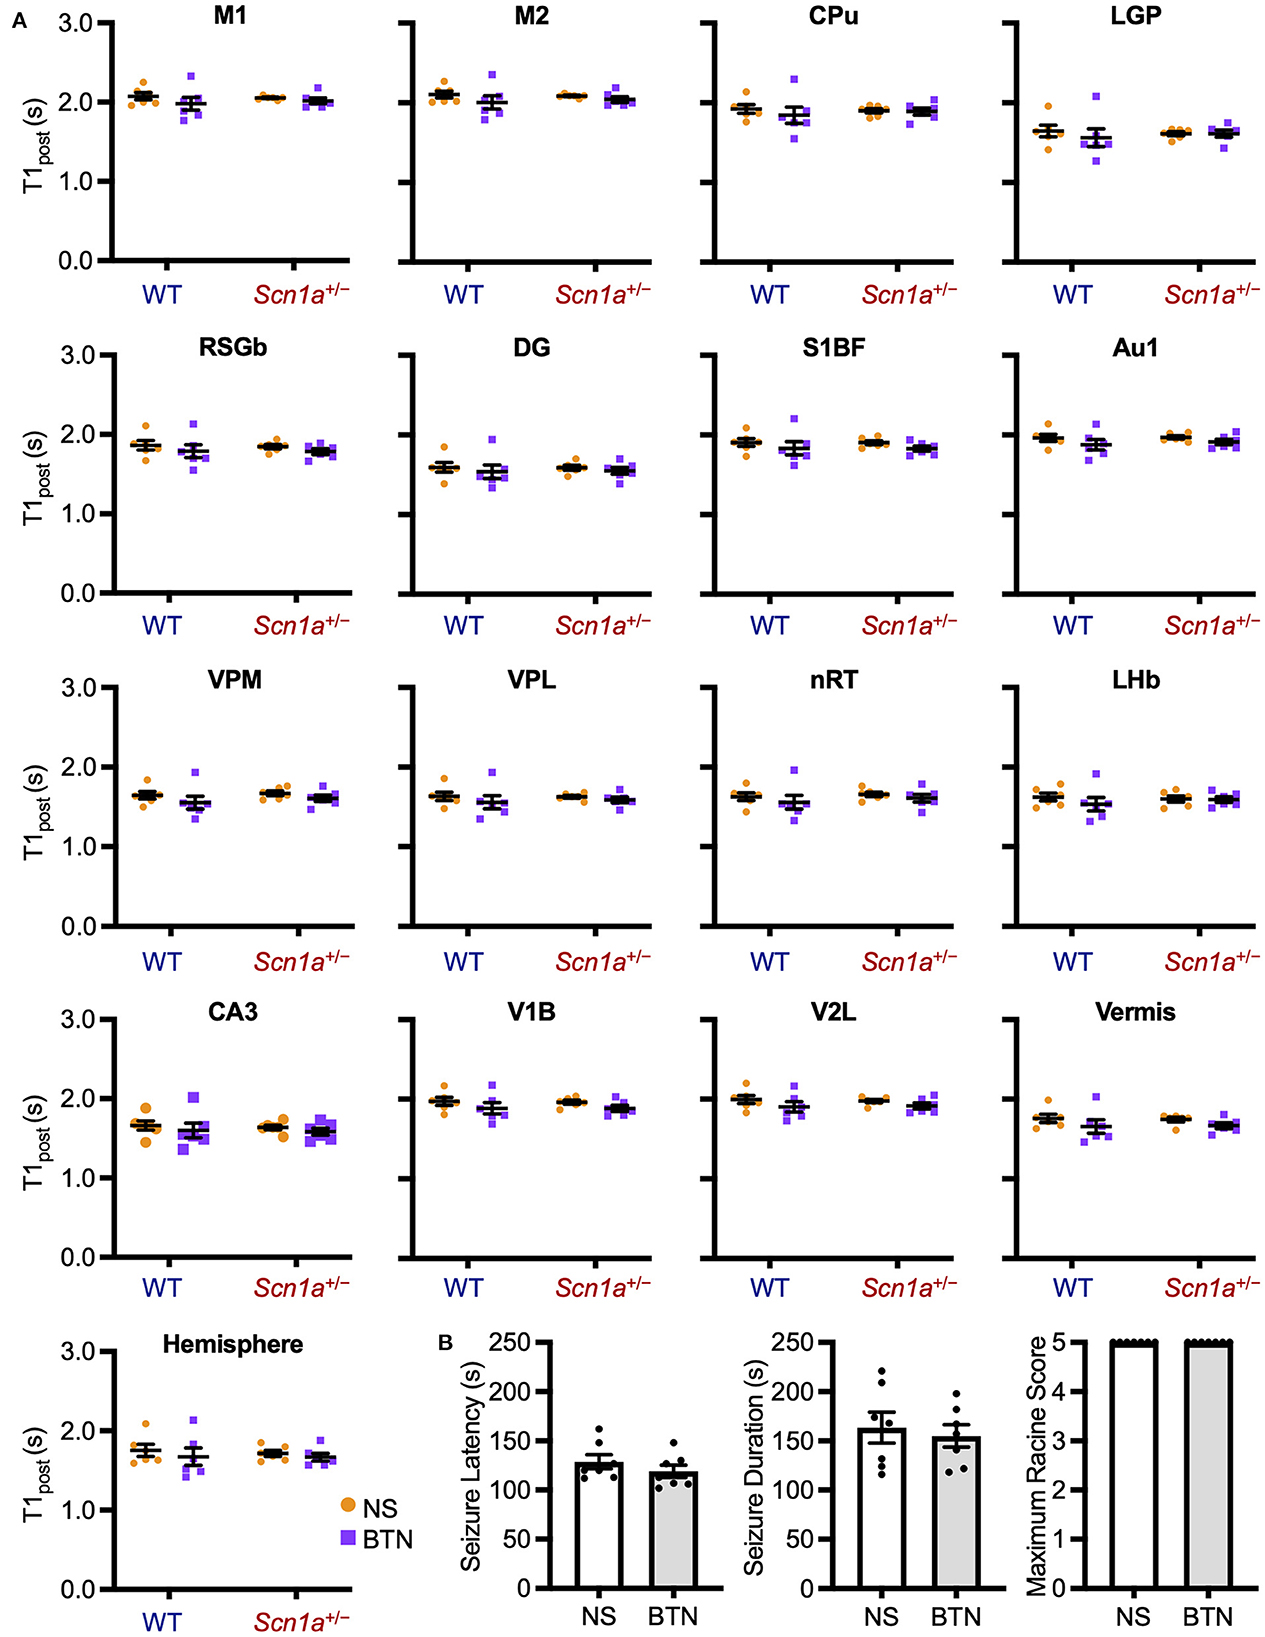
Figure 5. T1post at P27 of wild-type and Scn1a+/− rats after administration of BTN or NS. (A) Tukey multiple-comparison test of T1post in rats at P27 after administration of BTN (orange circle) or NS (purple square). There was no significant difference in T1post between BTN-treated and NS-treated Scn1a+/− rats. n = 6 per group (Tukey multiple-comparison test). Data are presented as mean ± SEM. (B) Comparison of seizure latency, seizure duration, and seizure score of Scn1a+/− rats at P27 between the BTN-treated and NS-treated groups. BTN did not affect the seizure characteristics at P27. n = 7 per group, Mann–Whitney U test. Data are presented as mean ± SEM. BTN, bumetanide; NS, normal saline; P, postnatal day; SEM, standard error of the mean.
4. Discussion
This study characterized the developmental changes in basal brain activity of Scn1a knockout rats by using MEMRI and identified a transient P19–22 hyperactivity of the brain.
Our newly generated Scn1a knockout rats had a milder phenotype than the Scn1a+/− mice. The Scn1a+/− rats showed a few spontaneous/reflex seizures, but no premature death occurred during the experimental period. Contrastingly, Scn1a+/− mice show spontaneous seizures more frequently from the third postnatal week and showed premature death in about 35% of pups (18–20), mainly due to status epilepticus and/or malnutrition. These phenotypic differences may be due to species differences and/or epigenetic factors. Generally, rats are reported to have milder epileptic phenotypes than mice (42). However, our knockout rats had a truncating variant in Scn1a, a reduced brain NaV1.1 protein level, and heat-induced seizures were observed in all Scn1a+/− rats. Additionally, all Scn1a−/− rats died by the second postnatal week. These findings clearly indicate a significant involvement of the pathogenic process caused by Scn1a defects in our rats. The body weight gain of Scn1a+/− rats was not impaired and their nutritional status was good. Thus, the MEMRI findings in Scn1a+/− rats purely reflect the Scn1a pathology with a minimal influence of spontaneous seizures, status epilepticus, and malnutrition.
MEMRI revealed a significant widespread increase in the basal brain activity of Scn1a+/− rats at P19–22, which corresponds to approximately 6 months of age in humans (34). This is when seizures most commonly develop in DS (1, 4, 35). Interestingly, the increase in brain activity was not significant in the fourth postnatal week. This temporal pattern of change, with stronger alterations around the onset age, has also been observed in other studies. Favero et al. (43) reported transient firing impairment of parvalbumin-positive GABAergic interneurons in Scn1a+/− mice from P18 to P21, which subsided with age (43). The decrease in background EEG activity in DS mice compared to that in wild-type mice was more significant in the third postnatal week than in any other age (44). These observations indicate that the enhanced functional imbalance during this period due to impaired neuronal development associated with Scn1a defects possibly drives the onset and underlies frequent CSE during the early stage of DS.
The mechanisms underlying the P19–22 brain hyperactivity remain unknown. In wild-type rodents, the second to third postnatal week is the period when dynamic changes in the inhibitory network occurs. The D-H switch is mostly completed by the second postnatal week (36, 37, 39–41). The expression of NaV1.1 starts to increase during the second postnatal week (7, 45). A functional maturation in intrinsic electrophysiological functions of parvalbumin-positive GABAergic interneurons, such as fast spike frequencies and GABAergic synaptogenesis in fast-spiking cells, is achieved during the second to fourth postnatal week in rodents (46–48). The established mechanism of DS, impaired firing of GABAergic interneurons, especially of parvalbumin-positive cells (43), during this period, will be involved in increasing the brain activity. In this study, however, we found that bumetanide improved this hyperactivity and raised the threshold of heat-induced seizures at the third postnatal week but not at the fourth postnatal week. Thus, in the third postnatal week in Scn1a+/− rats may have higher [Cl−]i compared to wild-type rats, due to a lower expression ratio of KCC2/NKCC1, and attain the same level by the fourth postnatal week. Decrease of [Cl−]i is a critical maturation step in GABAA receptor signaling represented by D-H switch and the strength of inward Cl− current. Even if the D-H switch is achieved, [Cl−]i may still remain high as NaV1.1 gradually increases from the second postnatal week, resulting in a reduced inhibitory response in addition to impaired firing of GABAergic interneurons. This may lead to changes in calcium homeostasis throughout the brain in Scn1a+/− rats. Subsequently, with increased NaV1.1 expression, [Cl−]i may decrease and calcium homeostasis may become identical to that of wild-type. It is unclear whether catch-up is achieved in more severe phenotypes such as DS. However, the pathological changes due to NaV1.1-haploinsufficiency may result in delayed maturation of inhibitory neural networks in the early stage of the disease. To confirm this hypothesis, elaborate electrophysiological analysis, including postsynaptic potentials and equilibrium potentials of Cl− are necessary. In vitro electrophysiological experiments may be significantly influenced by the effects of non-physiological brain conditions, such as the changes in neuronal properties caused by slicing or pipetting, as well as the components of the internal or extracellular solution (49), making it challenging to detect minor electrophysiological changes. Notably, a prior study using electrophysiological recordings from hippocampal CA3 pyramidal cells at P13–21 found giant depolarizing potentials and a depolarized reversal potential for GABAA-evoked currents in Scn1b−/− mice, although this was less evident in Scn1a+/− mice (50). Therefore, it is not known whether depolarizing GABAA receptor signaling remains in Scn1a-related DS during the third postnatal week. Combined with a decreased firing capacity of GABAergic interneurons, the present results suggest that the immature and still-insufficient inhibitory response due to higher [Cl−]i of postsynaptic neurons may be involved in the transient brain hyperactivity and seizure susceptibility at P19–22.
In our study, increased neural activity in CA3, habenular nucleus, and caudate-putamen in Scn1a+/− rats at P35–38 was suggested. These findings may be related to some clinical features of DS that occur at this age, including epilepsy and nonepileptic manifestations. To elucidate this, a combination of functional neuroimaging, electrophysiology, and behavioral analysis is necessary. It would be also useful to evaluate changes in neural activity in these regions in Scn1a+/− rats using MEMRI by administering several antiepileptic drugs, including carbamazepine, which is known to aggravate seizures in patients with SCN1A loss-of-function mutations.
The limitations of this study are as follows. First, the pathophysiology behind the transient increase in brain activity observed in the third postnatal week in Scn1a+/− rats has been discussed based on the results of the bumetanide experiments and previous reports but remains a hypothetical interpretation because this has not been directly verified. As mentioned above, it is necessary to conduct high-precision electrophysiological experiments and analyze [Cl−]i, GABA reversal potentials, and the NKCC1/KCC2 expression ratio in the neurons at the single-cell level. We intend to verify this in future studies. Second, only male rats were included in this study. This was to avoid the influence of sex differences in cerebral development, including the NKCC1/KCC2 expression ratio, which has been documented (40, 41). However, future analyses in female rats are necessary for an accurate understanding of this pathology. Third, to achieve the initial goal of elucidating the pathology of DS, we generated Scn1a knockout rats for high-resolution MEMRI experiments. However, the phenotype of Scn1a+/− rats was found to be milder than that of DS mice. Therefore, the present results showing that the differences in brain activity were no longer significant during the fourth postnatal week could have been different if MEMRI had been performed in a well-established mouse model for DS. Nevertheless, as mentioned above, the Scn1a knockout rats certainly reflect the pathogenesis of NaV1.1 haploinsufficiency and are less affected by additional factors such as status epilepticus, frequent spontaneous seizures, malnutrition, and premature death. Therefore, the Scn1a knockout rats are expected to be more suitable for studying the pathogenesis of Scn1a-related developmental encephalopathy. The MEMRI findings in Scn1a+/− rats may lead to a better understanding of the pathology directly related to Scn1a deficiency. The Scn1a+/− rats may also be used in the future to investigate various environmental factors that contribute to the formation of the DS phenotype.
In conclusion, we characterized age-dependent changes in brain activity of developing Scn1a+/− rats using MEMRI that allowed high-resolution analysis at the whole-brain level in vivo and visualization of drug-induced changes in brain activity at each region. We believe that MEMRI can be a potential technique to uncover unrecognized aspects of various developmental and epileptic encephalopathies and can be applied to future rodent research.
Data availability statement
The datasets presented in this study can be found in online repositories. The names of the repository/repositories and accession number(s) can be found at: figshare, https://dx.doi.org/10.6084/m9.figshare.12894698.
Ethics statement
The animal study was reviewed and approved by the Animal Research Committee of Kyoto University and the Institutional Animal Care and Use Committee of the Jikei University School of Medicine.
Author contributions
MT, NH, and JH contributed to the conception and design of the study. MT, NH, JH, MN, KI, SH, TK, TM, TS, and TY performed data acquisition and analysis. MT, NH, JH, MN, and HJO wrote the manuscript and prepared the figures. All authors contributed to the article and approved the submitted version.
Funding
This work was supported in part by the JSPS KAKENHI Grants JP20H03630 and JP20H03651 (SH), JP26461552, JP18K07802, and JP21K07780 (NH); AMED Grant JP21ek0109505 (SH) and JP22bm0804023h0003 (NH); grants from the Science Research Promotion Funds (G19001 and G20001) (SH); research grants from Kawano Masanori Memorial Public Interest Incorporated Foundation for Promotion of Pediatrics (NH and MT), The Mother and Child Health Foundation (NH), and The Japan Epilepsy Research Foundation (NH).
Acknowledgments
We wish to acknowledge Fusao Kato, Professor, Division of Neuroscience, Research Center for Medical Sciences, The Jikei University School of Medicine, for his scientific advice on this research and Hiroyuki Ida, Professor, Department of Pediatrics, The Jikei University School of Medicine, for his sincere encouragement. We are indebted to Yoshiko Shimamoto and Miki Ogawa for their excellent technical assistance.
Conflict of interest
The authors declare that the research was conducted in the absence of any commercial or financial relationships that could be construed as a potential conflict of interest.
Publisher's note
All claims expressed in this article are solely those of the authors and do not necessarily represent those of their affiliated organizations, or those of the publisher, the editors and the reviewers. Any product that may be evaluated in this article, or claim that may be made by its manufacturer, is not guaranteed or endorsed by the publisher.
Supplementary material
The Supplementary Material for this article can be found online at: https://www.frontiersin.org/articles/10.3389/fneur.2023.1125089/full#supplementary-material
References
1. Dravet C. The core Dravet syndrome phenotype. Epilepsia. (2011) 52:3–9. doi: 10.1111/j.1528-1167.2011.02994.x
2. Gataullina S, Dulac O. From genotype to phenotype in Dravet disease. Seizure. (2017) 44:58–64. doi: 10.1016/j.seizure.2016.10.014
3. Genton P, Velizarova R, Dravet C. Dravet syndrome: the long-term outcome. Epilepsia. (2011) 52:44–9. doi: 10.1111/j.1528-1167.2011.03001.x
4. Shmuely S, Sisodiya SM, Gunning WB, Sander JW, Thijs RD. Mortality in Dravet syndrome: a review. Epilepsy Behav. (2016) 64:69–74. doi: 10.1016/j.yebeh.2016.09.007
5. Bureau M, Bernardina BD. Electroencephalographic characteristics of Dravet syndrome. Epilepsia. (2011) 52:13–23. doi: 10.1111/j.1528-1167.2011.02996.x
6. Marini C, Scheffer IE, Nabbout R, Suls A, De Jonghe P, Zara F, et al. The genetics of Dravet syndrome. Epilepsia. (2011) 52:24–9. doi: 10.1111/j.1528-1167.2011.02997.x
7. Ogiwara I, Miyamoto H, Morita N, Atapour N, Mazaki E, Inoue I, et al. Nav11 localizes to axons of parvalbumin-positive inhibitory interneurons: a circuit basis for epileptic seizures in mice carrying an Scn1a gene mutation. J Neurosci. (2007) 27:5903–14. doi: 10.1523/JNEUROSCI.5270-06.2007
8. Dutton SB, Makinson CD, Papale LA, Shankar A, Balakrishnan B, Nakazawa K, et al. Preferential inactivation of SCN1A in parvalbumin interneurons increases seizure susceptibility. Neurobiol Dis. (2013) 49:211–20. doi: 10.1016/j.nbd.2012.08.012
9. Yu FH, Mantegazza M, Westenbroek RE, Robbins CA, Kalume F, Burton KA, et al. Reduced sodium current in GABAergic interneurons in a mouse model of severe myoclonic epilepsy in infancy. Nat Neurosci. (2006) 9:1142–9. doi: 10.1038/nn1754
10. Higurashi N, Uchida T, Lossin C, Misumi Y, Okada Y, Akamatsu W, et al. A human Dravet syndrome model from patient induced pluripotent stem cells. Mol Brain. (2013) 6:1–12. doi: 10.1186/1756-6606-6-19
11. Silva AC, Lee JH, Aoki I, Koretsky AP. Manganese-enhanced magnetic resonance imaging (MEMRI): methodological and practical considerations. NMR Biomed. (2004) 17:532–43. doi: 10.1002/nbm.945
12. Yang J, Li Q. Manganese-enhanced magnetic resonance imaging: application in centralnervous system diseases. Front Neurol. (2020) 11:1–16. doi: 10.3389/fneur.2020.00143
13. Aoki I, Wu YJL, Silva AC, Lynch RM, Koretsky AP. In vivo detection of neuroarchitecture in the rodent brain using manganese-enhanced MRI. Neuroimage. (2004) 22:1046–59. doi: 10.1016/j.neuroimage.2004.03.031
14. Watanabe T, Frahm J, Michaelis T. Functional mapping of neural pathways in rodent brain in vivo using manganese-enhanced three-dimensional magnetic resonance imaging. NMR Biomed. (2004) 17:554–68. doi: 10.1002/nbm.937
15. Alvestad S, Goa PE, Qu H, Risa Ø, Brekken C, Sonnewald U, et al. In vivo mapping of temporospatial changes in manganese enhancement in rat brain during epileptogenesis. Neuroimage. (2007) 38:57–66. doi: 10.1016/j.neuroimage.2007.07.027
16. Immonen RJ, Kharatishvili I, Sierra A, Einula C, Pitkänen A, Gröhn OHJ. Manganese enhanced MRI detects mossy fiber sprouting rather than neurodegeneration, gliosis or seizure-activity in the epileptic rat hippocampus. Neuroimage. (2008) 40:1718–30. doi: 10.1016/j.neuroimage.2008.01.042
17. Malheiros JM, Persike DS, Castro LUC de, Sanches TRC, Andrade L da C, Tannús A, et al. Reduced hippocampal manganese-enhanced MRI (MEMRI) signal during pilocarpine-induced status epilepticus: edema or apoptosis? Epilepsy Res. (2014) 108:644–52. doi: 10.1016/j.eplepsyres.2014.02.007
18. Oakley JC, Kalume F, Yu FH, Scheuer T, Catterall WA. Temperature- and age-dependent seizures in a mouse model of severe myoclonic epilepsy in infancy. Proc Natl Acad Sci U S A. (2009) 106:3994–9. doi: 10.1073/pnas.0813330106
19. Hawkins NA, Anderson LL, Gertler TS, Laux L, George AL, Kearney JA. Screening of conventional anticonvulsants in a genetic mouse model of epilepsy. Ann Clin Transl Neurol. (2017) 4:326–39. doi: 10.1002/acn3.413
20. Kalume F, Westenbroek RE, Cheah CS Yu FH, Oakley JC, Scheuer T, et al. Sudden unexpected death in a mouse model of Dravet syndrome. J Clin Invest. (2013) 123:1798–808. doi: 10.1172/JCI66220
21. Dzhala VI, Talos DM, Sdrulla DA, Brumback AC, Mathews GC, Benke TA, et al. NKCC1 transporter facilitates seizures in the developing brain. Nat Med. (2005) 11:1205–13. doi: 10.1038/nm1301
22. Sakuma T, Ochiai H, Kaneko T, Mashimo T, Tokumasu D, Sakane Y, et al. Repeating pattern of non-RVD variations in DNA-binding modules enhances TALEN activity. Sci Rep. (2013) 3:1–8. doi: 10.1038/srep03379
23. Mashimo T, Kaneko T, Sakuma T, Kobayashi J, Kunihiro Y, Voigt B, et al. Efficient gene targeting by TAL effector nucleases co-injected with exonucleases in zygotes. Sci Rep. (2013) 3:1–6. doi: 10.1038/srep01253
24. Massaad CA, Pautler RG. Manganese-enhanced magnetic resonance imaging (MEMRI). Methods Mol Biol. (2010) 711:145–74. doi: 10.1007/978-1-61737-992-5_7
25. Mazarati A, Shin D, Sankar R. Bumetanide inhibits rapid kindling in neonatal rats. Epilepsia. (2009) 50:2117–22. doi: 10.1111/j.1528-1167.2009.02048.x
26. Brandt C, Nozadze M, Heuchert N, Rattka M, Löscher W. Disease-modifying effects of phenobarbital and the NKCC1 inhibitor bumetanide in the pilocarpine model of temporal lobe epilepsy. J Neurosci. (2010) 30:8602–12. doi: 10.1523/JNEUROSCI.0633-10.2010
27. Hayashi K, Ueshima S, Ouchida M, Mashimo T, Nishiki T, Sendo T, et al. Therapy for hyperthermia-induced seizures in Scn1a mutant rats. Epilepsia. (2011) 52:1010–7. doi: 10.1111/j.1528-1167.2011.03046.x
28. Racine RJ. Modification of seizure activity by electrical stimulation. II. Motor seizure. Electroencephalogr Clin Neurophysiol. (1972) 32:281–294. doi: 10.1016/0013-4694(72)90177-0
29. Hinkelmann K, Kempthrone O. Design and Analysis of Experiments. Hoboken: John Wiley& Sons (1994).p 454.
30. Kikuta S, Nakamura Y, Yamamura Y, Tamura A, Homma N, Yanagawa Y, et al. Quantitative activation-induced manganese-enhanced MRI reveals severity of Parkinsons disease in mice. Sci Rep. (2015) 5: 800. doi: 10.1038/srep12800
31. Fontaine SN, Ingram A, Cloyd RA, Meier SE, Miller E, Lyons D, et al. Identification of changes in neuronal function as a consequence of aging and tauopathic neurodegeneration using a novel and sensitive magnetic resonance imaging approach. Neurobiol Aging. (2017) 56:78–86. doi: 10.1016/j.neurobiolaging.2017.04.007
32. Deoni SCL, Mercure E, Blasi A, Gasston D, Thomson A, Johnson M, et al. Mapping infant brain myelination with magnetic resonance imaging. J Neurosci. (2011) 31:784–91. doi: 10.1523/JNEUROSCI.2106-10.2011
33. Deoni SCL, Dean DC, Remer J, Dirks H, O'Muircheartaigh J. Cortical maturation and myelination in healthy toddlers and young children. Neuroimage. (2015) 115:147–61. doi: 10.1016/j.neuroimage.2015.04.058
35. Cheah CS, Westenbroek RE, Roden WH, Kalume F, Oakley JC, Jansen LA, et al. Correlations in timing of sodium channel expression, epilepsy, and sudden death in Dravet syndrome. Channels. (2013) 7:468–72. doi: 10.4161/chan.26023
36. Rivera C, Voipio J, Payne JA, Ruusuvuori E, Lahtinen H, Lamsa K, et al. The K+/Cl- co-transporter KCC2 renders GABA hyperpolarizing during neuronal maturation. Nature. (1999) 397:251–5. doi: 10.1038/16697
37. Tyzio R, Holmes GL, Ben-Ari Y, Khazipov R. Timing of the developmental switch in GABAA mediated signaling from excitation to inhibition in CA3 rat hippocampus using gramicidin perforated patch and extracellular recordings. Epilepsia. (2007) 48:96–105. doi: 10.1111/j.1528-1167.2007.01295.x
38. Berglund K, Schleich W, Krieger P, Loo LS, Wang D, Cant NB, et al. Imaging synaptic inhibition in transgenic mice expressing the chloride indicator, Clomeleon. Brain Cell Biol. (2006) 35:207–28. doi: 10.1007/s11068-008-9019-6
39. Ben-Ari Y, Gaiarsa JL, Tyzio R, Khazipov R, GABA. A pioneer transmitter that excites immature neurons and generates primitive oscillations. Physiol Rev. (2007) 87:1215–84. doi: 10.1152/physrev.00017.2006
40. Galanopoulou AS, Kyrozis A, Claudio OI, Stanton PK, Moshé SL. Sex-specific KCC2 expression and GABAA receptor function in rat substantia nigra. Exp Neurol. (2003) 183:628–37. doi: 10.1016/S0014-4886(03)00213-9
41. Kyrozis A, Chudomel O, Moshé SL, Galanopoulou AS. Sex-dependent maturation of GABAA receptor-mediated synaptic events in rat substantia nigra reticulata. Neurosci Lett. (2006) 398:1–5. doi: 10.1016/j.neulet.2005.12.018
42. Loscher W, Ferland RJ FT. The relevance of inter- and intrastrain differences in mice and rats and their implications for models of seizures and epilepsy. Epilepsy Behav. (2017). 139–148 p. doi: 10.1016/j.yebeh.2017.05.040
43. Favero M, Sotuyo NP, Lopez E, Kearney JA, Goldberg EM, A. transient developmental window of fast-spiking interneuron dysfunction in a mouse model of dravet syndrome. J Neurosci. (2018) 38:7912–27. doi: 10.1523/JNEUROSCI.0193-18.2018
44. Fadila S, Quinn S, Turchetti Maia A, Yakubovich D, Ovadia M, Anderson KL, et al. Convulsive seizures and some behavioral comorbidities are uncoupled in the Scn1aA1783V Dravet syndrome mouse model. Epilepsia. (2020) 61:2289–300. doi: 10.1111/epi.16662
45. Gazina E V, Richards KL, Mokhtar MBC, Thomas EA, Reid CA, Petrou S. Differential expression of exon 5 splice variants of sodium channel α subunit mRNAs in the developing mouse brain. Neuroscience. (2010) 166:195–200. doi: 10.1016/j.neuroscience.2009.12.011
46. Goldberg EM, Jeong HY, Kruglikov I, Tremblay R, Lazarenko RM, Rudy B. Rapid developmental maturation of neocortical FS cell intrinsic excitability. Cereb Cortex. (2011) 21:666–82. doi: 10.1093/cercor/bhq138
47. Pangratz-Fuehrer S, Hestrin S. Synaptogenesis of electrical and GABAergic synapses of fast-spiking inhibitory neurons in the neocortex. J Neurosci. (2011) 31:10767–75. doi: 10.1523/JNEUROSCI.6655-10.2011
48. Chattopadhyaya B, Di Cristo G, Higashiyama H, Knott GW, Kuhlman SJ, Welker E, et al. Experience and activity-dependent maturation of perisomatic GABAergic innervation in primary visual cortex during a postnatal critical period. J Neurosci. (2004) 24:9598–611. doi: 10.1523/JNEUROSCI.1851-04.2004
49. Dzhala VI, Staley KJ. Excitatory actions of endogenously released GABA contribute to initiation of ictal epileptiform activity in the developing hippocampus. J Neurosci. (2003) 23:1840–6. doi: 10.1523/JNEUROSCI.23-05-01840.2003
Keywords: bumetanide (BTN), developmental and epileptic encephalopathy (DEE), gamma-aminobutyric acid (GABA), functional neuroimaging, Dravet syndrome (DS)
Citation: Tahara M, Higurashi N, Hata J, Nishikawa M, Ito K, Hirose S, Kaneko T, Mashimo T, Sakuma T, Yamamoto T and Okano HJ (2023) Developmental changes in brain activity of heterozygous Scn1a knockout rats. Front. Neurol. 14:1125089. doi: 10.3389/fneur.2023.1125089
Received: 15 December 2022; Accepted: 20 February 2023;
Published: 14 March 2023.
Edited by:
Hua-Jun Feng, Massachusetts General Hospital and Harvard Medical School, United StatesReviewed by:
Jianxiang Liao, Shenzhen Children's Hospital, ChinaMaria Augusta Montenegro, University of California, San Diego, United States
Copyright © 2023 Tahara, Higurashi, Hata, Nishikawa, Ito, Hirose, Kaneko, Mashimo, Sakuma, Yamamoto and Okano. This is an open-access article distributed under the terms of the Creative Commons Attribution License (CC BY). The use, distribution or reproduction in other forums is permitted, provided the original author(s) and the copyright owner(s) are credited and that the original publication in this journal is cited, in accordance with accepted academic practice. No use, distribution or reproduction is permitted which does not comply with these terms.
*Correspondence: Norimichi Higurashi, nori_@jikei.ac.jp; Hirotaka James Okano, hjokano@jikei.ac.jp