 Silvia Faccioli
 Angela Cavalagli3†
- 1Children Rehabilitation Unit, Azienda Unità Sanitaria Locale IRCCS di Reggio Emilia, Reggio Emilia, Italy
- 2Clinical and Experimental Medicine, Department of Biomedical, Metabolic and Neural Sciences, University of Modena and Reggio Emilia, Modena, Italy
- 3Children Rehabilitation Unit, IRCCS Fondazione Don Carlo Gnocchi, Milano, Italy
- 4Office of Policy Evaluation and Statistical Studies, Umbria Legislative Assembly, Perugia, Italy
- 5Department of Physical Medicine and Rehabilitation, Azienda Sanitaria Provinciale 3 (ASP 3), Acireale Hospital, Catania, Italy
- 6Rehabilitation Center CMR, Adrano, Catania, Italy
Background: Hereditary spastic paraplegias (HSPs) are a group of inheritance diseases resulting in gait abnormalities, which may be detected using instrumented gait analysis. The aim of this systematic review was 2-fold: to identify specific gait analysis patterns and interventions improving gait in HSP subjects.
Methods: A systematic review was conducted in PubMed, Cochrane Library, REHABDATA, and PEDro databases, in accordance with reporting guidelines of PRISMA statement and Cochrane's recommendation. The review protocol was recorded on the PROSPERO register. Patients with pure and complicated HSP of any age were included. All types of studies were included. Risk of bias, quality assessment, and meta-analysis were performed.
Results: Forty-two studies were included: 19 were related to gait analysis patterns, and 24 were intervention studies. The latter ones were limited to adults. HSP gait patterns were similar to cerebral palsy in younger subjects and stroke in adults. Knee hyperextension, reduced range of motion at knee, ankle, and hip, reduced foot lift, and increased rapid trunk and arm movements were reported. Botulinum injections reduced spasticity but uncovered weakness and improved gait velocity at follow-up. Weak evidence supported intrathecal baclofen, active intensive physical therapy (i.e., robot-assisted gait training, functional exercises, and hydrotherapy), and functional electrical stimulation. Some improvements but adverse events were reported after transcranial magnetic stimulation, transcutaneous spinal direct current stimulation, and spinal cord stimulation implant.
Conclusion: Knee hyperextension, non-sagittal pelvic movements, and reduced ROM at the knee, ankle, and hip represent the most peculiar patterns in HSP, compared to diplegic cerebral palsy and stroke. Botulinum improved comfortable gait velocity after 2 months. Nonetheless, interventions reducing spasticity might result in ineffective functional outcomes unveiling weakness. Intensive active physical therapy and FES might improve gait velocity in the very short term.
1. Introduction
Hereditary spastic paraplegia (HSP) is a heterogeneous and large group of neurodegenerative diseases of which the main common feature is lower limb spasticity and weakness, based on the retrograde distal degeneration of the corticospinal and posterior column pathways (1). The key diagnostic clinical finding, characterizing the pure forms, is progressive upper motor neuron (UMN) syndrome of the lower limb which includes spasticity (1), hyperreflexia, extensor plantar responses, weakness, and loss of selective control (2, 3). In complicated forms (4), additional neurologic deficits are present, such as ataxia, amyotrophy, optic atrophy, pigmentary retinopathy, intellectual disability, extrapyramidal signs, dementia, deafness, ichthyosis, peripheral neuropathy, and epilepsy, with neuroimaging abnormalities such as cerebellar atrophy (2). Prevalence is estimated at 3–10 cases per 100.000 in the European population (2) and incidence at 1.27–9.6/100.000 (5). Depending on the presence or absence of a family history of spastic paraparesis and the results of genetic testing, the disease is named HSP or SSP, as sporadic (6). The genetic basis of HSP is complex, with more than 70 known subtypes involving autosomal, dominant or recessive, and X-linked inheritance patterns (1, 7), causing dysfunction of protein involved in intracellular trafficking or mitochondrial function (7, 8). The age of symptom onset, rate of progression, and degree of disability are often variable among different genetic types of HSP, as well as within individual families having the same gene mutation (6, 9, 10). Early childhood onset forms tend to be relatively non-progressive over many years, resembling spastic diplegia forms of cerebral palsy (11). On the contrary, late onset is associated with more progressive disease and gait decline (9, 12).
The gait impairment is the most frequent clinical sign in HSP patients, and it is often recognized as the onset symptom (10, 13). It results from the combination of several factors such as spasticity, weakness, loss of selective control, impaired proprioception, and vibratory sensitivity (3). Identifying the gait characteristics and evolution of HSP subjects is the key to develop a gait functional prognosis for this population and formulate appropriate interventions. In addition, differentiating the HSP gait pattern from similar ones, observed in other pathologies, is desirable to support differential diagnosis. Moreover, gait capacity and balance are mutually influenced; then, analyzing the gait pattern is also useful for identifying specific issues that increase the risk of falls (14). Computerized gait analysis (GA) is the best way to provide a reliable and repeatable measurement of specific gait parameters and impairments (6, 15). Some authors have investigated the deficits in gait in HSP using GA, compared to their healthy peers or other patients, mostly to stroke or spastic diplegic cerebral palsy (DCP) subjects. Nonetheless, no review has systematically summarized the evidence from these studies to comprehensively describe the different observed gait patterns. Some review studies have been published (16, 17) regarding treatment in HSP patients, but none focused on the effect of the rehabilitative treatment on gait function. The aim of the present systematic review was 2-fold: to identify which gait patterns characterize HSP patients using computed gait analysis and to identify which rehabilitative treatment (orthotic devices, botulinum toxin, physiotherapy, physical therapy, and other approaches) leads to improvement in any type of gait parameters in hereditary spastic paraplegia patients.
2. Methods
2.1. Search and selection
The present study consists of a systematic review of primary studies and was performed and reported in accordance with the reporting guidelines of the PRISMA statement (18) and Cochrane's methodological recommendation (19). The review protocol was registered on the PROSPERO public online register for systematic review, with registration number CRD42021290141. The study was conducted according to the pre-specified protocol, except for quality and risk-of-bias assessment, which was performed with more specific and adequate tools; in addition, a meta-analysis was performed.
The scope of the systematic review was structured according to the Patients, Intervention, Control, and Outcome (PICO) framework for intervention:
- P: patients of all ages with a diagnosis of pure or complicated form of HSP
- I: gait pattern description (3D gait analysis) or intervention to improve gait pattern (orthotic devices/botulinum toxin/physiotherapy/physical therapy, and other rehabilitative approaches).
- C: gait analysis pattern of healthy controls or of patients affected by other diseases and/or no intervention or different interventions to improve gait function in HSP
- O: variables of 3-dimensional gait analysis (kinematics and/or kinetics and/or surface electromyography and/or spatiotemporal parameters) for gait pattern description. Any gait parameter or outcome measure to assess gait improvement after intervention (gait analysis and/or walk/gait speed and/or mobility test and/or spatiotemporal parameters and/or any type of walking test).
A unique search strategy was considered including both aims of the present review, based on an overlap of keywords and terms. Search procedures are described in Supplementary Table 1. A literature search was performed on 10 May 2021 in four international databases (PubMed, Cochrane Library, REHABDATA, and PEDro). Articles published from the inception of databases to 10 May 2021 were searched, with no limit relative to the year of publication, language, age, and type of primary study design. Other articles were also obtained from the reference lists of articles identified by the primary search in the databases. Pharmacological treatments were excluded from the search because they were the object of a recent review study (16).
The population of interest included ambulatory HSP patients, able to perform gait analysis, with a definite diagnosis of HSP or HSP/SSP according to Harding or McDermott criteria (13, 20), with both pure and complicated forms, of all ages. Studies were included if they presented a gait analysis evaluation in HSP patients, with or without comparison with healthy or pathological controls. Studies assessing gait function, by means of any type of gait outcome measure, following an intervention, were also included. Outcomes of interest were the variables of computerized gait analysis (including spatiotemporal parameters and kinetic and kinematic variables) and any type of gait assessment only following gait-focused treatment. Exclusion criteria were as follows: animal study, languages different from English and Italian with no possibility to achieve an official translated version, ongoing study or lacking publication of results, and mixed samples without reporting specific results in HSP patients. According to these inclusion and exclusion criteria, all studies were screened first by title/abstract and then by full text by two independent groups of two authors each (SF, AC, GM, and IS). Each group was blind to each other's decisions. Any disagreement was resolved through discussion among authors. Not retrieved articles and ongoing studies were just recorded as not retrieved.
2.2. Data extraction
Two authors independently completed the data extraction (SF and AC), sorting the information into two different content areas, one focused on HSP gait-analysis-pattern description and the other focused on rehabilitative interventions to improve gait (intervention). The authors extracted data about study design and methodology, participant characteristics, protocol details, outcome measures, and results of the studies. Any disagreement among the authors was discussed and resolved by consensus.
2.3. Quality and risk-of-bias assessment
The quality of studies was assessed by means of a checklist approach using the Joanna Briggs Institute (JBI) critical appraisal tool (21) for case–control studies, case series, and case report studies. These scales enquired 8 to 10 items, questioning information regarding study design, population, intervention, and outcome details, and whenever appropriate, statistical analysis quality. According to the study by George et al. (22), a cutoff score >70% was considered a sufficient level of quality, while a quality score equal or lower suggested some methodological limitations. The National Institutes of Health (NHI) quality assessment tool (23, 24) was used for quality assessment in before-after (pre-post) studies without a control group, assigning a quality rating as “Good”, “Fair”, or “Poor” according to NIH guidance (23). This scale consists of 12 items questioning the studies' internal validity and risk of bias. The Physiotherapy Evidence Database (PEDro) scale (25) was used for randomized controlled studies (RCTs). It consists of 11 items enquiring information about inclusion criteria, randomization and assignation process, population features, blinding of patients and operators, dropout and missing data, results, and statistical analysis report. Total PEDro scores of 0–3 were considered “Poor”, 4–5 “Fair”, 6–8 “Good”, and 9–10 “Excellent”. The risk of bias (RoB) was assessed also with a domain-based approach using the Risk of Bias in Non-randomized Studies-of Interventions (ROBINS-I) (26, 27) tool in controlled studies and using version 2 of the Cochrane risk-of-bias (ROB2) tool for RCTs (specific for crossover design) (28, 29). The ROBINS tool enquired about the following dimensions: bias due to confounding (D1), in the selection of participants (D2) and the classification of interventions (D3), deviation from intended interventions (D4), missing outcome data (D5), bias in the measurement of the outcome (D6), and in the selection of the reported results (D7). The ROB2 tool enquired about the following dimensions: bias arising from the randomization process (D1) and from period and carryover effects (D1b), bias due to deviation from the intended intervention (D2), and to missing outcome data (D3), and bias in the measurement of the outcome (D4) and in the selection of the reported results (D5). The same two independent groups of reviewers (SF, AC, GM, and IS) assessed the methodological quality and the risk of bias of all the included studies. Any disagreement between the two groups was resolved through discussion among the authors. The assessment of quality and RoB did not provide criteria for excluding articles but for stratifying them.
2.4. Meta-analysis
Studies performing the same type of treatment, sharing almost one outcome measure, and having a sample >1 participant were selected for the meta-analysis.
The meta-analyses were carried out using R software (30) and the package “Metafor” (31) on the main results of the selected studies that include the number of observations (n), the means, and the standard deviations (sd). Heterogeneity among the studies was tested with Cochran's Q-test (32), which tests whether the variability in the observed effect sizes or outcomes is larger than would be expected based on sampling variability alone. The estimation of the weighted means was carried out via a fixed effect model when no significant heterogeneity was detected among studies, or a random effect model otherwise.
To evaluate the significance of the effect of the treatment at the different time points, a random effect model was used, estimating the standardized mean difference and reporting the 95% confidence interval as summary statistics. The standard deviation of the change was performed with the method suggested by Morris et al. (33), taking the correlation coefficient r = 0.40 as a conservative estimate.
Since studies might have differences in such aspects as quality, which might influence the result of meta-analysis, a sensitivity analysis was conducted changing the effect model and removing the studies with a higher risk of bias to confirm the robustness of our findings.
3. Results
Figure 1 provides details about study identification and selection (PRISMA flow diagram). A total of 527 records were found through database searches. Exclusion based on title/abstract screening resulted in 116 full texts being examined for eligibility, whereas 411 articles did not meet the inclusion criteria. After full-text analysis, 43 studies were finally included in the review and were divided as follows: 19 in the gait analysis pattern (GA pattern) database and 24 in the intervention database.
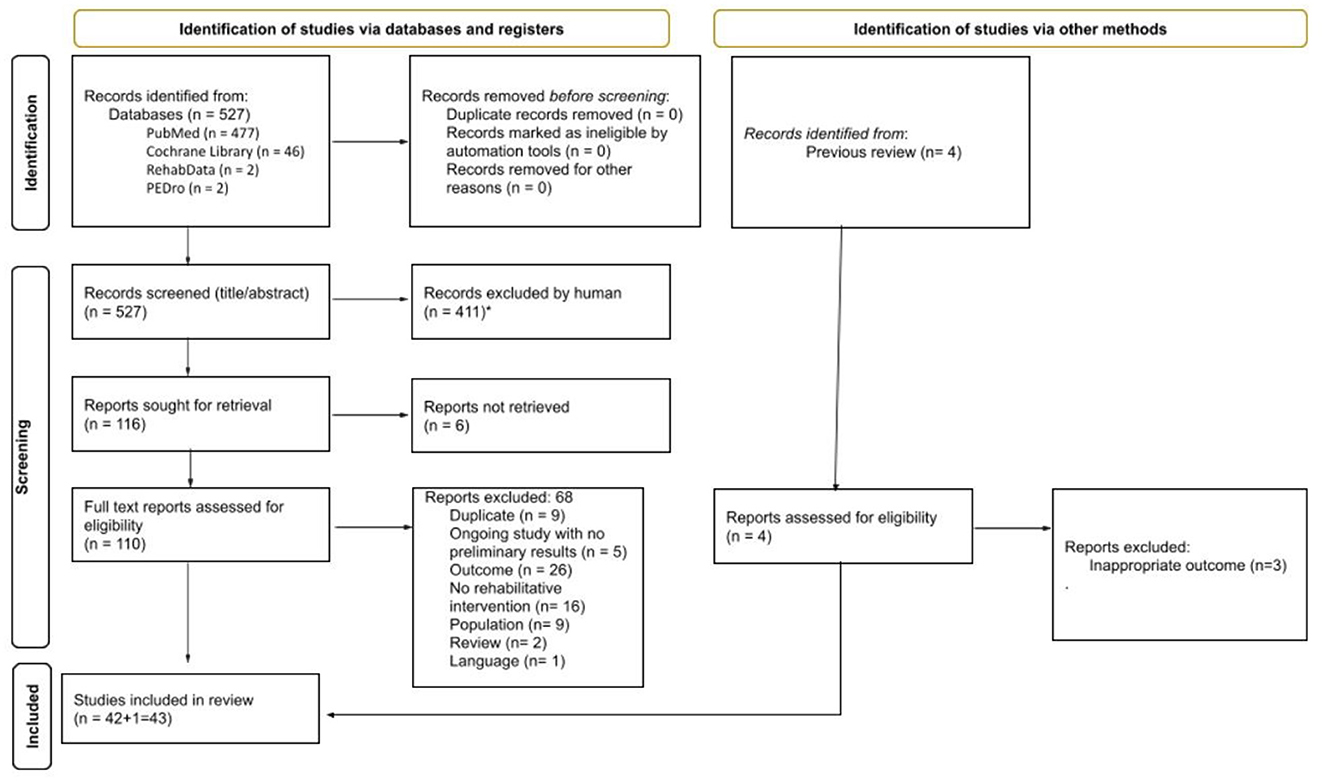
Figure 1. PRISMA flow diagram.
3.1. Quality and risk-of-bias assessment
The results of the quality assessment are represented in Tables 1, 2. An overall synthesis of RoB of included studies is represented in Figures 2, 3. Concerning the confounding factors, age, weight, time from onset, gender, walking abilities and/or aids, and gait analysis protocol were considered relevant to identify and compare gait analysis between groups. For intervention studies, examples of confounding include differences at baseline in patients' characteristics and co-interventions such as drug intake.
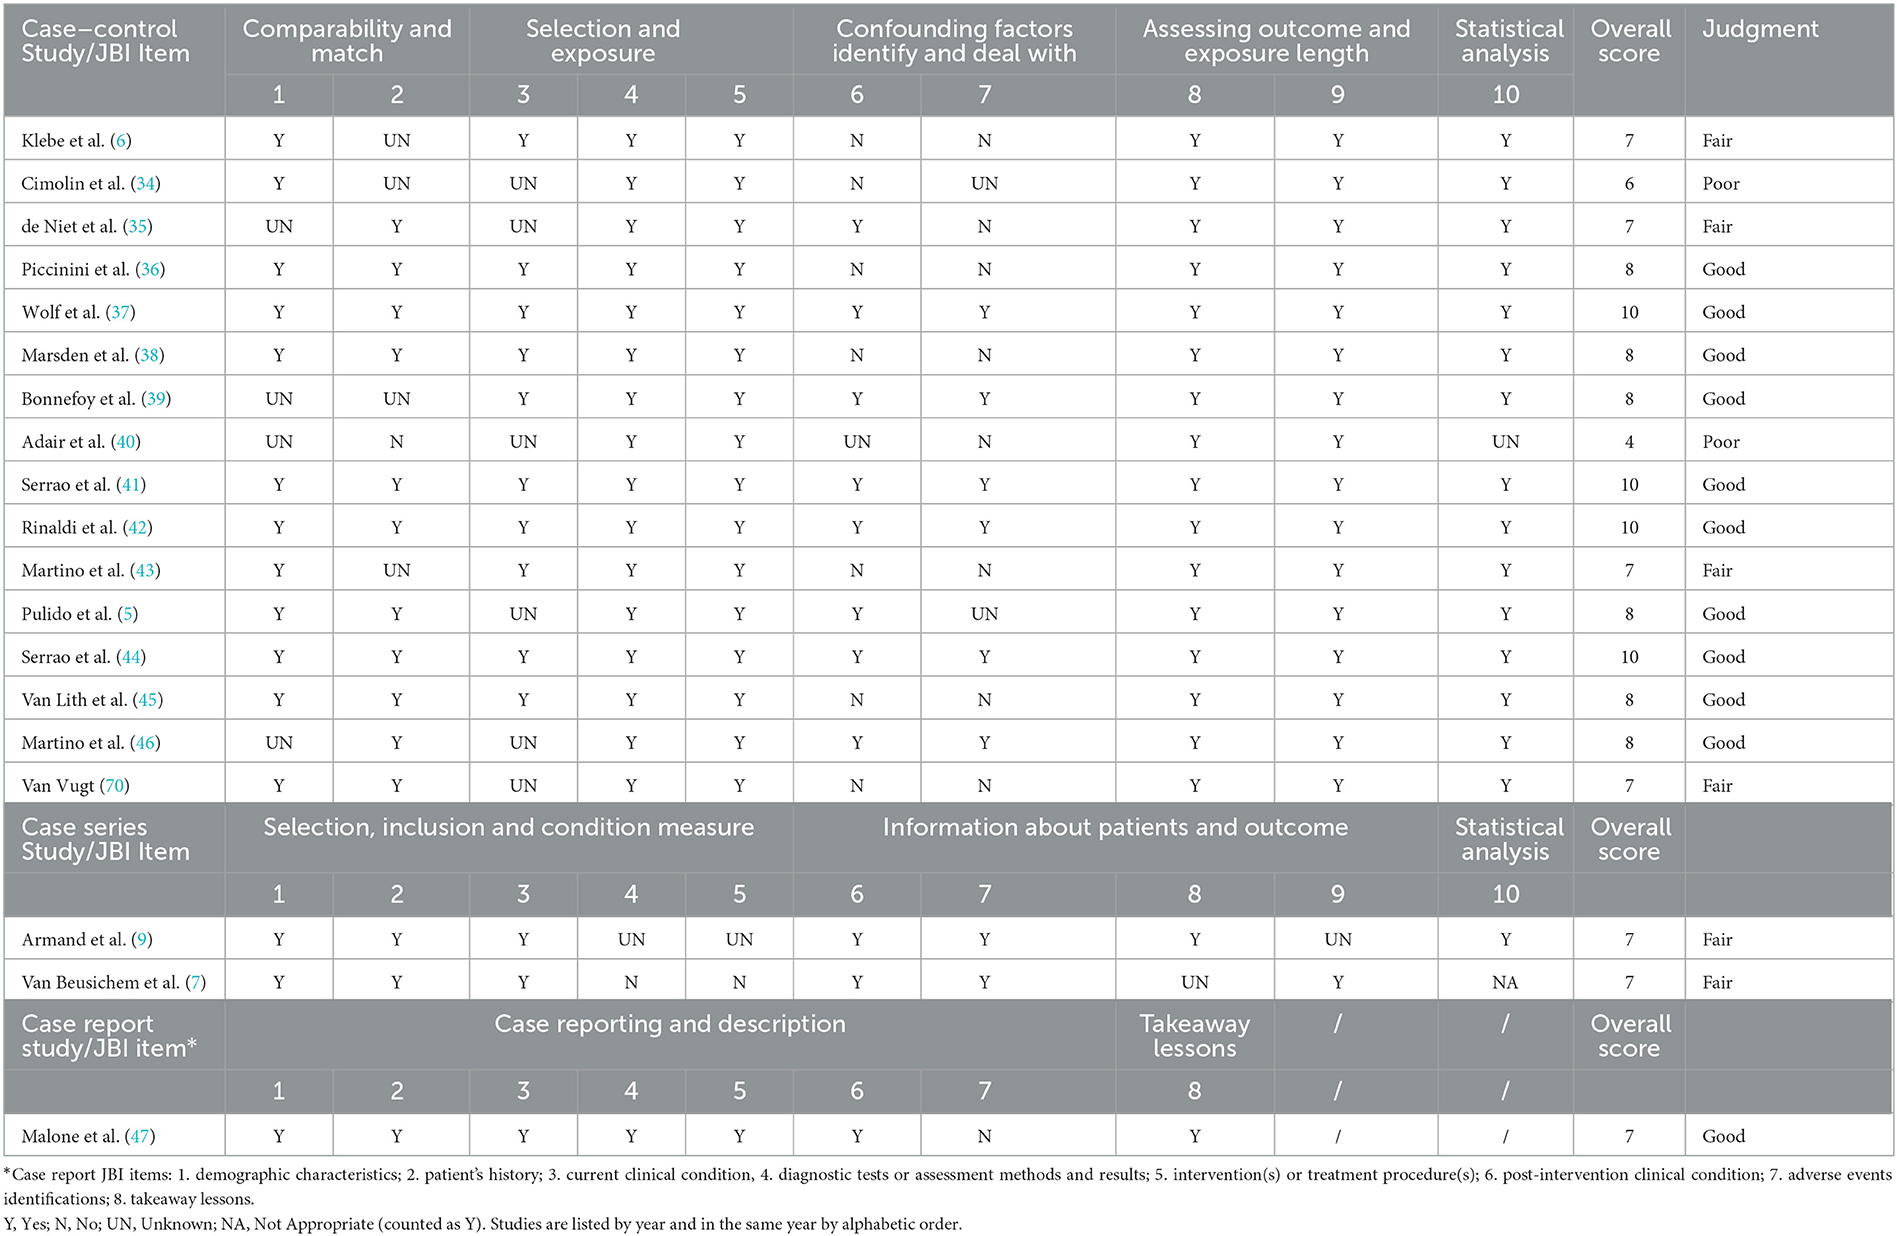
Table 1. Quality of gait analysis pattern studies assessed by means of the Joanna Briggs Institute (JBI) tools for methodological appraisal of studies.
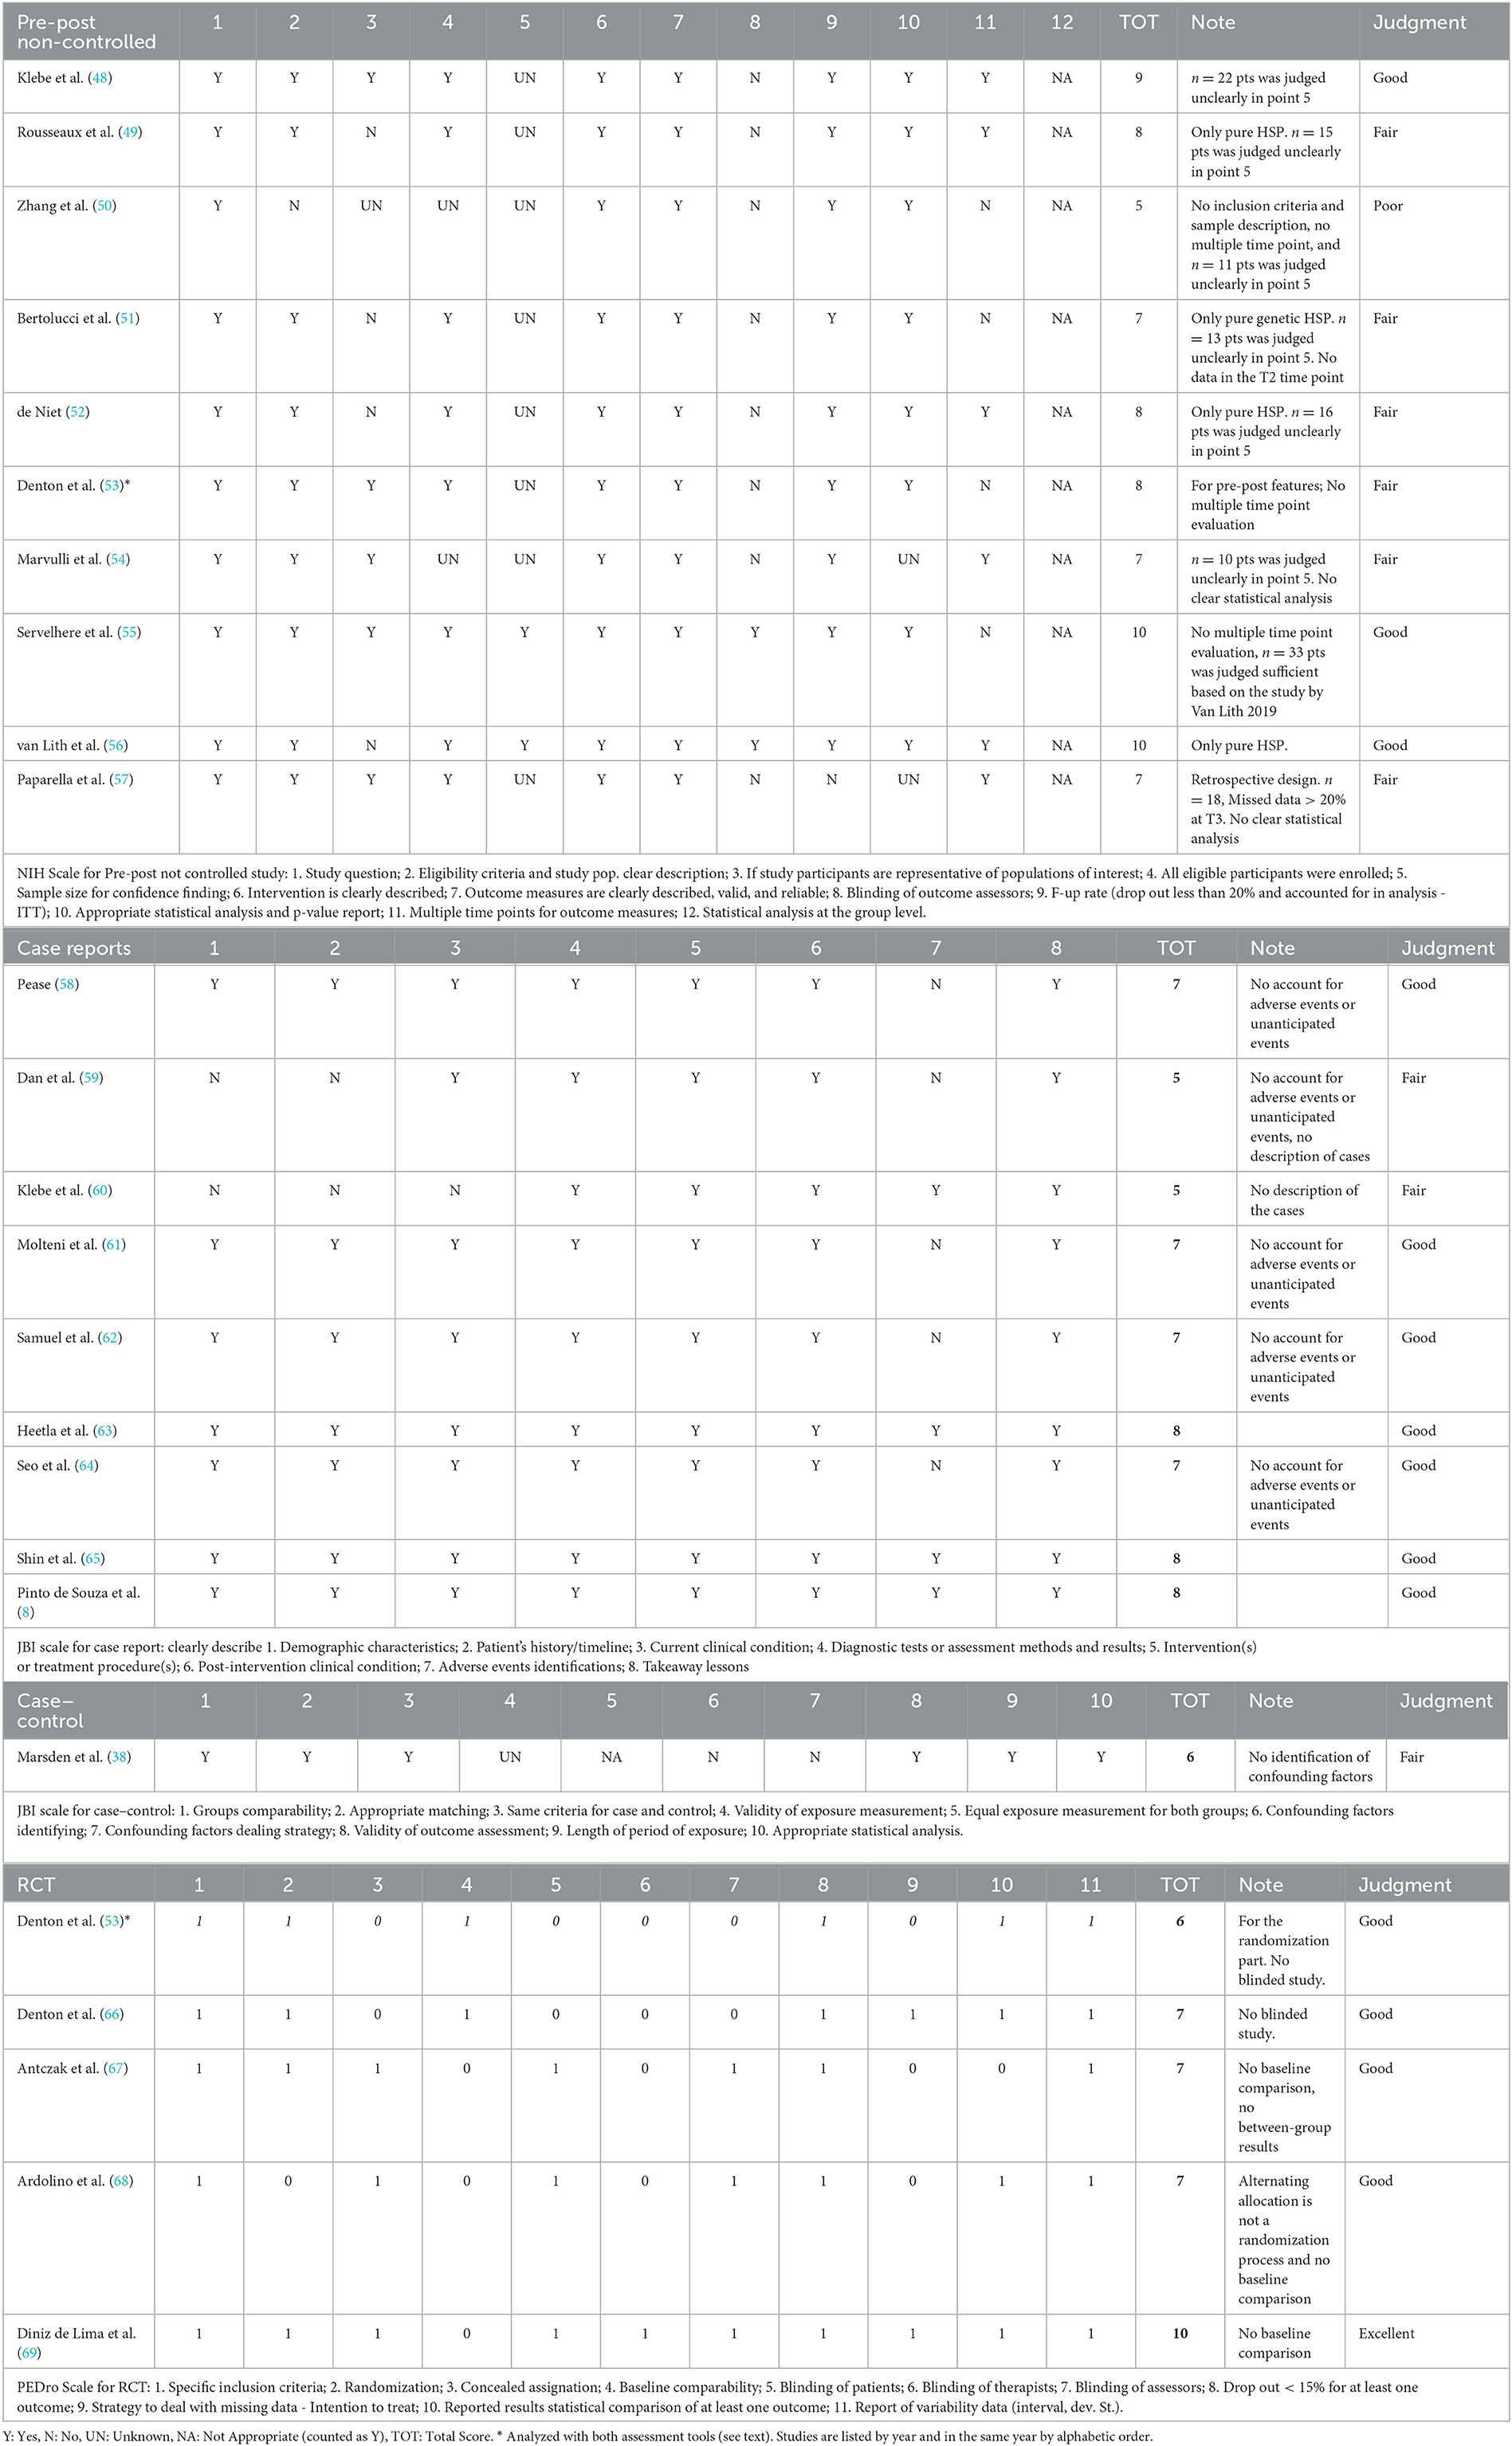
Table 2. Quality of intervention studies assessed by means of the National Health Institutes (NHI) scale for pre-post non-controlled studies, the Joanna Briggs Institute tools for methodological appraisal of studies (JBI) for case reports and case–control studies, and the Physiotherapy Evidence Database (PEDro) scale for RCTs.
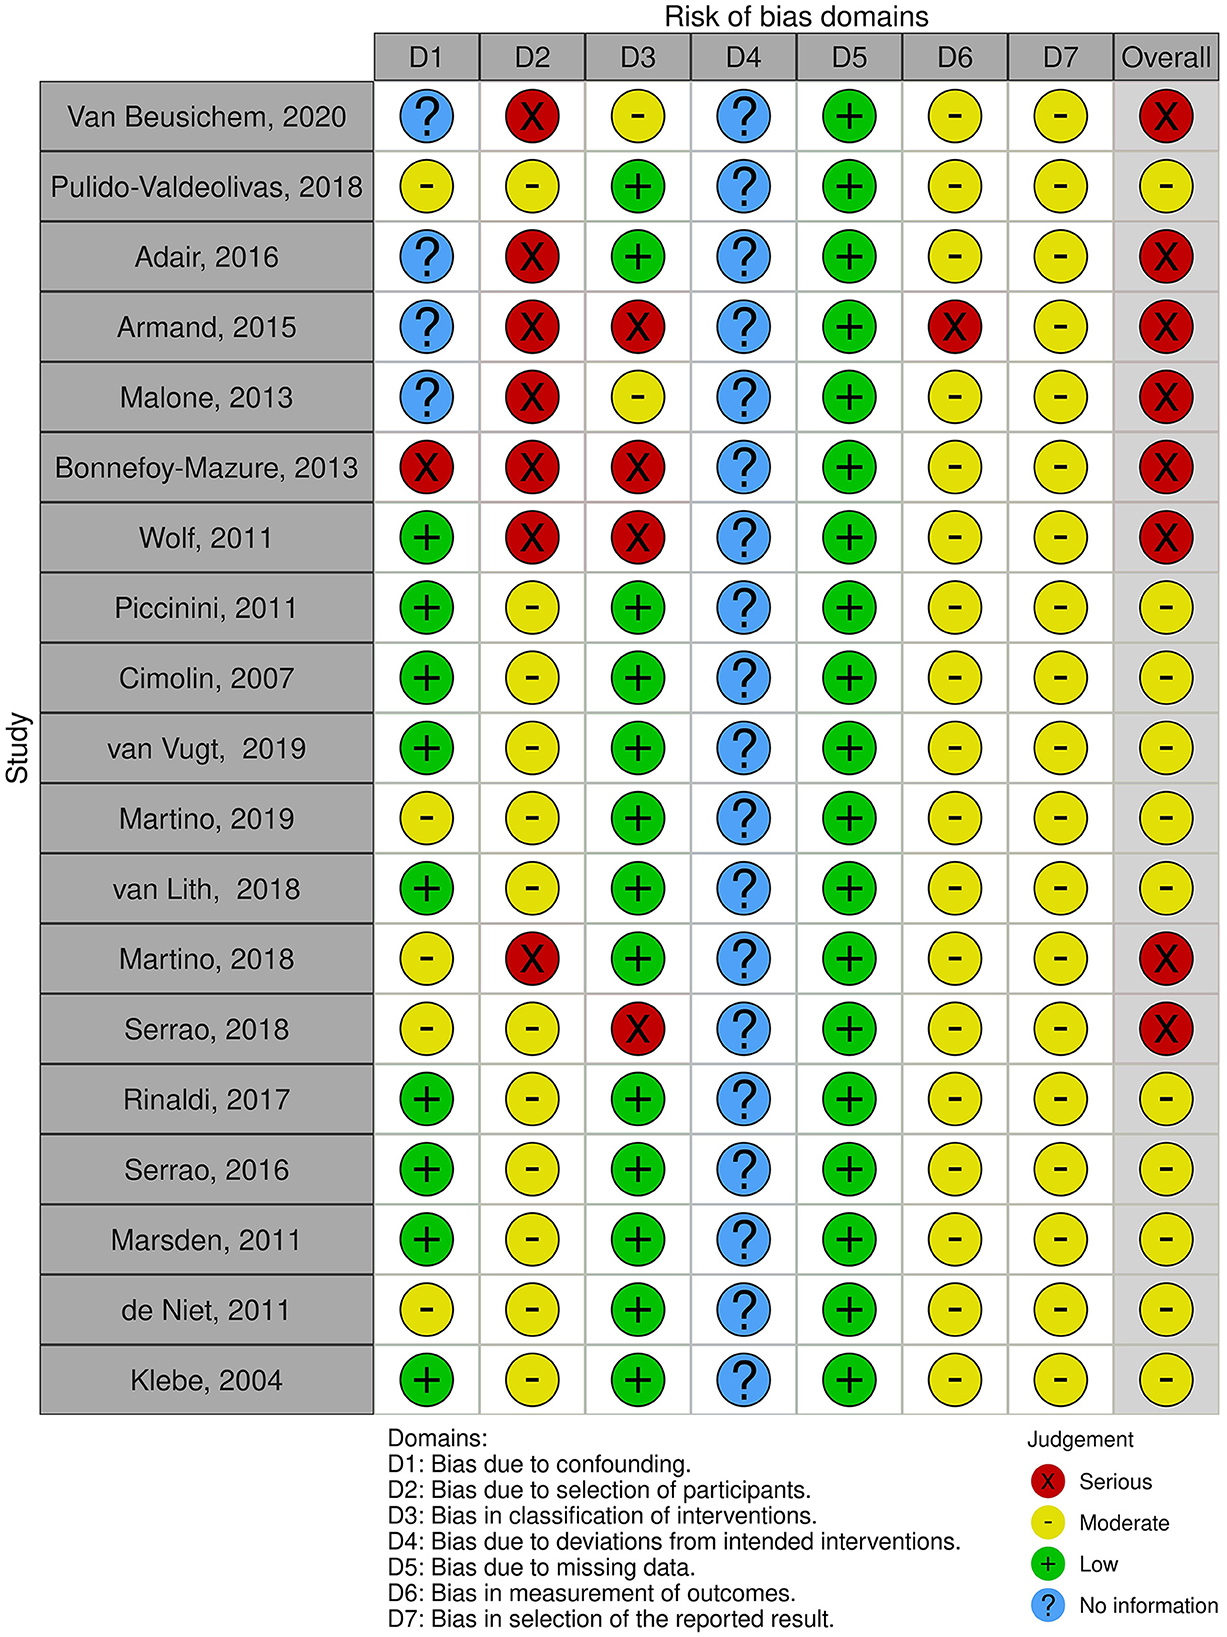
Figure 2. Risk of bias of gait analysis pattern studies: ROBINS-I plot.
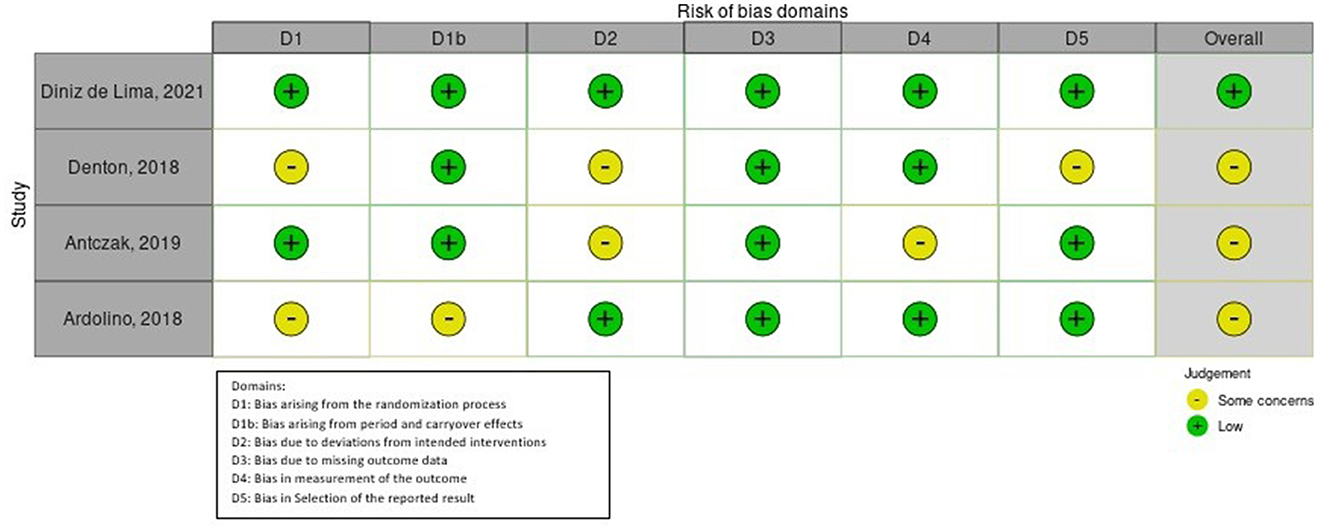
Figure 3. Risk of bias of RCT intervention studies: ROB2 plot.
3.1.1. Quality and rob of gait pattern studies
The quality assessment of GA pattern studies is represented in Table 1. Among the case–control studies, only two studies, namely Adair et al. (40) and Cimolin et al. (34), did not reach a sufficient quality score because of a lack of adequate matching groups and identifying confounding factors. In addition, some concerns were resolved about statistical analysis methods in one of these studies (40), such as the use of discrete variable analysis for continuous variables and the lack of any correction method. The other studies achieved a Good (5, 34, 37–39, 41, 42, 44–47) or Fair (6, 7, 9, 35, 43, 70) quality judgment, associated with a low risk of bias, but presented some limitations. Bonnefoy et al. (39) presented groups different in age, Klebe et al. (6) had some incomplete data (no SIAS marker in 6 patients-50% of the sample, for safety device use), and Wolf et al. (37) declared that comparison of more homogeneous subgroups might be possible but with limited statistical power and the risk of additional bias effects. Some authors (6, 35, 39, 43, 46) did not provide a clear description of the subject characteristics, comparability, matching, or recruitment. Regarding the identification and the management of confounding factors, the authors mostly instructed the control subject to walk at a low comfortable speed (38, 42, 44, 46), to avoid any potential bias due to speed differences between groups and to ensure that the general characteristics of gait could be compared. The subject match was also often done based on age. Some authors (40, 41, 44) did not allow the use of aids to perform gait, resulting in a restriction of the sample size.
The RoB of GA studies was assessed by means of the ROBINS-I tool, as represented in Figure 2. A RoB in D1 resulted whenever the authors did not make appropriate matching between patients and control groups, in particular, considering confounding factors such as age, anthropometric data, or walking speed. For example, Bonnefoy et al. (39) presented the patient's group data including the results of different gait analyses performed by the same group of patients over the years. In the study by Adair et al. (40), the healthy control group's data were derived from another study and the information about comparability was not reported. In case reports and case series studies, no information was provided regarding D1. Only one author performed a blind matching among groups (37). A serious risk in D2 was identified in case reports (47) and case series (6, 9): because of the nature of the studies, the results might affect the recruitment. The risk in D2 was also serious if the patients were retrospectively recruited or excluded (37, 39) or recruited depending on the ability to perform gait analysis (40, 43). Studies based on a retrospective design presented a serious risk in D3. D4 was considered inappropriate in GA pattern studies, because no therapeutic intervention was considered, except gait analysis. All the studies achieved low risk in D5 because they did not report a high relevant percentage of missing data. An overall moderate risk in D6 was evidenced because the methods of gait data analysis were comparable across groups and the outcome measure was probably not influenced by the knowledge of the investigators, nonetheless, no one used any type of blinding method for the analysis. Only the study by Armand et al. (9) presented a serious risk in this domain because the authors compared GA performed with different instruments over the years. An overall moderate RoB was evidenced also in D7 because, in all studies, the outcome measurements and analyses were consistent with the a priori plan, though a pre-registered protocol was never reported. Overall, according to the ROBINS guide flowchart, eight studies presented a serious risk and 11 a moderate risk of bias.
3.1.2. Quality and RoB of intervention studies
The quality of intervention studies is represented in Table 2. NHI scale for pre-post non-controlled studies was used for retrospective observational cohort studies (54, 57) and a randomized pre-post-intervention study (53). JBI case–control scale was used to assess the study by Marsden et al. (71) in which the authors compared the effect of different Functional Electric Stimulation (FES) stimulating patterns between HSP patients and controls providing an inter- and intragroup analysis. Denton et al. (53) randomized the order of presentation of two types of intervention (cooling or warming) in a crossover design and analyzed the pre-post effect, including comparison with controls. Therefore, to avoid bias in reporting results, this study was assessed either with pre-post or with RCT tools for quality assessment.
In the NHI scale, the study questions were clearly stated in the title, abstract, or text. Among pre-post studies, the main limitations were inadequate representation of the population of interest, whenever only pure HSP phenotype was included, small sample size with the lack of power calculation, and no-blind design. Item 12 was considered non-applicable for this type of study population. In the final quality judgment, three studies were Good, six were Fair, and one was Poor.
Among case reports, only two did not reach a sufficient score (59, 60). The most frequent limitation was the lack of declaring the presence or the absence of collateral effects (58, 59, 61, 62, 64); Dan et al. (59) and Klebe et al. (60) did not provide a clear description of the patient's characteristics.
Among RCT (crossover design), one study reached an Excellent rating (10/11) (69) and four studies had a Good quality rating (7/11). Only one study (66) presented a baseline comparison between the crossover groups but did not implement any type of blind procedure. In most of these studies, the operator who administered the treatment was not blinded, whereas the patients and the outcome assessors were blind. In 50% of the studies, the management of missing data was addressed.
Limited to crossover RCTs, the RoB was assessed by means of the ROB2 tool (see Figure 3).
Relative to D1, Denton et al. (66) gave no information about concealed allocation, Ardolino et al. (68) used an alternate allocation design which is considered an incorrect randomization process (72). Some concerns were attributed to the study by Ardolino et al. (68) relative to the D1b domain because the authors did not specify whether the number of participants allocated to each of the two groups corresponded or not, even if they took into account sufficient time to carryover the effects. Denton et al. (66) and Antczak et al. (67) presented RoB in D2 because no information was given regarding the possible influence of unblinding treatment providers on the outcome, even though patients and evaluators were blind. Some concerns in D4 emerged in the study by Antczak et al. (67) because the evaluation of the datasets was not blindly executed. Regarding D5, all the authors referred the study to a pre-specified trial protocol, except for Denton et al. (66). Finally, only Diniz de Lima et al. (69) presented a low RoB.
3.2. Evidence synthesis
3.2.1. Gait analysis pattern studies
All patients fulfilled the diagnostic clinical criteria for HSP according to defined criteria (2, 13, 20). The number of included HSP patients ranged across studies from 6 to 50 for the case–control studies and from 1 to 6 for the case series studies. A total of 341 HSP patients were included across all the 19 studies. No explicit differentiation was done among HSP patients with early or late onset—with onset predominantly above or below 35 years according to Harding (13). Nonetheless, nine studies focused on children and young subjects (named median age <18 years old). Most studies considered pure forms of HSP. Very few patients presented complicated forms, including urinary disturbances (6), intellectual deficit, ataxia, and peripheral neuropathy (7).
Characteristics of included studies are represented in Supplementary Table 2.
Since the included studies considered either minors (mostly compared to spastic diplegic subjects) or adults (compared to stroke patients) as samples, the results are presented separately.
3.2.2. Gait analysis pattern studies in children and adolescents
The results of the included studies are represented in Table 3. With sample sizes ranging from 1 to 29, a total population of 111 patients was included in these studies.
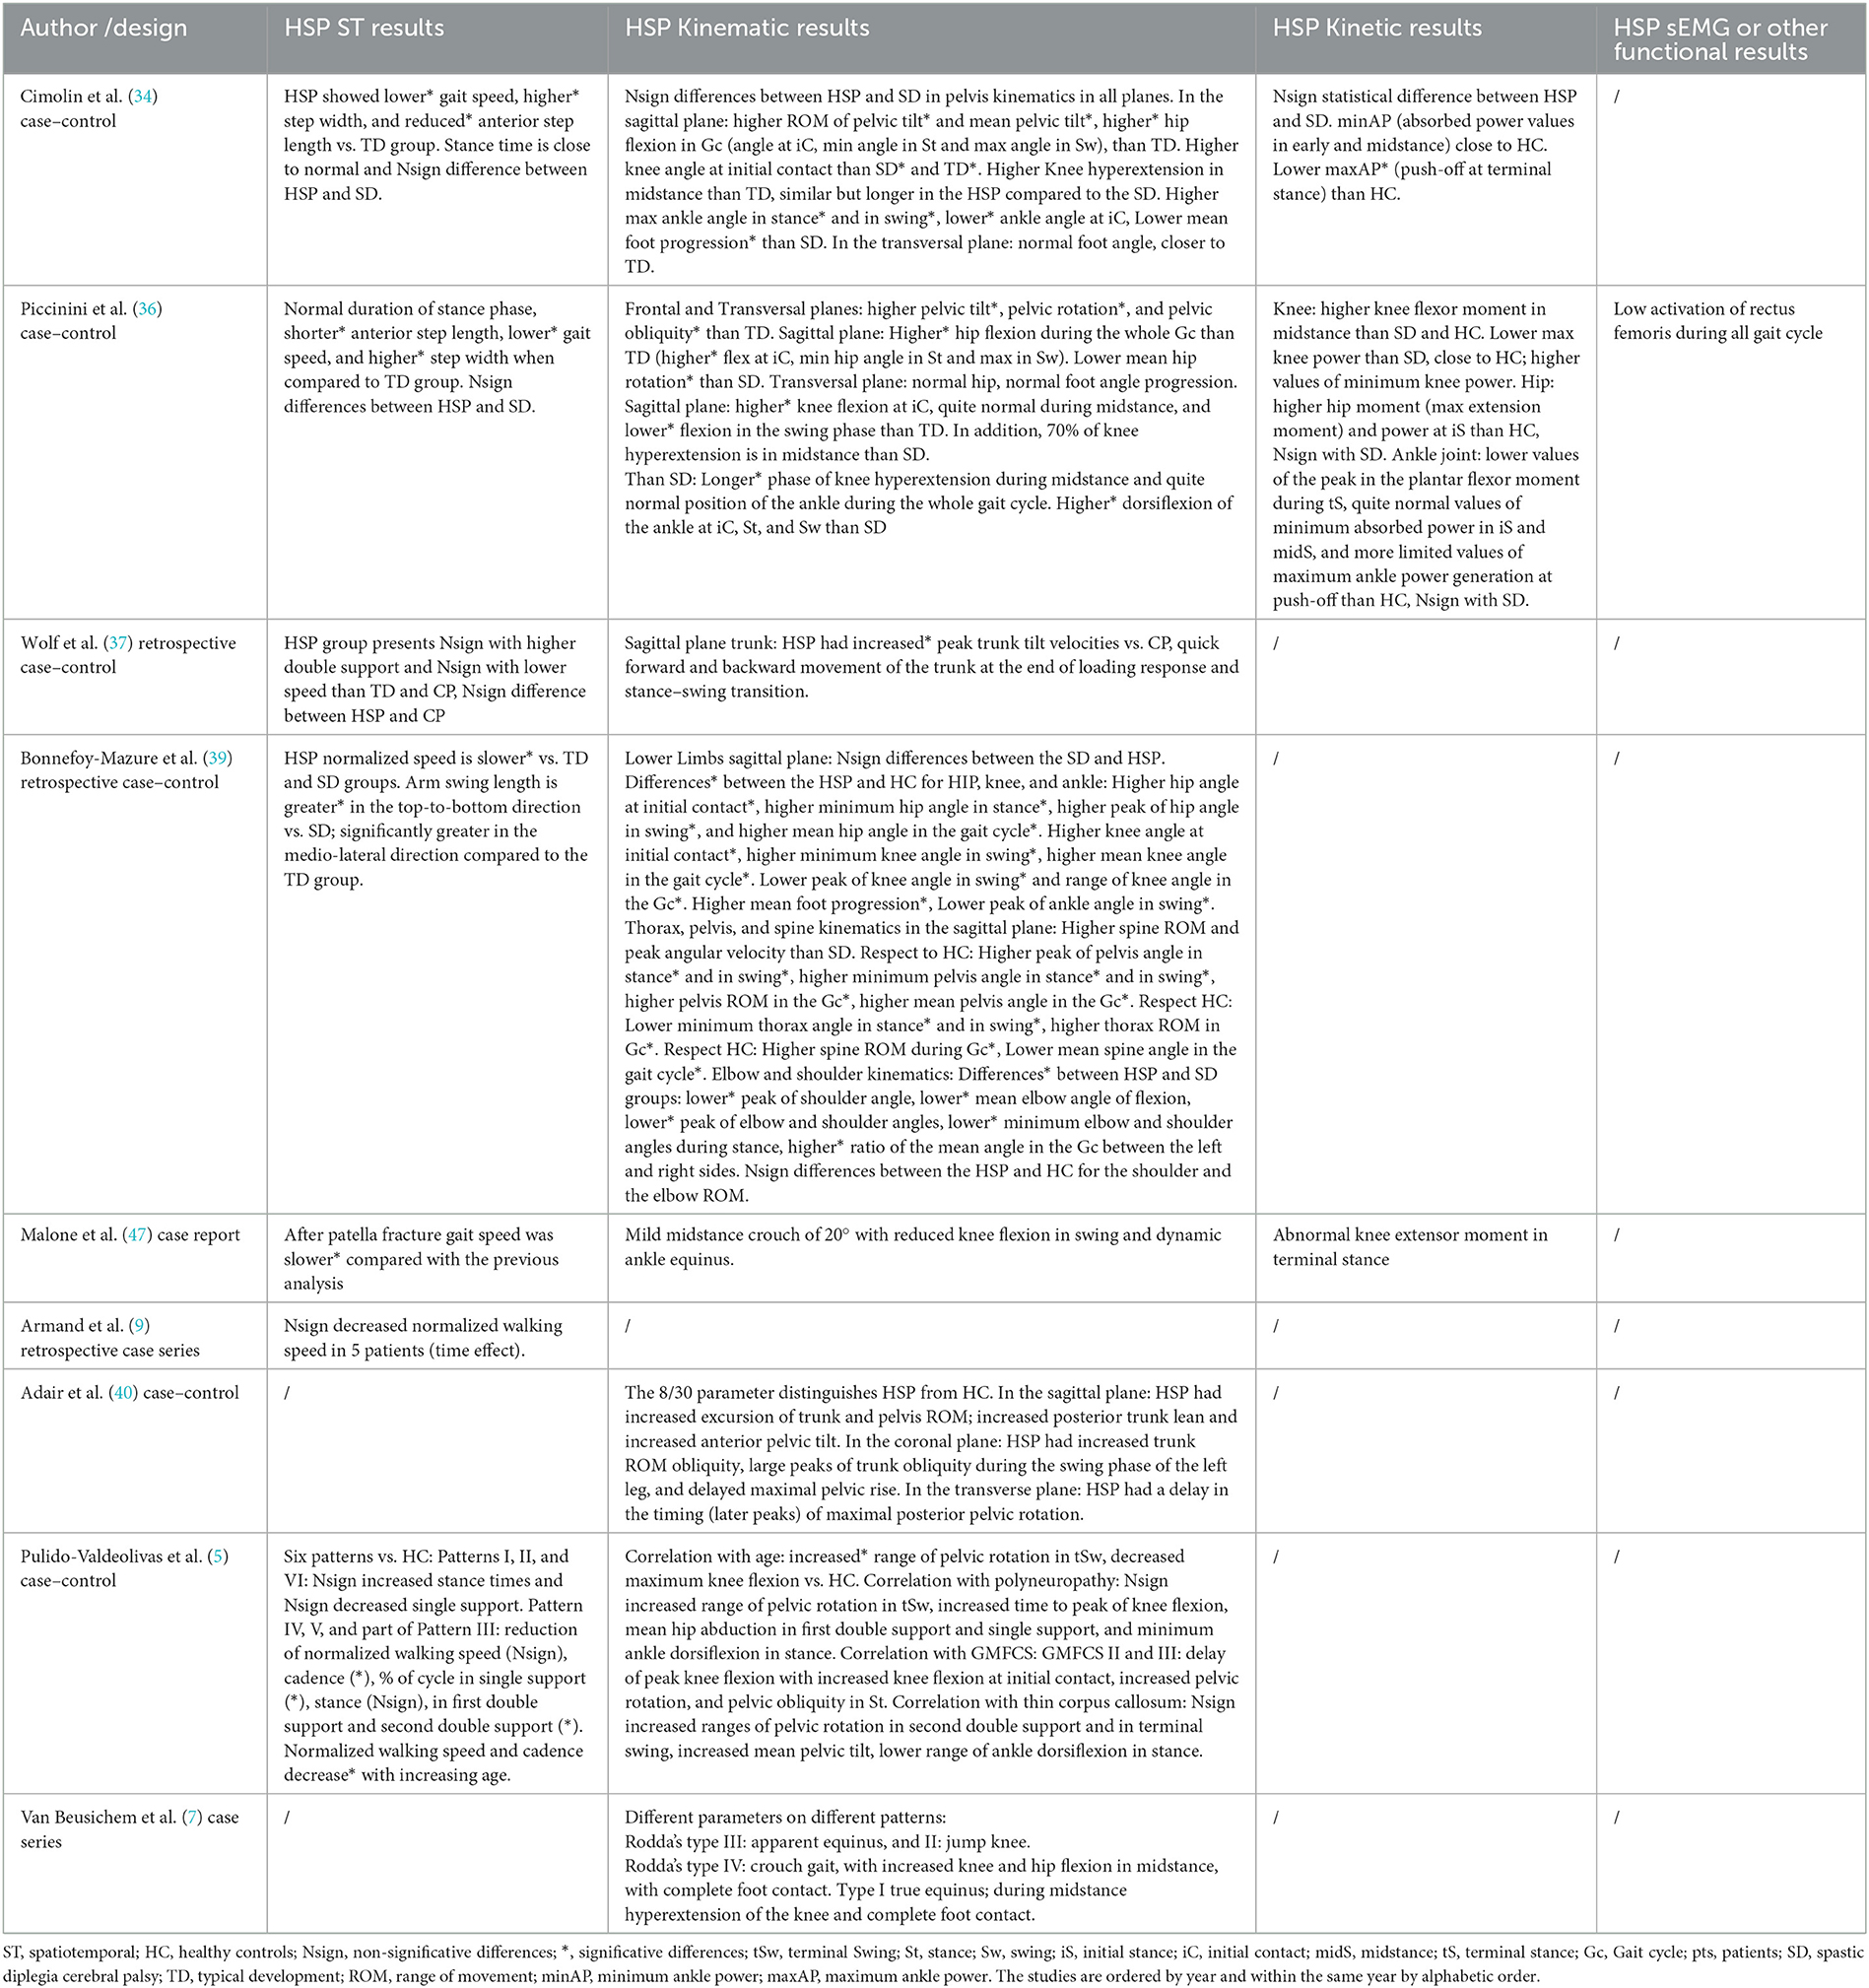
Table 3. Results in child GA studies.
The oldest study by Klebe et al. (6) found a typical gait pattern of patients with sporadic or HSP, compared to healthy subjects, consisting of reduced speed, cadence, and step length; increased step width and increased variation of stride length; reduced sagittal knee range of motion (ROM), with increased minimal knee angle; reduced step height with reduced maximum hip angle; increased maximum ankle angle due to equinovarus feet; and circumduction but no significant variation of foot progression angle.
Van Beusichem et al. (7) applied the Rodda (73) gait classification system for cerebral palsy, to describe the pattern of four subjects affected by a complicated form of HSP due to de novo KIF1A mutations. All four gait classes were represented with a progression from classes I and II to III and IV at the last evaluation at 10–18 years.
Pulido-Valdeolivas et al. (5) identified six gait patterns in a group of 26 HSP subjects, aged 4–17 years; the authors compared gait analysis data among patients and healthy subjects, by means of Dynamic Time Warping (5). Pattern I, in the early phase of HSP, was “close to normal” with slightly increased stance time and double support, hip and knee flexion at initial contact (IC), and delayed peak knee flexion in the swing phase. Pattern II presented overall increased anterior pelvic tilt and hip flexion, and increased knee flexion at IC. Pattern III was characterized by knee recurvatum, with reduced and delayed peak knee flexion in the swing phase. Crouch gait corresponded to pattern IV, while constant and severe anterior pelvic tilt, with recurvatum and equinus, distinguished pattern V. Pattern VI was similar to “jump knee” pattern in CP patients (74). Spatiotemporal parameters were relatively spared for patterns I, II, and VI; while they were impaired in patterns III, IV, and V. Asymmetry was described in 27% of HSP subjects, with different patterns in right and left limbs. The authors also found a correlation between GMFCS stages and increased knee flexion at IC, pelvic rotation, and obliquity. They concluded that knee flexion and non-sagittal pelvic movements were relevant indicators of HSP progression. Overlapped polyneuropathy determined an increased range of pelvic rotation in terminal swing and increased time to peak knee flexion, and was most reported in patterns I, II, and III. Abnormal visual evoked potentials (VEPs) were more frequent in subjects classified in pattern III (knee recurvatum).
Armand et al. (9) examined the gait evolution in several subjects affected by HSP (mutations in SPG3A) from the same family. The Gait Deviation Index (75) differed among subjects, but it showed an overall tendency to amelioration from childhood to adolescence and deterioration from adolescence to adulthood.
Adair et al. (40) interestingly analyzed trunk and pelvis kinematics and found increased ROM of the trunk and pelvis in the sagittal plane, with increased posterior trunk lean and anterior pelvic tilt and increased trunk obliquity during the swing phase.
The other four studies included spastic DCP subjects in comparison with HSP and healthy controls (34, 36, 37, 39). HSP and DCP showed similar patterns, and, in both groups, sagittal kinematics could be categorized according to the classification by Sutherland and Davids (74). The principle noticeable difference was that HSP subjects presented more often and longer knee hyperextension during midstance compared to DCP (34, 36, 37). Based on findings by Bonnefoy-Mazure et al. (39), HSP presented significantly reduced gait speed compared to both controls and DCP. Another peculiar characteristic of HSP subjects was increased trunk ROM and peak angular velocity in the sagittal plane during the swing phase (37, 39). HSP presented upper limb patterns similar to healthy subjects, while DCP kept their arms symmetrically elevated, with shoulders abducted and elbows flexed (39).
3.2.3. Gait analysis pattern studies in adults
The results of the included studies are represented in Table 4. The sample size ranged from 6 to 50 subjects. A total of 230 subjects were included in 10 studies; the mean age at the time of GA was 47 years (SD 2.8 years). The mean disease duration among six of these studies (6, 41–44, 46) (in the others no data were available) was 19.7 years, with a prevalence of early-onset forms compared to late-onset forms.
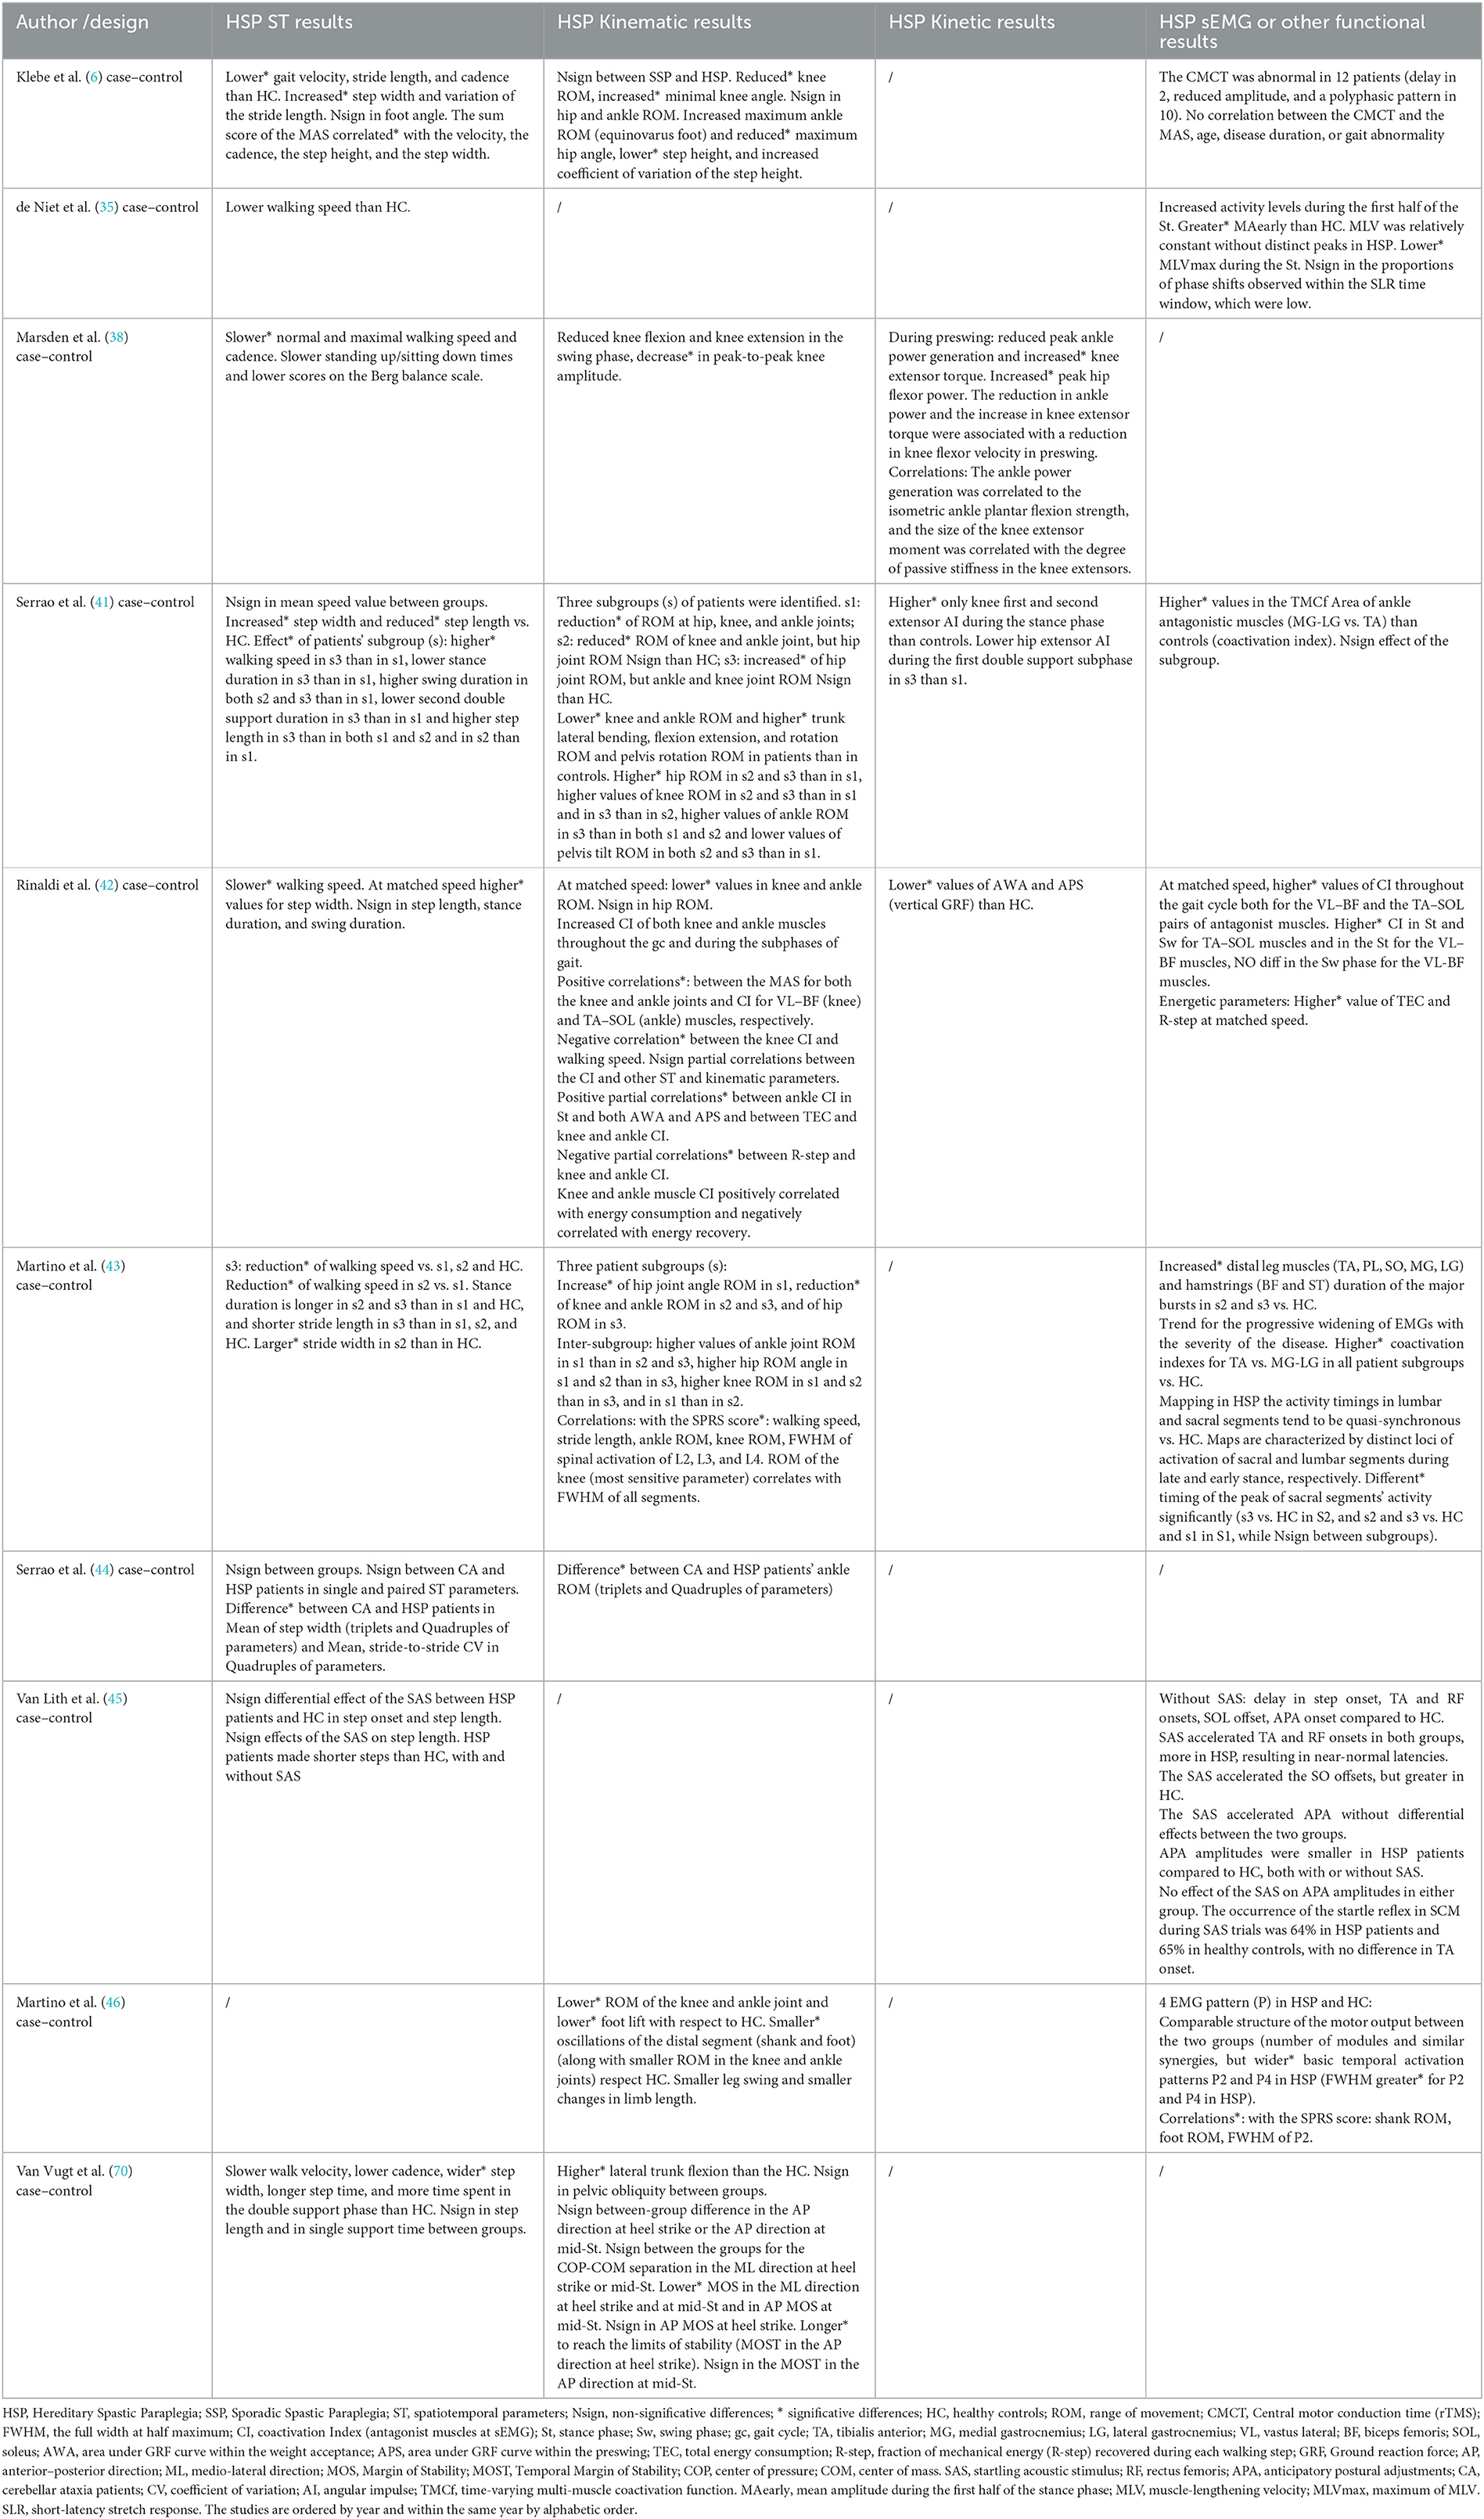
Table 4. Results on adult GA pattern studies.
Serrao et al. (41) and Martino et al. (43) identified three kinematic patterns as distinctive of HSP, compared to healthy subjects: increased ROM at the hip, with normal values at knee and ankle; reduced knee and ankle ROM, with normal hip ROM; and reduced ROM at hip, knee, and ankle. A reduced ROM at the knee and ankle was described also in other studies (38, 42, 44, 46), with a decreased foot lift (46), compared to healthy subjects. An increased and premature calf muscle activity was observed both in HSP and stroke subjects, compared to controls, but the contribution of the stretch reflex was excluded (35). Marsden et al. (38) demonstrated that the shorter latency stretch-evoked plantar flexor activity correlated with the increased passive stiffness found at the gastrosoleus in HSP patients, compared to controls. Conversely, no significant difference in knee extensor stiffness was recorded, by comparing HSP and controls. A significant reduction of strength was described, in particular, at the plantar flexors and knee extensors (38). Patterns of coactivation at the electromyography (EMG) were described at dorsi-plantar flexors (41–43) and extensors–flexors of the knee (41, 42). Furthermore, mapping the motor neuron activation in the lumbosacral enlargement of HSP subjects, the activity timings in lumbar and sacral segments tended to be quasi-synchronous because of a progressive widening of the activity involving the sacral segments (43). Conversely, healthy subjects showed distinct loci of activation of sacral and lumbar segments during late and early stance, respectively. Coactivation resulted to correlate with higher energy consumption during gait, based on center of mass (COM) displacements during the gait cycle (42).
Van Vugt et al. (70) analyzed the dynamic postural instability of HSP subjects starting from the distance between the center of pressure and the center of mass (COP-COM separation) to the margin of stability (61) (MOS). The authors found a significantly lower MOS in medio-lateral direction at heel strike and midstance, and in antero-posterior direction at midstance, compared to healthy subjects. van Lith et al. (45) enquired about the anticipatory postural adjustments (APAs) at gait initiation in HSP and controls by studying the StartReact effect. Delayed APAs were observed in HSP subjects, though a starling acoustic stimulus (45) (SAS) positively affected their response, by reducing the activation delay of tibialis anterior (TA) and rectus femoris (RF), close to controls' values. Conversely, the soleus (SO) inhibition was not accelerated upon administration of the SAS.
Finally, lower velocity (35, 42, 43, 70), lower cadence (38, 70), longer double support phase (70), increased step width (41, 42), and increased lateral flexion of the trunk were reported (70). Contrasting data emerged regarding step length and stance duration, being reduced or similar to controls (41–43).
3.2.4. Intervention studies
Included intervention studies focused on adult subjects and no study was found including minors. Population characteristics are summarized in Table 5. Most studies considered pure forms of HSP. Very few patients presented complicated forms, including ataxia, peripheral neuropathy, retinopathy, and epilepsy (53). The methods and results of these studies are reported in Table 6.
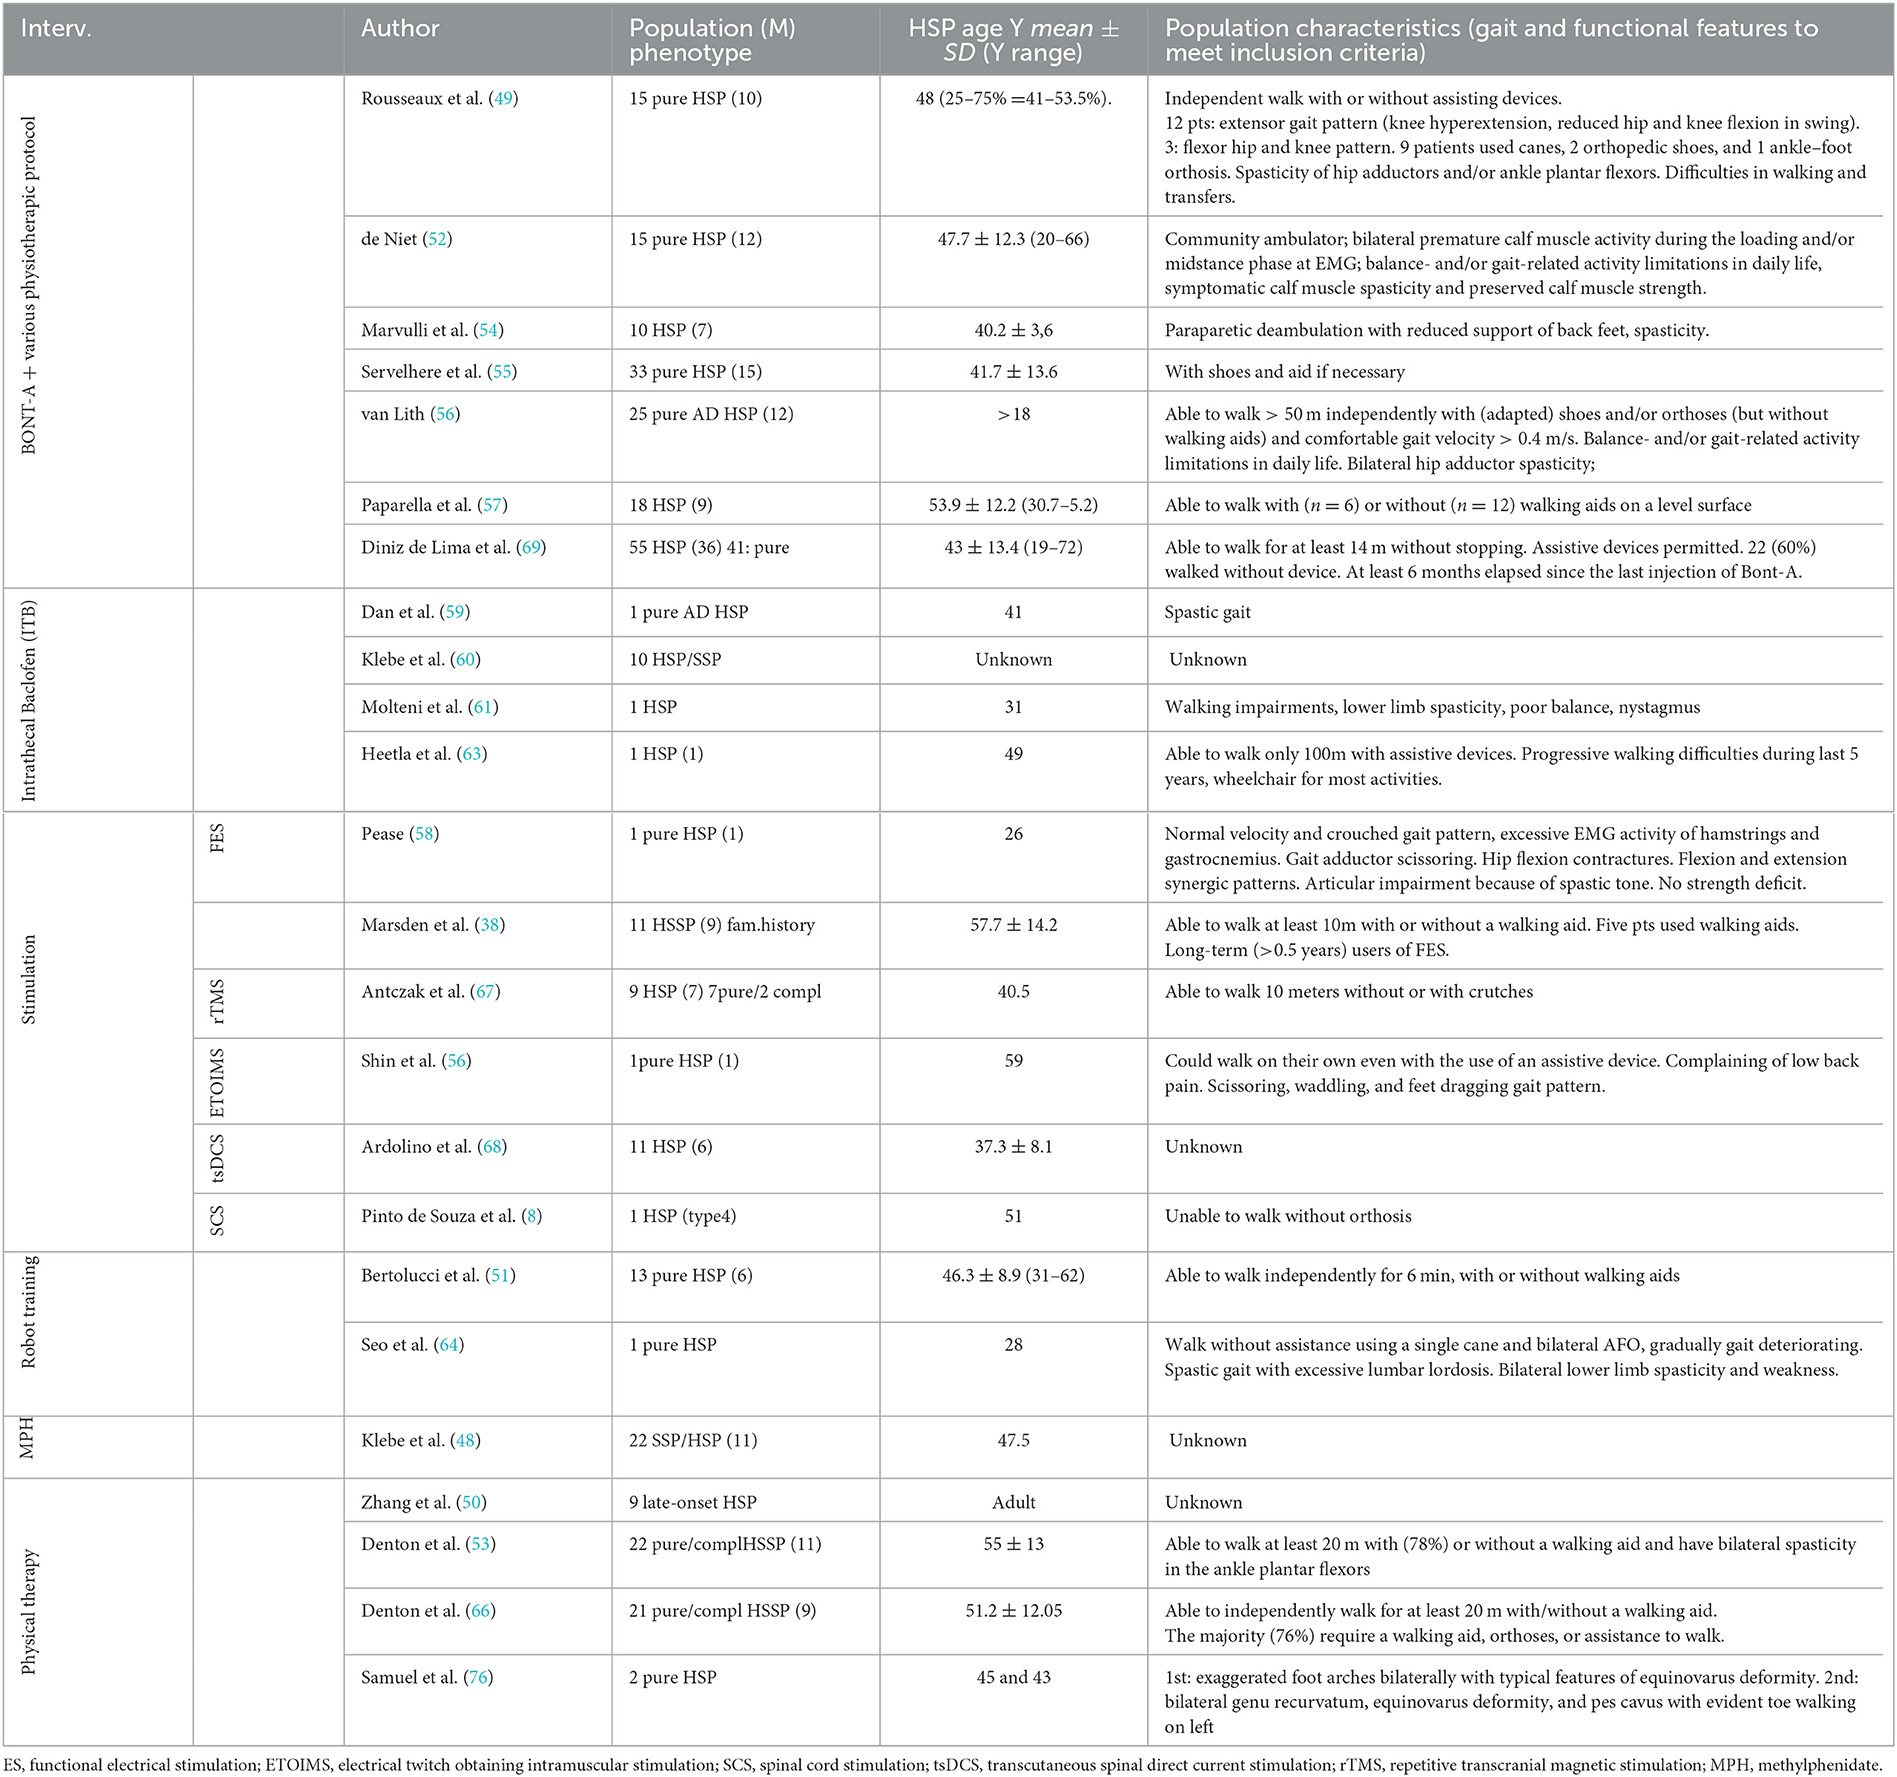
Table 5. Population characteristics of the intervention studies. Studied are grouped based on the treatment and among the same treatment are ordered by year.
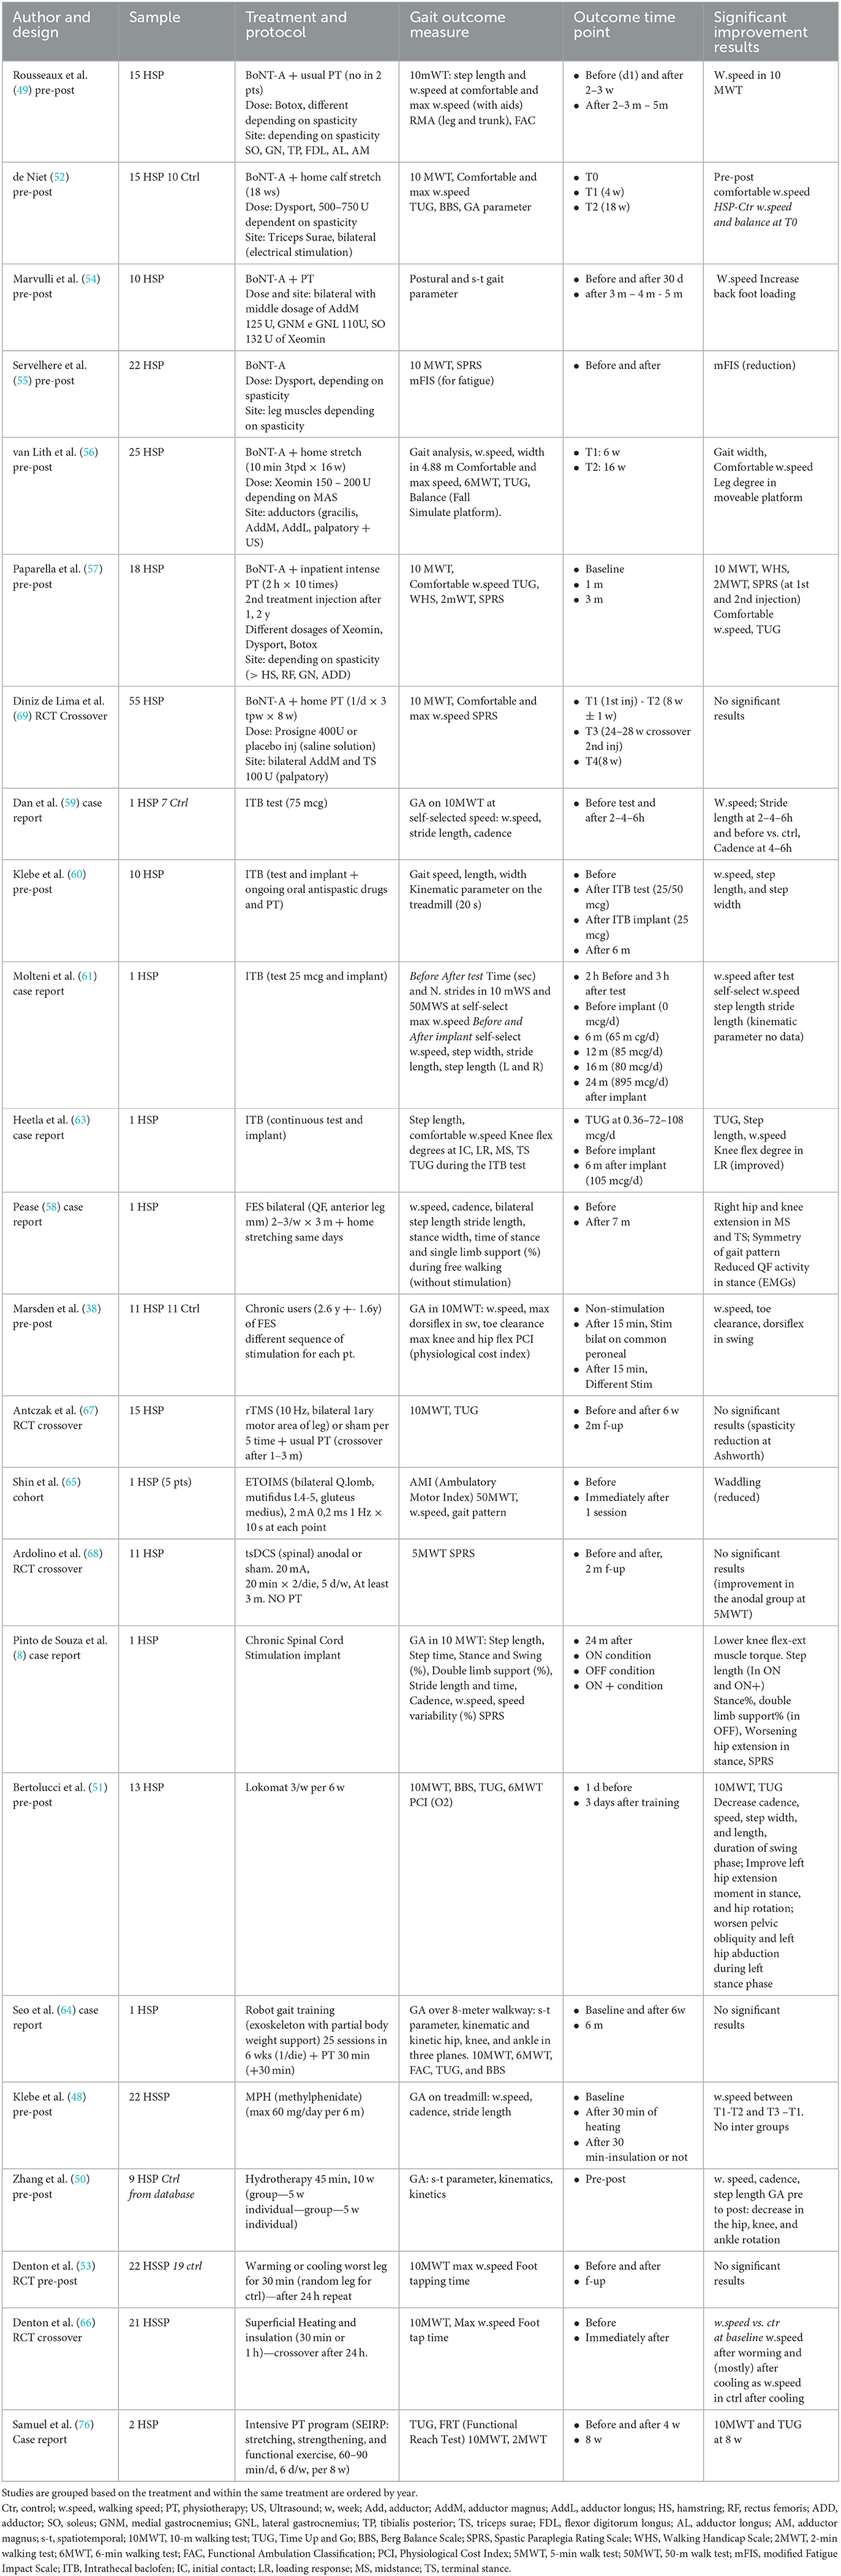
Table 6. Details about methods and results of the intervention studies.
Seven studies researched botulinum toxin injections to reduce spasticity (49, 52, 54–57, 69). Four were cohort prospective studies (49, 52, 55, 56), one was a double-blind randomized crossover study (69), and two were retrospective studies (54, 57). Xeomin (54, 56, 57), Prosigne (69), Dysport (52, 55, 57), and Botox (49, 57) were used (whenever indicated, dilution was 2 to 5 ml). The most frequently injected muscles were gastrocnemius, soleus, adductors magnus and longus, and gracilis (52, 54, 55, 69). One study included tibialis posterior (49). Two studies extended injections to other targets: hamstrings and quadriceps (56, 57); quadratus lumbi, tibialis anterior, flexor digitorum and hallucis, and extensor longus hallucis (56). The sample size ranged from 15 to 55 subjects. A total of 170 subjects were included in the seven studies, of which 98 were male subjects. An overall synthesis of age range was not feasible because data were differently reported as mean, median, or range values, but all patients were over 18 years old. After the injections, self-administered daily stretching (10 min for 2–3 times) (52, 56) or physiotherapy (49, 54, 57) was prescribed. The follow-up ranged from 8 weeks to 5 months (49, 52, 54, 56, 57, 69), only the study by Servelhere et al. (55) did not provide any follow-up assessment. Studies reported a transient reduction of spasticity according to the Modified Ashworth Scale (MAS) and of the injected muscles' strength according to the Medical Research Council (MRC) scale, in the short term. Both receded at 4–5 months follow-up assessment. Furthermore, an increase in range of movement (ROM) within 3 months after injection was reported as increased dorsiflexion, knee flexion, and hip abduction depending on the targeted muscle. Short-term improvement in gait velocity was reported by all studies (49, 52, 54, 56), except Servelhere et al. (55) and De Lima et al. (69). No significant differences were demonstrated at functional tests, except by Paparella et al. (57). This study reported significant improvements at the following tests, 3 months after botulinum and intensive physiotherapy, in 18 subjects: Spastic Paraplegia Rating Scale (SPRS), Walking Handicap Scale (WHS), 10-m walking test (10MWT), 2-min walking test (2MWT), Timed UP and Go test (TUG), the visual analogical scale (VAS), and numeric rating scale (NRS) which assessed the perceived quality of life and pain.
Transient side effects were reported in 19 subjects: muscle strength reduction (52, 55, 69), bruise, transient pain, paresthesia in the site of the injection (69), impairing gait quality (55, 69), sleepiness, and blurred vision in one subject (55). Paparella et al. (57) denied adverse effects.
Four studies researched intrathecal baclofen to reduce spasticity (59–61, 63). Three were case reports (59, 61, 63) and one was a retrospective cohort study (60). Gait analysis at a self-chosen comfortable speed was recorded before and after intrathecal bolus testing (59, 60) or before and after pump implantation. Increased gait velocity and step length were reported by all authors. Klebe et al. (60) described improvement in 5 patients over 10; among them, 2 subjects refused pump implantation because they experienced weakness and unsteadiness. Dan et al. (59) showed that ITB normalized the planar covariation of elevation angles of the thigh, shank, and foot over the gait cycle, thus improving the coordination of the lower limb and reducing mechanical energy expenditure. Heetla et al. (63) reported the reduction of spasticity using MAS, without strength loss and improvement at TUG, which lasted 6 months after implantation. Molteni et al. (61) observed a reduction in the slope of the moment–angle curve of the ankles, which lasted 2 years after pump implantation. The overall baclofen dose range was 25–108 μg, and the overall number of patients involved was 13.
Functional electrical stimulation (71) was enquired by two studies. One case report by Pease et al. (58) reported improvements in gait velocity and knee extension in the stance phase, after FES on the quadriceps and anterior compartment of the leg. Marsden et al. (71) examined a cohort of 11 long-term users of FES (at least 6 months) with and without stimulation and compared them with matched controls. With stimulation (mainly at dorsiflexion, and in some cases also at hip abductors and extensors), an increase in gait velocity and dorsiflexion torque was reported. Long-term follow-up was missing.
One study (65) explored the effect of Electrical Twitch Obtaining Intramuscular Stimulation over the low back and gluteal area, in a mixed population, including one HSP adult. The patient experienced increased speed and reduction of falls and back pain.
Ardolino et al. (68) presented a double-blind, randomized, crossover, and sham-controlled study about anodal transcutaneous spinal Direct Current Stimulation delivered over the thoracic spinal cords (T10–T12). Eleven HSP subjects were involved. They maintained their usual pharmacological treatment but no other intervention (i.e., physiotherapy) was performed during the trial. A significant reduction of spasticity was observed at the Ashworth scale, in particular, at knee extensors and hip flexors, 2 months after treatment. No other functional outcome was improved.
De Souza et al. (8) reported a subject who underwent chronic spinal cord stimulation (SCS) implantation in the posterior epidural space of T11–T12. Alternating ON/OFF phases allowed studying the effect of SCS: improvements in muscle strength and spasticity and at SPRS were reported in ON phases.
Antczak et al. (67) researched the effect of repetitive transcranial magnetic stimulation (rTMS) by means of a blinded, randomized, crossover, and sham-controlled study. Fifteen patients were enrolled, with one dropping out due to a seizure that occurred during a stimulating session. Other adverse effects were headache (several subjects) and sleeplessness (one subject). Usual physiotherapy and oral drugs (59) were provided during the trial. The strength of the proximal and distal muscles of the lower limbs increased, and the spasticity of the proximal muscles decreased. Nonetheless, no functional improvements were observed at the TUG and the 10-m walk test (10MWT).
Two studies (51, 64) researched robot-assisted gait training with partial body weight support: one case report (64) and a cohort study (51) involving 13 pure HSP patients. The treatment lasted 6 weeks. The case report (64) included physiotherapy and overground walking, while the study by Bertolucci et al. (51) provided a gradual reduction of the robotic guidance force and increased workload. An overall improvement in functional tests was observed, with non-significant change in strength, spasticity, and pattern of gait. In the cohort study (51), the improvement was maintained at a 2-month follow-up.
The outcome of an 8-week intensive physiotherapy program including stretching, strengthening, and functional exercise, in two HSP subjects, was described by Samuel et al. (76). The authors reported an improvement in all tests after completing the intervention period: TUG, Functional Reach Test (FRT), 10mWT, and 2mWT.
Zhang et al. (50) researched gait analysis changes after a 10-week hydrotherapy program in 11 HSP subjects. A significant improvement in gait velocity was reported. A significant decrease in the transverse plane rotation of hip, knee, and ankle and an increase in hip and knee peak extension moment were reported.
Klebe et al. (48) performed an open-label study with a longitudinal follow-up at 6 months, in 22 patients treated with 60 mg of methylphenidate per day. Non-significant improvement was observed at gait analysis, MAS, or MRC, at the last assessment. Nausea and sleep disturbances were reported as collateral effects, but only one dropout was recorded, based on worsening of pre-existing urinary disturbances.
Two studies by Denton et al. (53) (randomized treatment with healthy controls) and in Denton et al. (66) (randomized crossover) researched the role of lower limb superficial heating in a total of 43 HSP subjects and 19 controls. The authors demonstrated that heating reduced spasticity, increased dorsiflexor rate of force generation and nerve conduction velocity, and slightly improved gait speed while cooling (53) induced the opposite effects. The application of heating or cooling wrap lasted 30 min.
3.3. Meta-analysis
Considering the aim of this review, the meta-analysis was limited to gait and functional outcome measures. Because of the wide variability of the type of interventions and outcomes, and the small number of studies using the same treatment, a meta-analysis was conducted only on studies describing BoNT-A intervention. Two were excluded because the authors did not specify the data results (54) or presented results in terms of median values, which were not comparable with the others (57). Five studies regarding BoNT-A were included. Comparisons were performed regarding the comfortable gait velocity in four (49, 52, 56, 69), the max gait velocity in three (52, 56, 69), the SPRS in two (55, 69), and the TUG results in two (52, 56) studies. In the study by Servelhere et al. (55), the 10mWT was reported as a global value of mean time and SD; then, it was not comparable with other studies, in which the authors reported the gait velocity. In the study by Rousseaux et al. (49), the results were expressed in terms of median values, but it was possible to calculate the mean gait velocity directly from individual raw data. Considering the heterogeneity of time points of evaluations among the studies, data were compared at baseline (t0), before 2 months as the first time point (t1), and after 2 months as the follow-up time point (t2). The analysis was performed estimating the mean and the standard deviation of the change from baseline to each endpoint.
Table 7 summarizes the data used for the meta-analysis for estimating the effect of the BoNT-A; for each selected study, the number of observations (n), the mean value, and the standard deviation (sd) of the three time points are reported.
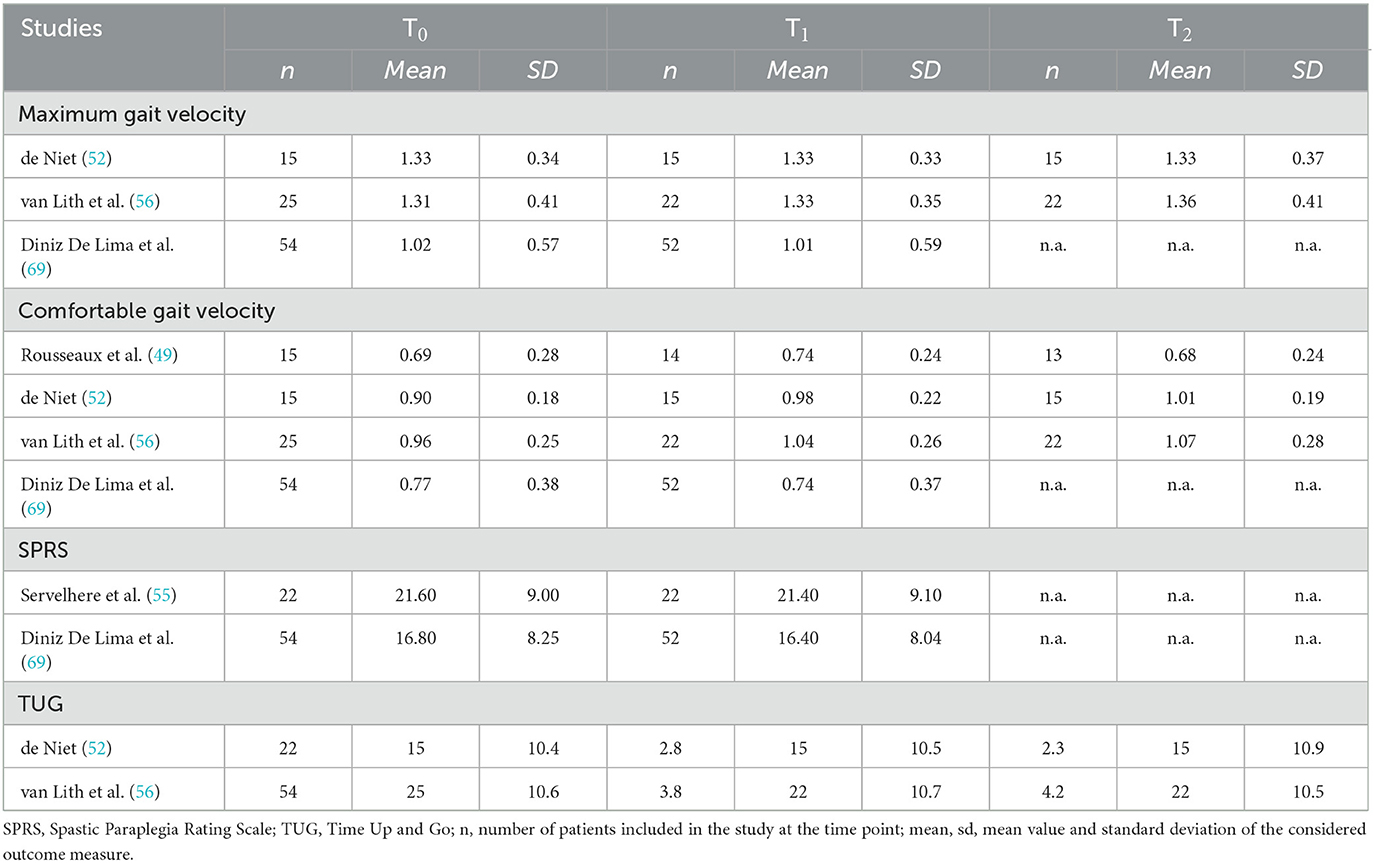
Table 7. Relevant statistics for the meta-analysis.
Figure 4 summarizes the weighted means estimates of the various meta-analyses and the relative standard errors, for each time period. An important variability of the estimates for all the considered parameters was generally evidenced. A non-significant effect of BoNT-A was observed in the comparison of the three time periods on the four considered parameters, except for comfortable gait velocity evaluated from t0 to t2.
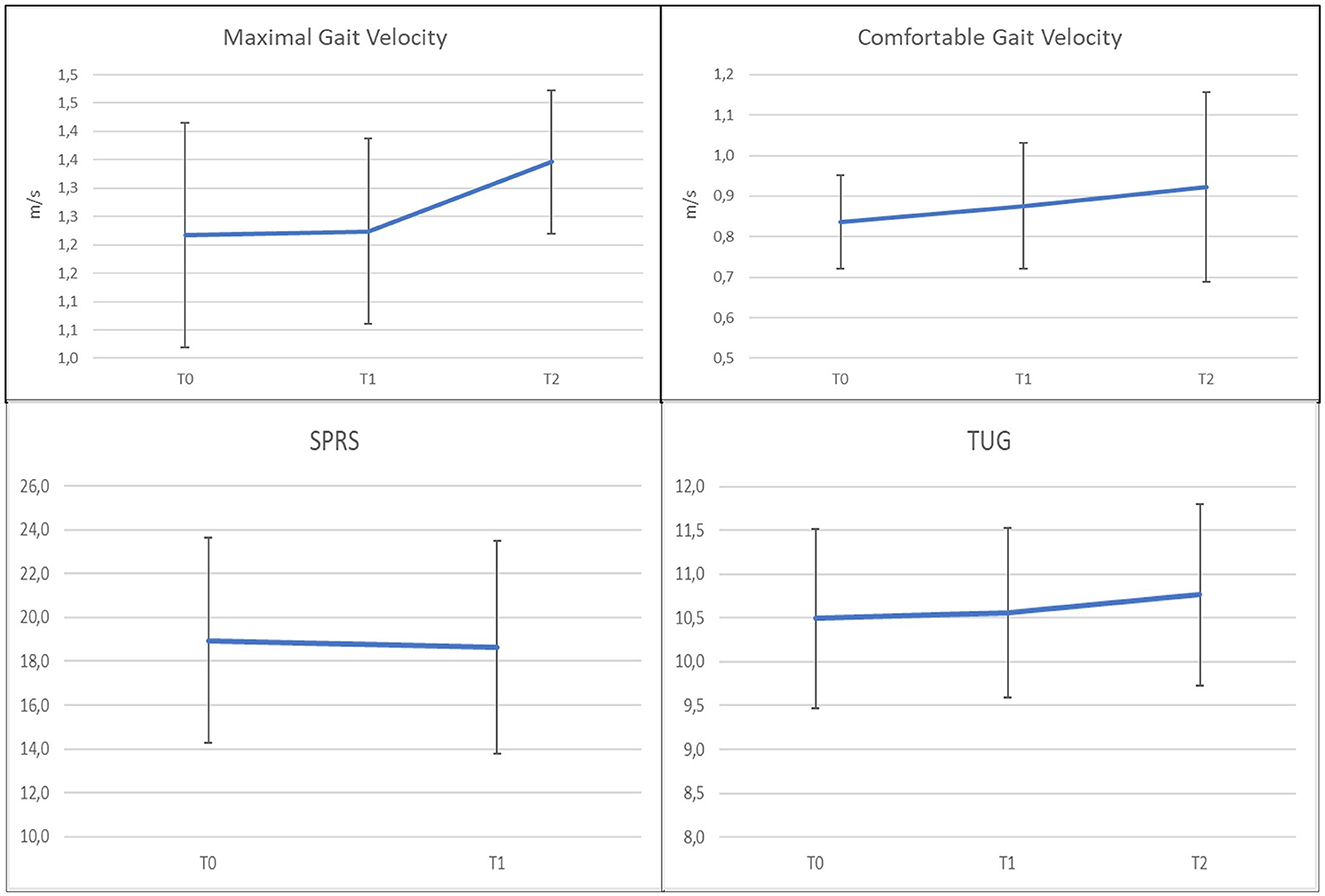
Figure 4. Mean estimates obtained from the meta-analyses relative to Maximal and Comfortable Walking Velocity, SPRS, and TUG, for each examined time period. The error bars represent the standard errors of the estimates of the individual means from the meta-analysis models.
To estimate the effect of botulinum for each of the outcomes of interest, four independent meta-analyses were performed, as represented in Figures 5–8 using forest and funnel plots. The forest plot typically summarizes the results of the meta-analysis. The funnel plot shows the estimated treatment effects in terms of standardized mean difference on the x-axis against the standard error (in an inverted scale) on the y-axis. It shows the form of a triangle symmetric to the average treatment effect, with broad variability for small imprecise studies at the bottom of the plot and small dispersion for large, precise studies at the top.
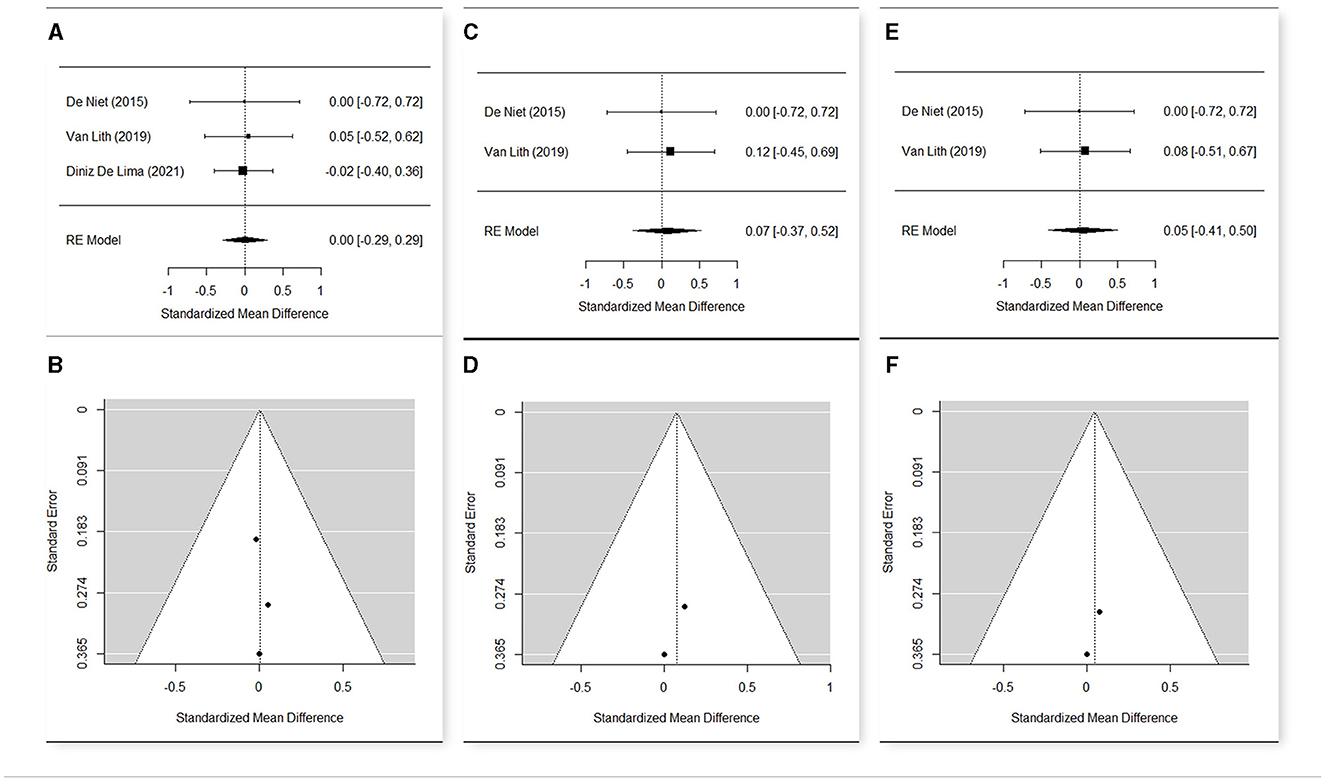
Figure 5. Forest plot (A) and funnel plot (B) for meta-analysis relative to Maximal Gait Velocity t1 vs. t0; Forest plot (C) and funnel plot (D) for meta-analysis relative to Maximal Gait Velocity t2 vs. t0; Forest plot (E) and funnel plot (F) for meta-analysis relative to Maximal Gait Velocity t2 vs. t1.
3.3.1. Maximum gait velocity
The meta-analysis (Figures 5A–F) included three studies (52, 56, 69) that presented an overall heterogeneity (Q = 9.35, p = 0.009 in t0; Q = 10.40, p = 0.005 in t1), so a random effect model was used.
The estimated means were 1.217 in t0 (n = 94; CI [1.019; 1.416]), 1.224 in t1 (n = 89; CI [1.015; 1.432]), and 1.346 (n = 37; CI [1.219; 1.473]) in t2.
The change of the maximum gait velocity was not significant from t0 to t1 (SMD = 0.003; CI [−0.287, +0.293], p = 0.983) nor from t0 to t2 (SMD = 0.073; CI [−0.374, +0.520], p = 0.749). Therefore, the change from t1 to t2 was not significant (SMD = 0.046; CI [−0.409, +0.517], p = 0.843).
This non-significance may depend on the great variability of the individual data, but also on the peculiarities of Diniz De Lima et al. (69), in which the average of the maximum gait velocity was considerably lower than that of the other two studies, both in t0 and in t1. The exclusion of Diniz De Lima et al. (69) from the meta-analysis made the other studies homogeneous (Q = 0.05, p = 0.817), but the changes in the maximum gait velocity remained non-significant.
3.3.2. Comfortable gait velocity
For the comparison of the comfortable gait velocity, four studies were included (49, 52, 56, 69) in the meta-analysis (Figures 6A–F). A random effects model was used, due to the substantial heterogeneity among the studies (Q = 13.26, p = 0.004 in t0; Q = 23.63, p < 0.001 in t1; Q = 21.98, p < 0.001 in t2). The estimated means were 0.837 in t0 (n = 109; CI [0.721; 0.953]), 0.876 in t1 (n = 103; CI [0.721; 1.030]), and 0.922 (n = 50; CI [0.688; 1.157]) in t2. The mean change was not significant from t0 to t1 (SMD = 0.108; CI [−0.163; 0.378]; p = 0.435), weakly significant in the comparison between the baseline and t2 (SMD = 0.335; CI [−0.052; 0.723]; p = 0.089), and again not significant t1 to t2 (SMD = 0.025; CI [−0.365; 0.416]; p = 0.898). Also, in this case, Diniz De Lima (69) was peculiar compared to the other studies, because it presented a negative change of the comfortable gait velocity from t0 to t1 (SMD = −0.08; CI [−0.46; 0.30]). Meta-analysis was then repeated excluding this study. The new results showed a positive estimate of the mean change from t0 to t1, with a noticeably lower p-value, but in any case, non-significant at 95% (SMD = 0.297; CI [−0.086; 0.680]; p = 0.129).
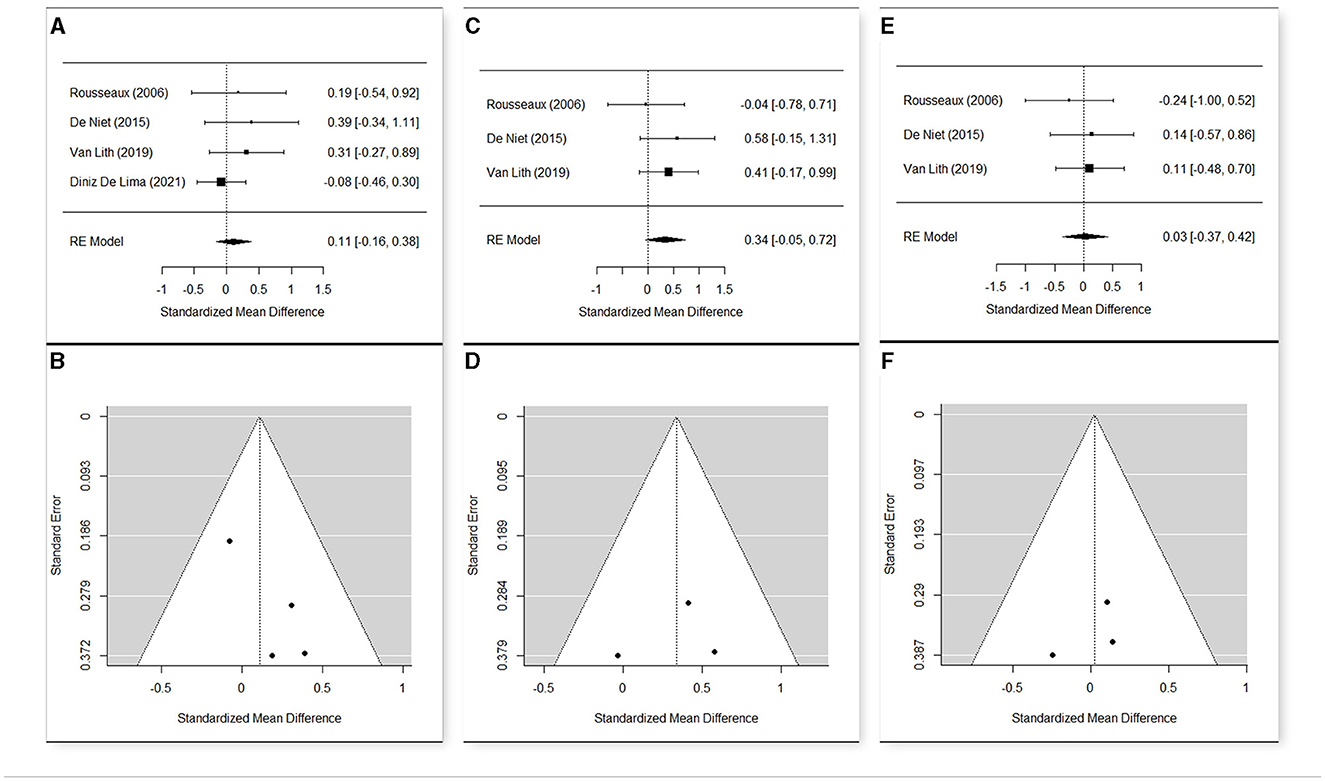
Figure 6. Forest plot (A) and funnel plot (B) for meta-analysis relative to Comfortable Gait Velocity t1 vs. t0; Forest plot (C) and funnel plot (D) for meta-analysis relative to Comfortable Gait Velocity t2 vs. t0; Forest plot (E) and funnel plot (F) for meta-analysis relative to Comfortable Gait Velocity t2 vs. t1.
3.3.3. Spastic paraplegia rating scale
Only two studies (55, 69) were included in the meta-analysis (Figures 7A, B), and in both cases, no follow-up data were present. Data presented heterogeneity in t0 (Q = 4.66, p = 0.0308) and also in t1 (Q = 504, p = 0.0248), so a random effects model was performed. The estimated means of SPRS were 18.948 in t0 (n = 76; CI [14, 269; 23.626]) and 18.643 in t1 (n = 76; CI [13.769; 23.517]), showing a substantial stability of this parameter (SMD = −0.041; CI [−0.359; 0.277]; p = 0.801).
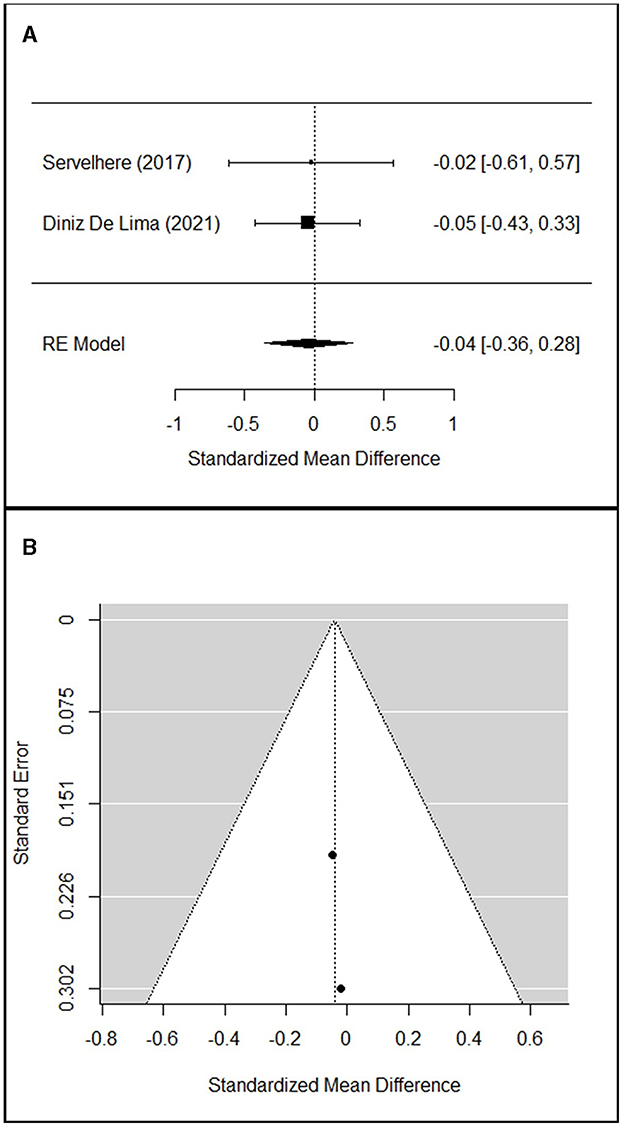
Figure 7. Forest plot (A) and funnel plot (B) for meta-analysis relative to SPRS t1 vs. t0.
3.3.4. Time up and go
The meta-analysis included two studies (52, 56) (Figures 8A–F) for this parameter that resulted quite homogeneous in the three time points (Q = 0.04, p = 0.849 in t0; Q = 0.03, p = 0.852 in t1; Q = 0.13, p = 0.721 in t2). The estimated means were 10.495 in t0 (n = 40; CI [9.468; 11.512]), 10.561 in t1 (n = 37; CI [9.591; 11.531]), and 10.765 (n = 37; CI [9.733; 11.802]) in t2. Due to the large variability of the data, the mean change was not significant from t0 to t1 (SMD = 0.0300; CI [−0.417; 0.477]; p = 0.896), from t0 to t2 (SMD = 0.056; CI [−0.391; 0.504]; p = 0.804), and from t1 to t2 (SMD = 0.038; CI [−0.418; 0.494]; p = 0.870).
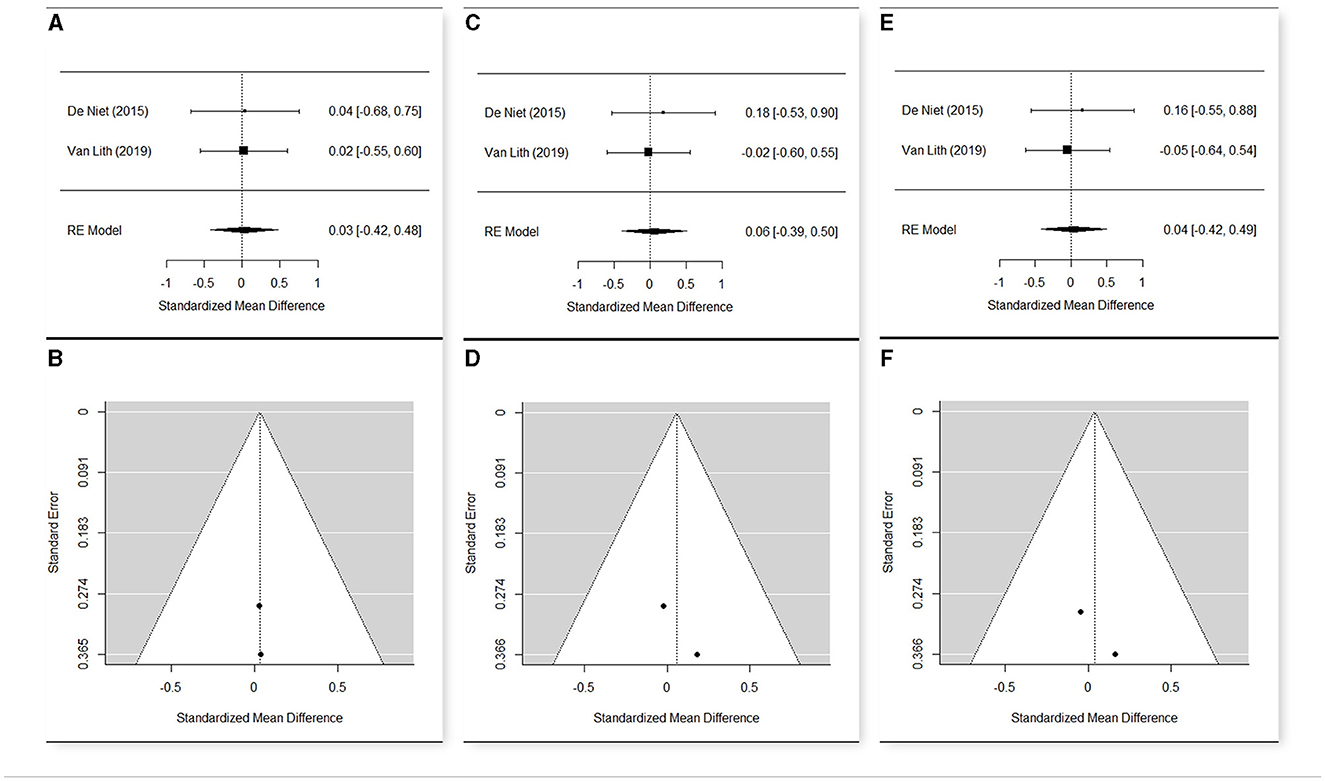
Figure 8. Forest plot (A) and funnel plot (B) for meta-analysis relative to TUG t1 vs. t0; Forest plot (C) and funnel plot (D) for meta-analysis relative to TUG t2 vs. t0; Forest plot (E) and funnel plot (F) for meta-analysis relative to TUG t2 vs. t1.
4. Discussion
One objective of the review was to provide knowledge concerning the characteristics of gait in HSP subjects, which might reveal specific functional compensations and needs, with the secondary purpose of adequately addressing the treatment strategies.
The frame of HSP gait patterns appeared wide and the severity of symptoms varied either among members of the same family (9) or among different ages (7), given an overall progression over time (5, 9). Relevant indicators of HSP progression were identified, such as knee flexion and non-sagittal pelvic movements (5), reduced ROM at the knee, ankle, and hip (41, 46), which appeared to be associated with coactivation and increased energy consumption (42, 46), decreased foot lift (46), and reduced gait velocity (6, 7, 9, 34, 39, 42–44, 70).
Based on the included studies, pathological gait analysis patterns were described in HSP by comparison with healthy subjects, with attempts to identify clusters of gait patterns either in pediatric (5, 7) or in adult (41, 43) HSP subjects. Nonetheless, most of the GA patterns described appeared similar to DCP and stroke for young HSP patients and adults, respectively. Some authors applied cerebral palsy classifications to categorize HSP sagittal kinematics (7, 37).
Nonetheless, some features distinguished HSP from other similar pathological conditions.
Authors who compared the subgroup of young HSP patients to DCP substantially agreed focusing on the knee kinematics as the most typically involved. Similar to DCP, HSP patients presented stiff knee gait with reduced knee and hip flexion in the swing phase, insufficient knee extension in terminal swing, and insufficient hip extension in stance (5, 39, 40). Nonetheless, longer knee hyperextension was often observed during midstance compared to DCP (5, 34, 36, 37). This may be interpreted as compensation to rectus femoris weakness/hypoactivation (quadriceps avoidance pattern) (34, 36) to achieve a supportive reaction and avoid joint collapse during walking, rather than one manifestation of spasticity, as suggested by EMG pattern (36). While DCP subjects presented higher rectus femoris and hamstring activation, low activation of knee extensors was reported in HSP, with increased absorbed power and decreased generated power at the knee (34, 36). Knee extensor weakness was confirmed at the MRC assessment (36). Based on these observations, ankle–foot orthoses, often recommended in DCP to reduce recurvatum of the knee, might interfere with the HSP knee stabilization strategy (34).
Along with HSP progression, an important increase of knee flexion in midstance and at initial contact was observed, which is similar to the crouch pattern in DCP. This condition might be related to hamstring spasticity/over-activity (5), or most probably to failure of the knee extensor moment (47) because of abnormal quadriceps function, associated with inadequate hip extensor moment, due to weakness of hip extensors (5). Furthermore, a crouch gait pattern was observed following Achilles tendon lengthening surgeries in two HSP patients (39).
Differently from DCP, the ankle joint kinematics, such as the mean foot progression and the global ankle functioning, appeared more or less similar to healthy controls, with global normal foot orientation (34, 36, 39).
An increased anterior pelvic tilt with reduced hip extension appeared to be a typical pattern, explained by iliopsoas muscle spasticity (5) or by hip extensors and hamstring weakness with increased lumbar lordosis (40).
Several studies researched upper body behavior, which is a novelty in GA studies. Increased trunk movements in the sagittal and coronal plane with retroposed trunk and lateral flexion were the most recurrent features. They may be attributed to compensatory patterns to muscle weakness, to assist limb clearance in the swing phase, resembling the “hip abductor avoiding gait” and “hip extensor avoidance gait”, respectively, previously described in people with spina bifida (39, 40). Trunk movements were also characterized by a Double-bump trunk pattern, with twice occurring large peaks of the out-of-phase thorax and pelvis movements, throughout the gait cycle (39, 40). This might be a compensation for distal deficits, related to good control of spinal segments, which is typically maintained in HSP patients (39). Moreover, while DCP patients used synchronized (co-contraction) upper limb and pelvis–thorax movements to increase equilibrium, conversely, HSP patients showed significant and rapid spine tilt, with almost normal shoulder and elbow movements (37, 39). Nonetheless, excessive lateral and posterior trunk movements might also lead to increased energy expenditure, then require the use of mobility devices to help energy conservation and prevent future joint deterioration (40).
Compared to DCP, HSP patients presented a more physiological position of the hip in the transversal plane (36, 40), and this was interpreted as a physiological correction of neonatal femur anteversion in the first years of life in HSP patients, compared to a persistence of this condition in DCP patients, where neuromotor anomalies are present at birth (36). Also, Klebe et al. (6) in an adult cohort denied inward foot rotation.
The stiff knee was also reported as the most common pattern in adults affected by HSP, with a reduced ROM at the knee and ankle (38, 42, 44, 46). Similar to younger patients, these patterns were almost unanimously attributed to weakness, confirmed at MRC, and increased stiffness of plantar flexors and quadriceps, rather than spasticity (35, 38). Furthermore, patterns of EMG coactivation at dorsi-plantar flexors (41–43) and extensors–flexors of the knee (41, 42) were described. They were attributed to decreased cortical inhibition, related to the degeneration of the corticospinal tract, which was not completely compensated by extrapyramidal pathways. One alternative pathway, i.e., the reticulospinal system, was studied by van Lith et al. (45), enquiring the APA after SAS. The authors demonstrated that the reticulospinal pathway might compensate for the corticospinal tract degeneration, accelerating TA and RF activation. Conversely, it failed acceleration of SO inhibition, with a persisting deficit of inhibitory motor control.
Finally, increased step width (6, 41, 42, 44, 70) was often reported and might be interpreted as one strategy to increase stability.
The predominant role of weakness above spasticity was confirmed by the intervention studies. Because of secondary weakness, oral baclofen was mostly withdrawn and only 50% of patients responded to bolus infusion test according to Klebe et al. (60). One case report (59) showed improved lower limb locomotor coordination, speed, stride length, and cadence after ITB bolus. Heetla et al. (63) reported improvement after ITB implantation in terms of gait velocity and spasticity reduction, without strength loss, lasting at a 6-month follow-up. The authors suggested that a continuous infusion test was more effective because it allowed a slight dose increase, reducing adverse effects and providing sufficient time for patients to explore positive outcomes. Regarding studies on botulinum injections, the meta-analysis demonstrated a significant improvement limited to the comparison between the baseline and t2 at the comfortable gait velocity, which was not relieved as significant at t0-t1. This might be attributed to an initial limiting role of post-botulinum weakness (52) that was subsequently overcome. Nonetheless, a significant improvement was not observed at maximum gait velocity. This might be related to an increase in spasticity (even after pharmacological inhibition) and more impaired motor control, associated with augmented velocity. Functional improvements were reported, in particular, in the study by Paparella et al. (57), but botulinum was followed by intensive physiotherapy, which might have contributed to the improvements, based on increased physical activity and reconditioning as observed after gait training. In addition, some concerns should be considered regarding the analysis and the reporting of results in the study by Paparella et al. (57).
A meta-analysis was not possible; however, functional improvements were reported by individual studies after intensive active interventions, such as physical therapy training (including stretching, strengthening, and functional exercises), hydrotherapy, and robotic gait training. Significant or close to significant improvements were reported, in particular, for gait velocity, and, whenever measured, for BBS, TUG, and 10MWT. Only one case report by Seo et al. (64) reported a contradictory reduction of TUG and 6MWT after robot-assisted gait training, while other outcome measures improved (speed, 10MWT, and BBS). The positive rebound of such intensive active interventions might rely on reconditioning through augmented physical activity, as in other pathological conditions (77, 78). Nonetheless, no significant changes in kinematics and kinetics were observed, suggesting that physical activity might improve fitness and the ability to perform compensatory strategies rather than modifying gait patterns. Furthermore, the evidence is limited by a lack of follow-up and very small samples. The benefits might recede following the withdrawal of the training, as it is, for example, in cerebral palsy (77), which has the advantage of being a non-progressive disease. As for the general population, it is advisable to increase physical activity, hopefully integrated into daily life, to maintain or improve fitness, with a possible positive impact on gross motor activities. Nonetheless, this is limited to subjects with sufficient motor skills to be able to undertake training.
Two studies by Denton et al. (53, 66) demonstrated that superficial warming of the legs may reduce spasticity and increase nerve conduction velocity in the very short term, while the opposite effect may be expected by cooling. This confirms previous data (79) supporting the application of such techniques in immediate pre-stretch or pre-exercise periods.
FES (58, 71) determined an improvement limited to gait velocity, but long-term follow-up was missing and samples were small. No improvement was reported at the functional test (SPRS, gait velocity, TUG, 5MWT, and 10MWT) after rTMS (67), tsDCS (68), and ETOIMS (65). Furthermore, sample size and follow-up were very limited. Only one case report (8) researching SCS described improvements at SPRS at 12 months after implantation. Nonetheless, increased difficulty in controlling gait balance and uncomfortable paresthesia was referred by the patient. The authors attributed it to the SCS-induced block of proprioceptive pathways (8). Information about any adverse effects was missing in the other studies, except for rTMS. Antczak et al. (67) reported one case of a seizure occurring during the third session of stimulation, which induced the patient to drop out of the trial. One patient complained of sleeplessness and several subjects reported headaches during the first and second sessions of stimulation, but they all completed the study. Based on the included studies, further evidence is needed to support the role of previous techniques, which might be considered complementary interventions.
4.1. Safety and feasibility aspects
Computerized gait analysis is a safe procedure in patients with HSP of any age (no unfavorable events were reported), and only in one study, did six patients require a safety belt suspended from the ceiling of the laboratory, without weight support.
Muscle weakness was the main adverse effect reported following botulinum injections and intrathecal baclofen test. Nonetheless, it resolved at the termination of the pharmacological effect. Minor and uncommon side effects, after botulinum injections, were bruising, transient pain, paresthesia, falls or stumbles, decreased balance confidence (52, 69), slurred speech, handwriting incoordination, and inability to stand up and walk (55). Seizure (one subject) was reported as a major adverse effect following rTMS (67). Minor side effects were sleeplessness (one subject) and headache.
4.2. Limitations
One limitation of the present study was not considering the study design as an exclusion criterion, intending to collect as much data as possible in such a rare pathological condition and maintain a more powerful study design. Furthermore, we did not distinguish between the internal validity and statistical analysis validity of the studies, and a statistical analysis of quality score assessment was not performed.
The principal limitation concerning studies researching the GA pattern was that they included only subjects who could walk, without assistive devices, for a sufficient distance to carry out the exam. Therefore, more compromised patients were excluded from the pattern analysis.
Furthermore, limited to young HSP subjects, almost all studies performed the GA once, except Armand et al. (9), and longitudinal information about gait patterns is lacking. Therefore, any possible change related to growth or HSP progression has not been studied.
Relative to intervention studies, several limitations must be underlined: short or lacking follow-up, small samples, wide variability in treatment protocol, and most of all, the absence of studies involving younger HSP subjects.
Finally, most of the included studies, in particular, those researching the GA patterns, were limited to pure forms of HSP. This met the need to select uniform samples and reduce confounders. Nonetheless, a partial representation emerged of the more complex and wide range of HSP clinical phenotypes.
5. Conclusion
Knee kinematics and kinetics represent the most peculiar patterns in HSP, compared to DCP and stroke, in particular, related to knee hyperextension in midstance, as compensation to plantar flexor-knee extensor couple deficit.
Other typical patterns are non-sagittal pelvic movements and reduced ROM at the knee, ankle, and hip, which relates to coactivation and increased energy consumption.
Spasticity in HSP hinders muscle weakness, so caution is required while considering interventions to reduce spasticity. Botulinum induced a significant improvement in gait at a comfortable velocity approximately 2–3 months after the injection. This improvement resulted as non-significant immediately after the treatment, probably due to initial weakness.
Limited evidence suggests that intensive physical activity (overground or robot-assisted gait training, functional exercises, and hydrotherapy) and FES might determine improvement in the very short term in gait velocity-related outcomes. Future studies are needed to study the effectiveness of these approaches in HSP subjects.
Data availability statement
The raw data supporting the conclusions of this article will be made available by the authors, without undue reservation.
Author contributions
SF: Conceptualization, Investigation, Methodology, Writing – original draft, Writing – review and editing. AC: Investigation, Methodology, Writing – original draft. NF: Data curation, Formal analysis, Methodology, Writing – original draft. GM: Investigation, Writing – original draft. IS: Investigation, Writing – original draft. SS: Supervision, Writing – review and editing.
Funding
The author(s) declare that no financial support was received for the research, authorship, and/or publication of this article.
Conflict of interest
The authors declare that the research was conducted in the absence of any commercial or financial relationships that could be construed as a potential conflict of interest.
Publisher's note
All claims expressed in this article are solely those of the authors and do not necessarily represent those of their affiliated organizations, or those of the publisher, the editors and the reviewers. Any product that may be evaluated in this article, or claim that may be made by its manufacturer, is not guaranteed or endorsed by the publisher.
Supplementary material
The Supplementary Material for this article can be found online at: https://www.frontiersin.org/articles/10.3389/fneur.2023.1256392/full#supplementary-material
Abbreviations
10MWT, 10-m walking test; 2MWT, 2-min walking test; APAs, anticipatory postural adjustments; BoNT-A, Botulinum Neurotoxin-A; COM, center of mass; COP, center of pressure; DCP, diplegic cerebral palsy; FES, functional electric stimulation; FRT, Functional Reach Test; GA, gait analysis; HSP, hereditary spastic paraplegia; ITB, intrathecal baclofen; MAS, modified Ashworth scale; MOS, margin of stability; MRC, Medical Research Council; NRS, numeric rating scale; RF, rectus femoris; RoB, risk of bias; ROM, range of motion; rTMS, transcranial magnetic stimulation; SAS, starling acoustic stimulus; SCS, spinal cord stimulation; SO, soleus; SPRS, Spastic Paraplegia Rating Scale; SSP, sporadic spastic paraplegia; TA, tibialis anterior; TUG, Timed UP and Go test; UMN, upper motor neuron; VAS, visual analogical scale; VEP, visual evoked potential; WHS, Walking Handicap Scale.
References
1. Lo Giudice T, Lombardi F, Santorelli FM, Kawarai T, Orlacchio A. Hereditary spastic paraplegia: clinical-genetic characteristics and evolving molecular mechanisms. Exp Neurol Nov. (2014) 261:518–39. doi: 10.1016/j.expneurol.2014.06.011
2. Salinas S, Proukakis C, Crosby A, Warner TT. Hereditary spastic paraplegia: clinical features and pathogenetic mechanisms. Lancet Neurol Dec. (2008) 7:1127–38. doi: 10.1016/S1474-4422(08)70258-8
3. Sanger TD, Delgado MR, Gaebler-Spira D, Hallett M, Mink JW. Disorders TFoCM. Classification and definition of disorders causing hypertonia in childhood. Pediatrics. (2003) 111:e89–97. doi: 10.1542/peds.111.1.e89
4. Fink JK, Heiman-Patterson T, Bird T, Cambi F, Dubé MP, Figlewicz DA, et al. Hereditary spastic paraplegia: advances in genetic research. Hereditary Spastic Paraplegia Working group. Neurology. (1996) 46:1507–14. doi: 10.1212/WNL.46.6.1507
5. Pulido-Valdeolivas I, Gómez-Andrés D, Martín-Gonzalo JA, Rodríguez-Andonaegui I, López-López J, Pascual-Pascual SI, et al. Gait phenotypes in paediatric hereditary spastic paraplegia revealed by dynamic time warping analysis and random forests. PLoS ONE. (2018) 13:e0192345. doi: 10.1371/journal.pone.0192345
6. Klebe S, Stolze H, Kopper F, Lorenz D, Wenzelburger R, Volkmann J, et al. Gait analysis of sporadic and hereditary spastic paraplegia. J Neurol. (2004) 251:571–8. doi: 10.1007/s00415-004-0366-7
7. Van Beusichem AE, Nicolai J, Verhoeven J, Speth L, Coenen M, Willemsen MA, et al. Mobility characteristics of children with spastic paraplegia due to a mutation in the KIF1A gene. Neuropediatrics. (2020) 51:146–53. doi: 10.1055/s-0039-3400988
8. Pinto de Souza C, Coelho DB, Campos DDSF, Dos Santos Ghilardi MG, de Oliveira Vicente EC, González-Salazar C, et al. Spinal cord stimulation improves motor function and gait in spastic paraplegia type 4 (SPG4): clinical and neurophysiological evaluation Parkinsonism. Relat Disord. (2021) 83:1–5. doi: 10.1016/j.parkreldis.2020.12.008
9. Armand S, Turcot K, Bonnefoy-Mazure A, Lascombes P, De Coulon G. Gait evolution in a family with hereditary spastic paraplegia. Eur J Paediatr Neurol. (2015) 19:87–92. doi: 10.1016/j.ejpn.2014.08.001
10. Fink JK. Hereditary spastic paraplegia. Curr Neurol Neurosci Rep. (2006) 6:65–76. doi: 10.1007/s11910-996-0011-1
11. Fink JK. Hereditary spastic paraplegia: clinico-pathologic features and emerging molecular mechanisms. Acta Neuropathol. (2013) 126:307–28. doi: 10.1007/s00401-013-1115-8
12. Harding AE. Classification of the hereditary ataxias and paraplegias. Lancet. (1983) 1:1151–5. doi: 10.1016/S0140-6736(83)92879-9
13. Harding AE. Hereditary “pure” spastic paraplegia: a clinical and genetic study of 22 families. J Neurol Neurosurg Psychiatry. (1981) 44:871–83. doi: 10.1136/jnnp.44.10.871
14. Nonnekes J, van Lith B, van de Warrenburg BP, Weerdesteyn V, Geurts ACH. Pathophysiology, diagnostic work-up and management of balance impairments and falls in patients with hereditary spastic paraplegia. J Rehabil Med. (2017) 49:369–77. doi: 10.2340/16501977-2227
15. Patrick JH, Keenan MA. Gait analysis to assist walking after stroke. Lancet. (2007) 369:256–7. doi: 10.1016/S0140-6736(07)60124-X
16. Bellofatto M, De Michele G, Iovino A, Filla A, Santorelli FM. Management of Hereditary Spastic Paraplegia: A Systematic Review of the Literature. Front Neurol. (2019) 10:3. doi: 10.3389/fneur.2019.00003
17. Trummer B, Haubenberger D, Blackstone C. Clinical trial designs and measures in hereditary spastic paraplegias. Front Neurol. (2018) 9:1017. doi: 10.3389/fneur.2018.01017
18. Page MJ, Moher D, Bossuyt PM, Boutron I, Hoffmann TC, Mulrow CD, et al. PRISMA 2020 explanation and elaboration: updated guidance and exemplars for reporting systematic reviews. BMJ. (2021) 372:n160. doi: 10.1136/bmj.n160
19. Higgins JPT. TJ, Chandler J, Cumpston M, Li T, Page MJ, Welch VA. Cochrane Handbook for Systematic Reviews of Interventions, 2nd Edn. Chichester: John Wiley &Sons. (2019).
20. McDermott CJ, Shaw PJ. Chapter 17 Hereditary spastic paraparesis. Handb Clin Neurol. (2007) 82:327–52. doi: 10.1016/S0072-9752(07)80020-0
21. Moola MZ, Tufanaru C, Aromataris E, Sears K, Sfetcu R, Currie M, et al. JBI Manual for Evidence Synthesis. Systematic Reviews of Etiology and Risk. London: The Joanna Briggs Institute (2017).
22. George PP, DeCastro Molina JA, Heng BH. The methodological quality of systematic reviews comparing intravitreal bevacizumab and alternates for neovascular age related macular degeneration: a systematic review of reviews. Indian J Ophthalmol Jul. (2014) 62:761–7. doi: 10.4103/0301-4738.138615
23. National Heart Lung and Blood Institute. Study Quality Assessment Tools. Bethesda, MD: National Heart Lung and Blood Institute (2021).
24. Ma LL, Wang YY, Yang ZH, Huang D, Weng H, Zeng XT. Methodological quality (risk of bias) assessment tools for primary and secondary medical studies: what are they and which is better? Mil Med Res. (2020) 7:7. doi: 10.1186/s40779-020-00238-8
25. Cashin AG, McAuley JH. Clinimetrics: physiotherapy evidence database (PEDro) scale. J Physiother. (2020) 66:59. doi: 10.1016/j.jphys.2019.08.005
26. Sterne JA, Hernán MA, Reeves BC, Savović J, Berkman ND, Viswanathan M, et al. ROBINS-I: a tool for assessing risk of bias in non-randomised studies of interventions. BMJ. (2016) 355:i4919. doi: 10.1136/bmj.i4919
27. Available, online at: https://sites.google.com/site/riskofbiastool/welcome/home/current-version-of-robins-i?authuser=0.ROBINS-I (accessed September 15, 2022).
28. Sterne JAC, Savović J, Page MJ, Elbers RG, Blencowe NS, Boutron I, et al. RoB 2: a revised tool for assessing risk of bias in randomised trials. BMJ. (2019) 366:l4898. doi: 10.1136/bmj.l4898
29. Available, online at: https://www.riskofbias.info/welcome/rob-2-0-tool/rob-2-for-crossover-trials.RoB2 (accessed September 15, 2022).
30. R Core Team. R: A Language and Environment for Statistical Computing. R Foundation for Statistical Computing. Vienna: R Core Team (2021).
31. Viechtbauer W. Conducting meta-analyses in R with the metafor Package. J Stat Software. (2010) 5:1–48. doi: 10.18637/jss.v036.i03
32. Cochran WG. The combination of estimates from different experiments. Biometrics. (1954) 10:101–29. doi: 10.2307/3001666
33. Morris SB. Distribution of the standardized mean change effect size for meta-analysis on repeated measures. Br J Math Stat Psychol. (2000) 53:17–29. doi: 10.1348/000711000159150
34. Cimolin V, Piccinini L, D'Angelo MG, Turconi AC, Berti M, Crivellini M, et al. Are patients with hereditary spastic paraplegia different from patients with spastic diplegia during walking? Gait evaluation using 3D gait analysis. Funct Neurol. (2007) 22:23–8. .
35. de Niet M, Latour H, Hendricks H, Geurts AC, Weerdesteyn V. Short-latency stretch reflexes do not contribute to premature calf muscle activity during the stance phase of gait in spastic patients. Arch Phys Med Rehabil. (2011) 92:1833–9. doi: 10.1016/j.apmr.2011.05.025
36. Piccinini L, Cimolin V, D'Angelo MG, Turconi AC, Crivellini M, et al. 3D gait analysis in patients with hereditary spastic paraparesis and spastic diplegia: a kinematic, kinetic and EMG comparison. Eur J Paediatr Neurol. (2011) 15:138–45. doi: 10.1016/j.ejpn.2010.07.009
37. Wolf SI, Braatz F, Metaxiotis D, Armbrust P, Dreher T, Döderlein L, et al. Gait analysis may help to distinguish hereditary spastic paraplegia from cerebral palsy. Gait Posture. (2011) 33:556–61. doi: 10.1016/j.gaitpost.2011.01.009
38. Marsden J, Ramdharry G, Stevenson V, Thompson A. Muscle paresis and passive stiffness: key determinants in limiting function in Hereditary and Sporadic Spastic Paraparesis. Gait Posture. (2012) 35:266–71. doi: 10.1016/j.gaitpost.2011.09.018
39. Bonnefoy-Mazure A, Turcot K, Kaelin A, De Coulon G, Armand S. Full body gait analysis may improve diagnostic discrimination between hereditary spastic paraplegia and spastic diplegia: a preliminary study. Res Dev Disabil. (2013) 34:495–504. doi: 10.1016/j.ridd.2012.09.005
40. Adair B, Rodda J, McGinley JL, Graham HK, Morris ME. Kinematic gait deficits at the trunk and pelvis: characteristic features in children with hereditary spastic paraplegia. Dev Med Child Neurol Aug. (2016) 58:829–35. doi: 10.1111/dmcn.13082
41. Serrao M, Rinaldi M, Ranavolo A, Lacquaniti F, Martino G, Leonardi L, et al. Gait Patterns in Patients with Hereditary Spastic Paraparesis. PLoS ONE. (2016) 11:e0164623. doi: 10.1371/journal.pone.0164623
42. Rinaldi M, Ranavolo A, Conforto S, Martino G, Draicchio F, Conte C, et al. Increased lower limb muscle coactivation reduces gait performance and increases metabolic cost in patients with hereditary spastic paraparesis. Clin Biomech. (2017) 48:63–72. doi: 10.1016/j.clinbiomech.2017.07.013
43. Martino G, Ivanenko Y, Serrao M, Ranavolo A, Draicchio F, Rinaldi M, et al. Differential changes in the spinal segmental locomotor output in Hereditary Spastic Paraplegia. Clin Neurophysiol. (2018) 129:516–25. doi: 10.1016/j.clinph.2017.11.028
44. Serrao M, Chini G, Bergantino M, Sarnari D, Casali C, Conte C, et al. Identification of specific gait patterns in patients with cerebellar ataxia, spastic paraplegia, and Parkinson's disease: a non-hierarchical cluster analysis. Hum Mov Sci. (2018) 57:267–79. doi: 10.1016/j.humov.2017.09.005
45. van Lith BJH, Coppens MJM, Nonnekes J, van de Warrenburg BPC, Geurts AC, Weerdesteyn V. StartReact during gait initiation reveals differential control of muscle activation and inhibition in patients with corticospinal degeneration. J Neurol Nov. (2018) 265:2531–9. doi: 10.1007/s00415-018-9027-0
46. Martino G, Ivanenko Y, Serrao M, Ranavolo A, Draicchio F, Casali C, et al. Locomotor coordination in patients with Hereditary Spastic Paraplegia. J Electromyogr Kinesiol. (2019) 45:61–9. doi: 10.1016/j.jelekin.2019.02.006
47. Malone A, Kiernan D, O'Brien T. Bilateral sleeve fractures of the patella in a 12-year-old boy with hereditary spastic paraparesis and crouch gait. BMJ Case Rep. (2013) 2013:217. doi: 10.1136/bcr-2013-202217
48. Klebe S, Deuschl G, Stolze H. Methylphenidate fails to improve gait and muscle tone in patients with sporadic and hereditary spastic paraplegia. Mov Disord. (2006) 21:1468–71. doi: 10.1002/mds.20973
49. Rousseaux M, Launay MJ, Kozlowski O, Daveluy W. Botulinum toxin injection in patients with hereditary spastic paraparesis. Eur J Neurol. (2007) 14:206–12. doi: 10.1111/j.1468-1331.2006.01617.x
50. Zhang Y, Roxburgh R, Huang L, Parsons J, Davies TC. The effect of hydrotherapy treatment on gait characteristics of hereditary spastic paraparesis patients. Gait Posture. (2014) 39:1074–9. doi: 10.1016/j.gaitpost.2014.01.010
51. Bertolucci F, Di Martino S, Orsucci D, Ienco EC, Siciliano G, Rossi B, et al. Robotic gait training improves motor skills and quality of life in hereditary spastic paraplegia. NeuroRehabilitation. (2015) 36:93–9. doi: 10.3233/NRE-141196
52. de Niet M. Functional effects of botulinum toxin type-A treatment and subsequent stretching of spastic calf muscles: a study in patients with hereditary spastic paraplegia. J Rehab Med. (2015) 2:147–53. doi: 10.2340/16501977-1909
53. Denton A, Bunn L, Hough A, Bugmann G, Marsden J. Superficial warming and cooling of the leg affects walking speed and neuromuscular impairments in people with spastic paraparesis. Ann Phys Rehabil Med. (2016) 59:326–32. doi: 10.1016/j.rehab.2016.04.006
54. Marvulli R, Lopopolo AL, Dantone A, Palmisano V, Lancioni G, Fiore P et al. Combined treatment FKT-botulinum toxin type A (BTX-A) in patients with Strumpell-Lorrain disease. Curr Pharm Des. (2016) 22:758–63. doi: 10.2174/1381612822666151204001830
55. Servelhere KR, Faber I, Martinez A, Nickel R, Moro A, Germiniani FMB, et al. Botulinum toxin for hereditary spastic paraplegia: effects on motor and non-motor manifestations. Arq Neuropsiquiatr. (2018) 76:183–8. doi: 10.1590/0004-282x20180013
56. van Lith BJH, den Boer J, van de Warrenburg BPC, Weerdesteyn V, Geurts AC. Functional effects of botulinum toxin type A in the hip adductors and subsequent stretching in patients with hereditary spastic paraplegia. J Rehabil Med. (2019) 51:434–41. doi: 10.2340/16501977-2556
57. Paparella G, Vavla M, Bernardi L, Girardi G, Stefan C, Martinuzzi A. Efficacy of a combined treatment of botulinum toxin and intensive physiotherapy in hereditary spastic paraplegia. Front Neurosci. (2020) 14:111. doi: 10.3389/fnins.2020.00111
58. Pease WS. Therapeutic electrical stimulation for spasticity: quantitative gait analysis. Am J Phys Med Rehabil. (1998) 77:351–5. doi: 10.1097/00002060-199807000-00021
59. Dan B, Bouillot E, Bengoetxea A, Cheron G. Effect of intrathecal baclofen on gait control in human hereditary spastic paraparesis. Neurosci Lett. (2000) 280:175–8. doi: 10.1016/S0304-3940(00)00778-3
60. Klebe S, Stolze H, Kopper F, Lorenz D, Wenzelburger R, Deuschl G, et al. Objective assessment of gait after intrathecal baclofen in hereditary spastic paraplegia. J Neurol. (2005) 252:991–3. doi: 10.1007/s00415-005-0792-1
61. Molteni F, Carda S, Cazzaniga M, Magoni L, Rossini M, Caimmi M. Instrumental evaluation of gait modifications before and during intrathecal baclofen therapy: a 2-year follow-up case study. Am J Phys Med Rehabil. (2005) 84:303–6. doi: 10.1097/01.PHM.0000156892.04239.B6
62. Samuel AA, Vencita K, Trapthi P. Physical therapy interventions for the patient with hereditary spastic paraparesis – An exploratory case reports. Int J Physiother Res. (2013) 24:110–3.
63. Heetla HW, Halbertsma JP, Dekker R, Staal MJ, van Laar T. Improved gait performance in a patient with hereditary spastic paraplegia after a continuous intrathecal baclofen test infusion and subsequent pump implantation: a case report. Arch Phys Med Rehabil. (2015) 96:1166–9. doi: 10.1016/j.apmr.2015.01.012
64. Seo HG, Oh BM, Kim K. Robot-assisted gait training in a patient with hereditary spastic paraplegia. PMR. (2015) 7:210–3. doi: 10.1016/j.pmrj.2014.09.008
65. Shin S, Park J, Hong J, Park JH. Improved gait speed in spastic paraplegia: a new modality. BMJ Support Palliat Care. (2020) 10:e41. doi: 10.1136/bmjspcare-2018-001738
66. Denton AL, Hough AD, Freeman JA, Marsden JF. Effects of superficial heating and insulation on walking speed in people with hereditary and spontaneous spastic paraparesis: a randomised crossover study. Ann Phys Rehabil Med. (2018) 61:72–7. doi: 10.1016/j.rehab.2017.12.001
67. Antczak J, Pera J, Dabroś M, Kozmiński W, Czyzycki M, Wezyk K, et al. The effect of repetitive transcranial magnetic stimulation on motor symptoms in hereditary spastic paraplegia. Neural Plast. (2019) 2019:7638675. doi: 10.1155/2019/7638675
68. Ardolino G, Bocci T, Nigro M, Vergari M, Di Fonzo A, Bonato S, et al. Spinal direct current stimulation (tsDCS) in hereditary spastic paraplegias (HSP): a sham-controlled crossover study. J Spinal Cord Med. (2021) 44:46–53. doi: 10.1080/10790268.2018.1543926
69. Diniz De Lima F, Faber I, Servelhere KR. Randomized trial of botulinum toxin type A in hereditary spastic paraplegia - the SPASTOX trial. Mov Disor. (2021) 36:1654–63. doi: 10.1002/mds.28523
70. van Vugt Y, Stinear J, Claire Davies T, Zhang Y. Postural stability during gait for adults with hereditary spastic paraparesis. J Biomech. (2019) 88:12–7. doi: 10.1016/j.jbiomech.2019.03.001
71. Marsden J, Stevenson V, McFadden C, Swain I, Taylor P. The effects of functional electrical stimulation on walking in hereditary and spontaneous spastic paraparesis. Neuromodulation. (2013) 16:256–60. doi: 10.1111/j.1525-1403.2012.00494.x
72. Ian Davidson VFH. Comparison of four methods of allocation for clinical trials with small sample sizes. Physiotherapy. (2002) 14:722–9. doi: 10.1016/S0031-9406(05)60715-8
73. Rodda JM, Graham HK, Carson L, Galea MP, Wolfe R. Sagittal gait patterns in spastic diplegia. J Bone Joint Surg Br. (2004) 86:251–8. doi: 10.1302/0301-620X.86B2.13878
74. Sutherland DH, Davids JR. Common gait abnormalities of the knee in cerebral palsy. Clin Orthop Relat Res. (1993) (288):139–47. doi: 10.1097/00003086-199303000-00018
75. Baker R, McGinley JL, Schwartz MH, et al. The gait profile score and movement analysis profile. Gait Posture. (2009) 30:265–9. doi: 10.1016/j.gaitpost.2009.05.020
76. Samuel AJ, Aranha VP, Kamath T, Pokhrel M. Physical therapy interventions for the patients with hereditary spastic paraparesis: an exploratory case reports. Int J Physioth Res. (2013) 5:110–3.
77. Ryan JM, Cassidy EE, Noorduyn SG, O'Connell NE. Exercise interventions for cerebral palsy. Cochrane Database Syst Rev. (2017) 6:CD011660. doi: 10.1002/14651858.CD011660.pub2
78. Picelli A, Melotti C, Origano F, Waldner A, Fiaschi A, Santilli V, et al. Robot-assisted gait training in patients with Parkinson disease: a randomized controlled trial. Neurorehabil Neural Repair. (2012) 26:353–61. doi: 10.1177/1545968311424417
Keywords: gait analysis, walking, physical therapy modalities, rehabilitation, spasticity, botulinum toxins, spastic paraparesis, gait disorders
Citation: Faccioli S, Cavalagli A, Falocci N, Mangano G, Sanfilippo I and Sassi S (2023) Gait analysis patterns and rehabilitative interventions to improve gait in persons with hereditary spastic paraplegia: a systematic review and meta-analysis. Front. Neurol. 14:1256392. doi: 10.3389/fneur.2023.1256392
Received: 10 July 2023; Accepted: 29 August 2023;
Published: 20 September 2023.
Edited by:
Teresa Paolucci, University of Studies G. d'Annunzio Chieti and Pescara, ItalyReviewed by:
Marco Paoloni, Sapienza University of Rome, ItalyMariano Serrao, Sapienza University of Rome, Italy
Copyright © 2023 Faccioli, Cavalagli, Falocci, Mangano, Sanfilippo and Sassi. This is an open-access article distributed under the terms of the Creative Commons Attribution License (CC BY). The use, distribution or reproduction in other forums is permitted, provided the original author(s) and the copyright owner(s) are credited and that the original publication in this journal is cited, in accordance with accepted academic practice. No use, distribution or reproduction is permitted which does not comply with these terms.
*Correspondence: Silvia Faccioli, silviaeffe73@gmail.com; silvia.faccioli@ausl.re.it
†These authors have contributed equally to this work and share first authorship