 Yan Chen1,2†
 Fabin Lin1,2†
 Kaifeng Wang3†
 Feng Chen3†
 Ruxian Wang3
 Minyun Lai3Chunmei Chen1,2*Rui Wang1,2*
- 1Pingtan Comprehensive Experimentation Area Hospital, Pingtan, China
- 2Fujian Medical University Union Hospital, Fuzhou, Fujian, China
- 3Fujian Medical University, Fuzhou, Fujian, China
Background: The aim of this study is to develop a predictive model utilizing deep learning and machine learning techniques that will inform clinical decision-making by predicting the 1-year postoperative recovery of patients with lumbar disk herniation.
Methods: The clinical data of 470 inpatients who underwent tubular microdiscectomy (TMD) between January 2018 and January 2021 were retrospectively analyzed as variables. The dataset was randomly divided into a training set (n = 329) and a test set (n = 141) using a 10-fold cross-validation technique. Various deep learning and machine learning algorithms including Random Forests, Extreme Gradient Boosting, Support Vector Machines, Extra Trees, K-Nearest Neighbors, Logistic Regression, Light Gradient Boosting Machine, and MLP (Artificial Neural Networks) were employed to develop predictive models for the recovery of patients with lumbar disk herniation 1 year after surgery. The cure rate score of lumbar JOA score 1 year after TMD was used as an outcome indicator. The primary evaluation metric was the area under the receiver operating characteristic curve (AUC), with additional measures including decision curve analysis (DCA), accuracy, sensitivity, specificity, and others.
Results: The heat map of the correlation matrix revealed low inter-feature correlation. The predictive model employing both machine learning and deep learning algorithms was constructed using 15 variables after feature engineering. Among the eight algorithms utilized, the MLP algorithm demonstrated the best performance.
Conclusion: Our study findings demonstrate that the MLP algorithm provides superior predictive performance for the recovery of patients with lumbar disk herniation 1 year after surgery.
Introduction
Lumbar disk herniation (LDH) is a common and frequently occurring disease that is the most common cause of back and leg pain, resulting in great suffering such as reduced ability to work and learn, reduced quality of life, and even disability (1). Surgery, especially tubular microscopic discectomy (TMD), has become the conventional treatment for LDH in recent years (2). TMD is a minimally invasive method to remove the herniated disk from the posterior approach using surgical microscopic instruments. However, there are several factors that can affect postoperative recovery (3). Clinical predictive modeling (CPM) is a statistical model based on multiple pathologies of the disease that can predict the risk of certain future outcomes in patients with certain characteristics (4, 5). Building statistical models requires a large amount of clinical data, and machine learning (ML) algorithms can accurately process the raw data, analyze the connections between important data, and make accurate decisions (6). With the widespread use of machine learning, deep learning, as an important branch of machine learning, has advantages in automatic feature learning and function simulation construction (7–9). Due to the complexity and size of clinical data, using deep learning models and machine learning can improve the accuracy of models and predictions in data processing, as well as in building clinical models (10, 11). The goal of this study is to develop a predictive model based on deep learning and machine learning for the recovery of patients with lumbar disk herniation 1 year after surgery.
Methods
All data for this study were obtained from the Department of Neurosurgery, Fujian Medical University Union Hospital. The study recorded the medical variables of patients who were hospitalized and underwent TMD between January 2016 and January 2018. The data included patients’ basic information, medical history, physical examination, preoperative test results, and preoperative scores. Retrospective analysis was conducted, and deep learning and machine learning algorithms were used to establish a predictive model for the 1-year postoperative recovery of patients with lumbar disk herniation.
Inclusion criteria
(1) Age of inclusion: 12–85 years old; (2) The prominent lumbar segments are: L3/4, L4/5, or L5/S1, including cases of combined protrusions involving two or three segments. (3) have typical sciatica with or without lumbar pain and other symptoms; (4) those who have been ineffective after standardized conservative treatment for more than 3 months and seriously affect their lives, or those with severe pain, cauda equina dysfunction, muscle strength loss, muscle atrophy, and other symptoms; (5) the straight leg raising test on the affected side is less than or equal to 70°; (6) confirmed by CT and MRI lumbar disk protrusion, and the location of the protrusion matches the corresponding neurological symptoms; and (7) receiving standardized unilateral paraspinal tubular microdiscectomy (TMD) technology treatment and a consistent physical therapy regimen (12, 13).
For more information about this study and the standardized surgical procedures at our institution, please refer to our previously published study (14).
Exclusion criteria
(1) Those with missing imaging data or unable to follow up as required; (2) those with segmental lumbar instability suggested by frontal and lateral lumbar X-ray and hyperextension and hyperflexion; (3) those with other serious physical, psychological, or mental diseases; (4) those with rheumatic immune diseases that may cause similar symptoms; and (5) those who are participating in other clinical trials.
Data collection
To construct and validate the prognostic model, we retrospectively collected clinical data related to patients with LDH who met the inclusion and exclusion criteria. The potential predictors included 42 variables related to patients’ medical history, examination, and preoperative test results, with the cure rate of the lumbar Japanese Orthopedic Association (JOA) score 1 year after TMD as the outcome measure.
The following variables were included as factors in the analysis: age, gender, height, weight, body mass index (BMI), high-risk occupation (occupations that require prolonged sedentary or high-intensity physical activity), family history (with first-degree relatives affected by LDH), history of lumbar trauma, duration of disease, duration of preoperative conservative treatment, duration of preoperative pain medication, low back pain, underlying diseases (hypertension, diabetes), history of smoking, history of alcohol abuse, angle of preoperative physical examination (as measured by the straight leg raise test), sensory impairment, muscle strength classification of the affected limb, Barthel scale, serum creatine kinase (CK), and lumbar degeneration, associated lumbar disk herniation, American Society of Anesthesiologists (ASA) grading, Oswestry Disability Index (ODI) score, preoperative low back pain and leg pain numerical rating scale (NRS) scores, the number of surgical segments as determined by the JOA, surgical time, and intraoperative bleeding. These are shown in Table 1. The cure rate score of the lumbar JOA 1 year after TMD surgery was also used as an outcome measure. Further details on these factors are provided in Supplementary material 1.

Table 1. Descriptive statistics of different influencing factors in a study population grouped by whether the improvement in lumbar JOA score was >60% 1 year after TMD.
Outcome indicators
Cure rate scores for lumbar JOA score at 1 year after TMD surgery were calculated using the same method as before the operation. The cure rate was calculated as follows:
This rate reflects the improvement of lumbar spine function before and after treatment, and is utilized to evaluate the clinical efficacy of the intervention. A cure rate of 100% indicates complete recovery, while a cure rate of greater than 60% is considered to be significantly effective. Improvement rates falling within the range of 25–60% are categorized as effective, while those below 25% are classified as ineffective. To process the data, patients with an improvement rate of lumbar JOA score > 60% (significant efficacy or cure) 1 year after TMD were recorded as 1, while patients with an improvement rate of lumbar JOA score ≤ 60% (effective but not significant or ineffective) were recorded as 0.
Feature engineering
Feature engineering is a process that involves transforming raw data into features that are more suitable for modeling. By doing so, the resulting features are able to capture relevant patterns, thereby improving the predictive accuracy of machine learning and deep learning models on unseen data (15).
In this study, the feature engineering process began by transforming raw data into more suitable features for modeling through data preprocessing and feature selection. Missing values were addressed using mean interpolation (16, 17), and the data were standardized using Z-score normalization to ensure uniformity, with all features having a mean of 0 and a standard deviation of 1. Further, before applying the features to eight different predictive algorithms, feature selection was carried out using the Mann–Whitney U test, retaining only those features with p values less than 0.05. To reduce redundancy, a Spearman correlation matrix heatmap was used to identify highly correlated features (|ρ| > 0.9), which were eliminated, except for one retained to maintain descriptive power. The final selection utilized LASSO regression with 10-fold cross-validation to identify features with non-zero coefficients essential for modeling.
Spearman ρ correlation matrix heat map
We conducted a correlation analysis of the data using a Spearman ρ correlation matrix heat map (18). The Spearman correlation matrix heat map is suitable for analyzing data that do not conform to a normal distribution, as well as data that contain categorical variables. It can measure the correlation between any two variables, with a value of +1 indicating a total positive correlation, −1 indicating a total negative correlation, and 0 indicating no correlation. The results of the correlation analysis can be visually represented using a heat map, which uses color to indicate the magnitude of the correlation, making it easier and more intuitive to interpret the results.
Machine learning and deep learning
We employed a systematic framework based on machine learning and deep learning to construct prognostic models. To this end, we divided the data into a training dataset for developing the predictive model and a test dataset for evaluating the accuracy of the model (19). The data were randomly divided into two groups in a ratio of 70:30, with 70% (n = 329) of the samples designated as the training set for developing the predictive model, and 30% (n = 141) of the samples designated as the test set for evaluating the accuracy of the model. Once the training set was defined, an optimal model was developed using eight different machine learning algorithms, including Random Forests, Extreme Gradient Boosting, Support Vector Machines, Extra Trees, K-Nearest Neighbors, Logistic Regression, Light Gradient Boosting Machine, and MLP (Artificial Neural Networks) from scikit-learning (version: 0.18) in python.
To optimize the accuracy of the predictive models, a grid search was conducted on the hyperparameters for each of the eight ML algorithms used. A 10-fold cross-validation was employed, whereby the training data set was divided into 10 equally-sized folds, and the model was created using 90% of the data in each fold, with the remaining data used to evaluate the model’s accuracy. The process was repeated 10 times, with each fold being used for one of the 10 training steps (20, 21). The area under the receiver operating characteristic (ROC) curve, also known as area under the curve (AUC), was used as the primary accuracy metric during the grid search (22). The AUC is a performance measure that evaluates the strengths and weaknesses of the learner and is widely used in clinical settings to assess the performance of ML algorithms on test datasets (23). In addition to the AUC, Accuracy, AUC, Sensitivity, Specificity, PPV, NPV, Precision, Recall, and F1 values were also reported to provide a comprehensive picture of the algorithm’s performance (22).
The modeling and prediction process for deep learning is similar to traditional machine learning, with the main difference being that deep learning is end-to-end and can automatically extract high-level features, greatly reducing the reliance on feature engineering in traditional machine learning (7).
Statistical analysis
Continuous variables were presented as mean ± standard deviation, while categorical variables were presented as frequencies and percentages. Group comparisons for categorical variables were conducted using the chi-square test or Fisher’s exact test, whereas differences between groups for quantitative variables were assessed using the t-test or Mann–Whitney U test. Statistical analyses were conducted at a significance level of 0.05 (two-tailed) using Python (version 3.9, http://www.python.org). A two-sided p value <0.05 was deemed statistically significant.
Results
General
A total of 470 patients meeting the inclusion and exclusion criteria were enrolled in this study. All patients underwent TMD surgery between January 2018 and January 2021 and were followed up for 1 year. In order to develop predictive models, 42 variables were collected, including gender, age, BMI, medical history, and preoperative indicators.
Correlation matrix heat map
Figure 1 presents the Spearman ρ correlation matrix heatmap, which is utilized to construct the model’s independent variables. This heatmap reveals that there is a medium to strong correlation between several pairs of variables: weight and gender ρ = 0.507, BMI and weight ρ = 0.662, Lumbago-NRS and Lumbago ρ = 0.474, Preop_JOA and leg_pain_NRS ρ = −0.439, and Preop_JOA and Preop_ODI ρ = −0.633. The absolute strength of all other correlations did not exceed 0.40 (│ρ│ ≤ 0.40).
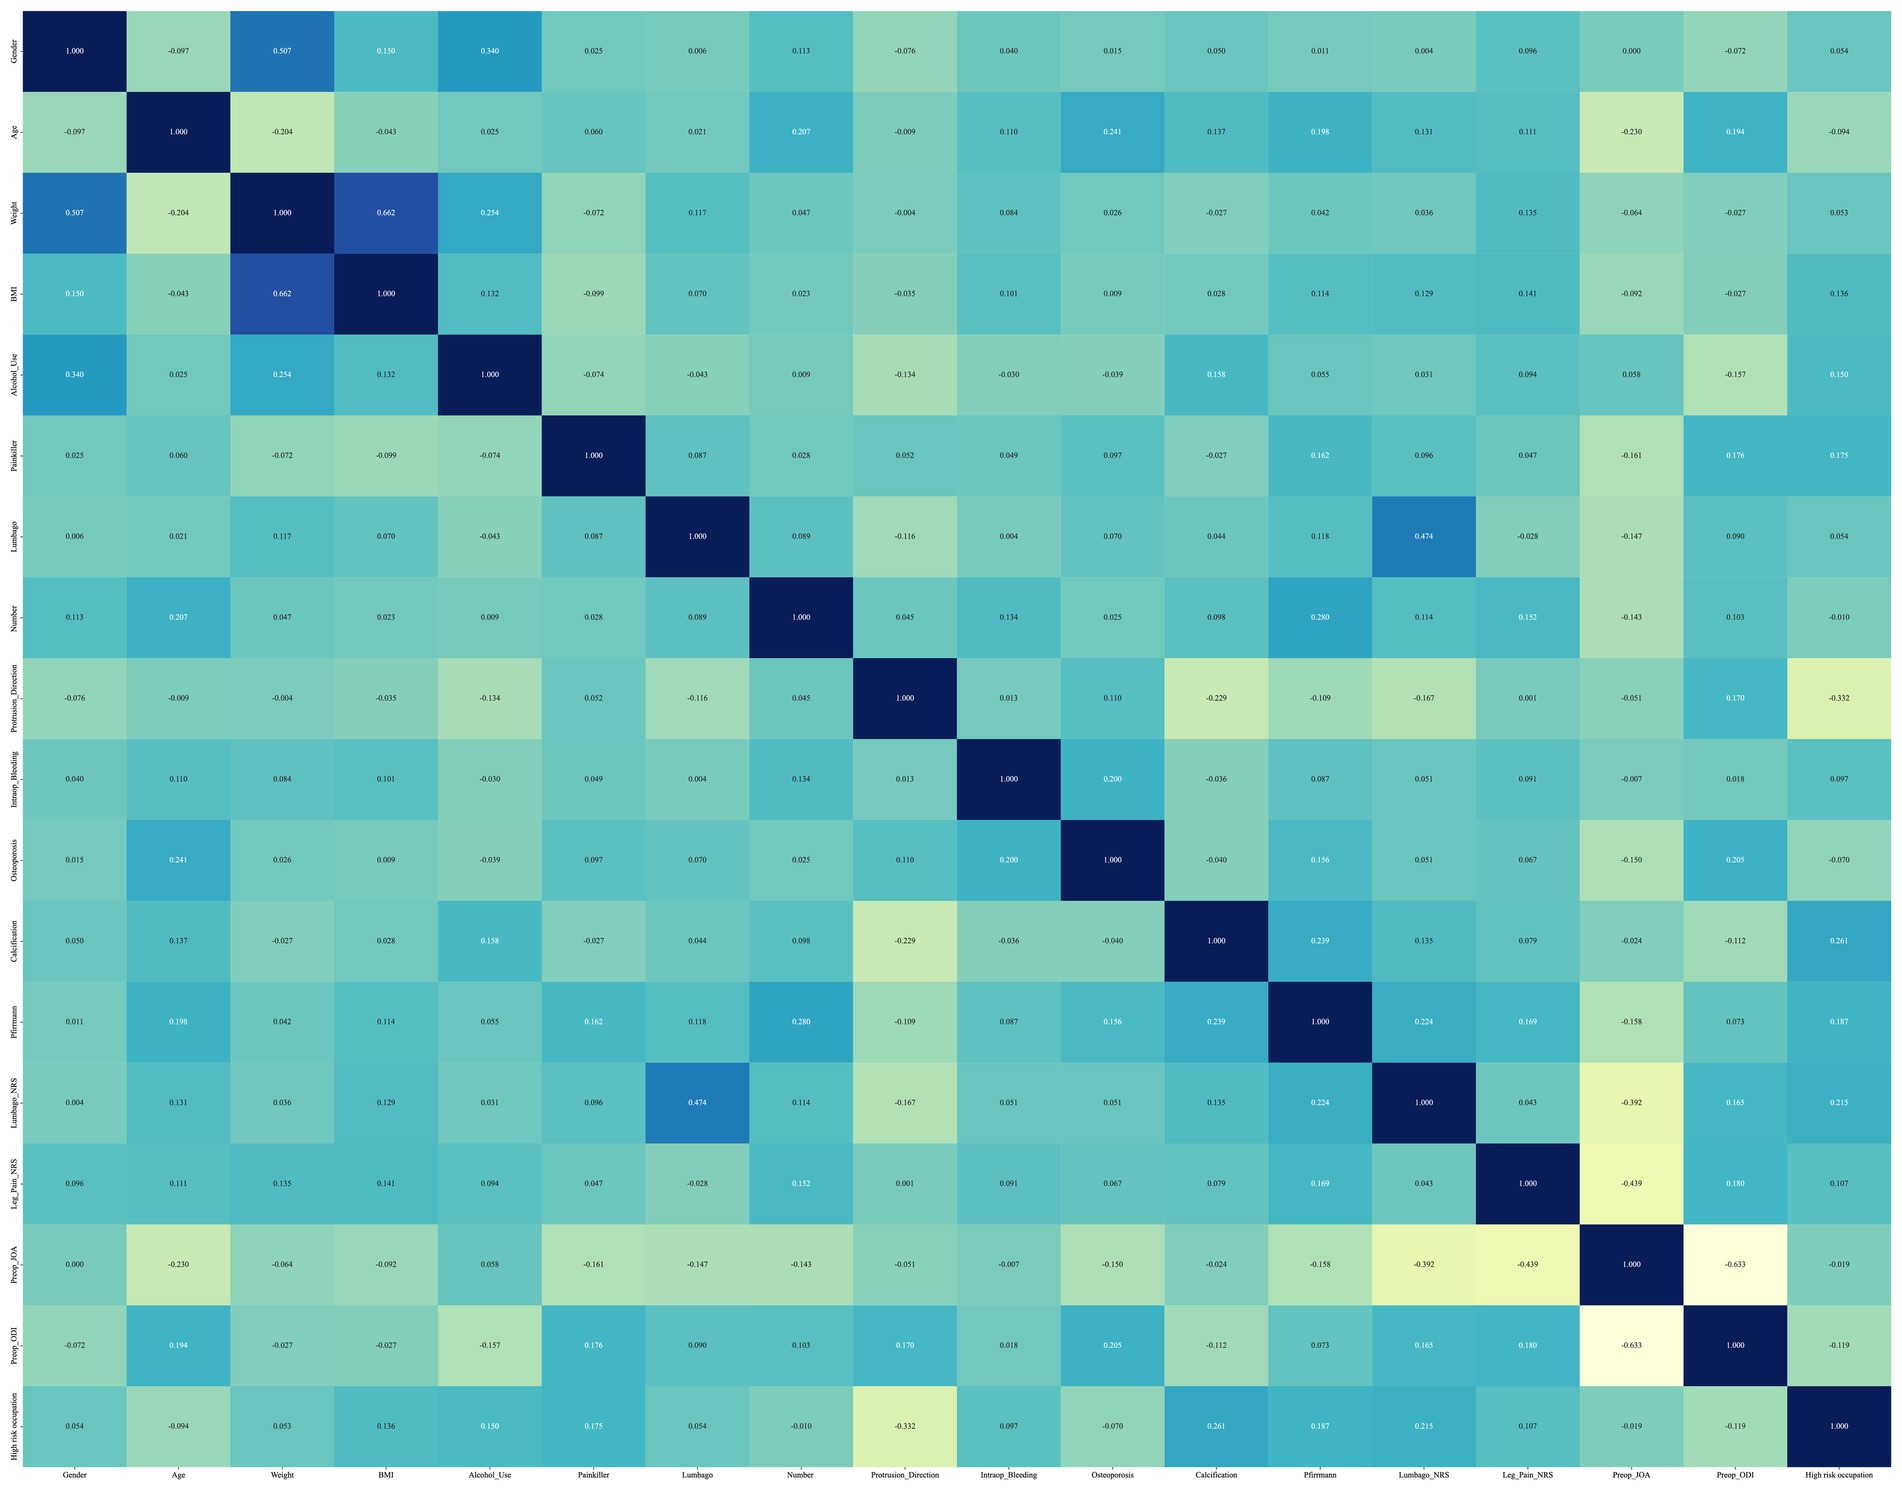
Figure 1. The Spearman ρ correlation matrix heat map used to construct the model independent variables. A large number of highly correlated features are eliminated.
Machine learning and deep learning
After performing data preprocessing and segmenting the dataset into training and test sets, this study employed eight algorithms to develop the predictive model. Finally, 15 variables after Feature Engineering (Figure 2C) were used to input DL and ML algorithm, including high-risk occupation, preop_ODI, calcification, and other 12 variables. Each algorithm was also subjected to a hyperparameter grid search based on a 10-fold cross-validation and after finding the optimal hyperparameters, the models were used to generate predictions.
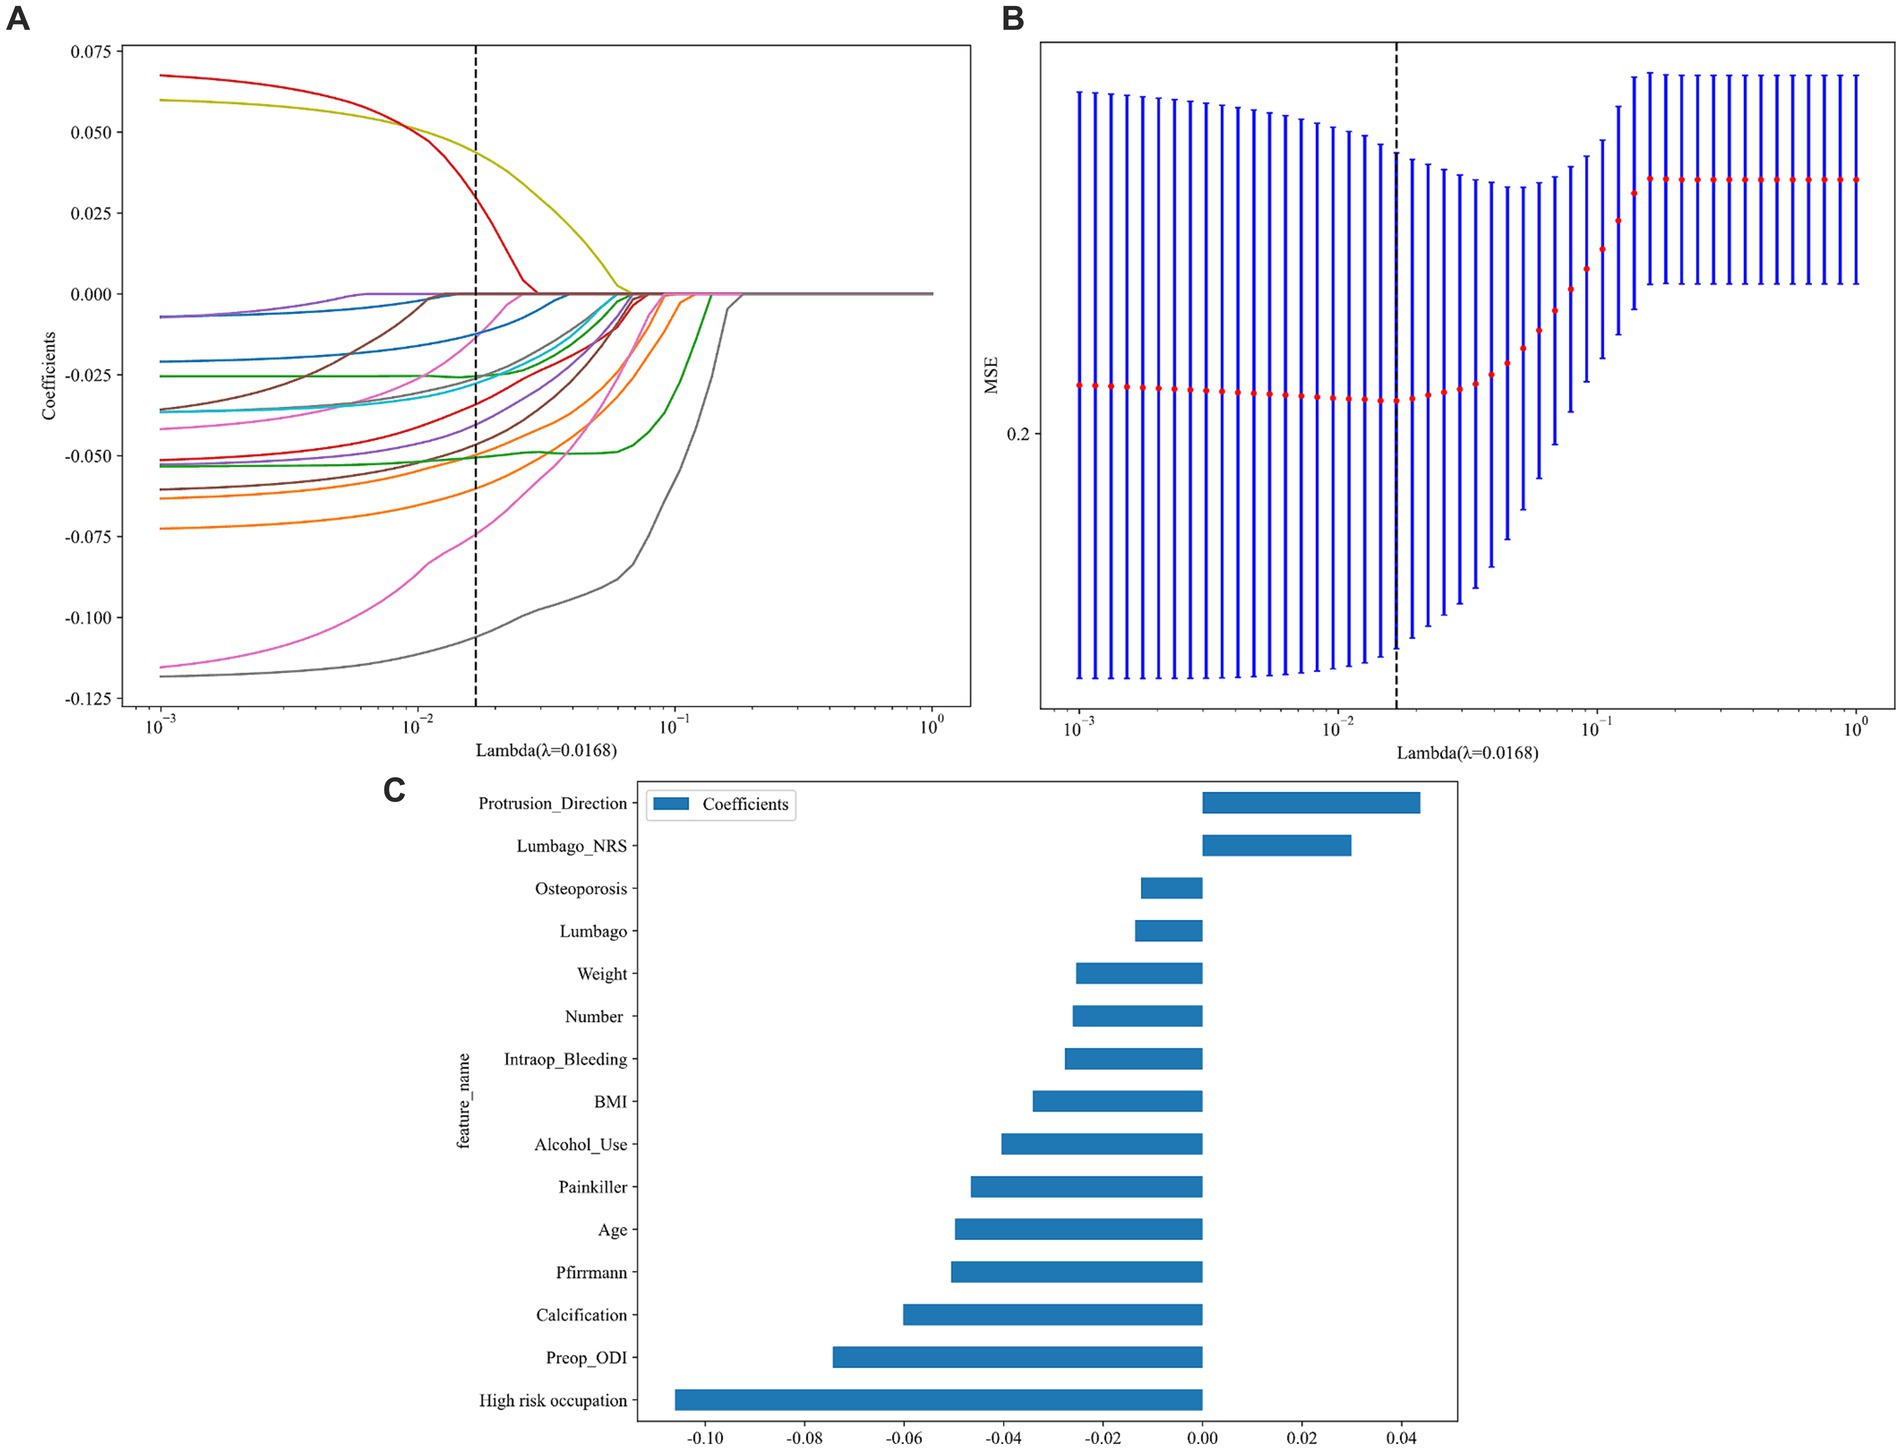
Figure 2. The LASSO and MSE in feature engineering and the 15 variables used to input into eight algorithms. (A) The least absolute shrinkage and selection operator (LASSO); (B) A 10-fold-validated mean squared error (MSE); (C) feature weights: variables-score histogram derived from LASSO-selected features.
As shown in Figure 2 and Table 2, MLP exhibits the highest AUC values (Train AUC = 0.872; Test AUC = 0.840), also demonstrating superior performance across other metrics such as an Accuracy of 0.8380, Sensitivity of 0.8040, and Specificity of 0.8600 in test cohort (Figures 3A,B). Additionally, Figure 3C illustrates the superior clinical decision-making capability of MLP (represented by the blue curve) at thresholds greater than 40% (DCA), where it demonstrates a higher net benefit compared to other machine learning algorithms. The Probability Calibration Curve also supports our decision-making process (Figure 3D). Performance comparisons of each model are detailed in Table 2.
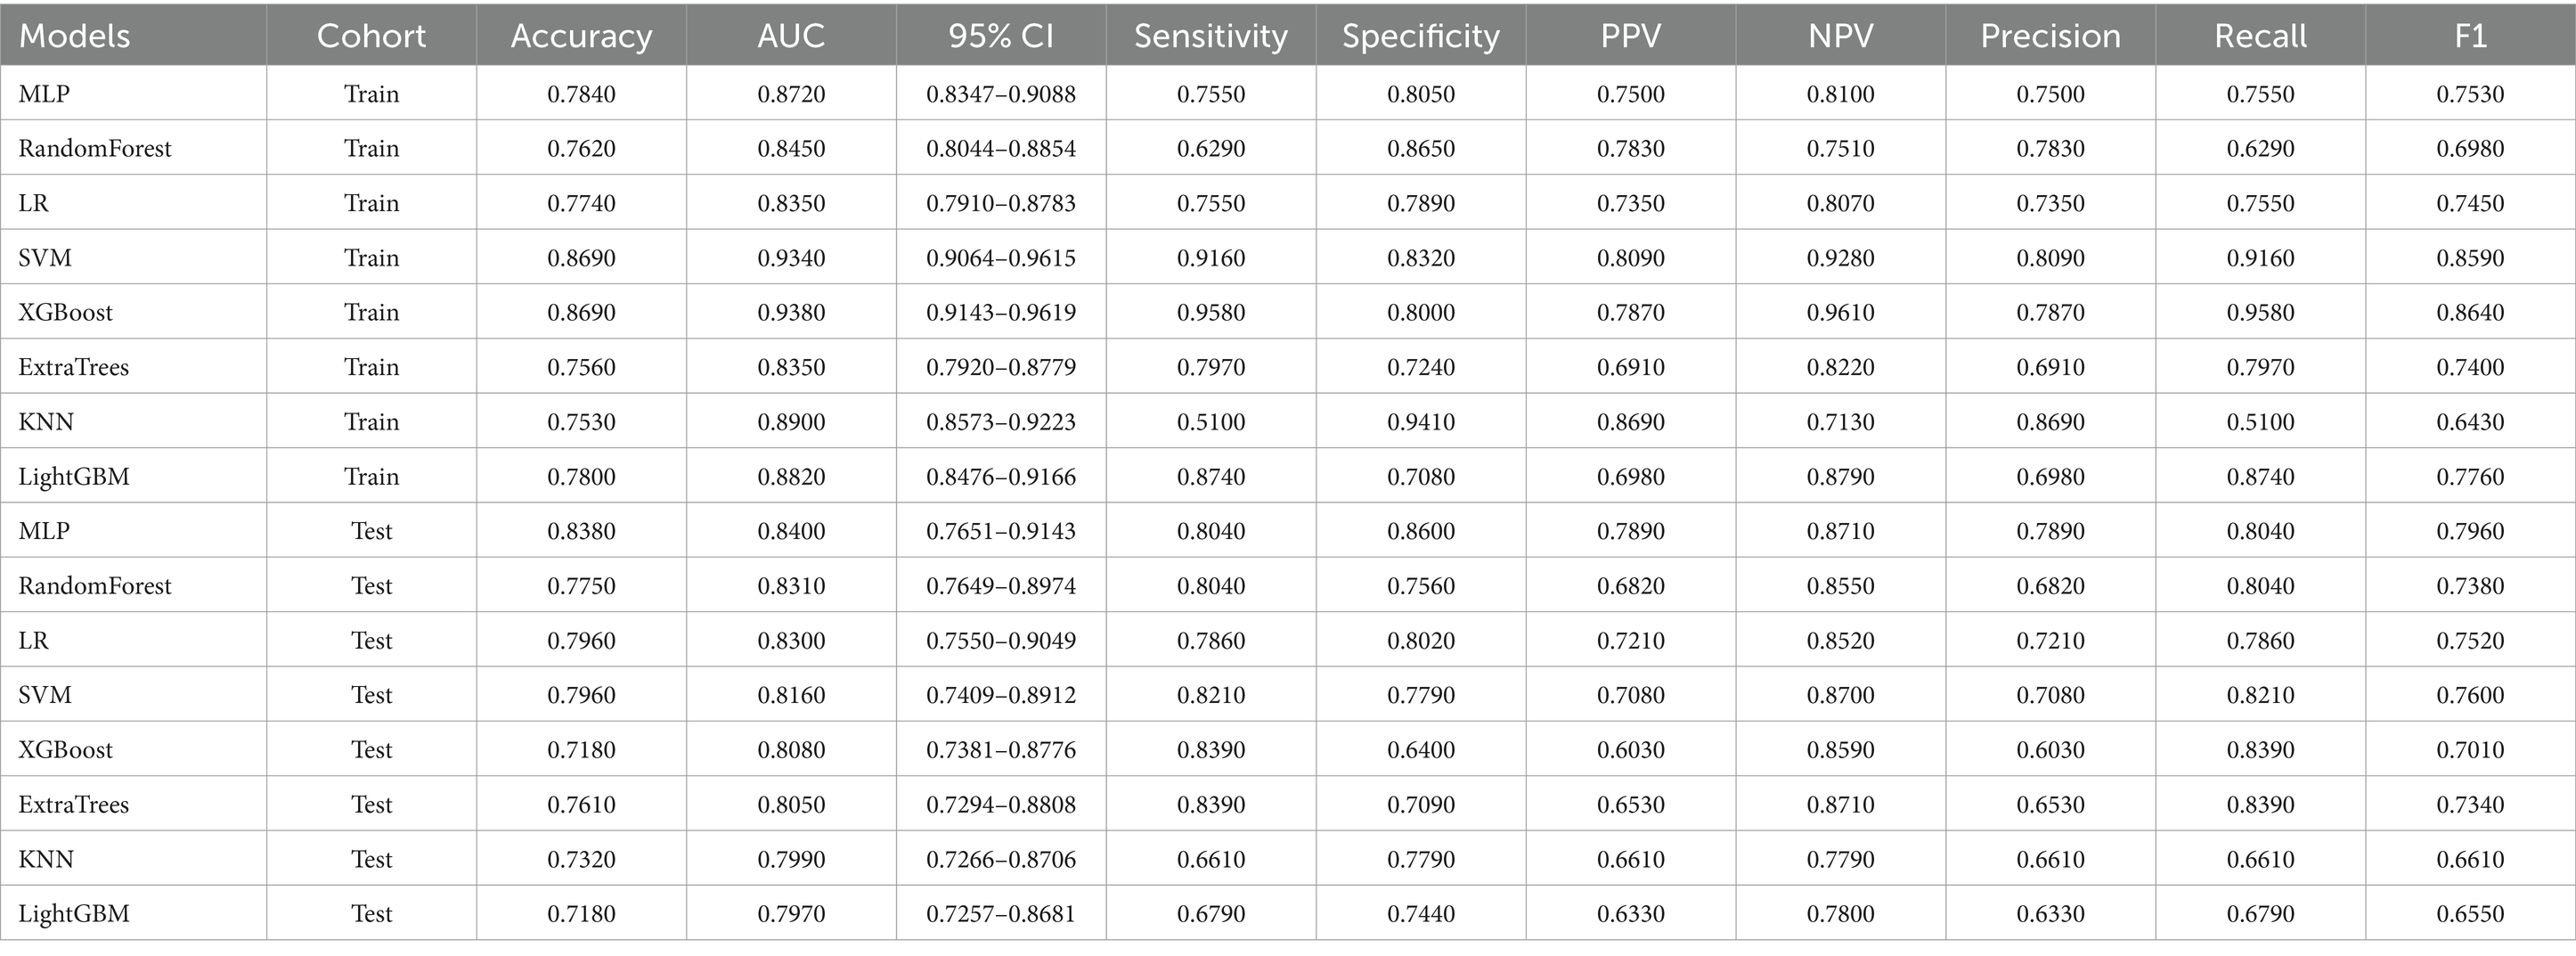
Table 2. The performance of each model evaluated by accuracy, AUC, sensitivity, specificity, PPV, NPV, Precision, Recall, and F1.
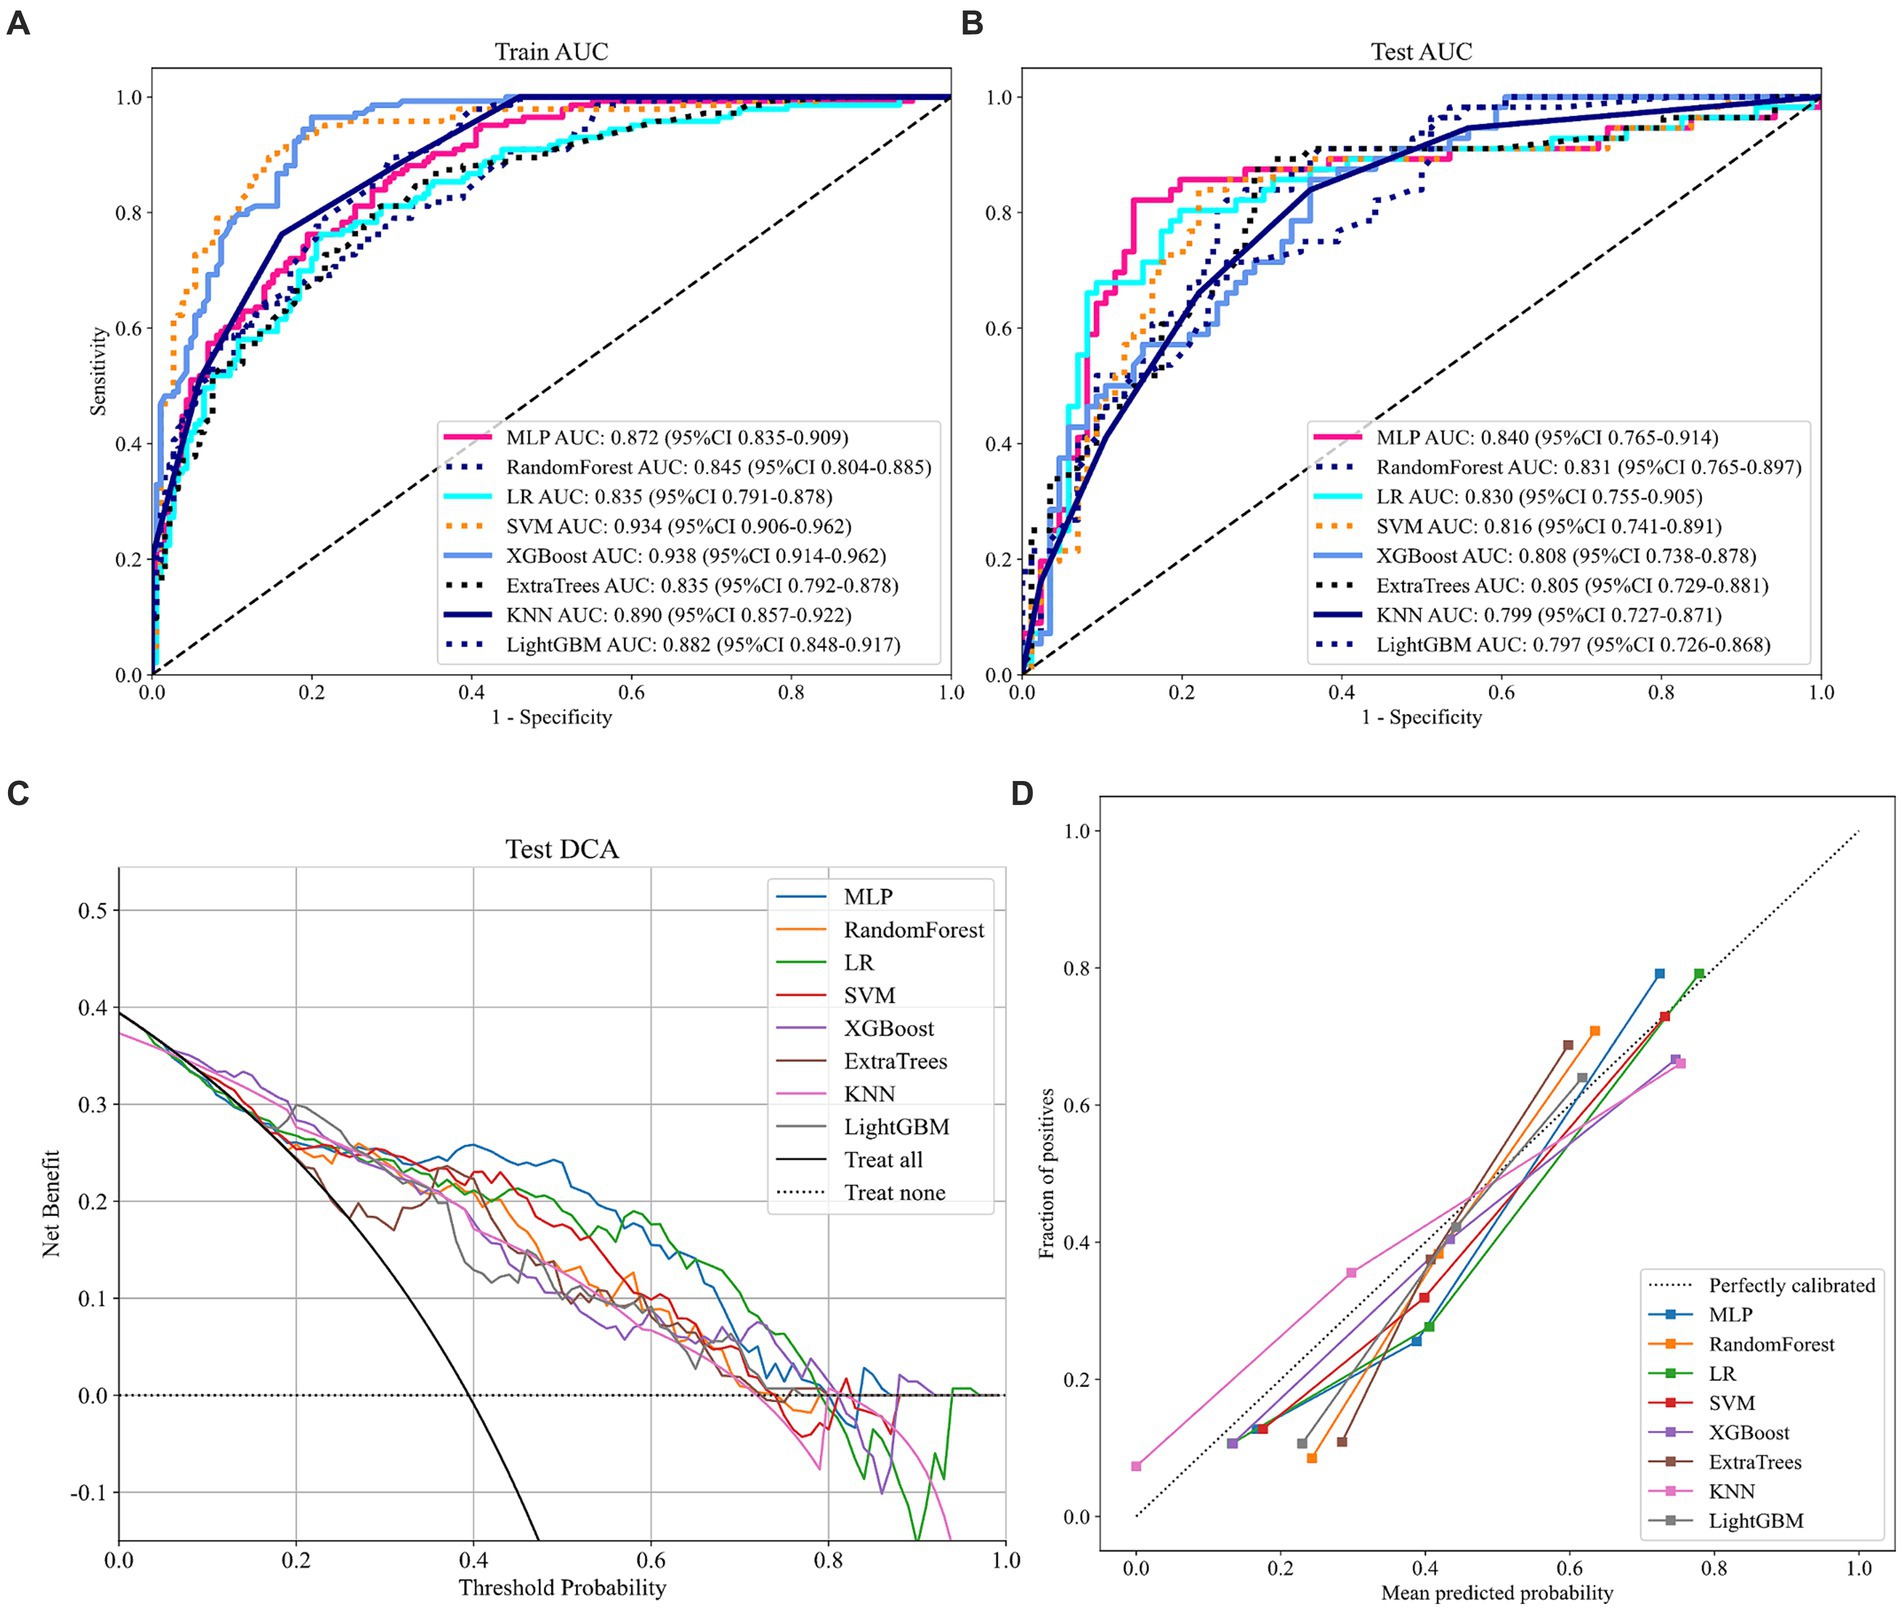
Figure 3. Relevant prediction results of the eight models. (A) ROC curve of the train cohort; (B) ROC curve of the test cohort; (C) DCA curve of the test cohort; and (D) Probability calibration curve of the test cohort.
Discussion
In the field of surgical treatment for disk herniation, there have been numerous studies investigating the efficacy of different surgical approaches. Specifically, research has focused on the differences in treatment outcomes between TMD and other approaches, such as open microdiscectomy (OMD). Studies have demonstrated that TMD and OMD yield comparable treatment outcomes, but TMD has a significant advantage in reducing intraoperative bleeding (24). Additionally, research has shown that TMD and conventional microdiscectomy (CMD) produce similar outcomes 1 year after surgery, with TMD not having any advantage in preventing reoperation or dural tears (25). However, limited discussion has been dedicated to patient recovery 1 year after TMD. This study provides a novel approach to addressing the lack of research in this area by implementing machine learning and deep learning techniques to develop predictive models for patient recovery 1 year after TMD.
A limited amount of central data can also be used for deep learning predictive analysis and may be useful for clinical decision making (26). Its comparison of logistic regression models with deep learning models shows the superiority of deep learning performance. Our prediction results demonstrate the advantages of MLP models, especially in terms of AUC values. Of course, close results were obtained for LR, RF, etc., which may be related to the small amount of data, coming from a single clinical study center.
Logistic regression without regularization may be criticized for underfitting, but L2-regularized logistic regression effectively mitigates the risk of overfitting by incorporating a regularization factor or penalty factor, denoted as λ, which multiplies the sum of the squares of all parameters. This reduces the impact of insignificant parameters on the predictive outcome.
Wang et al. (27) previously utilized a stepwise logistic analysis to filter parameters and select the optimal independent variable based on the minimum Akaike information criterion (AIC) as input for their machine-learning algorithm. Although this study did not utilize this particular machine-learning algorithm, we standardized our data through Z-score normalization. This will reduce the influence of outliers on the model fit. While the correlation matrix heat map is a valuable tool, we acknowledge that the screening process could lead to the exclusion of crucial independent variables. Moreover, the selection of the step probability directly influences the screening outcome. If the step probability is set too low, a substantial number of independent variables may be omitted. On the other hand, increasing the step probability could still result in the loss of important independent variables due to the limited amount of available data, thereby rendering the method meaningless.
Prognostic models offer clinicians an effective means of conveying quantitative risk predictions to patients, thus mitigating information asymmetry to some extent. Accurate determination of surgical indications using such models would enable clinicians to focus their attention on tasks that cannot be automated. Unfortunately, achieving this goal is currently challenging. The primary obstacle lies in the absence of external model validation, which is necessary to ensure its generalizability to other datasets. The solution may involve conducting multicenter studies to improve the predictive accuracy and generalizability of prognostic models.
In addition to the limitations of data volume, this study has several noteworthy shortcomings. (1) The retrospective nature of the study may have introduced selection bias, undermining the generalizability of the findings. (2) Despite our attempts to collect data on a wide range of variables that may impact the improvement rate of JOA 1 year after surgery, there is a possibility that important variables were overlooked. (3) Due to hardware constraints and the need for machine learning expertise, large-scale generalization of our findings is currently difficult to achieve. (4) The sample size in this study is relatively small, and as a single-center study, additional more data and more centers in the future might enhance our results. Finally, in this study, we used retrospective data for predictive modeling, and in the future, we need to add prospective data for further analysis, which will enhance our clinical evidence.
Data availability statement
The raw data supporting the conclusions of this article will be made available by the authors, without undue reservation.
Ethics statement
The study was conducted according to the guidelines of the Declaration of Helsinki, and was approved by Institutional Review Board (approval no. 2022KY026). The studies were conducted in accordance with the local legislation and institutional requirements. Written informed consent for participation was not required from the participants or the participants’ legal guardians/next of kin in accordance with the national legislation and institutional requirements.
Author contributions
YC: Methodology, Writing – original draft. FL: Methodology, Writing – original draft. KW: Writing – review & editing. FC: Formal Analysis, Visualization, Writing – review & editing. RuxW: Writing – original draft. ML: Data curation, Writing – original draft. CC: Project administration, Supervision, Writing – review & editing. RuiW: Project administration, Supervision, Writing – review & editing.
Funding
The author(s) declare financial support was received for the research, authorship, and/or publication of this article. This study has received funding by Fujian Science and Technology Innovation Joint Fund Project, 2018Y9060.
Acknowledgments
We thank the colleagues in our department for their help in our study.
Conflict of interest
The authors declare that the research was conducted in the absence of any commercial or financial relationships that could be construed as a potential conflict of interest.
Publisher’s note
All claims expressed in this article are solely those of the authors and do not necessarily represent those of their affiliated organizations, or those of the publisher, the editors and the reviewers. Any product that may be evaluated in this article, or claim that may be made by its manufacturer, is not guaranteed or endorsed by the publisher.
Supplementary material
The Supplementary material for this article can be found online at: https://www.frontiersin.org/articles/10.3389/fneur.2024.1255780/full#supplementary-material
References
1. Ma, XL . A new pathological classification of lumbar disc protrusion and its clinical significance. Orthop Surg. (2015) 7:1–12. doi: 10.1111/os.12152
2. Gugliotta, M, da Costa, BR, Dabis, E, Theiler, R, Juni, P, Reichenbach, S, et al. Surgical versus conservative treatment for lumbar disc herniation: a prospective cohort study. BMJ Open. (2016) 6:e012938. doi: 10.1136/bmjopen-2016-012938
3. Wang, G, Dong, W, Lan, T, Fan, J, Tang, K, Li, Y, et al. Diagnostic accuracy evaluation of the conventional and molecular tests for spinal tuberculosis in a cohort, head-to-head study. Emerg Microbes Infect. (2018) 7:109. doi: 10.1038/s41426-018-0114-1
4. Xu, Z, Yang, L, Yu, H, and Guo, L. A machine learning model for grade 4 lymphopenia prediction during pelvic radiotherapy in patients with cervical cancer. Front Oncol. (2022) 12:905222. doi: 10.3389/fonc.2022.905222
5. Martin, GP, Mamas, MA, Peek, N, Buchan, I, and Sperrin, M. Clinical prediction in defined populations: a simulation study investigating when and how to aggregate existing models. BMC Med Res Methodol. (2017) 17:1. doi: 10.1186/s12874-016-0277-1
6. Deo, RC . Machine learning in medicine. Circulation. (2015) 132:1920–30. doi: 10.1161/CIRCULATIONAHA.115.001593
7. Choi, RY, Coyner, AS, Kalpathy-Cramer, J, Chiang, MF, and Campbell, JP. Introduction to machine learning, neural networks, and deep learning. Transl Vis Sci Technol. (2020) 9:14. doi: 10.1167/tvst.9.2.14
8. Tsai, JY, Hung, IY, Guo, YL, Jan, YK, Lin, CY, Shih, TT, et al. Lumbar disc herniation automatic detection in magnetic resonance imaging based on deep learning. Front Bioeng Biotechnol. (2021) 9:708137. doi: 10.3389/fbioe.2021.708137
9. Prisilla, AA, Guo, YL, Jan, YK, Lin, CY, Lin, FY, Liau, BY, et al. An approach to the diagnosis of lumbar disc herniation using deep learning models. Front Bioeng Biotechnol. (2023) 11:1247112. doi: 10.3389/fbioe.2023.1247112
10. Kalafi, EY, Nor, NAM, Taib, NA, Ganggayah, MD, Town, C, and Dhillon, SK. Machine learning and deep learning approaches in breast Cancer survival prediction using clinical data. Folia Biol. (2019) 65:212–20. doi: 10.14712/fb2019065050212
11. Egger, J, Gsaxner, C, Pepe, A, Pomykala, KL, Jonske, F, Kurz, M, et al. Medical deep learning-a systematic meta-review. Comput Methods Prog Biomed. (2022) 221:106874. doi: 10.1016/j.cmpb.2022.106874
12. Clark, AJ, Safaee, MM, Khan, NR, Brown, MT, and Foley, KT. Tubular microdiscectomy: techniques, complication avoidance, and review of the literature. Neurosurg Focus. (2017) 43:E7. doi: 10.3171/2017.5.FOCUS17202
13. Liang, ZY, Zhuang, YD, Chen, CM, and Wang, R. Clinical evaluation of percutaneous transforaminal endoscopic discectomy (PTED) and paraspinal minitubular microdiscectomy (PMTM) for lumbar disc herniation: study protocol for a randomised controlled trial. BMJ Open. (2019) 9:e033888. doi: 10.1136/bmjopen-2019-033888
14. Chen, X, Lin, F, Xu, X, Chen, C, and Wang, R. Development, validation, and visualization of a web-based nomogram to predict the effect of tubular microdiscectomy for lumbar disc herniation. Front Surg. (2023) 10:1024302. doi: 10.3389/fsurg.2023.1024302
15. Burdack, J, Horst, F, Giesselbach, S, Hassan, I, Daffner, S, and Schollhorn, WI. Systematic comparison of the influence of different data preprocessing methods on the performance of gait classifications using machine learning. Front Bioeng Biotechnol. (2020) 8:260. doi: 10.3389/fbioe.2020.00260
16. Emmanuel, T, Maupong, T, Mpoeleng, D, Semong, T, Mphago, B, and Tabona, O. A survey on missing data in machine learning. J Big Data. (2021) 8:140. doi: 10.1186/s40537-021-00516-9
17. Sun, W, Cai, Z, Li, Y, Liu, F, Fang, S, and Wang, G. Data processing and text mining technologies on electronic medical records: a review. J Healthcare Eng. (2018) 2018:1–9. doi: 10.1155/2018/4302425
18. Singh, KK, Kumar, S, Dixit, P, and Bajpai, MK. Kalman filter based short term prediction model for COVID-19 spread. Appl Intell. (2021) 51:2714–26. doi: 10.1007/s10489-020-01948-1
19. Woodman, RJ, Bryant, K, Sorich, MJ, Pilotto, A, and Mangoni, AA. Use of multiprognostic index domain scores, clinical data, and machine learning to improve 12-month mortality risk prediction in older hospitalized patients: prospective cohort study. J Med Internet Res. (2021) 23:e26139. doi: 10.2196/26139
20. Ismail, A, Idris, MYI, Ayub, MN, and Por, LY. Vision-based apple classification for smart manufacturing. Sensors. (2018) 18:4353. doi: 10.3390/s18124353
21. Nayak, SR, Nayak, J, Sinha, U, Arora, V, Ghosh, U, and Satapathy, SC. An automated lightweight deep neural network for diagnosis of COVID-19 from chest X-ray images. Arab J Sci Eng. (2021) 48:11085–102. doi: 10.1007/s13369-021-05956-2
22. Carrington, AM, Manuel, DG, Fieguth, PW, Ramsay, T, Osmani, V, Wernly, B, et al. Deep ROC analysis and AUC as balanced average accuracy, for improved classifier selection, audit and explanation. IEEE Trans Pattern Anal Mach Intell. (2023) 45:329–41. doi: 10.1109/TPAMI.2022.3145392
23. Wagner, MW, Namdar, K, Biswas, A, Monah, S, Khalvati, F, and Ertl-Wagner, BB. Radiomics, machine learning, and artificial intelligence-what the neuroradiologist needs to know. Neuroradiology. (2021) 63:1957–67. doi: 10.1007/s00234-021-02813-9
24. Barber, SM, Nakhla, J, Konakondla, S, Fridley, JS, Oyelese, AA, Gokaslan, ZL, et al. Outcomes of endoscopic discectomy compared with open microdiscectomy and tubular microdiscectomy for lumbar disc herniations: a meta-analysis. J Neurosurg Spine. (2019) 31:802–15. doi: 10.3171/2019.6.SPINE19532
25. Wang, Y, Liang, Z, Wu, J, Tu, S, and Chen, C. Comparative clinical effectiveness of tubular microdiscectomy and conventional microdiscectomy for lumbar disc herniation: a systematic review and network meta-analysis. Spine (Phila Pa 1976). (2019) 44:1025–33. doi: 10.1097/BRS.0000000000003001
26. Staartjes, VE, de Wispelaere, MP, Vandertop, WP, and Schroder, ML. Deep learning-based preoperative predictive analytics for patient-reported outcomes following lumbar discectomy: feasibility of center-specific modeling. Spine J. (2019) 19:853–61. doi: 10.1016/j.spinee.2018.11.009
27. Wang, H, Fan, T, Yang, B, Lin, Q, Li, W, and Yang, M. Development and internal validation of supervised machine learning algorithms for predicting the risk of surgical site infection following minimally invasive transforaminal lumbar interbody fusion. Front Med. (2021) 8:771608. doi: 10.3389/fmed.2021.771608
Keywords: predictive model, machine learning, deep learning, lumbar disk herniation, lumbar JOA score
Citation: Chen Y, Lin F, Wang K, Chen F, Wang R, Lai M, Chen C and Wang R (2024) Development of a predictive model for 1-year postoperative recovery in patients with lumbar disk herniation based on deep learning and machine learning. Front. Neurol. 15:1255780. doi: 10.3389/fneur.2024.1255780
Edited by:
Chenlong Yang, Peking University Health Science Center, ChinaReviewed by:
Chi-Wen Lung, University of Illinois at Urbana-Champaign, United StatesJianjun Sun, Peking University Third Hospital, China
Copyright © 2024 Chen, Lin, Wang, Chen, Wang, Lai, Chen and Wang. This is an open-access article distributed under the terms of the Creative Commons Attribution License (CC BY). The use, distribution or reproduction in other forums is permitted, provided the original author(s) and the copyright owner(s) are credited and that the original publication in this journal is cited, in accordance with accepted academic practice. No use, distribution or reproduction is permitted which does not comply with these terms.
*Correspondence: Chunmei Chen, 1731012948@qq.com; Rui Wang, 3444224@qq.com
†These authors have contributed equally to this work and share first authorship