 Tobias Zrzavy1,2
 Kerstin Rieder1,2Viktoria Wuketich1,2Renate Thalhammer3Helmuth Haslacher3
 Patrick Altmann1,2Barbara Kornek1,2
 Nik Krajnc1,2
 Tobias Monschein1,2Christiane Schmied1,2
 Karin Zebenholzer1,2
 Gudrun Zulehner1,2
 Thomas Berger1,2
 Paulus Rommer1,2
 Fritz Leutmezer1,2
 Gabriel Bsteh1,2*
- 1Department of Neurology, Medical University of Vienna, Vienna, Austria
- 2Comprehensive Center for Clinical Neurosciences and Mental Health, Medical University of Vienna, Vienna, Austria
- 3Department of Laboratory Medicine, Medical University of Vienna, Vienna, Austria
Background: Recent studies proposed cellular immunoprofiling as a surrogate for predicting treatment response and/or stratifying the occurrence of adverse events (AEs) in persons with multiple sclerosis (pwMS). However, applicability in real-world circumstances is not sufficiently addressed.
Objective: We aimed to explore whether standard routine clinical leukocyte phenotyping before treatment initiation could help stratify patients according to treatment response or AEs in a real-world MS cohort.
Methods: In this retrospective study, 150 pwMS were included, who had been newly initiated on a disease-modifying drug (DMD) and had been assessed for standard immunophenotyping before DMD initiation (baseline) and at least once during the following year. Multivariate models were used to assess an association of immune subsets and the association between immune cell profiles regarding treatment response and AEs.
Results: We found that the composition of T cell subsets was associated with relapse activity, as an increased proportion of CD8+ lymphocytes at baseline indicated a higher likelihood of subsequent relapse (about 9% per 1% increase in CD8+ proportion of all CD3+ cells). This was particularly driven by patients receiving anti-CD20 therapy, where also EDSS worsening was associated with a higher number of CD8+ cells at baseline (3% increase per 10 cells). In the overall cohort, an increase in the proportion of NK cells was associated with a higher risk of EDSS worsening (5% per 1% increase). Occurrence of AEs was associated with a higher percentage of T cells and a lower number of percentual NKT cells at baseline.
Conclusion: Immune cell profiles are associated with treatment response and the occurrence of AEs in pwMS. Hence, immunophenotyping may serve as a valuable biomarker to enable individually tailored treatment strategies in pwMS.
Introduction
Multiple sclerosis (MS) is a chronic inflammatory demyelinating disease that affects the brain and spinal cord. Although the exact pathogenesis underlying and driving the disease is unknown, an ever-increasing number of immune-targeting disease-modifying drugs (DMDs) have been shown to reduce inflammatory-related disease activity as measured by clinical relapses and MRI activity.
However, MS is characterized by a high degree of heterogeneity both in terms of disease course and treatment response on an individual level. On the other hand, highly effective immunosuppressive DMDs carry the risk for severe adverse events (AEs) such as infections or malignancies, particularly with increasing age and treatment durations (1).
While this would suggest a personalized approach tailored to the individual patient, we currently lack biomarkers that provide adequate information for individually tailored treatment strategies, thus requiring a trial-and-error phase to find an effective and well-tolerated treatment for an individual patient.
It is well established and underlined by the success of the DMDs that perturbations associated with an abnormal immune response involving cellular interactions of peripheral immune cells trafficking into the central nervous system (CNS) are participating drivers of relapse-related mechanisms (2). Peripheral blood is an easily accessible biological sample that provides a biological “window” for assessing cellular shifts linked to DMD effects, which might offer the opportunity for predicting treatment response and/or occurrence of AEs. By identifying specific cellular markers, clinicians could develop personalized immunobiological-based treatment plans for persons with MS (pwMS), potentially leading to improved clinical outcomes.
Indeed, recent studies proposed cellular immunoprofiling as a surrogate for predicting treatment response and/or stratifying the occurrence of AEs in pwMS (3–10).
However, in contrast to protein-based biomarkers, reproducibility of these results is more difficult due to confounding influences of biological variations (such as infections, stress) or technical issues (such as sample handling and storage, cytometer setup, gating strategies, and antibody selection) (11, 12).
Here, we aimed to explore whether standard routine clinical leukocyte phenotyping before treatment initiation could help stratify patients according to treatment response or AEs in a real-world MS cohort.
Methods
STROBE guidelines were followed in this report (13).
Patients and definitions
For this retrospective cohort study, we used the Vienna MS Database (VMSD) of the Department of Neurology, Medical University of Vienna, which serves as both a primary and reference center mainly for Vienna and its geographical catchment area (14).
We included pwMS aged >18 years diagnosed according to the respective McDonald criteria (15, 16) who (1) had been newly initiated on a DMD between 01/01/2008 and 30/06/2019, (2) were assessed for immunophenotyping before DMD initiation (baseline) and at least once during the following year, and (3) had at least two years of clinical follow-up available.
VMSD case reports include demographic data, details of MS course (disease onset, time to diagnosis, relapses, Expanded Disability Status Scale [EDSS], and onset of secondary progression), diagnostic investigations (MRI, optical coherence tomography [OCT], cerebrospinal fluid findings) and DMT history (including initiation, interruption, changes and AEs). Data are collected retrospectively at the first visit and prospectively whenever the patient returns for scheduled (every 3–6 months) follow-up or unscheduled visits.
For the purpose of this study, the following endpoints were used for assessing treatment response: relapse (yes/no) within two years after baseline (defined as symptoms reported by the patient and confirmed by a neurologist, or signs observed by the neurologist, indicative of an acute CNS inflammatory demyelinating episode lasting at least 24 h, without fever or infection, and occurring at least 30 days after the previous relapse), EDSS worsening two years after baseline (defined as an increase by ≥1.5/1/0.5 points when the baseline score was 0/1–5.5/≥6.0, respectively).
Safety was assessed by the occurrence of AEs and severe AEs (SAEs) occurring after initiation of the respective DMD. SAEs were defined according to the Common Terminology Criteria for Adverse Events (CTCAE) V4.0 grading system grades 3 to 5, if detailed documentation was available; otherwise, they were considered as AEs. AEs were further divided into acute (infusion-related/medication intake-related) and non-acute-related AEs if appropriate.
Immunophenotyping
For blood immunophenotyping, fresh blood was collected on EDTA-coated tubes by venipuncture and rapidly transferred to the local Department of Laboratory Medicine for analysis. Immunophenotyping was performed on FACSCanto/FACSCanto II cytometers (Becton Dickinson, Franklin Lakes, United States) by applying the following reagents (Antibodies / Clones): BD-Simultest CD3-FITC, CD16 + CD56-PE / SK7, B73.1, MY3; CD4-PerCP-cy5.5 / SK3 (Leu-3a); CD8-APC-Cy7 / SK1 (Leu-2a); CD19-PE-Cy7 / SJ25C1; CD45-V500 /2D1 (HLe-1). Lymphocytes, monocytes, and polymorphonuclear leukocytes were gated according to their forward (FSC) and side scatter (SSC) properties and based on their CD45-expression.
Following populations were gated based on the respective lineage markers: For T cells: Total T cells (CD3+), CD4 T cells (CD3 + CD4+), CD8 T cells (CD3 + CD8+), Natural Killer (NK) T cells (CD3 + CD16 + CD56+), NK cells (CD3-CD16 + CD56+) and B cells (CD19+).
For these cell types, we analyzed their absolute numbers and relative percentages at baseline as well as the relative changes in absolute numbers and percentages during follow-up compared to baseline.
Ethics
The ethics committee of the Medical University Vienna approved the study (ethical approval number: 1968/2019).
Data availability
De-identified data can be made available from the corresponding author upon reasonable request and after approval from the ethics review board at the Medical University of Vienna.
Statistics
All statistical analyses and graphical representations were performed in R (Version 4.2.1). Univariate group comparisons were done by Chi-square test, Mann–Whitney U test, or independent t-test (with Welch’s correction in case of unequal standard deviations in the groups) as appropriate.
For the multivariate binary logistic regression model, the dependent variable was either relapse (yes/no), EDSS worsening (yes/no), AE (yes/no), or SAE (yes/no). Initially, all explanatory variables were tested using a univariable model, and significant variables were included in the final multivariate binary logistic regression model. Sex, disease course, and age were included in the multivariate model regardless of their significance in the univariate model due to their a priori potential explanatory power. The most parsimonious model was selected by using the stepwise Akaike Information Criterion (AIC) to obtain the best fit with the lowest AIC for the data set. The significance of individual variables was assessed using the Wald Chi-Squared Test.
As we anticipated a large degree of heterogeneity in our cohort due to the different DMDs used, we chose a two-step approach were we first analyzed the whole cohort regarding the endpoints and then conducted subgroup analyses for each DMD class, where a sufficient sample size was available.
We checked for linearity assumption (martingale residuals and deviance residuals) and proportional hazard assumption and found them acceptable. We tested all variables for normal distribution using the Lilliefors-test and for collinearity using variance inflation factor (VIF). Any variables with a VIF greater than 2.0 were excluded from the multivariate regression analysis. McFadden’s R squared was used to evaluate the goodness of fit for the logistic regression models. We considered a two-sided p-value less than 0.05 as statistically significant.
Results
The detailed inclusion process is shown in Figure 1.
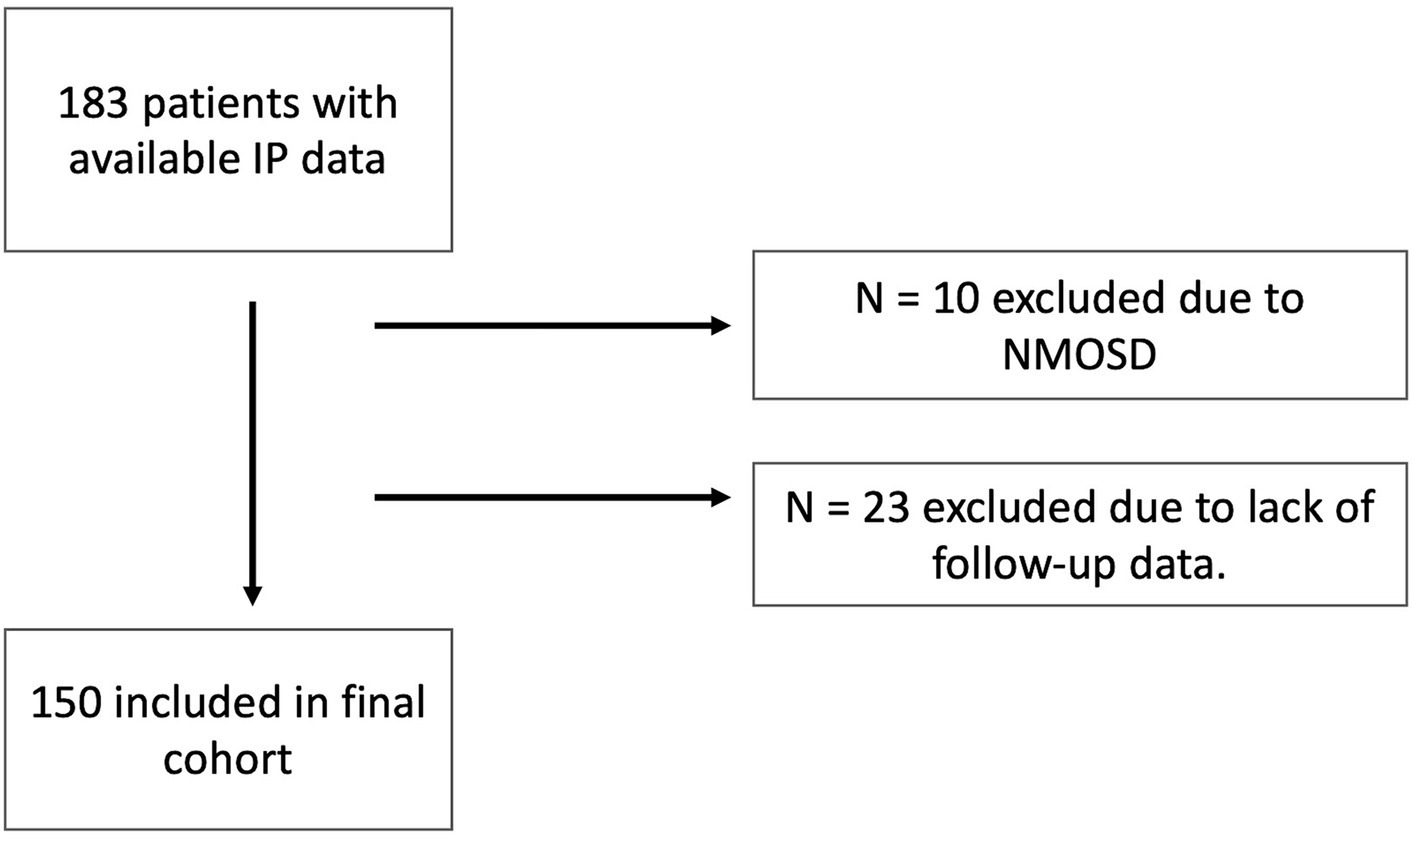
Figure 1. Inclusion flow chart. IP, Immunophenotyping; NMOSD, neuromyelitis optica spectrum disorders.
Demographics and characteristics of the whole cohort and the treatment groups are shown in Table 1. As expected, there were significant imbalances between treatment groups (Table 1).
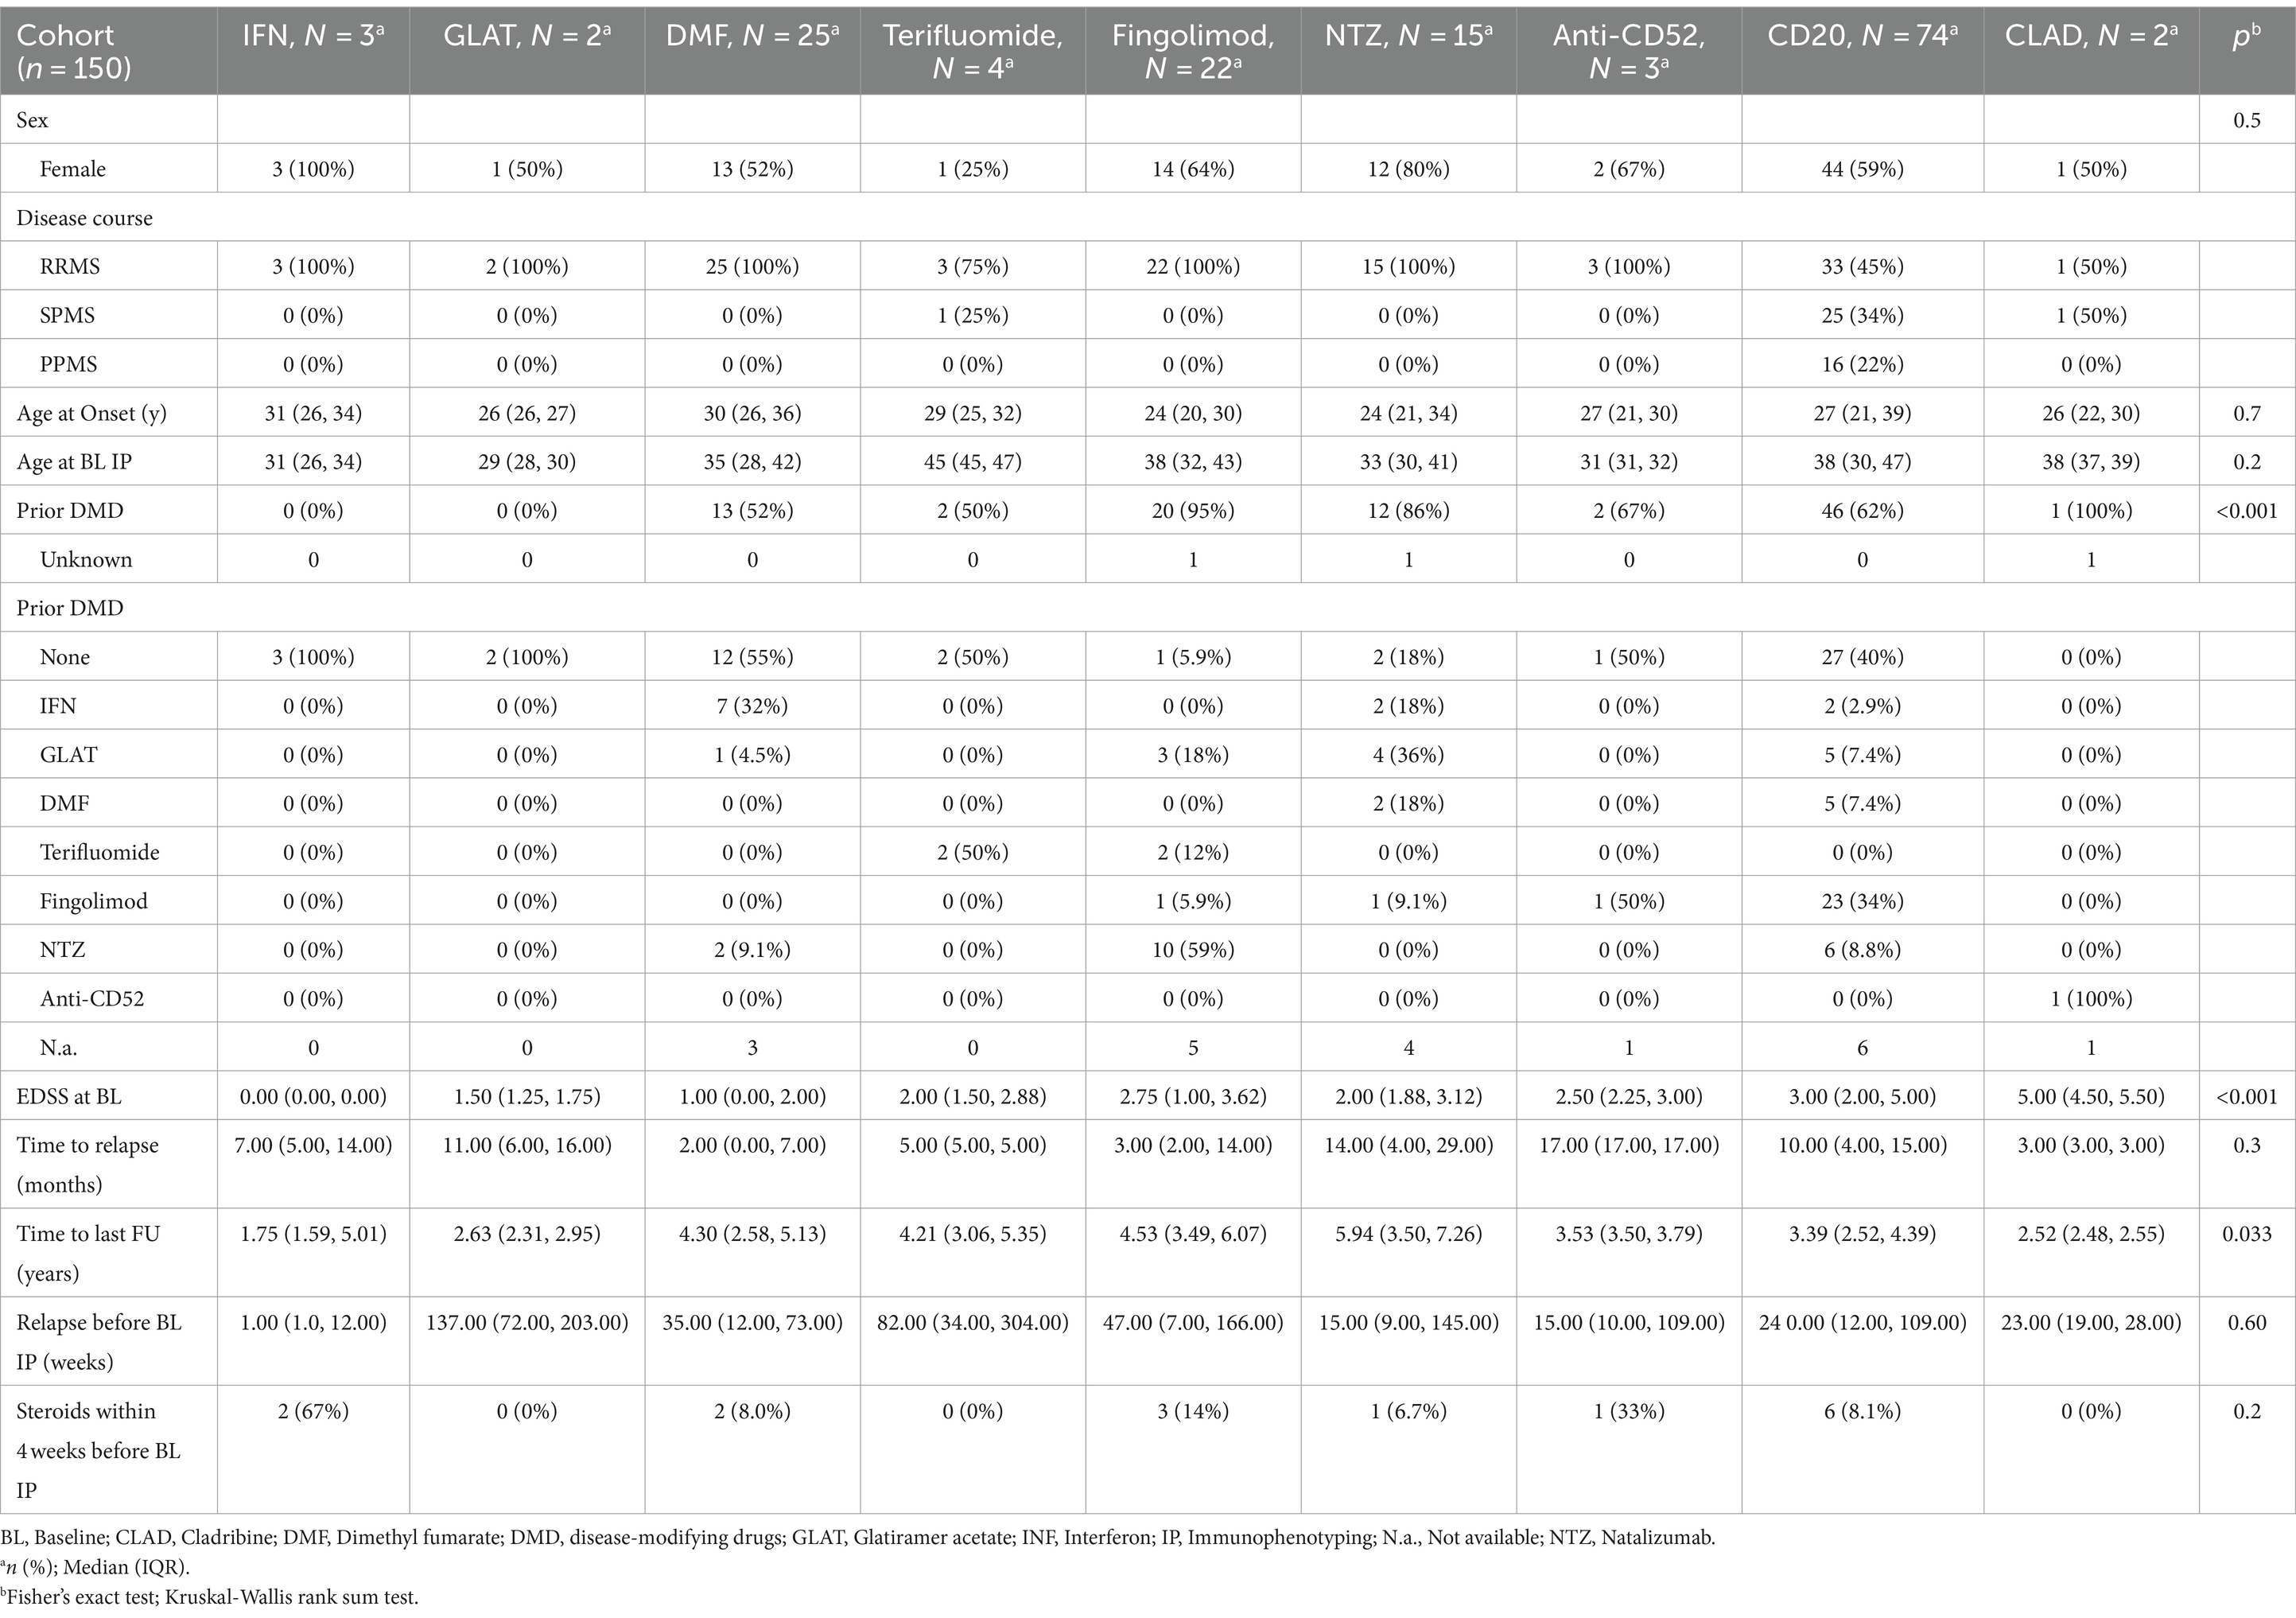
Table 1. Characteristics of overall study cohort and DMD subgroups.
Monocytes (r(p) = 0.32, p = 0.02) and NK cells (r(p) = 0.35, p = 0.01) correlated with age in treatment naïve patients at baseline phenotyping.
Treatment response in the overall cohort
During follow-up, relapses and EDSS worsening occurred in 51 (34%) 44 (30%) pwMS, respectively.
Relapse occurrence was associated with a higher percentage of CD8+ T cells (OR: 1.06, 95% CI: 1.01–1.12 p = 0.013), which remained the only significant variable (OR 1.09, CI: 1.02–1.15, p = 0.021) in the multivariate model besides the progressive disease course (SPMS OR 0.31, CI: 0.10–0.99, p = 0.05) (Table 2). Looking only at treatment naïve pwMS, no variable remained associated with relapse activity.
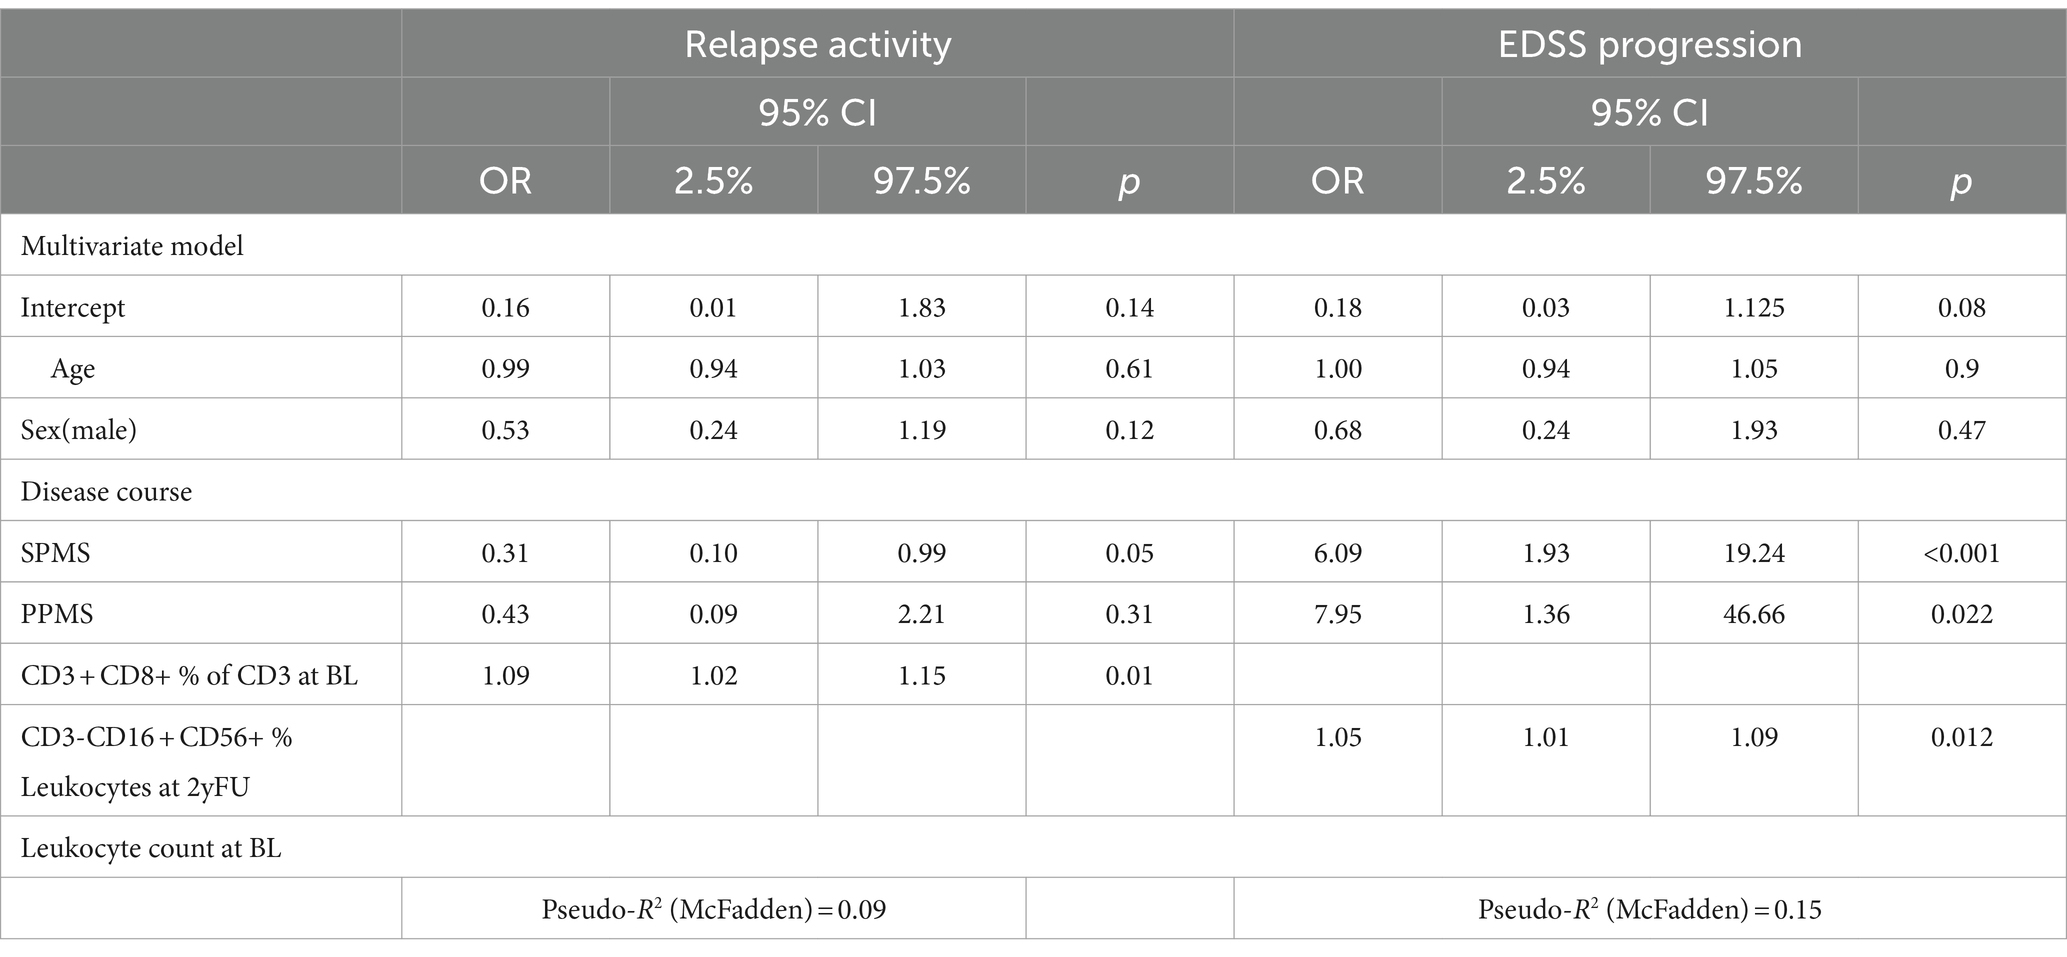
Table 2. General efficacy.
There was no association observed between temporal changes in cellular composition at one or two years after DMD initiation, and the occurrence of relapses.
EDSS worsening was not associated with any baseline immunophenotype variables. However, it was associated with a relative increase in the percentage of NK cells compared to baseline during the follow-up (per %: OR 1.05, CI: 1.01–1.09, p = 0.012). Expectedly, the strongest predictor of EDSS worsening was a progressive disease phenotype (SPMS OR: 6.09, CI: 1.93–19.24, p < 0.001, PPMS OR: 7.95, CI: 1.36–46.66, p = 0.022). In the cohort of treatment-naïve pwMS, only disease course was associated with EDSS progression (SPMS OR: 23.0, CI: 2.20–564.41, p = 0.016; PPMS OR: 9.58, CI: 1.72–65.7, p = 0.013).
Treatment response in B cell depleting DMDs
The anti-CD20 group was large enough to perform a specific subgroup analysis (n = 74).
In this group, 17 pwMS suffered from a relapse (22.9%). In the multivariate model, the only significant variable associated with a relapse was a higher CD8+ percentage (per %: OR 1.12 CI: 1.01–1.25 p = 0.028) (Table 3) at baseline. Omitting progressive MS patients did not result in a multivariate model with significant associations. Excluding all pre-treated patients led to perfect separation due to the small number of cases, blocking further analyses.
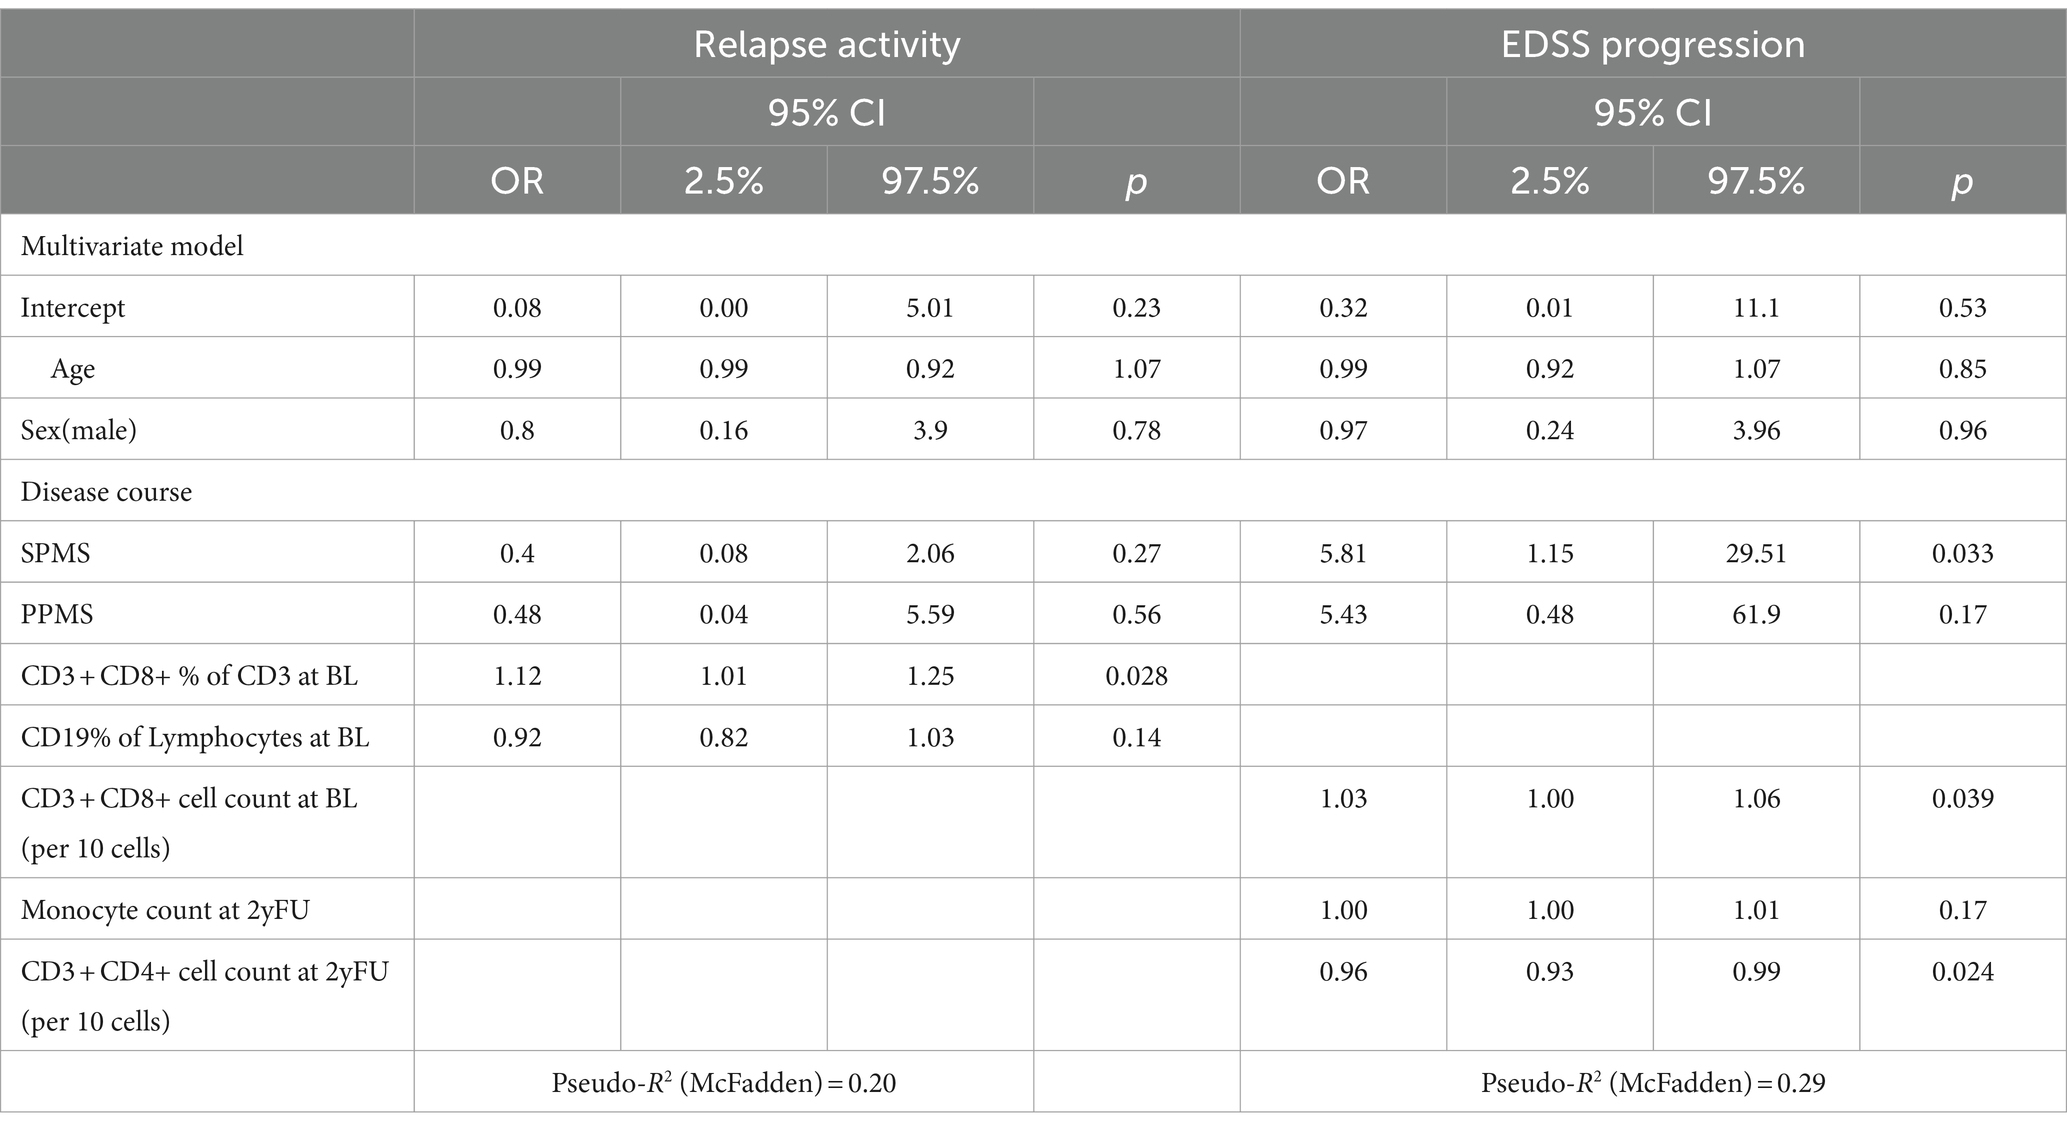
Table 3. Anti-CD20 efficacy.
In the multivariate model, there was no association between temporal changes in cellular composition at one or two years after DMD initiation and the occurrence of relapses.
As in the overall cohort, EDSS worsening was associated with progressive disease course (SPMS OR: 5.81, CI: 1.15–29.51, p = 0.033). However, a higher absolute number of CD8+ cells at baseline (per 10 cells: OR 1.03, CI: 1.00–1.06, p = 0.039) as well as a lower absolute number of CD4+ T cells at the 2-year follow-up (per 10 cells: OR 0.96, CI: 0.93–0.99, p = 0.024) were both associated with EDSS worsening. In the cohort of treatment-naïve pwMS, only the progressive disease course remained associated with EDSS progression (SPMS: OR: 30.0, CI: 1.41–638.2, p = 0.032).
Safety
AEs occurred in 78 (52%) pwMS. Most AEs were reported under anti-CD20 treatment (n = 31) followed by DMF (n = 23). Most reported AEs were acute medication intake related (n = 50), while the most common non-acute AEs were laboratory abnormalities and infections (n = 21). Of the 16 SAEs recorded, 9 were associated with acute medication intake, 4 were infections, and 3 were severe laboratory abnormalities.
Overall, AE occurrence was associated with male sex (OR: 3.31, CI: 1.179.39, p = 0.02), a higher percentage of T cells at baseline (CD3+) (per %: OR 1.07, CI: 1.00–1.13, p = 0.03), lower number of baseline percentual NKT cells (CD3 + CD16 + CD56+) (per %: OR 0.81, CI: 0.70–0.94, p = 0.01), as well as all but PPMS disease courses (PPMS OR: 0.05, CI: 0.00–0.55, p = 0.01) (Table 4). When looking only at infections, a higher percentage of baseline CD4 T cells was associated with the occurrence of infection during follow-up (per %: OR 1.14, CI: 1.05–1.25, p < 0.001).
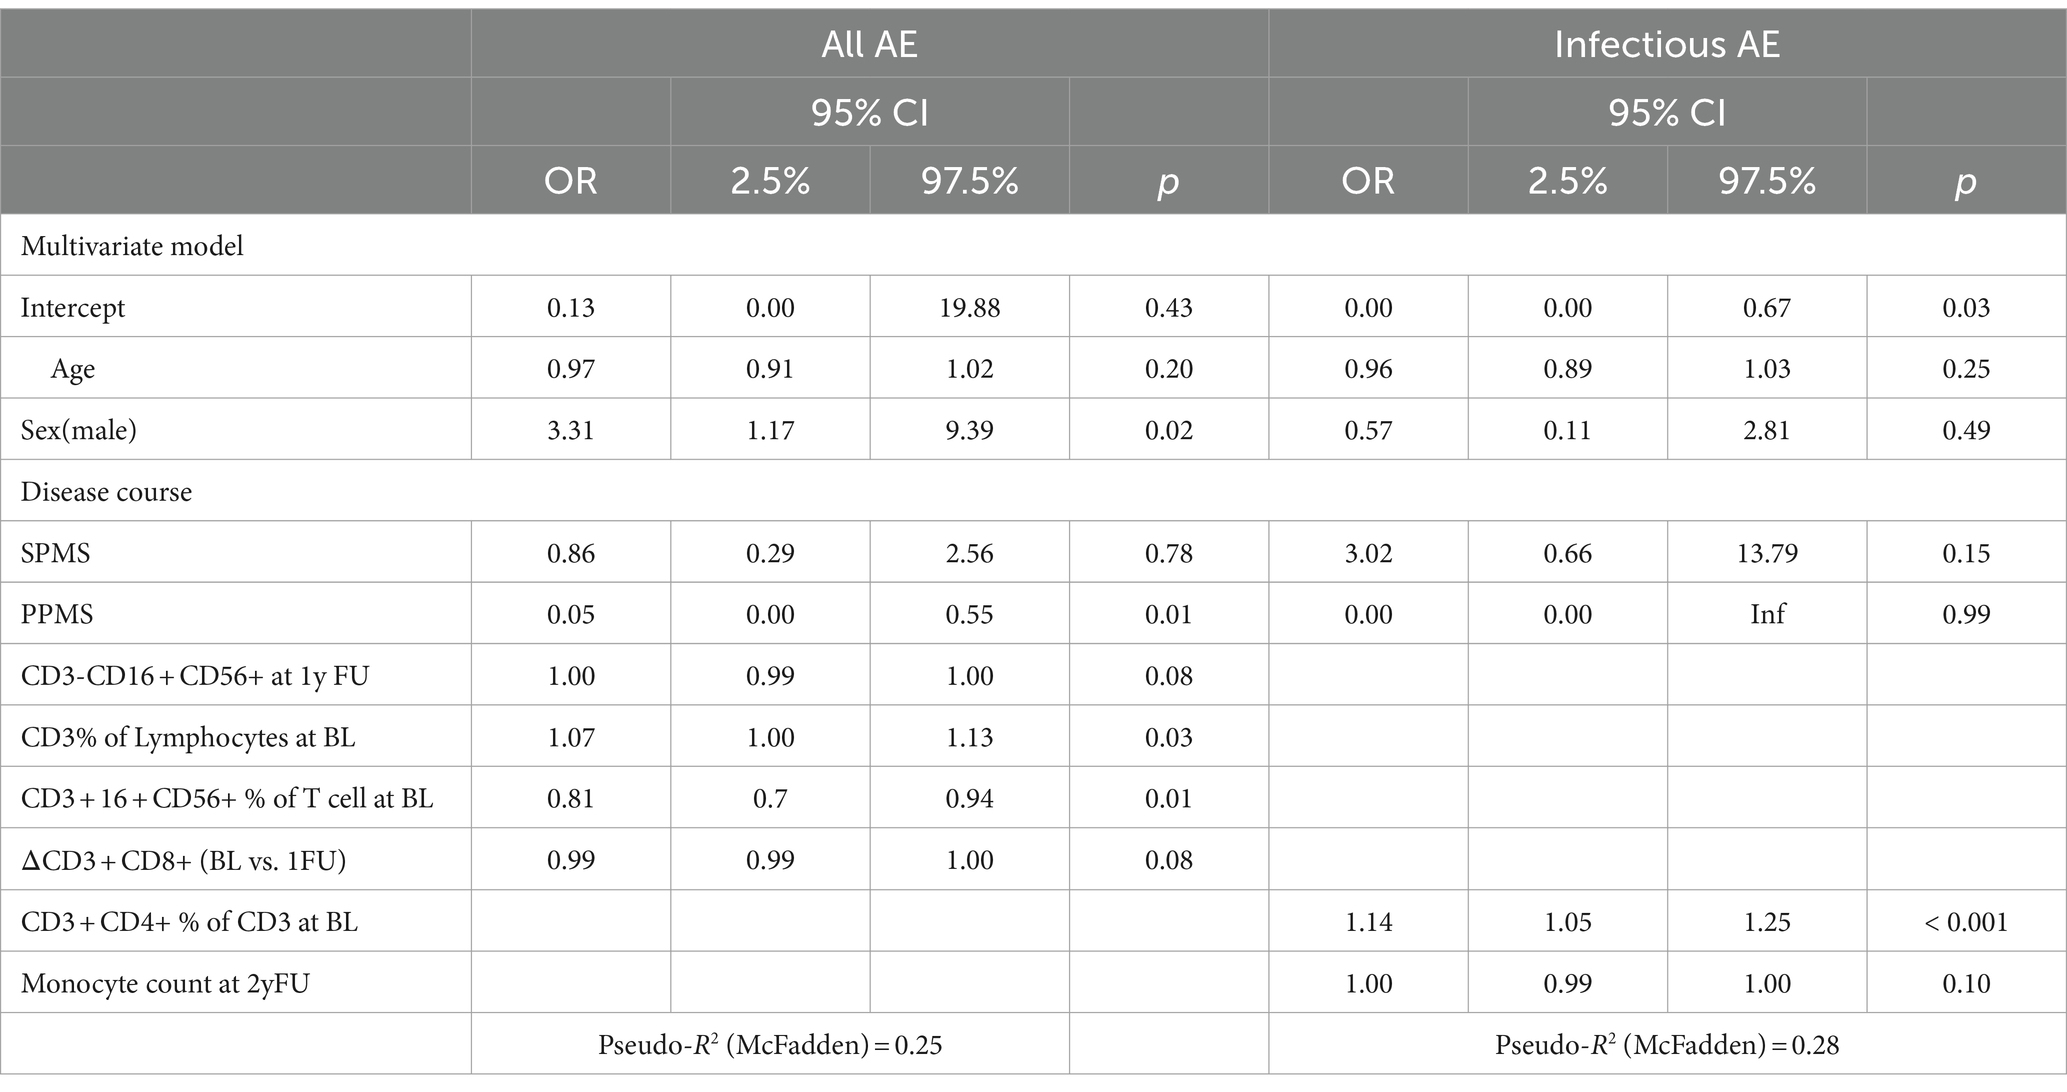
Table 4. General AE.
There were no significant associations with the occurrence of SAEs in the multivariate model.
Safety in B cell depleting DMDs
In the anti-CD20 group, 12 SAEs recorded, 8 were associated with acute medication intake and 4 with infections.
The occurrence of AEs was associated with a higher percentage of baseline T cells (CD3+) (per %: OR 1.12, CI: 1.03–1.20, p = 0.004) and PPMS course (PPMS OR: 0.03, CI: 0.00–0.44, p = 0.011) (Table 5). In the multivariate model, there was no association between temporal changes in cellular composition at one or two years after DMD initiation and the occurrence of AEs.
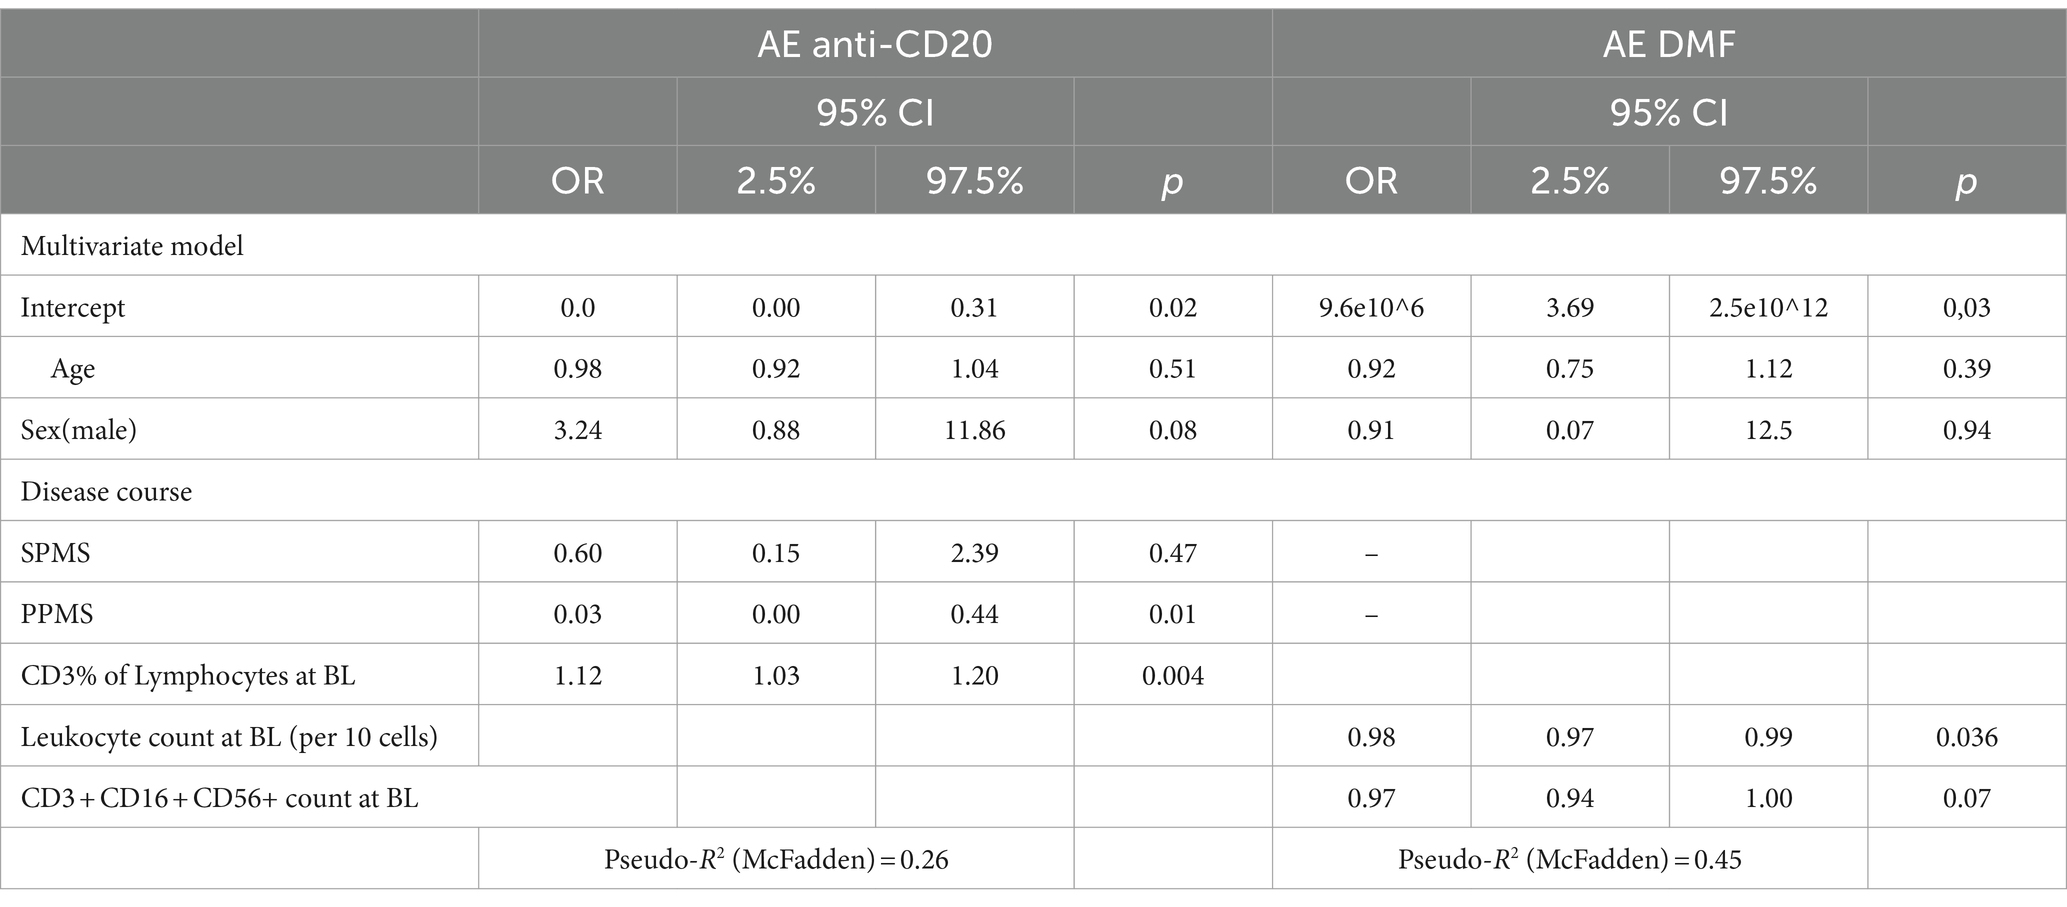
Table 5. Treatment specific AE.
Considering only infusion-related reactions, a higher percentage of baseline T cells (CD3+) (per %: OR 1.09, CI: 1.17–2.24, p = 0.025) was associated with a higher likelihood of suffering infusion-related reactions.
None of the variables was significantly associated with a higher likelihood of suffering from infections.
A higher percentage of baseline T cells (CD3+) (per %: OR 1.17, CI: 1.04–1.31, p = 0.001) was significantly associated with a higher likelihood of suffering from a SAE.
Safety in DMF
In the DMF group, no SAEs was observed in the DMF cohort.
The occurrence of AEs was associated with lower baseline leukocyte count (per 10 cells: OR 0.98, CI: 0.97–0.99, p = 0.036) (Table 5). In the multivariate model, there was no association between temporal changes in cellular composition at one or two years after DMD initiation and the occurrence of AEs.
Discussion
Individually tailored treatment strategies are needed to maximize clinical benefit as well as minimize AEs in pwMS receiving DMDs. Hence, we explored the value of standardized basic immunophenotyping in pwMS as potential cellular biomarkers for treatment response and occurrence of AEs.
We found that T cell subset composition is associated with relapse activity during treatment as a relatively increased proportion of CD8+ lymphocytes at baseline indicated a higher likelihood of subsequent relapse (about 9% per 1% increase in CD8+ proportion of all CD3+ cells). This was particularly driven by patients receiving anti-CD20 therapy, where the relapse risk was increased by 12% for every 1% higher CD8+ proportion of T cells. Also, a higher absolute number of CD8+ cells at baseline (3% increase per 10 cells) as well as a lower number of CD4+ cells during follow-up (4% decrease per 10 cells) were associated with an increased risk for EDSS worsening. Interestingly, an increase in the proportion of NK cells was also associated with a higher risk of EDSS worsening (5% per 1% increase).
Concerning safety, we found that a higher percentage of baseline CD4+ T cells was associated with the occurrence of infection (14% for every 1% higher CD3 + CD4+ proportion), and a lower percentage of NKT cells (19% for every 1% lower CD3 + CD16 + CD56+ proportion) was associated with the occurrence of any AEs in the overall cohort, which was confirmed in the anti-CD20 cohort. While we did not observe any SAEs in the DMF cohort, a lower baseline leukocyte count was associated with higher likelihood of any AE occurrence (2% per 10 cells).
It is well established that DMDs change the cellular immune profile in pwMS (17). Prior studies have implicated a predictive value of pre-treatment or on-treatment cellular subsets in predicting relapses and/or AEs (3, 7, 18, 19). While most studies use peripheral blood mononuclear cells (PBMCs) due to their ability to be frozen and stored, studies in fresh blood in the standardized clinical certified laboratory are rare (20).
Recently, two studies explored the potential of immunophenotyping and relapse activity in patients prior to anti-CD20 treatment. Shinoda and colleagues indicated in an in-depth immunophenotyping study that CD20dimCD8+ T cell inversely correlated with relapse activity in patients receiving ocrelizumab (3). Interestingly, Garcia and colleagues showed that CD8+CCR5+ T cells were inversely correlated with time since last relapse, whereas they found no correlation between CD20dimCD8+ T cells and time since last relapse (21). While this at the first sight seems contradictory to our finding of an association between a higher proportion of CD8 T cells and subsequent relapses in patients starting an anti-CD20 treatment, both groups provide evidence that these subpopulations have migratory capacity and therefore might have migrated to the CNS. Thus, predictive value of certain cell types might depend on the time of sampling in relation to application of an anti-CD20 treatment. As both studies were performed on cells collected during a rigorously controlled clinical trial, our data from a routine setting further underlines the involvement of CD8 T cells in relapse-related immunobiology specifically in patients receiving anti-CD20 treatment, although the exact sub-phenotypes and kinetics remain so far unknown.
Besides CD8+ T cells, we also observed an association between a relative increase in the percentage of NK cells from pre-to post-treatment and disability progression. Alterations in the proportion of NK cell subsets in MS have been previously demonstrated, but the detailed relationship is yet unresolved (22). Prior data implicated an increase in the proportions of CD56dim NK cells in patients with disease progression supporting our findings (23). While we did not distinguish between NK-CD56bright and NK-CD56dim cells, NK-CD56dim cells are the most abundant in the circulation, likely reflecting our findings. In contrast, a lower proportion NK-CD56bright cell count was associated with signs of disease activity on MRI, but not there was no association with disability progression (24). Of note, these findings were reported to be independent of the treatment effect (24). However, the respective study cohort did not contain any patients receiving depleting DMDs, wherefore comparability to our cohort mostly including patients on anti-CD20 treatment is limited.
Concerning safety and AEs, a basic variant of immunophenotyping is already well-established in specific indications of clinical practice, namely the monitoring of lymphocyte counts to avoid persistent lymphopenia, e.g., in patients treated with DMF (25). However, there is a relative paucity of studies applying more advanced immunophenotyping for predicting safety and AEs in pwMS. An important concept in this regard is immunosenescence, a term referring to age-related changes in the immune system, increasing susceptibility to diseases such as malignancies and infections (26, 27). Hallmarks of immune system aging include a transition toward a memory phenotype within the T-cell compartment, which can result in a reduced ability to respond to new antigens. Additionally, there is a general decline in immune function and an increased predisposition to a proinflammatory state (28). The available evidence indicates that this phenomenon may be expedited in pwMS, leading to a higher proportion of memory CD4 T cells and impaired regulation via immune-checkpoint mechanisms (29, 30).
In line with this concept, we found that a higher percentage of CD4 T cells at baseline was associated with a higher likelihood of infections during follow-up.
Further studies with more detailed sub-phenotyping will be necessary to unravel the complex mechanisms that underlie immune aging in MS.
Limitations
The retrospective analysis of data collected in clinical routine creates a variety of possible biases: Most important is the inherent bias of patients undergoing leukocyte subtyping depending on the choice of treatment, which is not random but determined by the characteristics and preferences of patients and the prescribing practices of clinicians. Also, different frequencies of clinical visits and different periods of follow-up might induce detection bias. As data were collected retrospectively, likely causing reporting bias, we have considered SAEs as such only if there is clear documentation and otherwise classified them as AEs. While this might have resulted in the underrepresentation of SAEs, AE rates are consistent with the published data. However, safety profiles are, in general, not comprehensively captured in retrospective studies. Further, we did not have sufficiently dense MRI data available for this study, which reduces sensitivity to detect differences in effectiveness. Immunophenotyping was based only on a very limited number of lineage markers without in-depth characterization of cellular subpopulations, each of those likely to possess subpopulations with both deleterious and beneficial properties on their own.
Additionally, we could not ascertain the time interval between the cessation of the last DMT and baseline immunophenotyping. This information is crucial as it may significantly impact baseline immunophenotyping due to potential carryover effects and long-term influences on peripheral blood phenotypes.
Our study was designed as exploratory and hypothesis-generating and, therefore, requires validation in an independent cohort.
Data availability statement
The raw data supporting the conclusions of this article will be made available by the authors, without undue reservation.
Ethics statement
The studies involving humans were approved by Ethics committee of the Medical University Vienna (ethical approval number: 1968/2019). The studies were conducted in accordance with the local legislation and institutional requirements. The ethics committee/institutional review board waived the requirement of written informed consent for participation from the participants or the participants’ legal guardians/next of kin because the waiver does not adversely affect the rights and welfare of participants, and the research in its entirety involves only retrospective data analysis.
Author contributions
TZ: Writing – review & editing, Writing – original draft, Visualization, Validation, Supervision, Software, Resources, Project administration, Methodology, Investigation, Funding acquisition, Formal analysis, Data curation, Conceptualization. KR: Writing – review & editing, Writing – original draft, Data curation. VW: Writing – review & editing, Writing – original draft, Data curation. RT: Writing – review & editing, Writing – original draft, Methodology, Data curation. HH: Writing – review & editing, Writing – original draft, Methodology, Data curation. PA: Writing – review & editing, Writing – original draft, Data curation. BK: Writing – review & editing, Writing – original draft, Methodology, Data curation. NK: Writing – review & editing, Writing – original draft, Methodology, Data curation. TM: Writing – review & editing, Writing – original draft, Methodology, Data curation. CS: Writing – review & editing, Writing – original draft, Methodology, Data curation. KZ: Writing – review & editing, Writing – original draft, Methodology, Data curation. GZ: Writing – review & editing, Writing – original draft, Methodology, Data curation. TB: Writing – review & editing, Writing – original draft, Supervision, Methodology. PR: Writing – review & editing, Writing – original draft, Methodology, Data curation. FL: Writing – review & editing, Writing – original draft, Supervision, Methodology. GB: Writing – review & editing, Writing – original draft, Supervision, Methodology, Formal analysis, Data curation.
Funding
The author(s) declare that no financial support was received for the research, authorship, and/or publication of this article.
Conflict of interest
TZ has participated in meetings sponsored by or received travel funding from Biogen, Merck, Novartis, Roche, Sanofi-Genzyme and Teva. HH reports grants from Glock Health Science and Research, BlueSky Immunotherapies, Neutrolis, Clickmer, Janssen-Cilag, the Austrian Federal Ministry for Education Science and Research, as well as from the Austrian Federal Ministry for Defense and Sports, all outside of the submitted work. PA has participated in meetings sponsored by, received speaker honoraria or travel funding from Biogen, Merck, Roche, Sanofi-Genzyme and Teva, and received honoraria for consulting from Biogen. He received a research grant from Quanterix International and was awarded a combined sponsorship from Biogen, Merck, Sanofi-Genzyme, Roche, and Teva for a clinical study. BK has received honoraria for speaking and for consulting from Biogen, BMSCelgene, Johnson&Johnson, Merck, Novartis, Roche, Teva and Sanofi-Genzyme outside of the submitted work. No conflict of interest with respect to the present study. NK has participated in meetings sponsored by, received speaker honoraria or travel funding from BMS/Celgene, Janssen-Cilag, Merck, Novartis, Roche and Sanofi-Genzyme and held a grant for a Multiple Sclerosis Clinical Training Fellowship Programme from the European Committee for Treatment and Research in Multiple Sclerosis (ECTRIMS). TM has participated in meetings sponsored by or received travel funding from Biogen, Merck, Novartis, Roche, Sanofi-Genzyme and Teva. KZ received speaking honoraria or travel grants from Biogen, Novartis and Sanofi-Genzyme. GZ has participated in meetings sponsored by or received travel funding from Biogen, Merck, Novartis, Roche, Sanofi-Genzyme and Teva. TB has participated in meetings sponsored by and received honoraria (lectures, advisory boards, consultations) from pharmaceutical companies marketing treatments for MS: Allergan, Bayer, Biogen, Bionorica, BMS/Celgene, Genesis, GSK, GW/Jazz Pharma, Horizon, Janssen-Cilag, MedDay, Merck, Novartis, Octapharma, Roche, Sandoz, Sanofi-Genzyme, Teva and UCB. His institution has received financial support in the past 12 months by unrestricted research grants (Biogen, Bayer, BMS/Celgene, Merck, Novartis, Roche, Sanofi-Genzyme, Teva) and for participation in clinical trials in multiple sclerosis sponsored by Alexion, Bayer, Biogen, Merck, Novartis, Octapharma, Roche, Sanofi-Genzyme, Teva. PR has received honoraria for consultancy/speaking from AbbVie, Allmiral, Alexion, Biogen, Merck, Novartis, Roche, Sandoz, Sanofi Genzyme, has received research grants from Amicus, Biogen, Merck, Roche. FL has participated in meetings sponsored by, received speaker honoraria or travel funding from Actelion, Almirall, Biogen, Celgene, Johnson&Johnson, MedDay, Merck, Novartis, Roche, Sanofi-Genzyme and Teva, and received honoraria for consulting Biogen, Celgene, Merck, Novartis, Roche, Sanofi-Genzyme and Teva. GB has participated in meetings sponsored by, received speaker honoraria or travel funding from Biogen, Celgene/BMS, Lilly, Merck, Novartis, Roche, Sanofi-Genzyme and Teva, and received honoraria for consulting Biogen, Celgene/BMS, Merck, Novartis, Roche, Sanofi-Genzyme and Teva. He has received financial support in the past 12 months by unrestricted research grants (Celgene/BMS, Novartis).
The remaining authors declare that the research was conducted in the absence of any commercial or financial relationships that could be construed as a potential conflict of interest.
Publisher’s note
All claims expressed in this article are solely those of the authors and do not necessarily represent those of their affiliated organizations, or those of the publisher, the editors and the reviewers. Any product that may be evaluated in this article, or claim that may be made by its manufacturer, is not guaranteed or endorsed by the publisher.
References
1. Prosperini, L, Haggiag, S, Tortorella, C, Galgani, S, and Gasperini, C. Age-related adverse events of disease-modifying treatments for multiple sclerosis: a meta-regression. Mult Scler J. (2021) 27:1391–402. doi: 10.1177/1352458520964778
2. Bar-Or, A, and Li, R. Cellular immunology of relapsing multiple sclerosis: interactions, checks, and balances. Lancet Neurol. (2021) 20:470–83. doi: 10.1016/S1474-4422(21)00063-6
3. Shinoda, K, Li, R, Rezk, A, Mexhitaj, I, Patterson, KR, Kakara, M, et al. Differential effects of anti-CD20 therapy on CD4 and CD8 T cells and implication of CD20-expressing CD8 T cells in MS disease activity. Proc Natl Acad Sci. (2023) 120:e2207291120. doi: 10.1073/pnas.2207291120
4. Lückel, C, Picard, F, Raifer, H, Campos Carrascosa, L, Guralnik, A, Zhang, Y, et al. IL-17+ CD8+ T cell suppression by dimethyl fumarate associates with clinical response in multiple sclerosis. Nat Commun. (2019) 10:5722. doi: 10.1038/s41467-019-13731-z
5. Diebold, M, Galli, E, Kopf, A, Sanderson, NS, Callegari, I, Benkert, P, et al. High-dimensional immune profiling identifies a biomarker to monitor dimethyl fumarate response in multiple sclerosis. Proc Natl Acad Sci. (2022) 119:e2205042119. doi: 10.1073/pnas.2205042119
6. Van Langelaar, J, van der Vuurst, RM, de Vries, M, Janssen, AF, Wierenga-Wolf, IM, Spilt, TA, et al. T helper 17.1 cells associate with multiple sclerosis disease activity: perspectives for early intervention. Brain. (2018) 141:1334–49. doi: 10.1093/brain/awy069
7. Ghadiri, M, Rezk, A, Li, R, Evans, A, Giacomini, PS, Barnett, MH, et al. Pre-treatment T-cell subsets associate with fingolimod treatment responsiveness in multiple sclerosis. Sci Rep. (2020) 10:1–14. doi: 10.1038/s41598-019-57114-2
8. Walo-Delgado, PE, Monreal, E, Medina, S, Quintana, E, Sainz de la Maza, S, Fernández-Velasco, JI, et al. Role of b cell profile for predicting secondary autoimmunity in patients treated with alemtuzumab. Front Immunol. (2021) 12:760546. doi: 10.3389/fimmu.2021.760546
9. Mimpen, M, Muris, AH, Rolf, L, Gerlach, O, Kuhle, J, Hupperts, R, et al. Prognostic value of natural killer cell/T cell ratios for disease activity in multiple sclerosis. Eur J Neurol. (2021) 28:901–9. doi: 10.1111/ene.14680
10. Novi, G, Bovis, F, Fabbri, S, Tazza, F, Gazzola, P, Maietta, I, et al. Tailoring B cell depletion therapy in MS according to memory B cell monitoring. Neurol Neuroimmunol Neuroinflamm. (2020) 7:e845. doi: 10.1212/NXI.0000000000000845
11. Cossarizza, A, Chang, HD, Radbruch, A, Abrignani, S, Addo, R, Akdis, M, et al. Guidelines for the use of flow cytometry and cell sorting in immunological studies. Eur J Immunol. (2021) 51:2708–3145. doi: 10.1002/eji.202170126
12. Kalina, T. Reproducibility of flow cytometry through standardization: opportunities and challenges. Cytometry A. (2020) 97:137–47. doi: 10.1002/cyto.a.23901
13. Von Elm, E, Altman, DG, Egger, M, Pocock, SJ, Gøtzsche, PC, Vandenbroucke, JP, et al. The strengthening the reporting of observational studies in epidemiology (STROBE) statement: guidelines for reporting observational studies. Int J Surg. (2014) 12:1495–9. doi: 10.1016/j.ijsu.2014.07.013
14. Bsteh, G, Hegen, H, Riedl, K, Altmann, P, Auer, M, Berek, K, et al. Quantifying the risk of disease reactivation after interferon and glatiramer acetate discontinuation in multiple sclerosis: the VIAADISC score. Eur J Neurol. (2021) 28:1609–16. doi: 10.1111/ene.14705
15. Polman, CH, Reingold, SC, Banwell, B, Clanet, M, Cohen, JA, Filippi, M, et al. Diagnostic criteria for multiple sclerosis: 2010 revisions to the McDonald criteria. Ann Neurol. (2011) 69:292–302. doi: 10.1002/ana.22366
16. Thompson, AJ, Banwell, BL, Barkhof, F, Carroll, WM, Coetzee, T, Comi, G, et al. Diagnosis of multiple sclerosis: 2017 revisions of the McDonald criteria. Lancet Neurol. (2018) 17:162–73. doi: 10.1016/S1474-4422(17)30470-2
17. Cellerino, M, Ivaldi, F, Pardini, M, Rotta, G, Vila, G, Bäcker-Koduah, P, et al. Impact of treatment on cellular immunophenotype in MS: a cross-sectional study. Neurol Neuroimmunol Neuroinflamm. (2020) 7:e693. doi: 10.1212/NXI.0000000000000693
18. Alifieris, C, Schultze, SK, Sand, IK, Casaccia, P, and Ntranos, A. Immunosurveillance of CCR6+ T-cells predicts treatment response to dimethyl-fumarate: implications for personalized treatment strategies in multiple sclerosis. medRxiv. (2020):2020-05. doi: 10.1101/2020.05.15.20102137
19. Schwichtenberg, SC, Wisgalla, A, Schroeder-Castagno, M, Alvarez-González, C, Schlickeiser, S, Siebert, N, et al. Fingolimod therapy in multiple sclerosis leads to the enrichment of a subpopulation of aged NK cells. Neurotherapeutics. (2021) 18:1783–97. doi: 10.1007/s13311-021-01078-7
20. Teniente-Serra, A, Grau-López, L, Mansilla, MJ, Fernández-Sanmartín, M, Ester Condins, A, Ramo-Tello, C, et al. Multiparametric flow cytometric analysis of whole blood reveals changes in minor lymphocyte subpopulations of multiple sclerosis patients. Autoimmunity. (2016) 49:219–28. doi: 10.3109/08916934.2016.1138271
21. Garcia, A, Dugast, E, Shah, S, Morille, J, Lebrun-Frenay, C, Thouvenot, E, et al. Immune profiling reveals the T-cell effect of Ocrelizumab in early relapsing-remitting multiple sclerosis. Neurol Neuroimmunol Neuroinflamm. (2023) 10:e200091. doi: 10.1212/NXI.0000000000200091
22. Mimpen, M, Smolders, J, Hupperts, R, and Damoiseaux, J. Natural killer cells in multiple sclerosis: a review. Immunol Lett. (2020) 222:1–11. doi: 10.1016/j.imlet.2020.02.012
23. Gross, CC, Schulte-Mecklenbeck, A, Madireddy, L, Pawlitzki, M, Strippel, C, Räuber, S, et al. Classification of neurological diseases using multi-dimensional CSF analysis. Brain. (2021) 144:2625–34. doi: 10.1093/brain/awab147
24. Caruana, P, Lemmert, K, Ribbons, K, Lea, R, and Lechner-Scott, J. Natural killer cell subpopulations are associated with MRI activity in a relapsing-remitting multiple sclerosis patient cohort from Australia. Mult Scler J. (2017) 23:1479–87. doi: 10.1177/1352458516679267
25. Fox, RJ, Chan, A, Gold, R, Phillips, JT, Selmaj, K, Chang, I, et al. Characterizing absolute lymphocyte count profiles in dimethyl fumarate–treated patients with MS: patient management considerations. Neurol Clin Pract. (2016) 6:220–9. doi: 10.1212/CPJ.0000000000000238
26. Aw, D, Silva, AB, and Palmer, DB. Immunosenescence: emerging challenges for an ageing population. Immunology. (2007) 120:435–46. doi: 10.1111/j.1365-2567.2007.02555.x
27. Fulop, T, Larbi, A, Pawelec, G, Khalil, A, Cohen, A, Hirokawa, K, et al. Immunology of aging: the birth of inflammaging. Clin Rev Allergy Immunol. (2023) 64:109–122. doi: 10.1007/s12016-021-08899-6
28. Mittelbrunn, M, and Kroemer, G. Hallmarks of T cell aging. Nat Immunol. (2021) 22:687–98. doi: 10.1038/s41590-021-00927-z
29. Zuroff, L, Rezk, A, Shinoda, K, Espinoza, DA, Elyahu, Y, Zhang, B, et al. Immune aging in multiple sclerosis is characterized by abnormal CD4 T cell activation and increased frequencies of cytotoxic CD4 T cells with advancing age. EBioMedicine. (2022) 82:104179. doi: 10.1016/j.ebiom.2022.104179
Keywords: MS, immunophenotyping, DMD, treatment, T cells
Citation: Zrzavy T, Rieder K, Wuketich V, Thalhammer R, Haslacher H, Altmann P, Kornek B, Krajnc N, Monschein T, Schmied C, Zebenholzer K, Zulehner G, Berger T, Rommer P, Leutmezer F and Bsteh G (2024) Immunophenotyping in routine clinical practice for predicting treatment response and adverse events in patients with MS. Front. Neurol. 15:1388941. doi: 10.3389/fneur.2024.1388941
Edited by:
Vincent Van Pesch, Université Catholique de Louvain, BelgiumReviewed by:
Alice Mariottini, University of Florence, ItalyAntonio Bruno, University of Rome Tor Vergata, Italy
Copyright © 2024 Zrzavy, Rieder, Wuketich, Thalhammer, Haslacher, Altmann, Kornek, Krajnc, Monschein, Schmied, Zebenholzer, Zulehner, Berger, Rommer, Leutmezer and Bsteh. This is an open-access article distributed under the terms of the Creative Commons Attribution License (CC BY). The use, distribution or reproduction in other forums is permitted, provided the original author(s) and the copyright owner(s) are credited and that the original publication in this journal is cited, in accordance with accepted academic practice. No use, distribution or reproduction is permitted which does not comply with these terms.
*Correspondence: Gabriel Bsteh, gabriel.bsteh@meduniwien.ac.at