


- McGovern Institute for Brain Research, Department of Brain and Cognitive Sciences, Massachusetts Institute of Technology, Cambridge, MA, USA
Gamma oscillations in neocortex are hypothesized to improve information transmission between groups of neurons. We recently showed that optogenetic drive of fast-spiking interneurons (FS) at 40 Hz in mouse neocortex in vivo modulates the spike count and precision of sensory evoked responses. At specific phases of alignment between stimuli and FS activation, total evoked spike count was unchanged compared to baseline, but precision was increased. In the present study, we used computational modeling to investigate the origin of these local transformations, and to make predictions about their impact on downstream signal transmission. We replicated the prior experimental findings, and found that the local gain observed can be explained by mutual inhibition of fast-spiking interneurons, leading to more robust sensory-driven spiking in a brief temporal window post-stimulus, increasing local synchrony. Enhanced spiking in a second neocortical area, without a net increase in overall driven spikes in the first area, resulted from faster depolarization of target neurons due to increased pre-synaptic synchrony. In addition, we found that the precise temporal structure of spiking in the first area impacted the gain between cortical areas. The optimal spike distribution matched the “window of opportunity” defined by the timing of inhibition in the target area: spiking beyond this window did not contribute to downstream spike generation, leading to decreased overall gain. This result predicts that efficient transmission between neocortical areas requires a mechanism to dynamically match the temporal structure of the output of one area to the timing of inhibition in the recipient zone.
Introduction
Cortical oscillations in the gamma range (30–80 Hz) have been observed in numerous brain regions in a variety of species (Gray and Singer, 1989; Engel et al., 1991; Ribary et al., 1991; Maldonado et al., 2000; Nase et al., 2003), and during a wide range of behavioral states, from attentive wakefulness to REM sleep (Maloney et al., 1997; Gruber et al., 1999). The appearance of gamma at specific times relative to task performance implicates these rhythms in sensory processing, perceptual binding, memory formation, and conscious experience (Tallon-Baudry et al., 1997; Tallon-Baudry and Bertrand, 1999; Fries et al., 2001; Womelsdorf et al., 2006; Jensen et al., 2007; Fries, 2009; Gregoriou et al., 2009). However, the correlation between gamma expression and enhanced processing is nevertheless a debated issue, particularly in primary sensory neocortex (Chalk et al., 2010). In apparent contrast to the diversity of conditions under which gamma has been detected, studies performed in vitro, in vivo, and in silico point to a unifying mechanism for gamma: volleys of alternating inhibition and excitation between parvalbumin-positive fast-spiking interneurons and pyramidal cells (Freeman, 1968; Wang and Buzsáki, 1996; Fisahn et al., 1998; Whittington et al., 2000; Traub et al., 2005; Bartos et al., 2007; Börgers et al., 2008; Börgers and Kopell, 2008; Atallah and Scanziani, 2009; Cardin et al., 2009; Paik et al., 2009); but see also (Galán et al., 2006). If gamma-range oscillations enhance signal processing, their common mechanism may reflect an essential temporal structure in the functioning of neural circuits.
To move beyond assertions based in correlation and directly test the hypothesis that the precise spike timing brought about by gamma oscillations enhances intracortical communication, it is necessary to bring this oscillation under experimental control. Enforcing temporal precision within a local network will require interventions that are somewhat artificial, but which are essential for understanding the benefits of gamma. In a recent study, Cardin et al. (2009) used optical stimulation to drive parvalbumin-positive neurons in the gamma frequency range, inducing network effects that mimic physiological gamma. When punctate sensory stimuli (brief vibrissa deflections) were presented, the precise timing of inhibition relative to sensory input altered the evoked response. For certain delays, the overall number of spikes was reduced, indicating gamma can change the input gain of a region. For other delays, rhythmic inhibition did not decrease the total number of spikes, but did cause spiking to occur in a more compressed temporal window, increasing the synchrony of the evoked response.
In considering dynamics in rate coding, a fundamental question is the value that an action potential (or a fixed number of action potentials) has in generating firing in a downstream area. Central to this question of gain modulation is whether the same number of spikes in a local area can generate a greater number of spikes in a target area, enhancing the efficacy of signal transmission. Synchrony is often cited as a potential mechanism for increasing the value of a given spike rate in a local area (König et al., 1996; Azouz and Gray, 2000, 2003; Pinto et al., 2000; Börgers and Kopell, 2005; Bruno and Sakmann, 2006; Wang et al., 2010), though relatively little direct experimental evidence has been offered for this idea.
Presuming efficacy can be modulated, we can begin to explore the boundaries on this improvement in transmission. For example, it is important to know the limit beyond which firing in the local area cannot be further optimized, leading to diminishing returns when more local spikes are added. We refer to this as the efficiency of transmission, as additional, less useful spikes would reflect “wasted” effort of the pre-synaptic area.
Using a computational model consisting of 4488 neurons with realistic Hodgkin–Huxley biophysics, we addressed three questions regarding neural gain and gamma posed by the Cardin et al. (2009) findings. First, we delineated a potential local network mechanism that can explain the local gain change observed, i.e. the increased firing rate during the early part of the response at specific phases of alignment between sensory stimulus and gamma cycle. Second, we asked how an imposed gamma oscillation can impact the efficacy of signal transmission, and third, how it may impact its efficiency. Though the oscillations induced in our network (and in Cardin et al., 2009) lack the spatial and temporal flexibility of natural rhythms, they are a potentially powerful tool for probing the importance of spike timing in intracortical communication. Limitations of this approach in general and specific ways that it is non-natural are presented in the section “Discussion”.
We found, in agreement with previous suggestions, that a sharper onset in the rate of pre-synaptic spiking enhanced the efficacy of signal transmission. We further found that spiking efficiency was crucially dependent on the shape of the sensory evoked “spike packet,” defined as local spikes within a temporal window on the scale of a single cycle of gamma (see Tiesinga and Sejnowski, 2009 for explication of a similar term, “spike volleys”). Under model conditions in which the recipient neocortical area exhibited strong recurrent inhibition, spiking beyond the gamma-defined window did not contribute to additional downstream activation, decreasing the net gain between areas. Given that such conditions are observed during enhanced attention and arousal and during processing of naturalistic stimuli, these findings suggest a fundamental time scale for the effective transmission of signals through the neocortex during active sensory processing.
Materials and Methods
The model was organized in a sequence of three processing stages. An input stage (I) provided excitatory feed-forward input (simulating a sensory stimulus) to the first processing stage (X1), which is the site of “optical” modulation, and the output of X1 was fed into the second processing stage (X2). Both processing stages were identical except for the strength of recurrent inhibition. In addition, a separate stage (B) provided both excitatory and inhibitory background input to simulate individual variability of each neuron in cortex.
The input and background stages were modeled as spike generators without further processing. Each processing stage consisted of pyramidal cells (P) and fast-spiking inhibitory cells (FS). Both cell types received inputs from the P cells of the previous stage, and made local connections with both cells types within each stage.
Each stage contained 1024 pyramidal cells and each processing stage also contained 196 fast-spiking interneurons, approximating the cortical proportions of these different cell types (Markram et al., 2004). The time constants for P and FS cells were tuned to approximate the physiological properties of pyramidal cells and fast-spiking interneurons, respectively.
Cell Models
Input (B and I) cells were modeled as independent variable rate Poisson process spike generators with a time step of 100 μs.
Pyramidal (P) cells had a single somatic compartment with six attached dendritic compartments. The somatic compartment was based on the single compartment Hodgkin–Huxley type model (Golomb and Amitai, 1997), and adapted to include additional dendritic compartments. The membrane potential was determined by the membrane equation summing currents from different intrinsic currents through channels present in the membrane with synaptic and injected currents.
For the soma:
Cm = 1.5 μF/cm2.
Leak current:
gL = 0.20 mS/cm2, EL = −65 mV.
Fast sodium channels:


gNa = 53 mS/cm2, ENa = 55 mV, θm = −30.0 mV, σm = 9.5 mV, θh = −53.0 mV, σh = −7.0 mV, θht = −40.5 mV, σht = −6.0 mV.
Persistent sodium channels:
gNaP = 0.15 mS/cm2, ENa = 55 mV, θp = −40.0 mV, σm = 5.0 mV.
Delayed rectifier potassium channels:

gKDr = 6.6 mS/cm2, EK = −90 mV, θn = −30.0 mV, σn = 10.0 mV, θnt = −27.0 mV, σnt = −15.0 mV.
A-type potassium channels:

gKa = 4.6 mS/cm2, EK = −90 mV, θa = −50.0 mV, σa = 20.0 mV, θb = −80.0 mV, σb = 6.0 mV, τb = 15.0 ms.
Slow potassium channels:

gKs = 0.88 mS/cm2, EK = −90 mV, θz = −39.0 mV, σz = 5.0 mV, τb = 75.0 ms.
Synaptic currents:
EAMPA = 0 mV, EGABAA = −80 mV.
The dendrites were modeled analogously but only contained passive (leak) channels.
Fast-spiking cells show different properties including fast spikes, higher firing rates, lack of spike rate adaptation (Beierlein et al., 2003; Ma et al., 2006; Caputi et al., 2008) and were modeled as single compartments after the Hodgkin–Huxley type equations in a previous model (Wang and Buzsáki, 1996):
Cm = 1.5 μF/cm2.
Leak current:

gL = 0.40 mS/cm2, EL = −70 mV.
Fast sodium channels:

gNa = 140.0 mS/cm2, ENa = 55 mV.
Delayed rectifier potassium channels:

gKDr = 36.0 mS/cm2, EK = −90 mV.
Synaptic Dynamics
The model included two synapse types, excitatory AMPA synapses and inhibitory GABAA synapses. All synapses were modeled by kinetic models with two states representing the open and closed states of ion channels (Destexhe et al., 1994). The fraction of open channels for a synapse r increased with the rate constant α when neurotransmitter was present (T = 1 mM), and decreased with the dissociation rate β:
The total conductance g of a synapse was the product of its maximal conductance g and the fraction of open channels r. The rate constants for the different synapse types (Destexhe et al., 1994) were: AMPA synapses: α = 1.1 × 10⁶ M−1s−1, β = 190 s−1; GABAA: α = 0.53 × 10⁶ M−1s−1, β = 180 s−1.
Connectivity
Synaptic connections were made such that each post-synaptic cell received input from pre-synaptic cells in a local environment. For a given post-synaptic cell, the probability of a synaptic connection with a pre-synaptic cell was determined by a Gaussian probability distribution with a width of 20% of the total model extent.
All excitatory synapses are modeled as AMPA synapses. Fast-spiking cells made GABAA-ergic synapses onto the soma of pyramidal cells. The conductances within each stage were: gPP = 0.56, gPF = 5.0, gFF = 20.0, gF1P1 = 3.6, gF2P2 = 14.4 nS, and conductance values between stages were set to be: gBP(e) = 0.8, gBP(i) = 1.2, gBF(e) = 0.6, gBF(i) = 0.48, gIP1 = gP1P2 = 15.0, gIF1 = gP1F2 = 0.4 nS.
Inputs
B and I cells were modeled as variable rate Poisson spike generators. For each B cell, the mean firing rate was fixed at 40 Hz throughout the simulation. Each cell in the processing stages received a random subset of these spike trains, each connected to either excitatory or inhibitory synapses, to mimic random background fluctuations in neocortical cells. The firing rate of I cells was varied with the stimulus. At the stimulus time, their rate was determined by a Gaussian profile with amplitude 250 Hz and width 2 ms, and they were otherwise silent.
To model light-activated stimulation of fast-spiking cells, we added a strong excitatory synapse to X1 FS cells. The kinetics of these channels were similar to those of channelrhodopsin-2 (Nagel et al., 2003; Boyden et al., 2005; Ishizuka et al., 2006), and their activation was triggered with a 1 ms “light” pulse instead of neurotransmitter as for chemical synapses. For the results presented here, half of all FS cells were “light-activated”. While there is no direct evidence for the fraction of cells activated in Cardin et al., this number is consistent with observations in these and other channelrhodopsin-2-expressing animals. In a version of these simulations in which all FS cells are light-activated, qualitatively similar results were observed, indicating that the observed effects are not critically dependent on the choice of this parameter.
The delay between light and “sensory” input was defined as the time between the onset of the “light pulse” and the time of peak of the I cell Gaussian firing rate profile, i.e., the median spike time of the input population spike packet.
Simulation Environment and Global Parameters
All simulations were carried out using the cortical network simulator (CNS, Mutch et al., 2010) package written in Matlab (The Mathworks, Natick, MA, USA) and C, running on custom PCs with an Nvidia GeForce GTX285 or GTX480 GPU (EVGA, Brea, CA, USA). All differential equations were solved with the Crank–Nicolson method. The time step for intracellular and synaptic computations was 10 μs, inter-cellular spike-based communication was performed with a time step of 100 μs.
Analysis
Post-stimulus time histograms (PSTHs) were computed using a bin size of 2 ms. Total spike count was defined as the number of elicited spikes up to 50 ms after the stimulus. Synchrony was measured as the inter-quartile range of spikes times in the population during a single trial. Gain was defined as the ratio between the spike count in the target area and the spike count in the source area. Statistical significance of differences was assessed using an ANOVA with Dunnett’s test for comparisons between different phases or delays and the baseline condition, and t-tests for comparisons between only two conditions.
Results
To investigate the mechanism of timing-dependent modulation of sensory responses observed in Cardin et al. (2009), we generated a large multi-stage neural network consisting of an input stage (I) and two processing stages (X1 and X2) (Figure 1). Each processing stage was organized as a two-dimensional layer of excitatory neurons and inhibitory interneurons. The input stage consisted of 1024 variable rate Poisson spike generators in a 32 × 32 grid. The processing stages were identical, each a 32 × 32 grid of pyramidal cells (P) interspersed with a 14 × 14 grid of fast-spiking interneurons (FS), modeled as Hodgkin–Huxley style multi- and single-compartment cells, respectively. Within each stage, both cell types received inputs from both cell types and connectivity was local, i.e. for a given post-synaptic neuron, the connection probability for each potential pre-synaptic neuron fell off with a Gaussian profile with a sigma equal to 20% of the extent of the entire layer. Both cell types also received input from pyramidal cells of the previous layer. In addition, each cell received a random sequence of excitatory and inhibitory synaptic inputs (driven by a random subset of 40 out of 1024 Poisson spike trains for each cell) to capture variability between cortical cells. The synaptic weights were tuned to approximate basic properties of the anesthetized mouse primary somatosensory cortex in general and the results of Cardin et al. (2009) specifically. The latency from stimulus to X1 spike was 8–10 ms for most cells, matching in vivo latencies (Pinto et al., 2000), the difference of median spike times in X1 and X2 varied between 4 and 10 ms, depending on the number of spikes in X1. To model light-activated stimulation of fast-spiking cells, we added a strong excitatory synapse with activation kinetics paralleling those of channelrhodopsin-2, which were activated with a 1 ms “light” pulse (Nagel et al., 2003; Boyden et al., 2005; Ishizuka et al., 2006).
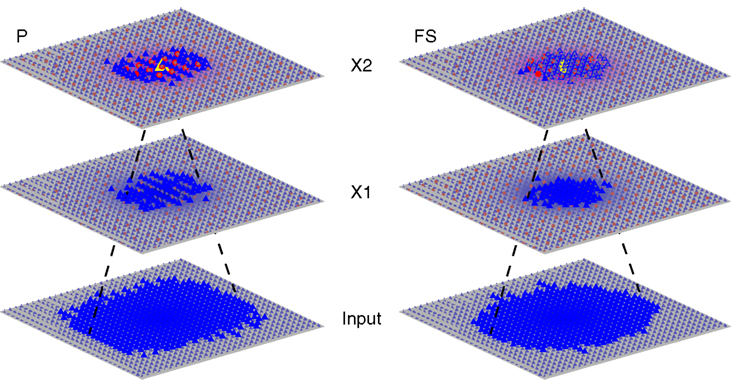
Figure 1. Model architecture and connectivity. Connectivity is shown for one pyramidal (P) cell (left) and one fast-spiking inhibitory (FS) cell (right) in X2 (marked in yellow). Blue triangles represent P cells, red circles represent F cells. Both cells types connect to both cells types locally within each stage and receive input from a pool of excitatory cells from the previous stage.
Local Effects of Synchronous Inhibition
We first replicated the experimental data and investigated the local effects of synchronized inhibition in the affected area. Dissociating the contributions of pre- and post-stimulus inhibition, we then determined the mechanism for these effects.
The impact of repetitive induced inhibition on sensory evoked responses
To replicate the in vivo results, we activated X1 FS cells at a frequency of 40 Hz and gave a brief feed-forward stimulus from the input layer at varying phases (in 2-ms steps) between two light pulses (Figure 2A). Consistent with the experimental data, we observed modulation of X1 P activity in response to the stimulus that depended on the precise timing between stimulus and induced inhibition (Figure 2B). Responses to stimuli close to the time of induced inhibition were almost completely suppressed, while stimuli approximately half a period after the last light pulse (12–16 ms) elicited a comparable number of spikes in X1 P (Figure 2C). Spike synchrony was enhanced overall during induced inhibition, however, stimuli during the first half-period led to the strongest increases in synchrony (Figure 2D).
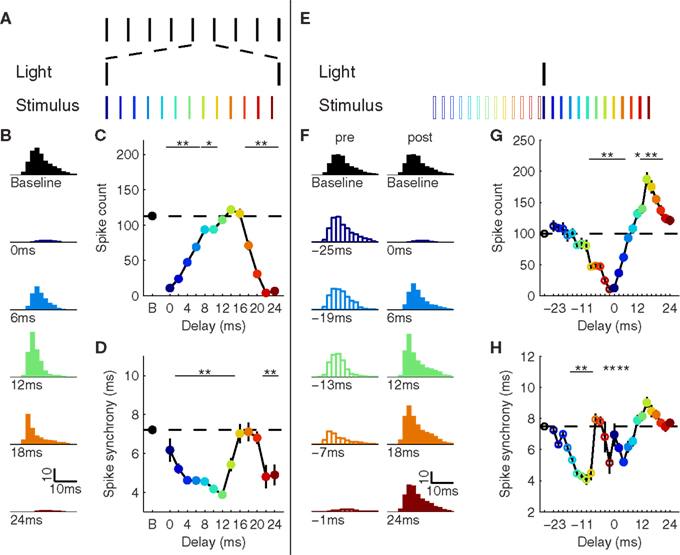
Figure 2. Timing-dependent impact of inhibition on sensory responses. (A) Stimulation paradigm for repetitive inhibition. A single sensory stimulus was given at different phases in between two light pulses embedded in a light train at 40 Hz. (B) Population X1 response at baseline (top) and different phases during repetitive inhibition. (C) Spike count for each phase of stimulation. Dashed line indicates baseline condition. (D) Spike synchrony, defined as inter-quartile range of spike times across the population (smaller numbers denote more synchrony). (E) Stimulation paradigm for single inhibition. A single sensory stimulus was given at different delays relative to a single light pulse. (F) Population X1 response at baseline (top) and different delays for a post-stimulus (left) and pre-stimulus (right) light pulse. (G) Spike count for each phase of stimulation. Filled circles correspond to pre-stimulus inhibition, open circles mark post-stimulus inhibition. (H) Spike synchrony. *p < 0.05, **p < 0.01; error bars, mean ± S.E.M.
Isolated effects of pre- and post-stimulus inhibition in X1
Each stimulus was preceded and followed by a pulse of inhibition, suggesting that the mechanism(s) for the observed changes in response packet size and shape resulted from a linear or non-linear combination of the earlier and later inhibitory inputs. To isolate the contributions of pre- and post-stimulus inhibition, we employed a second paradigm in which a single inhibition-inducing light pulse was paired with a stimulus at varying delays from 25 to 1 ms pre-stimulus and 0–24-ms post-stimulus in 2-ms steps (Figure 2E). These values were chosen such that for each delay in the pre-stimulus inhibition condition there was a corresponding value in the post-stimulus inhibition condition, effectively mapping onto the same phase in the repetitive inhibition experiment.
Pre- and post-stimulus inhibition conditions showed two distinct and opposite effects on the size and shape of the response packet in X1 (Figure 2F). Post-stimulus inhibition 25 ms after the stimulus did not have an appreciable effect on the response. Decreasing the stimulus latency preceding inhibition led to a gradual decrease in the number of elicited spikes. Delays of 10–14 ms only suppressed the latter part of the response packet in X1, leaving the first part virtually unchanged. This sculpting of evoked spikes led to significant changes in synchrony (p < 0.01), but no significant decrease in spike count (Figures 2G,H). For shorter delays, inhibition reached the P cells early enough to cause significant suppression (p < 0.01). Inhibition immediately before the stimulus (16–24 ms) led to almost complete suppression of the X1 response (p < 0.01), similar to inhibition immediately afterward (0–4 ms). As the post-stimulus delay was increased to 12–20 ms, the response became elevated throughout the response period (p < 0.01). This response potentiation peaked at a delay of 14 ms and then decreased again, returning to the baseline response as the delay was further increased beyond 20 ms (Figures 2F–H).
Prediction of the impact of repetitive inhibition from isolated inhibition
We hypothesized that the impact of repetitive inhibition could be explained by linear combination of the effects of pre- and post-stimulus inhibition. To test this prediction, we computed a modulation kernel for each delay from the single inhibition responses by normalizing the corresponding PSTH by the baseline PSTH. For a given kernel, the value in each bin was the ratio between the response during the delay condition and the response during the baseline condition, representing the impact of this condition on that particular time bin. If the number of spikes was unchanged, the kernel value was 1, if all spikes were suppressed, the value was 0. Because the delays were chosen to map onto the same phase in the repetitive inhibition case, the equivalent kernel representing the combined effect of pre- and post-stimulus inhibition can be derived by simply multiplying the two corresponding kernels.
Applying these combined kernels from each phase of the repetitive inhibition to the baseline response predicted the size and shape of the actual responses (Figure 3A). Thus, the effect of repetitive inhibition on a sensory response in X1 was captured by the combined effect of the inhibition immediately preceding and following the stimulus. During the middle phases, the pre-stimulation inhibition caused an overall boost across the response packet and the post-stimulus inhibition suppressed the late spikes, effectively creating a more synchronous packet of approximately equal size compared to the baseline response. Given that our initial simulations showed the same local effects on rate and synchrony in X1 as the experimental data (Cardin et al., 2009), these results suggest that further mechanisms, beyond the impact of repeated events of inhibition, need not be invoked to explain the “gamma” dependent gain observed.
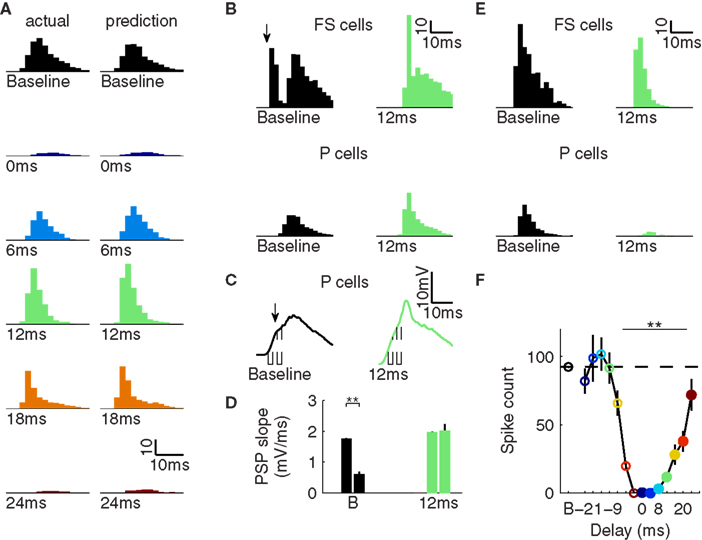
Figure 3. Mechanism of timing-dependent gain modulation. (A) Left: actual population X1 responses during repetitive inhibition (re-plotted from Figure 2B). Right: predicted population X1 responses combining independent effects of pre- and post-stimulus inhibition on the spike response packet. (B) X1 population responses for FS cells (top) and P cells (bottom) for the baseline (left) and 12-ms delay (right) condition. Arrow in upper left panel indicates the fast FS population spike during baseline missing for the delay condition. (C) Average membrane potential of X1 P cells. Dashed lines indicate periods during which slope is measured. Arrow indicates impact of IPSP induced by FS population spike indicated in B. (D) PSP slope for both times indicated in C for both conditions. (E) Same as (B), but for a model variant without FS-FS inhibition. (F) Spike count dependent on delay for model without FS-FS inhibition (analogous to Figure 2C). *p < 0.05, **p < 0.01; error bars, mean ± S.E.M.
Biophysical mechanism of response elevation
While suppression by post-stimulus inhibition has a straightforward explanation, the cause of increased spiking in response to a stimulus approximately 10 ms after light stimulation is not intuitive. To understand the mechanism underlying this phenomenon, we investigated the sub- and supra-threshold responses of P and FS cells in the network. Under baseline conditions, due to their strong inputs and fast membrane kinetics, FS cells fired a population spike at short latency after the onset of the incoming sensory input while the incoming excitatory post-synaptic potential (PSP) in P cells was still rising (Figure 3B). This population spike caused an inhibitory PSP in the P cells that reduced the slope and amplitude of the resulting compound PSP (Figure 3C). Comparing the early and late phase of the rising compound PSP in X1 P, the IPSP reduced the slope by more than 60% (Figure 3D, left). As soon as P cells did fire, strong recurrent connections from P onto FS cells caused a secondary FS response, restoring the balance between excitation and inhibition.
In the pre-stimulus inhibition condition, light-activating FS cells in the model also caused a strong IPSP in FS cells. The resulting hyper-polarization and increased conductance in these cells suppressed their initial sensory driven response, causing the EPSP in the P cells to proceed without interference from an early IPSP (Figures 3B–D, right). Without the contribution of perisomatic inhibitory synapses, a more depolarized membrane potential and higher PSP slope were observed, both of which predict a higher spike probability (Azouz and Gray, 2000). Because of the earlier IPSP caused by the light-induced FS activation, the starting membrane potential for P cells was slightly more hyperpolarized compared to baseline, causing an increase in latency of spike onset and stronger synchronization, also consistent with experimental data (see Figure 4, Cardin et al., 2009). As soon as P cell spiking started, FS cell spiking increased, similar to the baseline case. These results provide a biophysical mechanism for the modulation of size and shape of the X1 population response due to induced FS-to-FS inhibition.
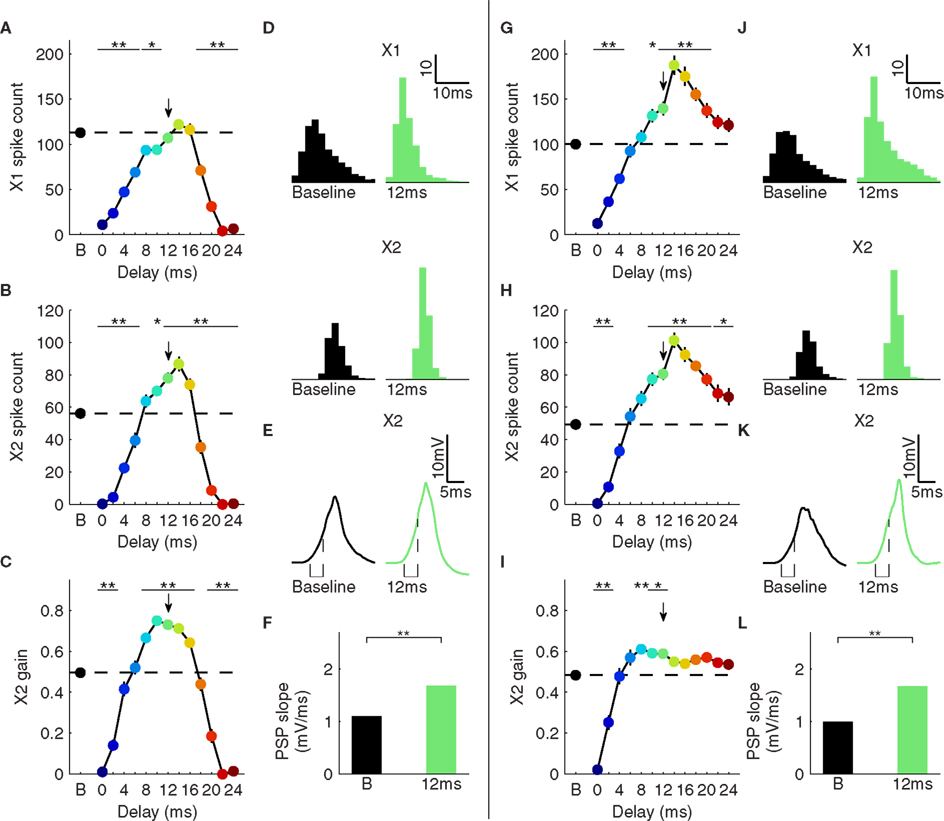
Figure 4. Relationship between X1 spike counts and X2 spike counts and gain. (A) X1 spike counts for repetitive inhibition. (B) X2 spike counts. (C) X2 gain. Arrows in A–C mark the 12-ms delay condition. (D) X2 population responses for FS cells (top) and P cells (bottom) for the baseline (left) and 12-ms delay (right) condition. (E) Average membrane potential of X2 P cells. Dashed lines indicate periods during which slope is measured. (F) PSP slope indicated time in E for both conditions. (G–L) Same as (A–F), but for single post-stimulus inhibition. *p < 0.05, **p < 0.01; error bars, mean ± S.E.M.
To test whether this mutual inhibition mechanism is necessary for the response enhancement, we created a model variant lacking the underlying inhibitory FS–FS synapses. As expected from the lack of mutual FS inhibition, early feed-forward driven FS spikes were not affected by light stimulation (Figure 3E). The P cell spiking was strongly reduced, consistent with the hyperpolarizing effect of the earlier light-induced IPSP in combination with unchanged feed-forward inhibition. Subsequently, late FS spiking driven by P activity was reduced, as well. The spike count for post-stimulus inhibition conditions in this model variant was similar to the original model (Figure 3F, compare to Figure 2G). However, almost all pre-stimulus inhibition conditions showed significant suppression, and the enhanced spike count for several pre-stimulus inhibition conditions found in the original model was completely abolished, supporting the crucial role of mutual FS inhibition for this enhancement mechanism.
Impact of the Response Packet Shape on Downstream Efficacy
We investigated the impact of these changes in the X1 response size and shape on the efficacy in driving responses in a downstream target area (X2). As expected, the number of spikes elicited in X2 in the repetitive inhibition paradigm closely followed the spike count in X1 (Figures 4A,B). Phases close to an inhibitory pulse (0–4 and 20–24 ms) exhibited decreased gains compared to baseline (p < 0.01), explained by the much lower X1 firing rates under these conditions (Figure 4C, p < 0.01). Intermediate delays (12–16 ms), however, while matching the X1 spike count of the baseline condition, had significantly higher X2 spike counts (p < 0.01), resulting in a significantly higher X2 gain (p < 0.01).
In contrast to X1 spike count, which did not consistently exceed baseline levels, X1 spike synchrony values were significantly changed during the intermediate phases (2–14 ms, p < 0.01), suggesting this shift was causal in the increased gain. The sub- and supra-threshold responses of both cell types in X2 support such a mechanism. FS and P cells in X2 exhibited similar response packet shapes during baseline and delay conditions, but elevated counts during the delay condition (Figure 4D, left). The average P cell membrane potential revealed a 50% higher PSP slope (Figures 4E,F). This steeper slope was driven by the larger number of coincident X1 spikes during the early phase of the X1 spike packet. Due to this increased slope, more cells were able to fire spikes before the IPSP from the FS cells started to suppress the P cells, leading to a stronger and more synchronous response.
Impact of Response Packet Shape on Downstream Efficiency
During the single pulse post-stimulus inhibition condition, X2 gain was only weakly modulated for all delays, despite the fact that at least as many spikes were driven as in the baseline response (Figures 4G–I). Comparing the 12-ms delay response for the single pulse inhibition to the corresponding latency from the repetitive inhibition condition reveals that FS and P cells in X2 exhibited sub- and supra-threshold responses (Figures 4J–L) that are nearly equivalent to the repetitive inhibition condition, despite different X1 responses.
To understand the difference in X2 gain despite the virtually equivalent spike count in X2 (78 vs. 72 spikes, Figure 5A), we analyzed the temporal structure of the two X1 response packets. Compared to the repetitive inhibition condition, the X1 response in the single post-stimulus inhibition condition was similar during the first 10 ms, but contained more late spikes (158 vs. 109 spikes). The single inhibition X1 response contained a large number of spikes during and after the conclusion of most X2 firing. The impact of these late X1 spikes on X2 was reduced by an IPSP from X2 FS cells.
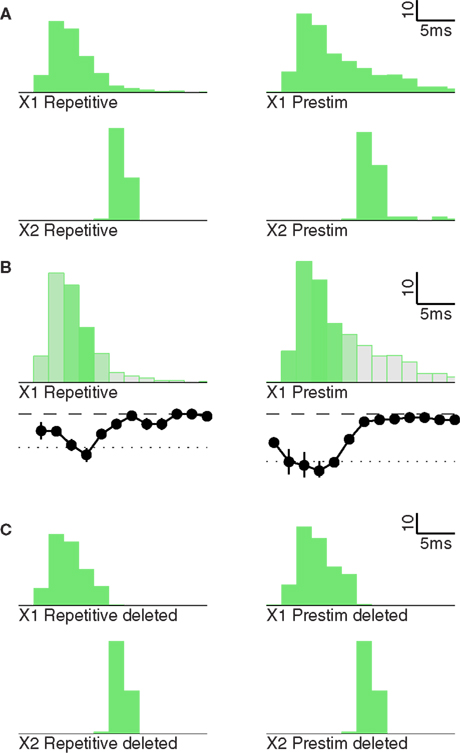
Figure 5. X2 gain depends on X1 packet shape. (A) Population responses for X1 (top) and X2 (bottom) for repetitive (left) and single post-stimulus inhibition (right). (B) Impact of individual spikes of the X1 response. Shading and the curve below the PSTH indicate the X2 response after deletion of spikes in the corresponding bin. (C) Same as (A), but after deleting all spikes that did not strongly contribute to the X2 response.
To quantify the impact of spikes during different parts of the X1 response packet, we performed simulations that exactly replicated the conditions used to produce the responses in Figure 4A, with the only difference being that a 10th of X1 spikes were deleted. In each run, all the spikes from a different one of the 10 deciles were deleted, and we determined the size of the X2 response for each of these deletions. This analysis revealed that deletion of spikes during the first 10 ms of the X1 response had the strongest impact on X2 spike count. In contrast, spikes later than 10 ms after the response onset had almost no impact (Figure 5B). To confirm this result, we performed another deletion experiment in which we erased all spikes 10 ms or later after response onset. Indeed, now X1 responses were comparable in shape in both conditions, and X2 responses were identical (Figure 5C).
These results revealed that the precise temporal structure of a spike packet not only influenced its efficacy in driving X2 responses, but also its efficiency in eliciting downstream responses, both determinants of gain. Beyond a specific window determined by the timing of inhibition in the target region, X1 spikes had no net gain and were essentially extraneous to signal relay.
Discussion
We will first discuss our results on the local effects of repetitive inhibition, followed by the resulting changes in efficacy and efficiency. We conclude with a discussion of how our results relate to intrinsically generated gamma.
Local Effects of Repetitive Inhibition
We have identified opposing contributions of pre- and post-stimulus inhibition to the enhancement of spike count and synchrony for the optimal phase delay between stimulus and inhibition. While post-stimulus inhibition cuts off late spikes, and thus increases synchrony of the population response, pre-stimulus inhibition causes an overall increase in spiking, particularly during the early phase of the response, by FS-to-FS inhibition. In combination, these effects lead to the observed strong increase in synchrony while maintaining or only moderately increasing spike count. This finding is in alignment with several previous experimental and computational studies reporting similar effects under conditions of natural, intrinsically generated gamma oscillations in vitro, in vivo, and in silico (Burchell et al., 1998; Fries et al., 2001, 2008; Pouille and Scanziani, 2001; Börgers et al., 2005; Womelsdorf et al., 2006).
The computational benefit of gamma has been described as synchronizing spikes within a local population without changing the overall number of spikes, effectively creating a sequence of impactful spike packets interspersed with brief periods of relative silence, in contrast to a continuous stream of spikes without temporal structure. This view implies that each gamma cycle can be viewed as a separate “window of opportunity” (Pinto et al., 2000; Wehr and Zador, 2003; Hasenstaub et al., 2005; Wilent and Contreras, 2005), similar to the mechanisms controlling the transient imbalance of excitation and inhibition in response to a brief sensory stimulus. Mechanistic explanations of gamma-related redistribution of spikes have focused on the effect of the rhythmic inhibitory PSPs in pyramidal cells suppressing spikes or delaying spiking in response to a sustained stimulus, leading to a compression of spike times into a shorter window and thus increased synchrony (Whittington et al., 2000; Börgers and Kopell, 2003; Tiesinga and Sejnowski, 2009). Our results indicate that the mutual suppression of FS cells could also play an important role in modulating the gain in the local network, regardless of whether gamma is created by a PING or ING mechanism (Whittington et al., 2000; Tiesinga and Sejnowski, 2009). This finding is consistent with the result that a transient increase in excitation is accompanied by a synchronized decrease in inhibition in cat V1 neurons (Azouz and Gray, 2008).
Spike Synchrony and Downstream Efficacy
We found that the synchrony of spikes in a population packet, particularly during the onset of a response, had a profound impact on the size of the downstream response, in agreement with previous computational and experimental studies (König et al., 1996; Azouz and Gray, 2000, 2003; Pinto et al., 2000; Börgers and Kopell, 2005; Bruno and Sakmann, 2006; Womelsdorf et al., 2007; Wang et al., 2010). Taking into account the correlation between attention and gamma band activity (Fries et al., 2001, 2008; Börgers et al., 2005, 2008; Womelsdorf et al., 2006; Roy et al., 2007), these findings support the view that attention might act by increasing synchrony among local ensembles of neurons and thus selectively enhancing their impact on a target area, effectively increasing signal-to-noise without large increases in average spike rate (Steinmetz et al., 2000; Fries et al., 2001, 2008; Buia and Tiesinga, 2006).
Packet Shape and Downstream Efficiency
In contrast to the efficacy of a spike packet, which was mostly determined by the early phase, its efficiency was determined by firing in the late phase, i.e. its length. If a packet was too long, late spikes arrived at the downstream circuit after inhibition had set in and thus had diminished impact, decreasing overall packet gain. Thus, a key benefit of repetitive inhibition, as in the case of gamma, is optimal packet length controlled by post-stimulus inhibition, determined by the time between two inhibitory events.
Given the dependence of downstream inhibition on the strength of activity in a pre-synaptic source, our results imply a close connection between early efficacy and the most efficient packet size. To maintain maximal efficiency, packet length needs to be dynamically adjusted to the spike count at the beginning of the packet. If activity is low in the pre-synaptic input, inhibition will also be more weakly recruited, and a longer packet length will show greater efficiency. In contrast, in the conditions of the current experiment, narrower temporal windows are optimal. This prediction is consistent with several theoretical and experimental studies showing excitatory integration during weak stimulus presentation, and stronger relative inhibition during strong drive (Somers et al., 1998; Moore et al., 1999).
While there is considerable debate over the contribution of different processes to the total energy consumption of the brain (Attwell and Iadecola, 2002), spiking and evoked pre- and post-synaptic activity are believed to account for a significant fraction of total metabolic demand. It has been argued (Laughlin and Sejnowski, 2003) that energy consumption constrains neural activity and that the brain has developed mechanisms to maintain the optimal balance between transmitted information and energetic cost. Thus it is possible that one of the functions of gamma, and the redundancy in mechanisms leading to its emergence, is to sustain this efficiency across large networks by optimizing spike timing.
Implications for Intrinsically Generated Gamma
Although our ultimate goal is to understand the mechanism and function of gamma in natural circuits, the premises of our study deviate from intrinsic in vivo gamma in two crucial ways.
First, and maybe most importantly, repetitive inhibition was induced artificially in our optogenetic study and in this model, in contrast to intrinsically generated inhibition during states of gamma activity. This manipulation allowed us to dissociate excitation and inhibition temporally, to understand the mechanisms underlying the link between them during natural gamma activity. A consequence of the independent control of inhibitory activity is the disruption of self-regulatory and adaptive mechanisms controlling the interplay between excitation and inhibition. During natural gamma, the spatial and temporal distribution of inhibitory activity is much less rigid and more adaptive to the contextual network activity. Considering the link between stimulus strength or discrimination performance and gamma frequency (Edden et al., 2009), it is possible that one of the functions of intrinsically generated gamma activity is to ensure the match between output packet shape and timing of inhibition in the target area that we have found to be necessary for optimally efficient transmission.
Second, we used punctate stimuli instead of more natural/naturalistic stimuli that are sustained for several hundreds of milliseconds. Further, the impact of this stimulus was modeled as a discrete input with relatively brief temporal consequences, in contrast to the sustained activity patterns that can be observed following some punctate stimuli (Metherate and Cruikshank, 1999). Following the view that gamma essentially creates a sequence of windows of opportunity, our results can be interpreted as describing one of these windows embedded in an ongoing sequence. The extent to which this prediction holds, and where the effects and mechanisms applicable during ongoing ensemble activity deviate from our findings, will need to be tested in future studies, both in silico and in vivo. Due to the availability of a wealth of optogenetic tools (Chow et al., 2010; Gradinaru et al., 2010), the majority of predictions we have made can be feasibly tested in the near future.
Using a detailed large-scale biophysical model, we have demonstrated a mechanism for sensory response gain modulation. Precisely timed inhibition in a given neocortical area altered the size and shape of its population spike packet, and these differences impacted the efficacy and efficiency of transmission of this signal to a downstream neocortical area. In a subset of conditions, local synchronized inhibition increased the gain of transmission, allowing fewer spikes to have a larger impact. This modulation in gain was limited to spiking added in an initial temporal window, the addition of later spikes did not impact downstream firing. Thus, gamma-range inhibition changes the shape of the local response packet to optimize both its efficacy and its efficiency.
Acknowledgments
We would like to thank Jessica Cardin, Jason Ritt, Dorea Vierling-Claassen, and Itamar Kahn for insightful discussions, as well as Jim Mutch for invaluable help with CNS. UK was supported by a grant from the McGovern Institute of Brain Research. Joshua H. Siegle was supported by an NDSEG Fellowship. Dominique L. Pritchett was supported by an NIH Fellowship. Christopher I. Moore was supported by NIH grant 5-R01-NS045130-06.
Conflict of Interest Statement
The authors declare that the research was conducted in the absence of any commercial or financial relationships that could be construed as a potential conflict of interest.
References
Atallah, B. V., and Scanziani, M. (2009). Instantaneous modulation of gamma oscillation frequency by balancing excitation with inhibition. Neuron 62, 566–577.
Attwell, D., and Iadecola, C. (2002). The neural basis of functional brain imaging signals. Trends Neurosci. 25, 621–625.
Azouz, R., and Gray, C. M. (2000). Dynamic spike threshold reveals a mechanism for synaptic coincidence detection in cortical neurons in vivo. Proc. Natl. Acad. Sci. U.S.A. 97, 8110–8115.
Azouz, R., and Gray, C. M. (2003). Adaptive coincidence detection and dynamic gain control in visual cortical neurons in vivo. Neuron 37, 513–523.
Azouz, R., and Gray, C. M. (2008). Stimulus-selective spiking is driven by the relative timing of synchronous excitation and disinhibition in cat striate neurons in vivo. Eur. J. Neurosci. 28, 1286–1300.
Bartos, M., Vida, I., and Jonas, P. (2007). Synaptic mechanisms of synchronized gamma oscillations in inhibitory interneuron networks. Nat. Rev. Neurosci. 8, 45–56.
Beierlein, M., Gibson, J. R., and Connors, B. W. (2003). Two dynamically distinct inhibitory networks in layer 4 of the neocortex. J. Neurophysiol. 90, 2987–3000.
Börgers, C., Epstein, S., and Kopell, N. J. (2005). Background gamma rhythmicity and attention in cortical local circuits: a computational study. Proc. Natl. Acad. Sci. U.S.A. 102, 7002–7007.
Börgers, C., Epstein, S., and Kopell, N. J. (2008). Gamma oscillations mediate stimulus competition and attentional selection in a cortical network model. Proc. Natl. Acad. Sci. U.S.A. 105, 18023–18028.
Börgers, C., and Kopell, N. J. (2003). Synchronization in networks of excitatory and inhibitory neurons with sparse, random connectivity. Neural. Comput. 15, 509–538.
Börgers, C., and Kopell, N. J. (2005). Effects of noisy drive on rhythms in networks of excitatory and inhibitory neurons. Neural Comput. 17, 557–608.
Börgers, C., and Kopell, N. J. (2008). Gamma oscillations and stimulus selection. Neural Comput. 20, 383–414.
Boyden, E. S., Zhang, F., Bamberg, E., Nagel, G., and Deisseroth, K. (2005). Millisecond-timescale, genetically targeted optical control of neural activity. Nat. Neurosci. 8, 1263–1268.
Bruno, R. M., and Sakmann, B. (2006). Cortex is driven by weak but synchronously active thalamocortical synapses. Science 312, 1622–1627.
Buia, C. I., and Tiesinga, P. H. (2006). Attentional modulation of firing rate and synchrony in a model cortical network. J. Comput. Neurosci. 20, 247–264.
Burchell, T. R., Faulkner, H. J., and Whittington, M. A. (1998). Gamma frequency oscillations gate temporally coded afferent inputs in the rat hippocampal slice. Neurosci. Lett. 255, 151–154.
Caputi, A., Rozov, A., Blatow, M., and Monyer, H. (2008). Two calretinin-positive GABAergic cell types in layer 2/3 of the mouse neocortex provide different forms of inhibition. Cereb. Cortex 19, 1345–1359.
Cardin, J. A., Carlén, M., Meletis, K., Knoblich, U., Zhang, F., Deisseroth, K., Tsai, L.-H., and Moore, C. I. (2009). Driving fast-spiking cells induces gamma rhythm and controls sensory responses. Nature 459, 663–667.
Chalk, M., Herrero, J. L., Gieselmann, M. A., Delicato, L. S., Gotthardt, S., and Thiele, A. (2010). Attention reduces stimulus-driven gamma frequency oscillations and spike field coherence in V1. Neuron 66, 114–125.
Chow, B. Y., Han, X., Dobry, A. S., Qian, X., Chuong, A. S., Li, M., Henninger, M. A., Belfort, G. M., Lin, Y., Monahan, P. E., and Boyden, E. S. (2010). High-performance genetically targetable optical neural silencing by light-driven proton pumps. Nature 463, 98–102.
Destexhe, A., Mainen, Z. F., and Sejnowski, T. J. (1994). Synthesis of models for excitable membranes, synaptic transmission and neuromodulation using a common kinetic formalism. J. Comput. Neurosci. 1, 195–230.
Edden, R. A. E., Muthukumaraswamy, S. D., Freeman, T. C. A., and Singh, K. D. (2009). Orientation discrimination performance is predicted by GABA concentration and gamma oscillation frequency in human primary visual cortex. J. Neurosci. 29, 15721–15726.
Engel, A. K., König, P., Kreiter, A. K., and Singer, W. (1991). Interhemispheric synchronization of oscillatory neuronal responses in cat visual cortex. Science 252, 1177–1179.
Fisahn, A., Pike, F. G., Buhl, E. H., and Paulsen, O. (1998). Cholinergic induction of network oscillations at 40 Hz in the hippocampus in vitro. Nature 394, 186–189.
Freeman, W. J. (1968). Relations between unit activity and evoked potentials in prepyriform cortex of cats. J. Neurophysiol. 31, 337–348.
Fries, P. (2009). Neuronal gamma-band synchronization as a fundamental process in cortical computation. Annu. Rev. Neurosci. 32, 209–224.
Fries, P., Reynolds, J. H., Rorie, A. E., and Desimone, R. (2001). Modulation of oscillatory neuronal synchronization by selective visual attention. Science 291, 1560–1563.
Fries, P., Womelsdorf, T., Oostenveld, R., and Desimone, R. (2008). The effects of visual stimulation and selective visual attention on rhythmic neuronal synchronization in macaque area V4. J. Neurosci. 28, 4823–4835.
Galán, R. F., Fourcaud-Trocmé, N., Ermentrout, G. B., and Urban, N. N. (2006). Correlation-induced synchronization of oscillations in olfactory bulb neurons. J. Neurosci. 26, 3646–3655.
Golomb, D., and Amitai, Y. (1997). Propagating neuronal discharges in neocortical slices: computational and experimental study. J. Neurophysiol. 78, 1199–1211.
Gradinaru, V., Zhang, F., Ramakrishnan, C., Mattis, J., Prakash, N., Diester, I., Goshen, I., Thompson, K. R., and Deisseroth, K. (2010). Molecular and cellular approaches for diversifying and extending optogenetics. Cell 141, 154–165.
Gray, C. M., and Singer, W. (1989). Stimulus-specific neuronal oscillations in orientation columns of cat visual cortex. Proc. Natl. Acad. Sci. U.S.A. 86, 1698–1702.
Gregoriou, G. G., Gotts, S. J., Zhou, H.-H., and Desimone, R. (2009). High-frequency, long-range coupling between prefrontal and visual cortex during attention. Science 324, 1207–1210.
Gruber, T., Müller, M. M., Keil, A., and Elbert, T. (1999). Selective visual-spatial attention alters induced gamma band responses in the human EEG. Clin. Neurophysiol. 110, 2074–2085.
Hasenstaub, A. R., Shu, Y., Haider, B., Kraushaar, U., Duque, A., and McCormick, D. A. (2005). Inhibitory postsynaptic potentials carry synchronized frequency information in active cortical networks. Neuron 47, 423–435.
Ishizuka, T., Kakuda, M., Araki, R., and Yawo, H. (2006). Kinetic evaluation of photosensitivity in genetically engineered neurons expressing green algae light-gated channels. Neurosci. Res. 54, 85–94.
Jensen, O., Kaiser, J., and Lachaux, J.-P. (2007). Human gamma-frequency oscillations associated with attention and memory. Trends Neurosci. 30, 317–324.
König, P., Engel, A. K., and Singer, W. (1996). Integrator or coincidence detector? The role of the cortical neuron revisited. Trends Neurosci. 19, 130–137.
Laughlin, S. B., and Sejnowski, T. J. (2003). Communication in neuronal networks. Science 301, 1870–1874.
Ma, Y., Hu, H., Berrebi, A. S., Mathers, P. H., and Agmon, A. (2006). Distinct subtypes of somatostatin-containing neocortical interneurons revealed in transgenic mice. J. Neurosci. 26, 5069–5082.
Maldonado, P. E., Friedman-Hill, S., and Gray, C. M. (2000). Dynamics of striate cortical activity in the alert macaque: II. Fast time scale synchronization. Cereb. Cortex 10, 1117–1131.
Maloney, K. J., Cape, E. G., Gotman, J., and Jones, B. E. (1997). High-frequency gamma electroencephalogram activity in association with sleep-wake states and spontaneous behaviors in the rat. Neuroscience 76, 541–555.
Markram, H., Toledo-Rodriguez, M., Wang, Y., Gupta, A., Silberberg, G., and Wu, C. (2004). Interneurons of the neocortical inhibitory system. Nat. Rev. Neurosci. 5, 793–807.
Metherate, R., and Cruikshank, S. J. (1999). Thalamocortical inputs trigger a propagating envelope of gamma-band activity in auditory cortex in vitro. Exp. Brain Res. 126, 160–174.
Moore, C. I., Nelson, S. B., and Sur, M. (1999). Dynamics of neuronal processing in rat somatosensory cortex. Trends Neurosci. 22, 513–520.
Mutch, J., Knoblich, U., and Poggio, T. (2010). CNS: a GPU-based framework for simulating cortically-organized networks. Tech. Rep. MIT-CSAIL-TR-2010-013/CBCL-286.
Nagel, G., Szellas, T., Huhn, W., Kateriya, S., Adeishvili, N., Berthold, P., Ollig, D., Hegemann, P., and Bamberg, E. (2003). Channelrhodopsin-2, a directly light-gated cation-selective membrane channel. Proc. Natl. Acad. Sci. U.S.A. 100, 13940–13945.
Nase, G., Singer, W., Monyer, H., and Engel, A. K. (2003). Features of neuronal synchrony in mouse visual cortex. J. Neurophysiol. 90, 1115–1123.
Paik, S.-B., Kumar, T., and Glaser, D. A. (2009). Spontaneous local gamma oscillation selectively enhances neural network responsiveness. PLoS Comput. Biol. 5: 3. doi:10.1371/journal.pcbi.1000342.
Pinto, D. J., Brumberg, J. C., and Simons, D. J. (2000). Circuit dynamics and coding strategies in rodent somatosensory cortex. J. Neurophysiol. 83, 1158–1166.
Pouille, F., and Scanziani, M. (2001). Enforcement of temporal fidelity in pyramidal cells by somatic feed-forward inhibition. Science 293, 1159–1163.
Ribary, U., Ioannides, A. A., Singh, K. D., Hasson, R., Bolton, J. P., Lado, F., Mogilner, A., and Llinas, R. R. (1991). Magnetic field tomography of coherent thalamocortical 40-Hz oscillations in humans. Proc. Natl. Acad. Sci. U.S.A. 88, 11037–11041.
Roy, A., Steinmetz, P. N., Hsiao, S. S., Johnson, K. O., and Niebur, E. (2007). Synchrony: a neural correlate of somatosensory attention. J. Neurophysiol. 98, 1645–1661.
Somers, D. C., Todorov, E. V., Siapas, A. G., Toth, L. J., Kim, D.-S., and Sur, M. (1998). A local circuit approach to understanding integration of long-range inputs in primary visual cortex. Cereb. Cortex 8, 204–217.
Steinmetz, P. N., Roy, A., Fitzgerald, P. J., Hsiao, S. S., Johnson, K. O., and Niebur, E. (2000). Attention modulates synchronized neuronal firing in primate somatosensory cortex. Nature 404, 187–190.
Tallon-Baudry, C., and Bertrand, O. (1999). Oscillatory gamma activity in humans and its role in object representation. Trends Cogn. Sci. (Regul. Ed.) 3, 151–162.
Tallon-Baudry, C., Bertrand, O., Delpuech, C., and Permier, J. (1997). Oscillatory gamma-band (30-70 Hz) activity induced by a visual search task in humans. J. Neurosci. 17, 722–734.
Tiesinga, P. H., and Sejnowski, T. J. (2009). Cortical enlightenment: are attentional gamma oscillations driven by ING or PING. Neuron 63, 727–732.
Traub, R. D., Contreras, D., Cunningham, M. O., Murray, H., LeBeau, F. E. N., Roopun, A. K., Bibbig, A., Wilent, W. B., Higley, M. J., and Whittington, M. A. (2005). Single-column thalamocortical network model exhibiting gamma oscillations, sleep spindles, and epileptogenic bursts. J. Neurophysiol. 93, 2194–2232.
Wang, H.-P., Spencer, D., Fellous, J.-M., and Sejnowski, T. J. (2010). Synchrony of thalamocortical inputs maximizes cortical reliability. Science 328, 106–109.
Wang, X.-J., and Buzsáki, G. (1996). Gamma oscillation by synaptic inhibition in a hippocampal interneuronal network model. J. Neurosci. 16, 6402–6413.
Wehr, M., and Zador, A. M. (2003). Balanced inhibition underlies tuning and sharpens spike timing in auditory cortex. Nature 426, 442–446.
Whittington, M. A., Traub, R. D., Kopell, N. J., Ermentrout, G. B., and Buhl, E. H. (2000). Inhibition-based rhythms: experimental and mathematical observations on network dynamics. Int. J. Psychophysiol. 38, 315–336.
Wilent, W. B., and Contreras, D. (2005). Dynamics of excitation and inhibition underlying stimulus selectivity in rat somatosensory cortex. Nat. Neurosci. 8, 1364–1370.
Womelsdorf, T., Fries, P., Mitra, P. P., and Desimone, R. (2006). Gamma-band synchronization in visual cortex predicts speed of change detection. Nature 439, 733–736.
Keywords: gamma, gain, inhibition, synchrony, model, cortex, sensory
Citation: Knoblich U, Siegle JH, Pritchett DL and Moore CI (2010) What do we gain from gamma? Local dynamic gain modulation drives enhanced efficacy and efficiency of signal transmission. Front. Hum. Neurosci. 4:185. doi: 10.3389/fnhum.2010.00185
Received: 21 June 2010;
Paper pending published: 21 July 2010;
Accepted: 14 September 2010;
Published online: 21 October 2010.
Edited by:
Thilo Womelsdorf, Robarts Research Institute London, CanadaCopyright: © 2010 Knoblich, Siegle, Pritchett and Moore. This is an open-access article subject to an exclusive license agreement between the authors and the Frontiers Research Foundation, which permits unrestricted use, distribution, and reproduction in any medium, provided the original authors and source are credited.
*Correspondence: Christopher I. Moore, Massachusetts Institute of Technology, 43 Vassar Street, Building 46-2171, Cambridge, MA 02139, USA. e-mail:Y2ltQG1pdC5lZHU=